THE JOINT ROLE OF GEOMETRY AND ILLUMINATION ON MATERIAL RECOGNITION - MPG.PURE
←
→
Page content transcription
If your browser does not render page correctly, please read the page content below
Journal of Vision (2021) 21(2):2, 1–18                                                                                                                            1

          The joint role of geometry and illumination on material
          recognition
          Manuel Lagunas                                                                   Universidad de Zaragoza, I3A, Zaragoza, Spain

                                                                               Universidad de Zaragoza, I3A, Max Planck Institute for
          Ana Serrano                                                                                   Informatics, Zaragoza, Spain

          Diego Gutierrez                                                                  Universidad de Zaragoza, I3A, Zaragoza, Spain

          Belen Masia                                                                      Universidad de Zaragoza, I3A, Zaragoza, Spain

          Observing and recognizing materials is a fundamental                                     by briefly looking at them. Although this is almost
          part of our daily life. Under typical viewing conditions,                                an effortless process, it is not a trivial task. The
          we are capable of effortlessly identifying the objects                                    image that is input to our visual system results from
          that surround us and recognizing the materials they are                                  a complex combination of the surface geometry, the
          made of. Nevertheless, understanding the underlying                                      reflectance of the material, the distribution of lights in
          perceptual processes that take place to accurately                                       the environment, and the observer’s point of view. To
          discern the visual properties of an object is a                                          recognize the material of a surface while being invariant
          long-standing problem. In this work, we perform a                                        to other factors of the scene, our visual system carries
          comprehensive and systematic analysis of how the                                         out an underlying perceptual process that is not yet
          interplay of geometry, illumination, and their spatial                                   fully understood (Adelson, 2000; Dror et al., 2001a;
          frequencies affects human performance on material                                         Fleming et al., 2001).
          recognition tasks. We carry out large-scale behavioral
                                                                                                      So how does our brain recognize materials? We could
          experiments where participants are asked to recognize
          different reference materials among a pool of candidate                                   think that, similar to solving an inverse optics problem,
          samples. In the different experiments, we carefully                                       our brain is estimating the physical properties of each
          sample the information in the frequency domain of the                                    material (Pizlo, 2001). This would imply knowledge
          stimuli. From our analysis, we find significant first-order                                 of many other physical quantities about the object
          interactions between the geometry and the                                                and its surrounding scene, from which our brain could
          illumination, of both the reference and the candidates.                                  disentangle the reflectance of the surface. However,
          In addition, we observe that simple image statistics and                                 we rarely have access to such precise information,
          higher-order image histograms do not correlate with                                      so variations based on Bayesian inference have been
          human performance. Therefore, we perform a high-level                                    proposed (Kersten et al., 2004).
          comparison of highly nonlinear statistics by training a                                     Other approaches are based on image statistics,
          deep neural network on material recognition tasks. Our                                   and explain material recognition as a process where
          results show that such models can accurately classify                                    our brain extracts image features that are relevant to
          materials, which suggests that they are capable of                                       describe materials. Then, it would try to match them
          defining a meaningful representation of material                                          with previously acquired knowledge, to discern the
          appearance from labeled proximal image data. Last, we                                    material we are observing. Considering this approach
          find preliminary evidence that these highly nonlinear                                     our visual system would disregard the illumination,
          models and humans may use similar high-level factors                                     motion, or other factors in the scene and try to
          for material recognition tasks.                                                          recognize materials by representing their typical
                                                                                                   appearance in terms of features instead of explicitly
                                                                                                   acquiring an accurate physical description of each
            Introduction                                                                           factor. This type of image analysis can be carried out
                                                                                                   in the primary domain (Adelson, 2008; Fleming, 2014;
             Under typical viewing conditions, humans are                                          Geisler, 2008; Motoyoshi et al., 2007; Nishida & Shinya,
          capable of effortlessly recognizing materials and                                        1998), or in the frequency domain (Brady & Oliva,
          inferring many of their key physical properties, just
          Citation: Lagunas, M., Serrano, A., Gutierrez, D., & Masia, B. (2021). The joint role of geometry and illumination on material
          recognition. Journal of Vision, 21(2):2, 1–18, https://doi.org/10.1167/jov.21.2.2.
          https://doi.org/10.1167/jov.21.2.2                  Received May 4, 2020; published February 3, 2021                       ISSN 1534-7362 Copyright 2021 The Authors

                            This work is
Downloaded from jov.arvojournals.org  onlicensed under a Creative Commons Attribution-NonCommercial-NoDerivatives 4.0 International License.
                                           02/09/2021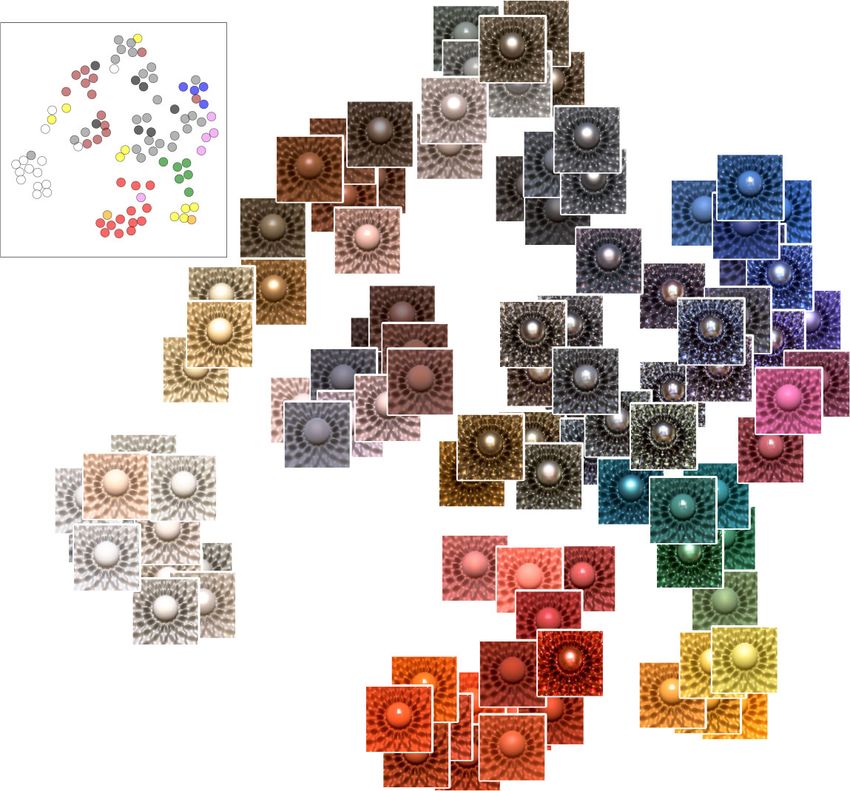
Journal of Vision (2021) 21(2):2, 1–18             Lagunas, Serrano, Gutierrez, & Masia                                           2

                                                                                 define a robust and accurate representation of material
                                                                                 appearance and find preliminary evidence that these
                                                                                 models and humans may share similar high-level factors
                                                                                 when recognizing materials.

                                                                                 Material recognition
                                                                                    Recognizing materials and inferring their key features
         Figure 1. Two spheres made of silver, under two different                by sight is invaluable for many tasks. Our experience
         illuminations, leading to completely different pixel-level               suggests that humans are able to correctly predict a
         statistics.                                                             wide variety of rough material categories like textiles,
                                                                                 stones, or metals (Fleming & Bülthoff, 2005; Fleming,
                                                                                 2014; Ged et al., 2010; Li & Fritz, 2012); or items
                                                                                 that we would call “stuff” (Adelson, 2001)—like sand
                                                                                 or snow. Humans are also capable of identifying the
                                                                                 materials in a photograph by briefly looking at them
                                                                                 (Sharan et al., 2009, 2008) or of inferring their physical
                                                                                 properties without the need to touch them (Fleming
                                                                                 et al., 2013, 2015a; Jarabo et al., 2014; Maloney &
                                                                                 Brainard, 2010; Nagai et al., 2015; Serrano et al.,
                                                                                 2016). This ability is built from experience, by actually
         Figure 2. Two objects of different geometries but made of the            confirming visual impressions with other senses. This
         same material, under the same illumination. The object on the           way, material perception becomes a cognitive process
         left seems to be made of a shinier material.                            (Palmer, 1975) whose underlying intricacies are not
                                                                                 fully understood yet (Anderson, 2011; Fleming et al.,
                                                                                 2015b; Thompson et al., 2011).
         2012; Giesel & Zaidi, 2013; Oliva & Torralba, 2001).
         However, it is argued if our visual system actually
         derives any aspects of material perception from such                    Interplay of geometry and illumination
         simple statistics (Anderson & Kim, 2009). For instance,
         Fleming and Storrs (2019) have recently proposed the                        Material perception is a complex process that
         idea that highly nonlinear encodings of the visual input                involves a large number of distinct dimensions (Mao et
         may better explain the underlying processes of material                 al., 2019; Obein et al., 2004; Sève, 1993) that, sometimes,
         perception.                                                             are impossible to physically measure (Hunter et al.,
            In this work, we thoroughly analyze how the                          1937). The illumination of a scene (Beck & Prazdny,
         confounding effects of illumination and geometry                        1981; Bousseau et al., 2011; Zhang et al., 2015) and
         influence human performance in material recognition                     the shape of a surface, are responsible for the final
         tasks. The same material can yield different appearances                appearance of an object (Nishida & Shinya, 1998;
         owing to changes in illumination and/or geometry                        Schlüter & Faul, 2019; Vangorp et al., 2007) and,
         (Figures 1 and 2), although it is possible to have two                  therefore, for our perception of the materials it is
         different materials look the same by tweaking the two                   made of (Olkkonen & Brainard, 2011). Humans are
         parameters (Vangorp et al., 2007). We aim to further                    capable of estimating the reflectance properties of
         our understanding of the complex interplay between                      a surface (Dror et al., 2001b) even when there is no
         geometry and illumination in material recognition.                      information about its illumination (Dror et al., 2001a;
         We have carried out large-scale, rigorous online                        Fleming et al., 2001), yet we perform better under
         behavioral experiments where participants were asked                    illuminations that match real-world statistics (Fleming
         to recognize different materials, given images of one                   et al., 2003). Indeed, geometry and illumination have a
         reference material and a pool of candidates. By using                   joint interaction in our perception of glossiness (Faul,
         photorealistic computer graphics, we obtain carefully                   2019; Leloup et al., 2010; Marlow et al., 2012; Olkkonen
         controlled stimuli, with varying degrees of information                 & Brainard, 2011) and color (Bloj et al., 1999). In this
         in the frequency domain. In addition, we observe                        work, we explore the interplay of shape, illumination,
         that simple image statistics, image histograms, and                     and their spatial frequencies in our performance at
         histograms of V1-like subband filters do not correlate                  recognizing materials. To achieve that, we launched
         with human performance in material recognition tasks.                   rigorous online behavioral experiments where we rely
         Inspired by Fleming and Storrs’ recent work (2019),                     on realistic computer graphics to generate the stimuli
         we analyze highly nonlinear statistics by training a                    and carefully vary their information in the frequency
         deep neural network. We observe that such statistics                    domain.

Downloaded from jov.arvojournals.org on 02/09/2021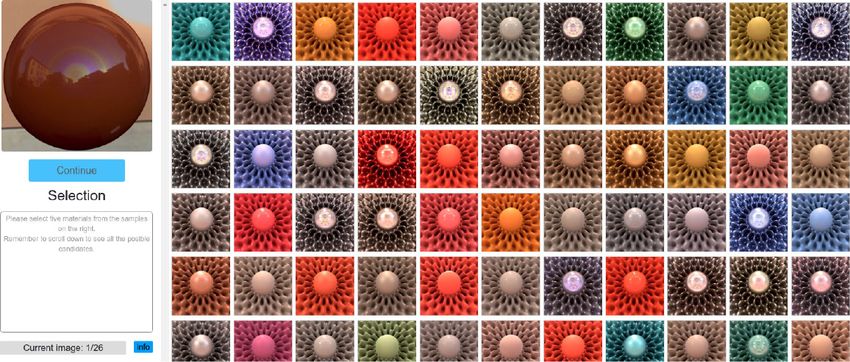
Journal of Vision (2021) 21(2):2, 1–18        Lagunas, Serrano, Gutierrez, & Masia                                                   3

         Image statistics and material perception
            One of the goals in material perception research is
         to untangle the processes that happen on our visual
         system to comprehend their roles and know what
         information they carry. There is an ongoing discussion
         on whether our visual system is solving an inverse
         optics problem (Kawato et al., 1993; Pizlo, 2001) or if it
         matches the statistics of the input to our visual system
         (Adelson, 2000; Motoyoshi et al., 2007; Thompson
         et al., 2016) to understand the world that surrounds us.           Figure 3. Graphical user interface of the online behavioral
         Later studies regarding our visual system and how we               experiments. In particular, this screenshot belongs to the TEST
         perceive materials dismiss the inverse optics approach             SH. On the left, the user can see the reference material
         and claim that it is unlikely that our brain estimates             together with her current selection. On the right, she can
         the parameters of the reflectance of a surface, when,              observe all the candidate materials. To select one candidate
         for instance, we want to measure glossiness (Fleming,              material, the user clicks on the corresponding image and it is
         2014; Geisler, 2008). Instead, they suggest that our               automatically added to the selection box on the left.
         visual system joins low and midlevel statistics to make
         judgments about surface properties (Adelson, 2008).                recognizing materials, and further observe that deep
         On this hypothesis, Motoyoshi et al. (2007) suggest that           neural networks may share similar high-level factors to
         the human visual system could be using some sort of                humans when recognizing materials.
         measure of histogram symmetry to distinguish glossy
         surfaces. Other works have explored image statistics in
         the frequency domain (Hawken & Parker, 1987; Schiller               Methods
         et al., 1976), for instance, to characterize material
         properties (Giesel & Zaidi, 2013), or to discriminate                 We carried out a set of online behavioral
         textures (Julesz, 1962; Schaffalitzky & Zisserman, 2001).          experiments where we analyze the influence of
         However, it is argued that, if our visual system actually          geometry, illumination, and their frequencies in human
         derives any aspects of material perception from simple             performance for material recognition tasks. Participants
         statistics (Anderson & Kim, 2009; Kim & Anderson,                  are presented with a reference material and their main
         2010; Olkkonen & Brainard, 2010). Instead, recent                  task is to pick five materials from a pool of candidates
         work by Fleming and Storrs (2019) proposes that, to                that they think are closer to the reference. A screenshot
         infer the properties of the scene, our visual system               of the experiment can be seen in Figure 3.
         is doing an efficient and accurate encoding of the
         proximal stimulus (image input to our visual system).
         Thus, highly nonlinear models, such as deep neural                 Stimuli
         networks, may better explain human perception. In line
         with such observations, Bell et al. (2015) show how                   We obtain our stimuli from the dataset proposed by
         deep neural networks can be trained in a supervised                Lagunas et al. (2019). This dataset contains images
         fashion to accurately recognize materials, and Wang                created using photorealistic computer graphics, with 15
         et al. (2016) later extend it to also recognize materials          different geometries, 6 different real-world illuminations
         in light fields. Closer to our work, Lagunas et al. (2019)         ranging from indoor scenarios to urban or natural
         devise a deep learning-based material similarity metric            landscapes, and 100 different materials measured from
         that correlates with human perception. They collected              their real-world counterparts which were pooled from
         judgements on perceived material similarity as a whole,            Mitsubishi Electric Research Laboratories (MERL)
         not explicitly taking into account the influence of                database (Matusik et al., 2003). We sample the following
         geometry or illumination, and build their metric upon              factors for our experiments:
         such judgements. In contrast, we focus on analyzing to                Geometries. Among the geometries that the dataset
         which extent geometry and illumination do interfere                contains, we choose the sphere and Havran-2 geometry
         with our perception of material appearance. We                     (Havran et al., 2016). These are low and high spatial
         launch several behavioral experiments with carefully               frequency geometries, respectively, suitable to test how
         controlled stimuli, and ask participants to specify                the spatial frequencies of the geometry affect the final
         which materials are closer to a reference. In addition,            appearance of the material and our performance at
         taking inspiration from these recent works, we explore             recognizing it.
         how highly nonlinear models, such as deep neural
         networks, perform in material classification tasks.                   • Sphere: Representing a smooth, and low spatial
         We find that such models are capable of accurately                      frequency geometry, widely adopted in previous

Downloaded from jov.arvojournals.org on 02/09/2021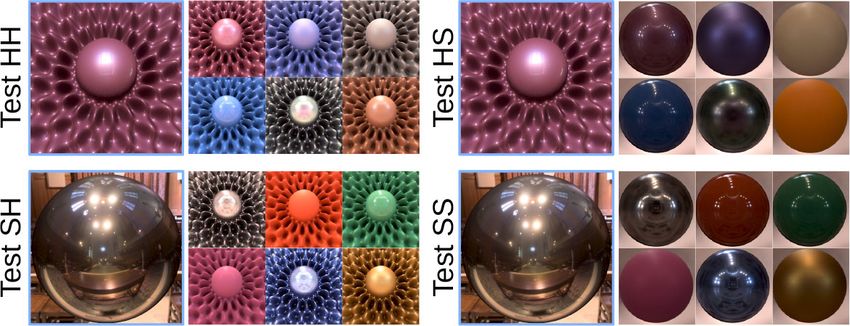
Journal of Vision (2021) 21(2):2, 1–18               Lagunas, Serrano, Gutierrez, & Masia                                                  4

         Figure 4. Examples of the stimuli in each different online
         behavioral experiment. On the left, we show an example of the
         reference stimuli with one of the six illuminations. On the right,
         we show a small subset (6 of the 100 materials) of the
         candidate stimuli with St. Peters illumination.

              behavioral experiments (Filip et al., 2008; Jarabo
              et al., 2014; Kerr & Pellacini, 2010; Sun et al., 2017).
            • Havran-2:1 It is a geometry with high spatial
              frequencies, and with high spatial variations that
              has been obtained through optimization techniques.
            • Havran-2: Surface has had significant success
              in recent perceptual studies and applications
              (Guarnera et al., 2018; Guo et al., 2018; Lagunas
              et al., 2019; Vávra & Filip, 2016).
                                                                                   Figure 5. Left: All illuminations depicted in the online behavioral
                                                                                   experiments. The inset corresponds to the pixel intensity for
           The stimuli in each different experiment can be                         the horizontal purple line. Right: Magnitude spectrum of the
         observed in Figure 4. The geometry in the reference                       luminance for each illumination.
         and candidate samples changes depending on the
         experiment, the details are as follows:
                                                                                        low-spatial frequency content. To simplify the
            • Test HH: Both the reference and the candidates                            notation, we refer to them throughout the article
              depict Havran geometry.                                                   as high-frequency, medium-frequency, and
            • Test HS: The reference depicts Havran and the                             low-frequency illuminations, respectively.
              candidates depict the sphere.                                           • The candidate samples depict the St. Peters
            • Test SH: The reference depicts the sphere while the                       illumination (except in an additional experiment
              candidates depict Havran.                                                 discussed in the Discussion where they depict Doge
            • Test SS: Both the reference and the candidates                            illumination). St. Peters is an illumination that has
              depict the sphere geometry.                                               been used in the past for several perceptual studies
                                                                                        (Fleming et al., 2003; Serrano et al., 2016), and it
           Illuminations. To prevent a pure matching task, we                           can be seen in Figure 5. The inset shows the RGB
         choose different illuminations between the reference                           pixel intensity for the horizontal purple line.
         and candidate materials for all behavioral experiments.                       To quantify the spatial frequencies of the
                                                                                   illuminations, we have employed the high-frequency
            • The reference samples depict six different                           content (HFC) measure (Brossier et al., 2004). This
              illuminations captured from the real world. All                      measure characterizes the frequencies in a signal by
              illuminations can be observed in Figure 5. To                        summing linearly weighted values of the spectral
              have an intuition of the content in the captured                     magnitude, thus avoiding to arbitrarily choose a
              illumination, the insets show the RGB intensity for                  separation between high and low frequencies, or visually
              the horizontal purple line. We use all illuminations                 assessing the slope of the 1/f amplitude spectrum. A
              in the dataset since they contain a mix of spatial                   high HFC value means higher frequencies in the signal.
              frequencies suitable to empirically test how the                     Figure 6 shows the HFC for each illumination.
              spatial frequencies of the illumination may affect
              human performance on material recognition tasks.
              The illuminations Grace, Ennis, and Uffizi have                      Materials
              a broad spatial frequency spectrum, Pisa and
              Doge mainly contain medium and low-spatial                             We use all the materials from the Lagunas et al.
              frequency content, while Glacier mainly has                          dataset Lagunas et al. (2019). The reference trials are

Downloaded from jov.arvojournals.org on 02/09/2021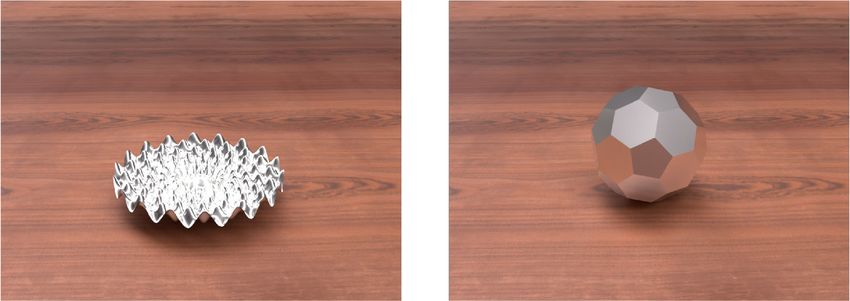
Journal of Vision (2021) 21(2):2, 1–18              Lagunas, Serrano, Gutierrez, & Masia                                            5

                                                                                  to the one shown in the reference image.” Additionally,
                                                                                  we instruct them to make their selection in decreasing
                                                                                  order of confidence. We let the users pick five candidate
                                                                                  materials because just one answer would provide sparse
                                                                                  results. We launched 25 HITs for each experiment
                                                                                  and each HIT was answered by six different users.
                                                                                  This resulted in a total of 27.000 nonsentinel trials,
                                                                                  12.000 belonging to the four experiments analyzed in
                                                                                  the Results, and 15.000 of them belonging to the five
                                                                                  additional experiments discussed in the Discussion
                                                                                  (a total of nine different experiments with 25 HITs each,
                                                                                  each HIT answered by six users and 20 nonsentinel
                                                                                  trials per HIT). Users were not allowed to repeat the
                                                                                  same HIT.
         Figure 6. HFC measure computed for all the candidate and
                                                                                     The set of materials in the candidate samples does
         reference illuminations. We can observe how high-frequency
                                                                                  not vary across HITs; however, the position of each
         illuminations (Uffizi, Grace, Ennis, St. Peters) also have a high
                                                                                  sample is randomized for each trial. This has a two-fold
         HFC value, medium-frequency illuminations (Pisa, Doge) have a
                                                                                  purpose: it prevents the user from memorizing the
         lower HFC value, and, last, low-frequency illuminations (Glacier)
                                                                                  position of the samples, and it prevents them from
         have the lowest HFC value.
                                                                                  selecting only the candidate samples that appear at the
                                                                                  top of their screen. The reference samples do not repeat
         sampled uniformly to cover all 100 material samples                      materials during a HIT and the reference material is
         in the dataset. Examples of the stimuli used in each                     always present among the candidate samples. During
         behavioral experiment are shown in Figure 4, where the                   the experiment, stimuli keep a constant display size of
         image on the left shows the reference material and the                   300 × 300 pixels for the reference, and of 120 × 120
         right area shows a subset of the candidate materials.                    pixels for the candidate stimuli (except for some of the
                                                                                  additional experiments explained in Discussion where
                                                                                  both reference and candidate stimuli are displayed at
         Participants                                                             either 300 × 300 pixels or 120 × 120 pixels). Figure 3
                                                                                  shows a screenshot with the graphical user interface
            The online behavioral experiments were designed                       during the behavioral experiments. On the left-hand
         to work across platforms on standard web browsers,                       side, we can observe the selection panel with the current
         and they were conducted through the Amazon                               trial and the selection of the current materials. The
         Mechanical Turk (MTurk) platform. In total, 847                          right-hand side displays the set of candidate materials
         unique users took part in them (368 users belonging                      whereof users can pick their selection. Users were not
         to the experiments explained in Results, and 479                         able to go back and redo an already answered trial, but
         belonging to the additional experiments explained                        they could edit their current selection of five materials
         in the Discussion), 44.61% of them female. Among                         until they were satisfied with their choice. Additionally,
         the participants, 62.47% claimed to be familiar with                     once the 23 trials of the HIT are answered, to have an
         computer graphics, 25.57% had no previous experience                     intuition about the main features that humans use for
         and 9.96% declared themselves professionals. We also                     material recognition, we asked the user: “Which visual
         sampled data regarding the devices used during the                       cues did you consider to perform the test?”
         experiments: 94.10% used a monitor, 4.30% used a                            To minimize worker unreliability, the user performs a
         tablet, and 1.60% used a mobile phone. In addition,                      brief training before the real test (Welinder et al., 2010).
         the most common screen size was 1366 × 728 pixels                        To avoid giving the user further information about the
         (42.01% of participants), minimum screen size was 640                    test, we use a different geometry (Havran-3 Havran
         × 360 pixels (two people), and a maximum of 2560 ×                       et al., 2016) during the training phase. In this phase,
         1414 pixels (one person). Users were not aware of the                    the items of the interface are explained and the user is
         purpose of the behavioral experiment.                                    given guidance on how to perform the test using just a
                                                                                  few images (Garces et al., 2014; Lagunas et al., 2018;
         Procedure                                                                Rubinstein et al., 2010).

            Subjects are shown a reference sample and a group
         of candidate material samples. Each experiment, HIT                      Sentinels
         in MTurk terminology, consists of 23 unique reference
         material samples or trials, 36 of which are sentinels used                 Each sentinel shows a randomly selected image from
         to detect malicious or lazy users. Users are asked to                    the pool of candidates as the reference sample. We
         “select five material samples which you believe are closer               consider user answers to the sentinel as valid if they pick

Downloaded from jov.arvojournals.org on 02/09/2021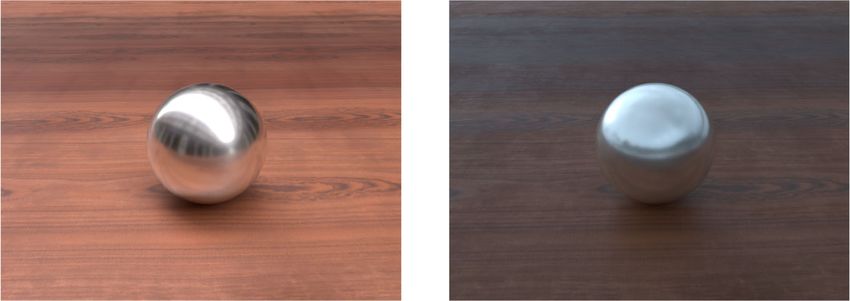
Journal of Vision (2021) 21(2):2, 1–18         Lagunas, Serrano, Gutierrez, & Masia                                                    6

         the right material within their five selections, regardless
         of the order. We rejected users who did not correctly
         answer at least one of the three sentinel questions. To
         ensure that users’ answers were well thought and that
         they were paying attention to the experiment, we also
         rejected users that took less than 5 seconds per trial (on
         average). In the end, we adopt a conservative approach
         and rejected 19.8% of the participants, gathering 21.660
         answers (9.560 belonging to the behavioral experiments
         explained in the Results and 12.100 belonging to the
         additional experiments explained in the Discussion).                Figure 7. Left: Top five accuracy for each of the four behavioral
                                                                             experiment. Center: Top five accuracy for each reference
                                                                             geometry Gref. Right: Top five accuracy for the candidate
                                                                             geometry Gcand. We can see how users seem to perform
          Results                                                            better when the candidate and reference are a high-frequency
                                                                             geometry. All plots have a 95% confidence interval. The names
            We investigate which factors have a significant                  marked with ∗ are found to have statistically significant
         influence on user performance and on the time they                  differences.
         took to complete each trial in the four experiments: Test
         HH, Test HS, Test SH, and Test SS. The factors we
         include are: the reference geometry Gref, the candidate             Influence of the geometry
         geometry Gcand, and the illumination of the reference
         sample Iref, as well as their first-order interactions                 There is a clear effect in user performance when the
         (recall that the illumination of the candidate samples              the geometry changes, regardless if that change happens
         remains constant in these behavioral experiments). We               in the candidate (Gcand, P = 0.005) or the reference
         also include the Order of appearance of each trial.                 geometry (Gref, P < 0.001). This finding is expected,
         We use a general linear mixed model with a binomial                 because the geometry plays a key role in how a surface
         distribution for the performance since it is well-suited            reflects the incoming light and, therefore, will have an
         for binary dependent variables like ours, and a negative            impact on the final appearance of the material. Figure 7
         binomial distribution for the time, which provides                  shows user performance in terms of top five accuracy
         more accurate models than the Poisson distribution                  with a 95% confidence interval when the reference and
         by allowing the mean and variance to be different.                  candidate geometry change jointly (left) or individually
         Because we cannot assume that our observations are                  (center and right). Users seem to perform better when
         independent, we model the potential effect of each                  they have to recognize the material in a high-frequency
         particular subject viewing the stimuli as a random                  geometry compared with a low-frequency one. Those
         effect. Because we have categorical variables among                 results also suggest that changes in the frequencies of
         our predictors, we re-code them to dummy variables                  the reference geometry may have a bigger impact on
         for the regression. In all our tests, we fix a significance         user performance than changes in the frequencies of
         value (P-value) of 0.05. Finally, for factors that present          the candidate geometry (i.e., users perform better with
         a significant influence, we further perform pairwise                a high-frequency reference geometry and low-frequency
         comparisons for all their levels (least significant                 candidate geometry, compared to a low-frequency
         difference pairwise multiple comparison test).                      reference geometry and a high-frequency candidate
                                                                             geometry).

         Analysis of user performance and time
                                                                             Influence of the reference illumination
            In our online behavioral experiments, we rely on the
         top five accuracy to measure user performance. This                    We observe that the illumination of the reference
         metric considers an answer as correct if the reference is           image has a significant effect on user performance
         among the five candidate materials that the user picked             (Iref, P < 0.001). This finding is expected because all
         in the trial. Because participants picked five materials            the materials in a scene are reflecting the light that
         ranked in descending order of confidence, the top one               reaches them; therefore, the changes in illumination
         accuracy could also be considered for our analysis.                 can significantly influence the final appearance of a
         However, the task they have to solve is not easy and                material, and how we perceive it (Bousseau et al., 2011).
         users have an overall top one accuracy of 9.21% which               Figure 8, left, shows the top five accuracy for each
         yields sparse results. A random selection would yield a             reference illumination and groups of illuminations with
         top one accuracy of 1% and a top five accuracy of 5%.               statistically indistinguishable performance. We can

Downloaded from jov.arvojournals.org on 02/09/2021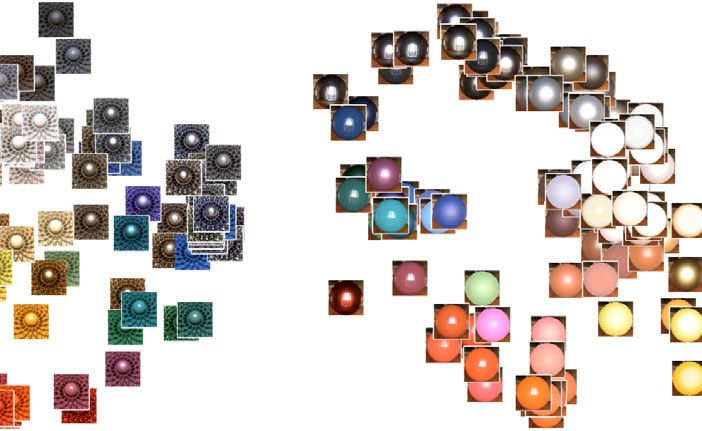
Journal of Vision (2021) 21(2):2, 1–18              Lagunas, Serrano, Gutierrez, & Masia                                                7

         Figure 8. Left: Top five accuracy for each reference illumination (Iref). We can see how users seem to perform better with
         high-frequency illuminations (Uffizi, Grace, Ennis), while their performance is worse with a low-frequency illumination (Glacier).
         Additionally, they have an intermediate performance for medium-frequency illuminations (Doge and Pisa). Center: Top five accuracy
         for each reference illumination when the candidate geometry (Gcand) changes. We can observe how users seem to perform
         significantly better with a high-frequency geometry (Havran) and illumination. On the other hand, for low-frequency illuminations,
         changes in the candidate geometry yield statistically indistinguishable performance. Right: Top five accuracy for each reference
         illumination when the reference geometry (Gref) changes. We can observe how users seem to perform significantly better for all
         high-frequency illuminations, except for Grace. The horizontal lines under the x-axis represent groups of statistically indistinguishable
         performance. We can observe how the groups usually cluster high-, medium- and low-frequency illuminations. The reference
         illuminations marked with ∗ denote significant differences in user performance between geometries for that illumination. The error
         bars correspond to a 95% confidence interval.

         observe how users seem to have better performance                        frequency one) when the reference stimuli features a
         when the surface they are evaluating has been lit with a                 high-frequency illumination (Iref = Uffizi, P = 0.019;
         high-frequency illumination (Ennis, Grace, and Uffizi),                  Iref = [Grace, Ennis], P < 0.001). On the other
         whereas users seem to perform worse in scenes with a                     hand, there seems to be no significant changes in
         low-frequency illumination (Glacier); users show an                      performance between a high- and low- frequency
         intermediate performance with a medium-frequency                         candidate geometry when the reference stimuli has
         illumination (Doge and Pisa). Moreover, we performed                     a medium- or low-frequency illumination (Iref =
         a least significant difference pairwise multiple                         Doge, P = 0.453; Iref = Pisa, P = 0.381; Iref =
         comparison test to obtain groups of illuminations                        Glacier, P = 0.770). We argue that user performance
         with statistically indistinguishable performance. These                  is driven by the reference sample. When the reference
         groups can be observed in Figure 8, under the x-axis. If                 material is lit with a low-frequency illumination,
         we focus on Iref we can see how high- (green), medium-                   users seem to not be able to properly recognize it.
         (blue), and low-frequency (red) illuminations yield                      Therefore, changes in the candidate geometry are
         groups of similar performance. There is an additional                    not relevant to user performance. These results can
         group of statistically indistinguishable performance                     be seen in Figure 8, center. Furthermore, under the
         represented in pink.                                                     x-axis, we can observe the groups with statistically
                                                                                  indistinguishable performance where high-, medium-,
                                                                                  and low-frequency illuminations yield groups of similar
         Influence of trial order                                                  performance.
                                                                                     We also found out that the interaction between the
           The order of appearance of the trials during the                       reference geometry and the reference illumination has
         experiment does not have a significant influence in users                a significant impact in user performance (Gref ∗ Iref,
         performance (Order, P = 0.391).                                          P = 0.012). Users seem to show better performance
                                                                                  for all illuminations with a high-frequency reference
         First order interactions                                                 geometry (Gref = Havran, Iref = Uffizi, P = 0.002; Iref
                                                                                  = [Ennis, Pisa, Doge, Glacier], P < 0.001), except for
            We find that the interaction between the candidate                    Grace illumination (P = 0.176), where the differences in
         geometry and the reference illumination has a                            humans performance are statistically indistinguishable.
         significant effect on user performance (Gcand ∗ Iref,                    These results, together with the groups of statistically
         P < 0.001). Users seem to perform better with a                          indistinguishable performance, can be seen in Figure 8,
         high-frequency geometry (compared with a low-                            right.

Downloaded from jov.arvojournals.org on 02/09/2021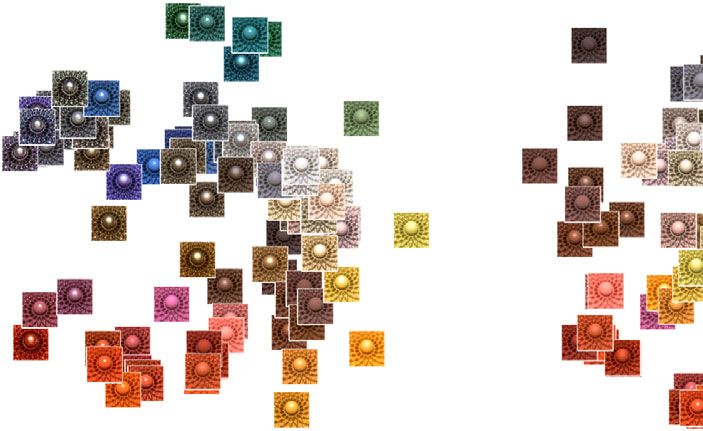
Journal of Vision (2021) 21(2):2, 1–18 Lagunas, Serrano, Gutierrez, & Masia 8
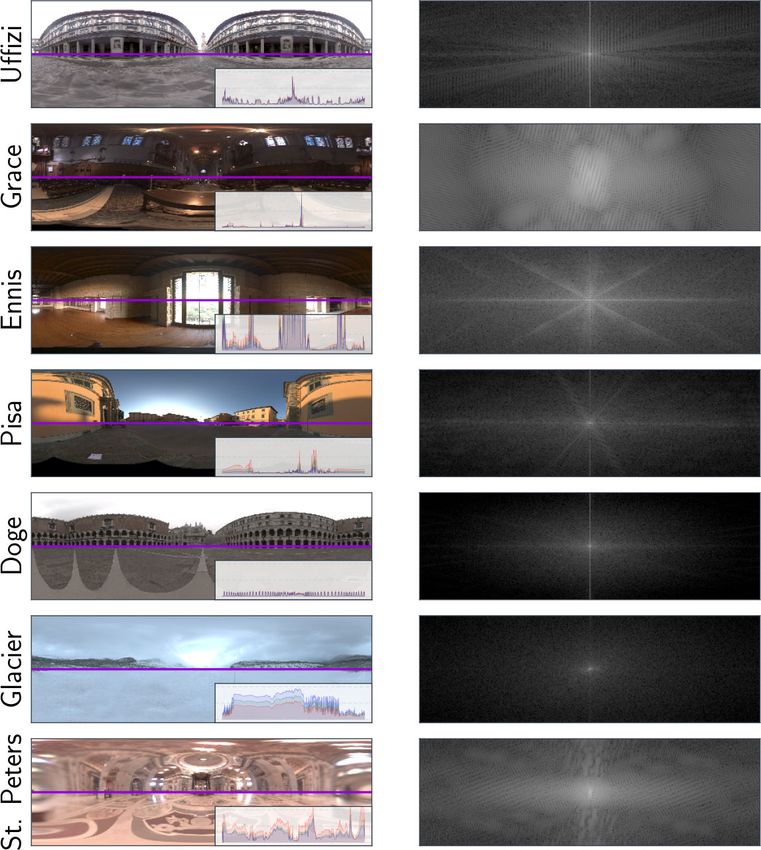
Figure 9. Visualizations of user answers to each of the four online behavioral experiments (namely, TEST HH, TEST HS, TEST SH, and TEST
SS) using the t-STE algorithm (Van Der Maaten & Weinberger, 2012). The inset shows the color of each material based on the color
classification proposed by Lagunas et al. (2019). We can see how, for all experiments, materials with similar color properties are
grouped together. Furthermore, if we explore the color clusters individually, we can see how there is a second-level arrangement by
reflectance properties. These observations suggest that users may be performing a two-step process while recognizing materials
where first, they sort them out by color, and second, by reflectance properties.
In general, we cannot conclude that there are recognition, investigate how simple image statistics
significant changes in performance due to the and image histograms correlate with human answers,
interaction between the candidate and reference and analyze highly nonlinear statistics in material
geometry (Gref ∗ Gcand, P = 0.407). Nevertheless, with classification tasks by training a deep neural network.
a low-frequency reference geometry (Gref = sphere),
users seem to perform significantly better with a
high-frequency candidate geometry (Gcand = Havran, Visualizing user answers
P = 0.009). To gain intuition on which high-level factors
humans might use while recognizing materials, we
use a stochastic triplet embedding method called the
Analysis of the time spent on each trial (t-Student stochastic triplet embedding (t-STE) (Van
Der Maaten & Weinberger, 2012) directly on user
To account for time, we measure the number of answers. This method maps user answers from their
milliseconds that passed since the trial loaded in their original non-numerical domain into a two-dimensional
screen and until they picked all five materials and space that can be easily visualized (find additional
pressed the “Continue” button. details in the Appendix B). Figure 9 shows the
two-dimensional embeddings after applying the t-STE
Influence of trial order algorithm to the answers of each online behavioral
experiment. Each point in the embedding represents 1
We find that the order of the trials has a significant of the 100 materials from the Lagunas et al. dataset.
influence on the average time users spend to answer The insets show the color of each material based on
them (P < 0.001). Users spend more time in the first the color classification proposed by Lagunas et al. We
questions and that after few trials the average time can observe how materials are clustered by color and,
they spend becomes stable at around 20 seconds if we focus in a single color, they seem to be clustered
per trial (recall that the order does not influence by reflectance properties (e.g., in Test HH, red color
performance). This phenomenon is expected as cluster, we can observe how on the left there are specular
users have to familiarize with the experiment during materials while on the right there are diffuse materials).
the first iterations. As the test advances, they learn This finding suggests that users have followed a
how to interact with it and the time they spend two-step strategy to recognize the materials, and that
becomes stable. Additional figures and results on the the high-level factors driving material recognition might
factors that influence the spent time can be found in be color first, and the reflectance properties second. At
Appendix A. the end of the HIT, users were asked to write the main
visual features they used to recognize materials. Out of
High-level factors driving material recognition 368 unique users from the experiments analyzed in the
Results, 273 answered that they have used the colors,
In addition to the analysis, we also try to gain and 221 answered that they relied on the reflections.
intuition on which high-level factors drive material Among them, 157 answered both color and reflections
Downloaded from jov.arvojournals.org on 02/09/2021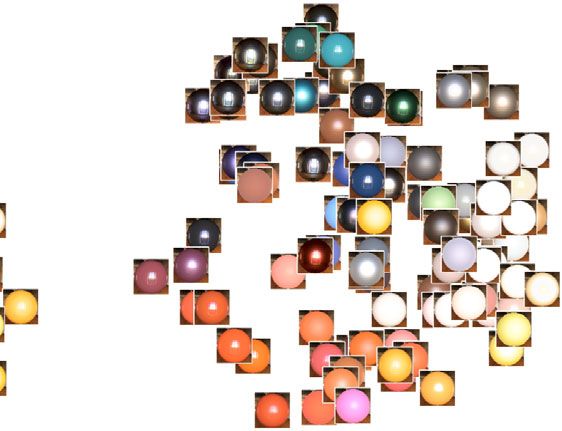
Journal of Vision (2021) 21(2):2, 1–18         Lagunas, Serrano, Gutierrez, & Masia                                          9

         as some of the visual cues they have used to perform                with humans 6.29% of the time. These results show how
         the task. This observation, together with the t-STE                 simple statistics, and higher-order image histograms
         visualization, strengthens the hypothesis of a two-step             seem not to be capable of fully capturing human
         strategy.                                                           behavior. We have added additional results on the
                                                                             SVMs and human agreement in Appendix C.
         Image statistics
             Previous studies focused on simple image statistics             Image frequencies
         as an attempt to further understand our visual system                  To understand if humans’ performance could be
         (Adelson, 2008; Motoyoshi et al., 2007). Nevertheless,              explained by taking into account the spatial frequency
         it is argued whether our visual system actually                     of the reference stimuli, at their viewed size, we have
         derives any aspects of material perception using such               added the HFC measure, and the first four statistical
         simple statistics (Anderson & Kim, 2009; Kim &                      moments of the reference stimuli magnitude spectrum
         Anderson, 2010; Olkkonen & Brainard, 2010). We                      to the factors analyzed in the Results. We found that the
         tested the correlation between the first four statistical           Skewness (P < 0.001) and Kurtosis (P < 0.001) of the
         moments of the luminance (considered as the ratio:                  magnitude spectrum seem to have a significant influence
         L = 0.3086 ∗ R + 0.6094 ∗ G + 0.0820 ∗ B), the pixel                on humans performance; however, they present a very
         intensity for each color channel independently, and the             small effect size.
         joint RGB pixel intensity, directly against users top five
         accuracy. To measure correlation we employ a Pearson
         P and Spearman S correlation test. We found out that                Highly nonlinear models
         there is little to no correlation, except for the standard             Recent studies suggest that, to understand what
         deviation of the joint RGB pixel intensity where                    surrounds us, our visual system is doing an efficient
         P 2 = 0.43 (P < 0.001) and S 2 = 0.50 (P < 0.001).                  nonlinear encoding of the proximal stimulus (the
         Additional information can be found in Appendix C.                  image input to our visual system) and that highly
                                                                             nonlinear models might be able to better capture human
                                                                             perception (Delanoy et al., 2020; Fleming & Storrs,
         Image histograms                                                    2019). Inspired by this hypothesis, we have trained a
            We also compute the histograms of the RGB pixel                  deep neural network called ResNet (He et al., 2016)
         intensity, of the luminance, of a Gaussian pyramid (Lee             using a loss function suitable to classify the materials
         & Lee, 2016), of a Laplacian pyramid (Burt & Adelson,               in the Lagunas et al. dataset. The images feature the
         1983), and of log-Gabor filters designed to simulate                same illuminations as the reference stimuli. We left
         the receptive field of the simple cells of the Primary              out the images rendered with Havran geometries for
         Visual Cortex (V1) (Fischer et al., 2007). To see how               validation and testing purposes, and use the rest during
         such histograms would perform at classifying materials,             training. To know which material the network classifies
         we train a support vector machine (SVM) that takes the              we add a softmax layer at the end of the network. The
         image histogram as the input and classifies the material            softmax layer outputs the probability of the input
         in that image. We use a radial basis function kernel                image to belong to each material in the dataset. In
         (or Gaussian kernel) in the SVM. We use all image                   comparison, the model used by Lagunas et al. does
         histograms that do not feature Havran geometry as the               not have the last fully connected and softmax layer,
         training set and leave the ones with Havran as test set.            and it is trained using a triplet loss function aiming for
         In the end, the best performing SVM uses the RGB                    similarity instead of classification. At the end of the
         image histogram as the input and achieves a 24.17% top              training, the model achieves a top-5 accuracy of 89.63%
         five accuracy in the test set.                                      on the test set, suggesting that such models are actually
            In addition, we compare the predictions of each                  capable of extracting meaningful features from labeled
         SVM directly against human answers. For each                        proximal image data (additional details on the training
         reference stimuli we compare the five selections of                 can be found in Appendix D). To gain intuition on how
         the user against the five most likely SVM material                  the network has learned, we have used the Uniform
         predictions for that stimuli. The best SVM uses the                 Manifold Approximation and Projection algorithm
         histograms of V1-like subband filters and agrees with               (McInnes & Healy, 2018). This algorithm aims to
         humans 6.36% of the time. Moreover, we compare                      decrease the dimensionality of a set of feature vectors
         histogram similarities against human answers using a                while maintaining the global and local structure of their
         Χ2 histogram distance (Pele & Werman, 2010). For a                  original manifold. Figure 10 shows a two-dimensional
         reference image stimuli we measure its similarity against           visualization of the test set obtained using the 128
         all possible candidate image stimuli and compare the                features of the fully connected layer before softmax. We
         closest five against participants answers. The Gaussian             can observe how materials seem to be grouped first by
         pyramid histogram obtained the best result, agreeing                color and then by its reflectance properties suggesting

Downloaded from jov.arvojournals.org on 02/09/2021
Journal of Vision (2021) 21(2):2, 1–18 Lagunas, Serrano, Gutierrez, & Masia 10
Figure 11. Normalized pairwise similarity for each online
behavioral experiment and the deep neural network trained for
material classification. We can observe how the pairwise
similarity decreases as the stimuli in the experiments cover
fewer frequencies in the spectrum, where Test SS has the
lowest similarity. Additionally, we can see how the similarities
between the neural network and each behavioral experiment
Figure 10. Two-dimensional embedding obtained using the are on par with those obtained by humans between Test HH,
Uniform Manifold Approximation and Projection algorithm Test HS, and Test SH. DNN, deep neural network.
(McInnes & Healy, 2018) on the 128 features of the last fully
connected layer of a ResNet model (He et al., 2016) trained to compare the behavioral experiments, we can observe
classify materials. The inset shows the color of each material a decreasing degree of similarity because their stimuli
based on the color classification proposed by Lagunas et al. feature fewer frequencies in the spectrum, where Test
(2019). We can observe how materials are arranged by color SS yields the lowest similarity in each of the pairwise
clusters. Moreover, we can observe similarities between this comparisons. We argue that Test SS has the lowest
visualization and the t-STE visualization on user answers. similarity because it is the experiment where users have
the worst performance, thus yielding a blurry high-level
visualization. In contrast, the network is very accurate at
that the model may have used similar high-level factors classifying materials and yields a high-level visualization
to humans when classifying materials. with well-defined material clusters. Moreover, if we
We additionally assess the degree of similarity focus on the deep neural network visualization, we can
between the high-level visualization of each online observe how its similarity values are, in general, on par
behavioral experiment and the high-level visualization with those obtained by users in Test HH, Test HS, and
of the deep neural network. We calculate the similarity Test SH. This result further supports the hypothesis
in a pairwise fashion where we choose a material that both humans and deep neural networks may
sample and retrieve its five nearest neighbors in two rely on similar high-level visual features for material
different low-dimensional representations. Then, we recognition tasks. However, this is just a preliminary
compute the percentage of materials that are the same result that may highlight a future avenue of research,
in both groups of nearest neighbors. We repeat this and a thorough analysis of the perceptual relationship
process for all the materials and calculate the similarity between deep learning architectures and humans is out
as the average. The low-dimensional representations of the scope of this article.
are obtained with stochastic methods, where the
same input can have different results if we vary the
parameters. To evaluate the degree of self-similarity,
we run the t-STE algorithm (Van Der Maaten & Discussion
Weinberger, 2012) on each behavioral experiment
using five different sets of fully randomly sampled From our online behavioral experiments, we
parameters. We obtain a self-similarity value of 0.66, have observed that humans seem to perform
on average across experiments. In contrast, a set better at recognizing materials in stimuli with
of random low-dimensional representations has a high-frequency illumination and geometry. Moreover,
similarity of 0.06, on average. Figure 11 shows the our performance when recognizing materials is poor on
average pairwise similarity normalized by the value of low-frequency illuminations, and it remains statistically
self-similarity and random similarity for all experiments indistinguishable irrespective of the spatial frequency
and the deep neural network visualization. If we content in the candidate geometry.
Downloaded from jov.arvojournals.org on 02/09/2021Journal of Vision (2021) 21(2):2, 1–18 Lagunas, Serrano, Gutierrez, & Masia 11
Figure 13. Left: Top five accuracy for each reference illumination
when St. Peters, a high-frequency illumination, is the candidate
Figure 12. Top five accuracy obtained by participants in the illumination. Right: Top five accuracy for each reference
original experiment (left), when the stimuli are displayed at 300 illumination when Doge, a medium-frequency illumination, is
× 300 pixels (middle), and at 120 × 120 pixels (right). We can the candidate illumination. Both results have been obtained for
observe how the asymmetric effect of participants performing TEST HH. We can observe how, for both candidate illuminations,
better when Havran is the reference geometry (TESTHS) participants seem to perform better with high-frequency
compared with when it is the candidate (TESTSH) remains reference illuminations (Uffizi, Grace, Ennis), they perform
present when the participants observe the reference and worse with medium-frequency ones (Pisa), and have their
candidate stimuli at identical sizes (middle and right). The ∗ worst performance with low-frequency reference illuminations
denotes significant differences. The error bars correspond with (Glacier). In addition, we also observe that participants have
a 95% confidence interval. slightly better performance when St. Peters (high-frequency
illumination) is the candidate illumination. The error bars
correspond with a 95% confidence interval.
Asymmetric effect of the reference and
candidate geometry
remains present when the stimuli are displayed at 300
It is also interesting to observe that humans seem × 300 pixels (P < 0.001) and when they are displayed
to have better performance with a high-frequency at 120 × 120 pixels (P < 0.001). Those results can be
reference geometry, compared to a high-frequency seen in Figure 12, middle and right. It is also interesting
candidate geometry (P = 0.001, Figure 12, left). The to observe how users have slightly worse performance
number of candidates with respect to the reference when the stimuli are displayed at 300 × 300 pixels. At
could be used as an explanation for this observation, such a display size, only three candidate stimuli per row
since users may devote more time to inspecting the could be displayed taking into account the most used
single reference than the higher number of candidates. display size. Thus, it seems reasonable to think that
At the same time, a lower performance with a the need for additional scrolling could be hampering
high-frequency reference geometry may speak against participants performance.
an inverse optics approach because having multiple
candidate materials with the same geometry and
illumination could provide a strong cue to inferring the Influence of the candidate illumination
material.
One potential factor that may explain this difference We have seen that humans seem to be better at
in performance is the different display sizes of the recognizing materials under high-frequency reference
reference (300 × 300 pixels) and the candidate (120 illuminations. However, in Figure 5 and 6 we can see
× 120 pixels) stimuli. To test this hypothesis, we have that the St. Peters candidate illumination features a
launched two additional experiments where we collect similar frequency content to the reference illuminations
answers on Test HS and Test SH displaying the where users have better performance. To asses if St.
candidate and the reference stimuli at size 300 × 300, Peters illumination contains a set of frequencies that
and other two additional experiments where they are aids recognizing materials under reference illuminations
displayed at 120 × 120 pixels. We sample the stimuli to with a similar set of frequencies, we have launched an
cover all the possible combinations of illuminations and additional behavioral experiment. In this experiment
materials and keep other technical details as explained we use Doge, a medium-frequency illumination, as the
in thw Methods. We perform an analysis of the gathered candidate illumination. We sample the stimuli to cover
data similar to the one explained in the Results, but all materials and reference illuminations in Test HH.
using the different experiment type as a factor. From Other technical details are kept as explained in the
our results, we observe that such asymmetric effect Methods. From the data collected (Figure 13), we can
Downloaded from jov.arvojournals.org on 02/09/2021Journal of Vision (2021) 21(2):2, 1–18 Lagunas, Serrano, Gutierrez, & Masia 12
observe how, using Doge as the candidate illumination,
humans performance follows a similar distribution to
the original experiment (with St. Peters as the candidate
illumination). Participants seem to perform better with
high-frequency reference illuminations (Uffizi, Grace,
Ennis), they perform worse with medium-frequency
ones (Pisa), and have their worst performance with low-
frequency reference illuminations (Glacier). In addition,
participants seem to have slightly better performance Figure 14. Example of a convolution (F ∗ T , green line) between
with a high-frequency candidate illumination (St. a material (F, orange line) and a geometry (T , blue line) with
Peters) compared with a medium-frequency one (Doge). different frequency content. Left: We can see how when we
convolve a geometry and a material with high spatial
frequencies, the resulting convolution also retains HFC. Right:
Interplay between material, geometry, and We observe how when geometry has low spatial frequencies
illumination and the material has high spatial frequencies, the resulting
convolution does not retain HFC. Note that T and F are not
We have looked into how geometry, illumination, necessarily related to a real bidirectional reflectance
and their frequencies affect our performance in material distribution function (BRDF) or shape from the ones reported in
recognition tasks. Our stimuli were rendered images in this work.
which we varied the frequency of the illumination, and
of the underlying geometry of the object present. To
better understand how our factors (illumination and signals, the resulting one keeps the high-frequency
geometry) affect the generated stimuli, and thus the content; in contrast, when we convolve a high- and a
proximal stimulus, we offer here a brief description low-frequency signal, the resulting one has most of its
of the rendering equation, providing an explanation frequencies masked.
of the probable effect of how the frequencies of the We can relate the observations made from Equation
geometry and illumination in the 3D scene affect the (2) to the results on user performance that we obtained
final, rendered image that is used as a stimulus in our from the online behavioral experiments. We have seen
experiments. From the point of view of the rendering that users seem to consistently perform better when they
equation, the radiance Lo at point x in direction ωo, recognize materials from high-frequency geometries and
assuming a distant illumination and nonemissive illuminations. This finding is supported by Equation (2)
surfaces can be approximated as because, to avoid filtering the frequencies of the material
in the stimuli, it should have a high-frequency geometry
and illumination. Moreover, a low-frequency geometry
Lo (x, ωo ) ≈ Li (ωi ) F (ωi , ωo ) T (x, ωi , ωo ) dωi , (1) (or illumination) could filter out the frequencies of
the illumination (or geometry) and the material, thus
yielding fewer visual features on the final image and,
where Li accounts for the incoming light, the variable as a result, worse users performance. This finding
F accounts for the reflectance of the surface, and T is consistent with our findings from the analysis
depends on the point of the surface we are evaluating, of first-order interactions for users performance in
therefore, on the geometry. Analysis of User Performance and Time.
The simulation of the radiance Lo can be seen as
a convolution (spherical rotation) (Ramamoorthi
& Hanrahan, 2001) between each signal: incoming
radiance Li , material F , and geometry T . Moreover, if
Material categories
we analyze Lo in the frequency domain (where F is the
We have seen that the reflectance properties seem
Fourier transform), and apply the convolution
theorem
to be one of the main high-level factors driving
( f ∗ g = F ( f ) · F (g)) the value of F Lo becomes
material recognition. In this regard, we have also
investigated users performance using the classification
F Lo ≈ F Li F F F T . (2) by reflectance type proposed by Lagunas et al. (2019),
where the MERL database is divided into eight
Equation (2) shows how the frequency of the radiance different categories with similar reflectance properties.
Lo in the final image is a multiplication of all the other On average, users perform best on acrylics, with a top
signals Li , F , and T in the frequency domain. Thus, five accuracy of 45.45%, whereas they have their worst
the final image will only have the frequencies that are performance with organics, with an accuracy of 10.22%.
contained within the three other signals. Figure 14 Figure 15 shows the top five accuracy for each category
shows how when we convolve two high-frequency in each reference illumination. First, we observe that
Downloaded from jov.arvojournals.org on 02/09/2021Journal of Vision (2021) 21(2):2, 1–18 Lagunas, Serrano, Gutierrez, & Masia 13
recognition task between a reference and a set of
candidate samples. From our experiments, we have
observed that, in general, humans seem to be better at
recognizing materials in a high-frequency illumination
and geometry. We found that simple image statistics,
image histograms, and histograms of V1-like subband
filters are not capable of capturing human behavior,
and, additionally, explored highly nonlinear statistics
by training a deep neural network on material
classification tasks. We showed that deep neural
networks can accurately perform material classification,
which suggests that they are capable of encoding
and extracting meaningful information from labeled
proximal image data. In addition, we gained intuition
on which are the main high-level factors that humans
and those highly nonlinear statistics use for material
recognition and found preliminary evidence that such
statistics and humans may share similar high-level
factors for material recognition tasks.
Limitations and future work
Figure 15. Users performance, in terms of top-5 accuracy, for
To collect data for the online behavioral experiment
material recognition tasks taking into account the reflectance of
we have relied on the Lagunas et al. (2019) dataset
the materials. We can observe how, on average, users perform
which contains images of a diverse set of materials,
better for high-frequency illuminations (Uffizi, Grace, and
geometries, and illuminations that faithfully resemble
Ennis). Also, we can see how for classes, like fabrics or organics,
their real-world counterparts. This database focuses
containing materials with diffuse surface reflectance
on isotropic materials, which are capable of modeling
(low-frequency), users do not have better performance with
only a subset of real-world materials. A systematic
broad frequency content illuminations. We argue that, since
and comprehensive analysis of other heterogeneous
they have a low-frequency surface reflectance, even though
materials, or an extension of this study to other
there is a high-frequency illumination, those frequencies
nonphotorealistic domains, remains to be done.
cannot be represented on the final stimulus that is input to our
Our stimuli were rendered using the sphere and
visual system.
Havran geometry, although those surfaces have been
widely used in the literature (Havran et al., 2016;
Jarabo et al., 2014; Lagunas et al., 2019; Serrano
et al., 2016), introducing new geometries could help
users seem to perform better with high-frequency to further analyze the contribution of the spatial
illuminations (Uffizi, Grace, Ennis). However, we can see frequencies of the geometry in our perception of
how fabrics and organics do not follow this trend. We material appearance (Nishida & Shinya, 1998).
argue that fabrics and organics contain mostly materials Moreover, to select our stimuli, we characterized the
with a diffuse surface reflectance (low-frequency) frequency content of real-world illuminations using
that clamp the frequencies of the illumination and, the high-frequency content measure (Brossier et al.,
therefore, yield fewer cues in the final stimulus that is 2004). We focus on real-world illuminations, which
input to our visual system. are by definition broadband; therefore, we do not
impose or limit their frequency distribution in our
analyses; carefully controlling the spatial frequency
of the stimuli via filtering to isolate frequency bands
Conclusions and study their individual contribution to the process
of material recognition is an interesting avenue of
In this work, we have presented a thorough research.
and systematic analysis of the interplay between In our additional experiments, we have investigated
geometry, illumination, and their spatial frequencies the asymmetric effect in performance with a high-
in human performance recognizing materials. We frequency reference geometry, compared with a
launched rigorous crowd-sourced online behavioral high-frequency candidate geometry when all stimuli
experiments where participants had to solve a material are displayed at the same size. A rigorous study of the
Downloaded from jov.arvojournals.org on 02/09/2021You can also read