Automatic and semi-automatic processing of seismograms from local networks WEBNET and REYKJANET
←
→
Page content transcription
If your browser does not render page correctly, please read the page content below
Summary of doctoral thesis

                      Jana Doubravová

Automatic and semi-automatic processing
  of seismograms from local networks
     WEBNET and REYKJANET

                       Department of Geophysics

   Supervisor of the doctoral thesis: Ing. Josef Horálek, CSc.
                 Study programme: Physics
                      Study branch: Physics of the Earth and Planets

                              Prague 2020
.
Autoreferát dizertační práce

                 Jana Doubravová

    Automatické a poloautomatické
zpracování seismogramů z lokálních sítí
      WEBNET a REYKJANET

                      Katedra geofyziky

      Vedoucí dizertační práce: Ing. Josef Horálek, CSc.
             Studijní program: Fyzika
         Studijní obor branch: Fyzika Země a planet

                         Praha 2020
Dizertace byla vypracována na základě výsledků získaných v letech 2011-2020 během
doktorandského studia na Katedře geofyziky MFF UK a v Geofyzikálním ústavu AV
ČR.

Dizertantka:
Ing. Jana Doubravová
Geofyzikální ústav AV ČR, v.v.i.
Boční II/1401, 141 31 Praha 4

Školitel:
Ing. Josef Horálek, Csc.
Geofyzikální ústav AV ČR, v.v.i.
Boční II/1401, 141 31 Praha 4

Oponenti:
RNDr. Jiří Málek, Ph.D.
Ústav struktury a mechaniky hornin AV ČR, v.v.i.
V Holešovičkách 41, 182 09 Praha 8

Dr. Simone Cesca
Helmholtz-Zentrum Potsdam
Deutsches GeoForschungsZentrum GFZ
Telegrafenberg, 14473 Potsdam

Předsedkyně oborové rady:
doc. RNDr. Hana Čížková, Ph.D.
Katedra Geofyziky MFF UK
V Holešovičkách 2, 180 00 Praha 8

Obhajoba dizertace se koná dne 8.9.2020 v 10:00 hodin před komisí pro obhajoby
dizertačních prací v oboru Fyzika Země a planet v budově MFF UK, Ke Karlovu 3,
Praha 2 v místnosti M252.

S dizertací je možno se seznámit na oddělení postgraduálního studia MFF UK, Ke
Karlovu 3, Praha 2, a na webové stránce www.ig.cas.cz/obhajene-prace.
Contents
1 Introduction                                                                                2

2 West Bohemia/Vogtland and Reykjanes Peninsula seismicity                                    3

3 Local seismic networks WEBNET and REYKJANET                                                 5

4 Automatic event detection                                                                   8
  4.1 Event detection methods and machine learning in seismology         .   .   .   .   .    8
  4.2 SLRNN concept . . . . . . . . . . . . . . . . . . . . . . . . .    .   .   .   .   .    9
  4.3 The training process . . . . . . . . . . . . . . . . . . . . . .   .   .   .   .   .   12
  4.4 Multiple station detection . . . . . . . . . . . . . . . . . . .   .   .   .   .   .   14
  4.5 Application to WEBNET and REYKJANET seismograms .                  .   .   .   .   .   15

5 Seismon_WB                                                                                 21

6 Conclusion                                                                                 23

Bibliography                                                                                 24

List of publications                                                                         28

                                         1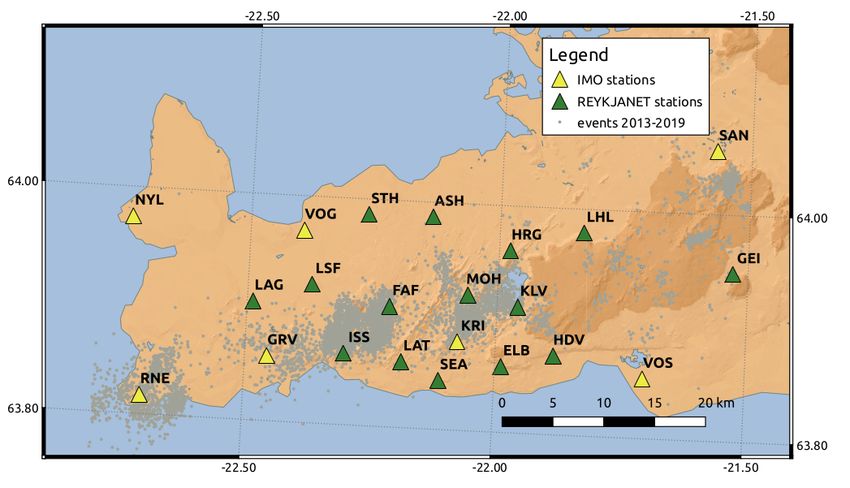
1    Introduction
Automatic processing of seismic data is nowadays a crucial point in seismology.
The number of stations operated in global, regional and local seismic networks or
deployed in various temporal field experiments has been growing and the stations
are mostly running with continuous digital recording. In the last thirty years, ob-
servational seismology has undergone a radical progress from autonomous stations
equipped with frequency narrow-band seismographs to the networked digital broad-
band stations with constant Internet access. The seismic processing developed from
fairly limited manual procedures (visual event detection and manual readings of
travel times and selected amplitudes of detected events) allowed by the analog seis-
mograms on a photographic paper, into near-real time automatic or semi-automatic
data processing enabled by the digital seismic data streamed on-line. In the era
of the analog recordings only seismograms of prominent events could be analyzed
in more details, quantitative processing of seismograms was practically impossible;
accordingly there were only sporadic demands on more advanced databases. Digital
seismic observations, which started to be increasingly used at the turn of 80’s and
90’s of the twentieth century, meant a significant milestone in seismology. The main
progress was the possibility of quantitative analyses of event waveforms or complete
seismograms using advanced processing methods. This together with a progress in
data acquisition systems and data transmission technologies led to a development
and growth of seismic networks. Especially, continuously recording dense seismic
networks produce a huge amount of data. The WEBNET and REYKJANET net-
works operated in West Bohemia earthquake-swarm region and in South-West Ice-
land (Chapter 3) are a typical example of that. Data from seismic networks should
be quickly accessible and processed as quickly as possible, particularly in case of
prominent seismic events or increased earthquake activity. However, it cannot be
achieved without up-to-date data transfer, advanced databases, and high level of
automated/semi-automated data processing.
    First of all, there has been a need to reduce the amount of recorded data so that
only target seismic events (e.g. local earthquakes) would be processed. In the initial
stage of digital seismic observations the seismic stations were operated in a trigger
mode. That means event detection was carried out in real time. Only triggered
events were recorded and remaining information was irretrievably lost. The trig-
gering algorithms all relied on some version of STA/LTA (Short-Time-Average over
Long-Time-Average). However, the STA/LTA triggering algorithms required precise
tuning of the parameters to obtain optimal detection performance for a given task
and local conditions. In order to achieve good sensitivity of the triggered recording
there has been large number of false records due to disturbances, that had to be ex-
cluded from further processing (usually manually); on the other hand some weaker
events immediately following stronger ones were undetected due to the raised LTA.
    Availability of the high capacity memory storage and computational performance
of the relatively cheap computers enabled to meet the growing demands of seismol-
ogists for continuous seismograms. Consequently, the recording turned to continual
regime which made significant progress in observational seismology allowing to record

                                          2
and preserve whole seismograms including very weak events, long-period waves and
seismic noise. However, the changeover to continual recordings resulted in an ur-
gent need for automatic pre-processing of continual records. First of all, a reliable
automatic event detection was necessary.
    Although automatic processing of records enables near-real time computation of
all basic parameters of an earthquake the manual processing is still considered as a
true reference. The automatic algorithms often fail in case of multiple and overlap-
ping events, or any case of complicated waveforms. In case of earthquake swarms,
the prevailing type of seismic activity in our target areas of West Bohemia/Vogtland
and South-West Iceland, the overlapping events are very common. Therefore the
automatically processed data are continuously under supervision of an expert. The
supervision is usually achieved by some interactive software with Graphical User
Interface.
    My doctoral thesis concerns automated processing of data from local seismic net-
works WEBNET and REYKJANET which have been operated in earthquake-swarm
areas of West Bohemia and South-West Iceland by the Institute of Geophysics (IG)
and Institute of Rock Structure and Mechanics (IRSM) of CAS. I have mainly fo-
cused on the development of a reliable detection method of local earthquakes using
machine learning based on artificial neural networks (ANN). I trained the ANN for
the West Bohemia/Vogtland swarm-like events and put the ANN detector into prac-
tice for processing of continual recordings from the WEBNET and REYKJANET
networks. Furthermore, I have developed the Seismon_WB program package for
seismic data processing of the WEBNET and REYKJANET networks. The software
enables manual work together with automatic routines and their interconnection and
combination supplemented by a communication with the database as an integral part
of the program. Seismon_WB is used as a primary tool for visual interactive pro-
cessing of continual seismograms and displaying the results. Its concept arose from
the necessity to replace an obsolete program Seisbase (Fischer and Hampl [1997])
formerly used for processing the WEBNET data, which enabled to work with trig-
gered recordings only. Both these topics solved in my doctoral thesis are not only of
crucial importance for automatic or semi-automatic data processing from networks
in question but they are also applicable to other local seismic networks.

2    West Bohemia/Vogtland and Reykjanes Penin-
     sula seismicity
Although earthquakes and also earthquake swarms were intensively studied over
many decades the possibilities of recording, processing and interpreting the data
are increasing rapidly with the well-known increase of computational power obey-
ing the Moor’s law. This together with growing data storage capacity has lead to
great progress in observation seismology in recent years, which is more and more fo-
cused on detailed investigations of the earthquake-source processes and the Earth’s
crust/lithosphere structure using broadband recordings from dense seismic networks.
Original continuous recordings are stored on special data archive servers preserving

                                         3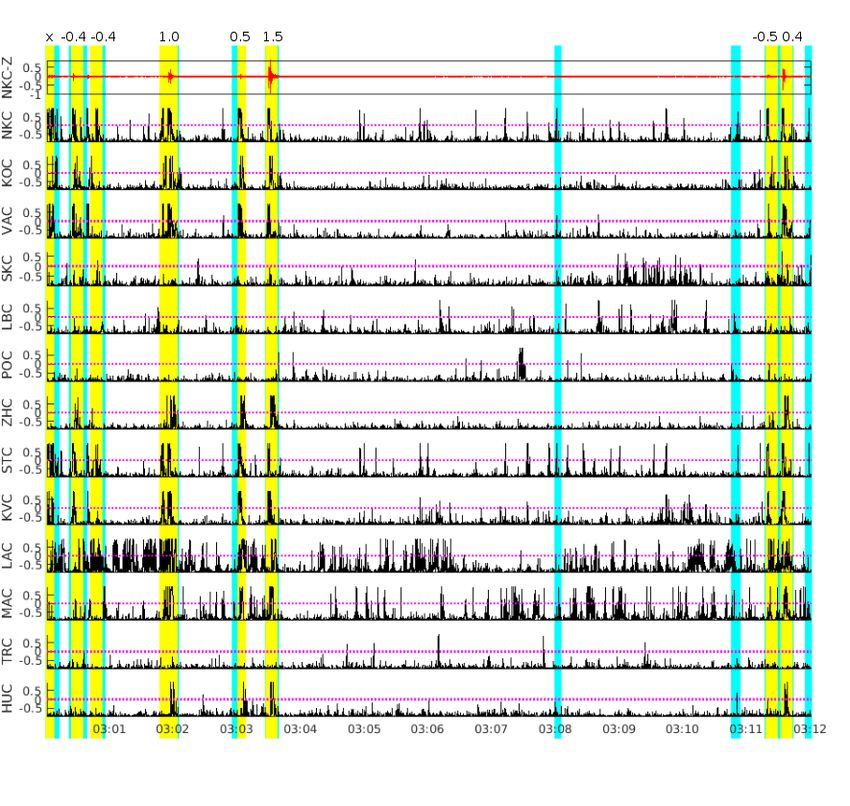
all data including ambient seismic noise and unnecessary disturbing or noise signals
to be available for re-processing and re-interpretation, when needed. The demand for
thorough processing of huge amount of data from local seismic networks WEBNET
and REYKJANET results from our ambition to explain the primary causes leading
to earthquake swarms in areas with completely different tectonic setting as West
Bohemia/Vogtland and the Reykjanes Peninsula in South-West Iceland.
    The West Bohemia/Vogtland seismogenic region is situated in the western part of
the Bohemian Massif, geographically in the border area between Czechia and Saxony
(Vogtland is a southern part of Saxony). It is a unique European intra-continental
area affected by Quaternary volcanism that exhibits simultaneous activity of var-
ious geodynamic processes. Seismic activity is manifested by repeated occurrence
of earthquake swarms, but the mainshock-aftershock sequences may rarely occur.
Persistent swarm-like seismicity clusters in a number of small epicentral zones that
are scattered in the area of about 40x60 km (see grey dots in Fig.2a). Larger swarms
(∼ ML > 2.5) cluster predominantly in the focal zone Nový Kostel which dominates
the recent seismicity of the whole region. The swarms usually consist of several thou-
sands of weak earthquakes and their duration is from several days to few months.
The depths of foci in the whole area range from 5 to 20 km (e.g. Horálek and Fis-
cher [2010]) but depths between 7 and 12 km are typical of earthquake swarms and
mainshock-aftershock sequences (Čermáková and Horálek [2015], Jakoubková et al.
[2018]). The region is well known by its fluid activity that is probably closely con-
nected with the local swarm-like seismicity (e.g. Horálek and Fischer [2008], Fischer
et al. [2017]). For summarizing information about the area in question refer to
Fischer et al. [2014].
    Reykjanes Peninsula is the onshore continuation of the mid-Atlantic Ridge that
separates two major lithospheric plates, the Eurasian Plate to the east and the
North American Plate to the west. The plate boundary on the Reykjanes Peninsula
is formed by pronounced en-echelon stepping rift segments and extends from the
southwest to the east and forms a pronounced oblique rift along the whole peninsula
in length of about 65 km (Sæmundsson and Einarsson [2014]). The plate motion
rate on the Reykjanes Peninsula is about 20 mm/yr in E–W direction and about
5 mm/yr perpendicular to it (Geirsson et al. [2010]). The Reykjanes Peninsula is a
highly complex geophysical structure with the interaction between volcanic and tec-
tonic activity (Sæmundsson and Einarsson [2014]), most of the Reykjanes Peninsula
surface is covered by lava. The Reykjanes Peninsula is one of the most seismically ac-
tive parts of Iceland, especially at the micro-earthquake level. Swarm-like sequences
and solitary events scattered along the plate boundary, both with magnitudes mostly
of ML < 3, represent a major part of seismicity on the peninsula. Prevailing depths of
the foci on the Reykjanes Peninsula are between 2 and 5 km which is much shallower
compared to the focal depths in West Bohemia/Vogtland.
    Both West Bohemia and Reykjanes Peninsula earthquake swarms usually con-
tain from thousands to tens of thousands events (ML > 0) which are necessary to
be processed to get insight into triggering mechanisms and driving forces of earth-
quake swarms. Manual processing of continual seismograms from the WEBNET (24
stations) and REYKJANET (15 stations) networks is extremely time-consuming,

                                          4
and therefore it is possible to process manually only stronger events. Consequently
many weaker events being recorded with a sufficient signal-to-noise ratio remain un-
touched. The automatic processing is the only way to achieve as low completeness
magnitude as possible which is essential for deeper insight into nature of earthquake
swarms.
3 Local seismic networks WEBNET and REYK-
JANET
Continuous data produced by local seismic network WEBNET and later on also
REYKJANET were the main motivation for whole this thesis. WEBNET local seis-
mic network deployed in West Bohemia earthquake-swarm region (latitude ≈ 49.8° N
to 50.7° N, longitude ≈12° E to 13° E) has a history of 30 years of monitoring micro-
seismicity, while REYKJANET operated on the Reykjanes Peninsula (SW Iceland,
latitude ≈ 63.8° N to 64.1° N, longitude ≈ 21.5° W to 22.3° W) dates back to 2013
only. Both networks are nowadays similar in many aspects. They have the same in-
strumental equipment, sampling frequency or spatial extent. The difference is that
all the WEBNET stations are operating with full data streaming through the Inter-
net, while the REYKJANET stations are still off-line. The WEBNET network has
generally lower noise than REYKJANET due to installation in deep vaults and com-
pact bedrock (compare the waveforms in Fig. 1). The stations of REYKJANET are
sited on the basement mainly formed by lava fields which is typical for the Reykjanes
Peninsula.
Seismicity in the West Bohemia/Vogtland region has been monitored by the
WEBNET network since 1991 (Institute of Geophysics [1991], Horálek et al. [2000],
Fischer et al. [2010]) and the present configuration of 24 broadband stations covers
an area of about 40x25 km (Fig. 2a). The network layout ensures proper areal and
azimuthal coverage of the focal area, particularly with respect to the main focal zone
Nový Kostel.
The REYKJANET stations were deployed on the Reykjanes peninsula in 2013
(Horálek [2013]) by the Institute of Geophysics and the Institute of Rock Structure
and Mechanisms of the Czech Academy of Sciences. The network consists of 15
broadband stations covering an area of 40x25 km similarly to WEBNET (Fig.2b).
All the stations so far operated in off-line regime in continuous mode are planned to
be upgraded to data streaming via Internet.
At present, the WEBNET and REYKJANET stations are equipped with Guralp
CMG-3ESPC seismometers and Nanometrics Centaur digitizers and record undis-
torted ground velocity in the range from 0.03 to 90 Hz with the sampling rate of
250 Hz.
5(a) Origin time: December 1, 2018, 18:10:40.916 UTC, depth d = 9.2 km
(b) Origin time: July 26, 2017,11:07:31.554 UTC, depth d = 2.5 km
Figure 1: Waveform examples for (a) WEBNET and (b) REYKJANET events with
local magnitude ML = 0.5 (epicenter denotes red asterisks in the insets) located in
the center of the seismic networks at depths characteristic of West Bohemia/Vogtland
and the Reykjanes Peninsula. Only vertical components of the ground-motion veloc-
ity filtered by bandpass of 1–40 Hz at 10 stations with the best signal-to-noise ratio
are depicted. All traces are scaled according to the maximum of absolute value of
displayed waveform. It is apparent that the noise is generally lower at the WEB-
NET stations and that the seismograms from the REYKJANET stations are more
complex with longer codas which makes their interpretation more demanding.
612.50
50.40
Legend 50.40
offline stations
online stations
events 1995-2015
50.20 50.20
KAC
12.50
(a)
(b)
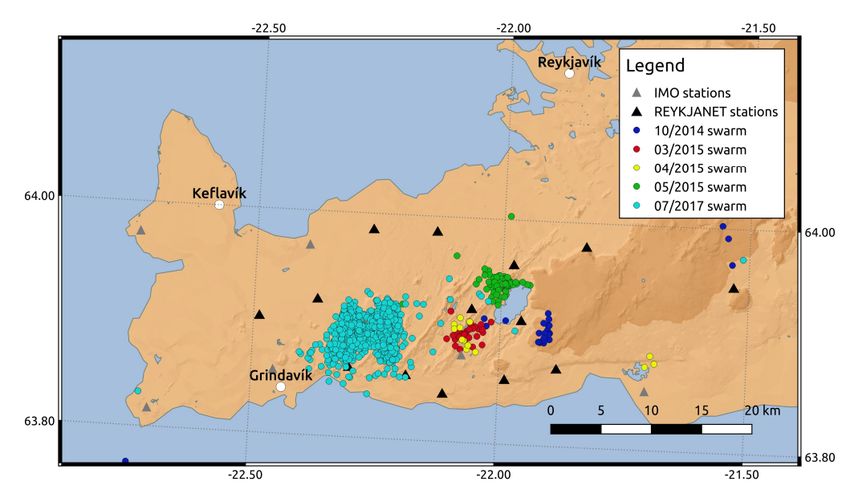
Figure 2: Maps of WEBNET and REYKJANET seismic networks: (a) WEBNET
network before upgrade in 2019. Red triangles denote on-line stations and blue trian-
gles denote off-line stations. The light grey dots represent epicenters of earthquakes
in the period 1995-2015, (b) Green triangles are the locations of REYKJANET net-
work stations. Yellow triangles are stations of the regional network SIL operated
by Icelandic Meteorological Office (IMO). One can see that REYKJANET network
is denser than the SIL network in the area of Reykjanes peninsula. The light grey
dots mark the epicenters of earthquakes according to IMO catalog (local magnitude
ML > 0.5) in the period 2013-2019.
74 Automatic event detection
4.1 Event detection methods and machine learning in seis-
mology
Seismic events, the useful part of seismic records for the most of seismological re-
search, occur in just a small fraction of total recorded time even in episodic periods of
increased seismic activity, for example, earthquake swarms. The target seismic events
recorded on seismic stations may differ in few orders of amplitude and they may have
fairly different shape and frequency content. Therefore, the classical STA/LTA or
other power-based detector detects also various disturbances and with the aim to
detect even weak earthquakes it results in a high number of false detections. Well-
performing detection algorithm minimizes false detections while preserving all im-
portant information, that is, all target seismic events. In our case we want to detect
only local events with completeness magnitude as low as possible. Such reduction of
data enables effective processing of events either manually or automatically.
Automatic processing of seismic events could be performed in different ways.
The first approach accords with the steps of manual processing. Initially, an event
must be detected, then the P- and S-phases are picked and the location of the event
is computed using those picks (as in Sleeman and van Eck [1999]). In the second
approach, a search is made for all possible P- and S-wave phases to combine them to
satisfy the events, which are subsequently located (Le Bras et al. [1994], Dietz [2002],
Fischer [2003]). During the third approach a search is made through all possible
hypocenters and if a concurrence of theoretical data with observed data is detected
the event is declared at tested hypocenter without phase onset picking (Withers
et al. [1999], Kao and Shan [2004]). We apply the first processing scheme which
begins with detecting an event. There are several methods of detection, which can be
sorted into the time domain methods, the frequency domain methods, particle motion
processing, and pattern matching (Withers et al. [1998]) or using a combination of
these approaches.
All groups of detection can be achieved through the Artificial Neural Networks
(ANN hereinafter) - machine learning algorithms inspired by the functionality of
the human brain. Several neural network concepts have been used for seismic event
detection (e.g. Wang and Teng [1995], Tiira [1999], Madureira and Ruano [2009],
Mousavi et al. [2018]).
PePin automatic location (Fischer [2003]) which is used routinely to process the
WEBNET data in near-real time applies polarization analysis to find candidate on-
sets of P- and S-wave phases which are then associated together to define events.
The algorithm naturally fails to correctly associate phases in case of complex wave-
forms (e.g. multiple events) which results in omitting some of the events which can
be sometimes of not negligible magnitude.
8Figure 3: Single i-th neuron with n inputs (from v1 to vn ), weight coefficients (from
wi1 to win ), adder with output hi = wij vj , activation function g(.) with output
P
Vi = g(hi ).
4.2 SLRNN concept
The advantage of ANN detection methods is the ease of adjusting parameters of
detection by training the ANN. Consequently, a detailed description of what are
common features for events, or on the other hand, what are the most significant
differences between events and disturbances, is not required. The Single Layer Re-
current Neural Network (SLRNN) consists of a set of m artificial neurons. The i-th
artificial neuron (Fig. 3) at moment t has an output value
n
Vi = g (1)
X
wij vj
j=1
where wij are weight coefficients of the neuron inputs, vj (t) are input values, Vi (t)
is an output value, and g(.) is an activation function. The activation function defines
a neuron activation behavior depending on the neuron’s weighted input. In this case
a widely used hyperbolic tangent is used (the neuron outputs are limited from -1 to
1).
The SLRNN is based on the Real Time Recurrent Network (RTRN, Williams and
Zipser [1989]) and the Nonlinear Autoregressive Neural Network (NARX, Narendra
and Parthasarathy [1991]). The structure of the Single Layer Recurrent Neural
Network is shown in Fig. 4.
Each SLRNN neuron has the following inputs:
VK (t − Dc ) j = 1, ..., nr ; K = 1, ..., m; c = 1, ..., d recurrent inputs
vj (t) = xi (t) j = nr , ..., n − 1; i = 1, ..., p inputs of the SLRNN
1 j=n constant value 1, bias
(2)
where m is the number of neurons, n is the number of inputs of each neuron
(n = p + nr + 1 ), p is the number of inputs of the SLRNN, nr = m · d is the
number of recurrent inputs, and d is the number of delay units Dc . As opposed to
the RTRN, which has one step delay between output and input, the delay in the
SLRNN is variable similar to the NARX. One output of neuron can be connected
to many inputs of neurons with different delays. Consequently, there can be more
recurrent inputs than neurons. An output of K-th neuron is delayed by D1 to Dd
steps and fed back as a part of the first nr inputs of the neurons. The use of delays
9Figure 4: Schema of SLRNN: p inputs of the network x1 , . . . , xp ; k outputs, which
are output of neurons V1 , . . . , Vk ; and m − k hidden neurons Vk+1 , . . . , Vm . Output
of each neuron is connected to d inputs delayed by the corresponding (Dc ) number
of cycles, c = 1, ..., d. D1 , . . . , Dd are delay units.
of more time steps allows remembering time relations longer compared to the RTRN
design (Wiszniowski et al. [2014]). Thus, the inputs from 1 to nr are the recurrent
ones, the inputs from nr + 1 to n − 1 are those of the whole network, and the n-th
input (also called bias) is connected to a constant value of 1. As opposed to the
NARX design, only a part of neural outputs (k) are outputs of the SLRNN. Other
hidden neurons allow building self-adapted time relations not controlled by expected
outputs.
The input data of the neural network must be preprocessed before it is used as
SLRNN inputs (Fig. 6). Original data is three component seismic records (N, north-
south; E, east-west; Z, vertical). First, the signals are filtered by a filter bank. It
consists of nine half-octave IIR filters with the narrow frequency bands of 0.6–1 Hz,
1–1.6 Hz, 1.6–2.5 Hz, 2.5–4 Hz, 4–6.3 Hz, 6.3–10 Hz, 10–16 Hz, 16–25√Hz, 25–40 Hz, see
Fig. 5. After filtration we compute a total horizontal component N 2 + E 2 . Then,
we calculate the STA/LTA ratios. The original sampling rate is then decimated to
5 Hz, thus the SLRNN works in 0.2 s time steps. The time step 0.2 s of our SLRNN
is a compromise between the acceptable computational load and a good separation
of individual waves.
Our SLRNN, designed for detection of small natural earthquakes in WEBNET,
consists of 8 neurons and 18 inputs. The feedback connections of the output of each
neuron are delayed by 1, 2, 4, and 8 time steps. Thus the neurons have 32 feedback
inputs, 18 inputs of the network, and 1 bias input. The 18 inputs come from a filter
bank of STA/LTA ratios. The outputs of the first three neurons, which are also
outputs of the SLRNN, correspond to: V1 —detection of event, V2 —detection of P
wave onset, and V3 —detection of S wave onset. This is achieved by adjusting the
weights wij during the training process. After successful training, the V1 output is
used for event detection, while the rest of the outputs (outputs of the hidden neurons
and phase detections) are used only as feedback. The detection outputs V2 and V3
cannot be used as pickers because of a long time step of the SLRNN being 0.2 s.
101
0.9
0.8
Frequency response [−]
0.7
0.6
0.5
0.4
0.3
0.2
0.1
0
0 1 2
10 10 10
Frequency [Hz]
Figure 5: Filter bank frequency response. Each half-octave filter filters out a narrow
frequency band from the input signal.
Filter Z 0.6-1 Hz vertical 0.6-1 Hz STA/LTA vertical
STA/LTA
bank 0.6-1 Hz
Z Z 25-40 Hz vertical 25-40 Hz ratios downsample
√
N 9x N 2 + E2
E half-octave E 0.6-1 Hz horizontal 0.6-1 Hz for each
freq. band STA/LTA horizontal 18x ANN
IIR filters inputs
E 25-40 Hz horizontal 25-40 Hz 25-40 Hz 50 x
Figure 6: Processing scheme of the SLRNN input data. Three-component raw seis-
mograms are processed into 18 SLRNN inputs.
114.3 The training process
A suitable training of an ANN is of key importance for proper performance of the
ANN, so that training of our SLRNN network is one of the most exacting tasks and
forms a significant part of my thesis.
We applied a supervised learning algorithm, which means that neuron weights
wij (408 weights in our case) are adjusted in order to get the best possible fit of
the real and required outputs of the SLRNN. It is achieved by minimizing the cost
function of real and required outputs. Consequently, the required outputs of the
network and the cost function E must be defined. The output of a well-trained
network ought to fall below a certain threshold during the occurrences of seismic
noise and disturbance, whereas it must significantly exceed the threshold during the
seismic local event. In our case, the threshold was zero. However, the detection is
not required to exceed the threshold at the beginning of the event. It can occur any
time during the event. It is not even recommended to exceed the threshold at the
beginning until, for example, secondary waves come. Otherwise, some disturbances
similar in shape to the P waves might generate detection. Therefore, the required
output is negative at the beginning of an event, whereas after the S onset the positive
output is strongly enforced. The error between required and real output is weighted
in order to ignore or emphasize the error. The cost function E for one waveform in
the training set is defined as a sum of output errors in the form:
3
E= ηi (t) [ζi (t) − oi (t)]2 , (3)
XX
t i=1
where ζi is the expected output of i-th neuron, ηi is the learning-error weighting
coefficient (learning coefficient hereafter) and oi is the real output of the SLRNN
(i = 1, 2, 3, corresponding to outputs V1 , V2 and V3 ). Time t is discrete in time
steps of the SLRNN which is 0.2 s in our case. Both ζ and η depend on the P
and S phases of the seismic event. The learning coefficient defines how sensitive
is the learning process of SLRNN to certain periods of the event waveform (Fig.
7). To improve generalization of the detection, we implemented the weight decay
regularization method (Hinton [1989]) into SLRNN learning. Then the cost function
is
3 m X
n
E=γ ηi (t) [ζi (t) − oi (t)]2 + (1 − γ) 2
(4)
XX X
wij .
t i=1 i=1 j=1
where the regularization parameter γ controls the extent to which the second
penalty term influences the cost function. The minimization is based on a gradient
of (4) according to the formula
∂E 3
∂oi (t)
= 2γ ηi (t) [ζi (t) − oi (t)] + 2 (1 − γ) wpq . (5)
XX
∂wpq t i=1 ∂wpq
The Back Propagation Through Time algorithm (Werbos [1990]) was chosen
to compute the gradient of cost function. The definition of the expected outputs
12Figure 7: Example of SLRNN learning on the ZHC station from the 8 Oct 2008
event with P- and S-wave onset picks, and a later event with S-wave pick only. a)
the seismic signal with marked phases, red - Z component, blue - N component,
green - E component, b) expected outputs of the SLRNN, red - event detection,
blue - P wave detection, green - S wave detection, c) learning coefficient, red - event
detection, blue - P wave detection, green - S wave detection.
ζ1 (t), ζ2 (t), ζ3 (t) (Fig. 7b) and learning coefficients η1 (t), η2 (t), η3 (t) (Fig. 7c) can be
found in detail in Doubravová et al. [2016].
The training data was divided randomly into an actual training set (80% of
data) and the validation set (20% of data). Each step of the training procedure
reduces the cost function of the training set and in addition computes the cost
function of the validation set, which is not used for training. As long as the cost
function of the training set and cost function of the validation set decrease, training
continues. When the cost function of the validation set starts to increase, the training
stops. This prevents over-training the network when it would perfectly detect the
training events but would not recognize other events well. Because of the strong
nonlinearity of the cost function, the training was performed numerous times with
different random initial neuron weights wij . For training the SLRNN we used data
from the earthquake swarms of 2008 and 2010. The 2008 data include thousands of
local swarm events with manually picked P- and S-wave onsets which are consistent
throughout the whole period. We chose randomly about one hundred events for
each station with various magnitudes, locations or focal mechanisms. Additionally,
a similar number of examples of disturbances and non-local events were needed. For
this purpose we chose the 2010 data because it exhibited low local seismicity without
13×10 -5 ZHC 09-Oct-2008 22:33:10 net 1
1 P S
a)
0
-1 ×10 -5
b) 1
0
-1 ×10 -5
1
c)
0
-1
P S
d) 1
0
-1
22:33:20 22:33:30 22:33:40 22:33:50 22:34:00 22:34:10 22:34:20 22:34:30
Figure 8: An example of one properly picked event and events not picked (before
and after the picked event). Seismogram (the ground velocity in m/s) from station
ZHC: (a) Z component with marked phases, (b) N component, (c) E component, (d)
detection signals: red – event detection, blue – P wave detection, green – S wave
detection.
earthquake swarms. We used manually classified quarry blasts, regional or teleseismic
events, disturbances by wind or storms and other unspecified disturbances. Major
problems in our training process are lacking picks which may be due to higher noise
masking onsets or to unclear P-wave onsets on stations lying near nodal planes of a
particular event, rarely due to a failure during the manual processing. When the P-
and S-wave picks are missing, the SLRNN network is forced to learn that the signal
is a disturbance, causing the training to act in just the opposite way. Additionally,
during the evaluation of network performance on the test set many right detections
not verified by manual picks are wrongly treated as false detections. To eliminate
this problem it was necessary to re-process manually both the training and test sets
several times to complete the P- and S-wave onset picks even if their right position
was not clear. An example of an unpicked event is shown Fig. 8. At least three
events were unpicked. They were detected by the SLRNN.
4.4 Multiple station detection
In order to reduce the number of false detections as well as the number of undetected
events due to higher signal-to-noise ratio we search for detection on other stations in
the network to confirm or discard the event detection. I designed a simple algorithm
that rejects all detections which are not accompanied by enough detections on other
14stations of the seismic network. The proposed algorithm first scans all detections
(detection output above zero) on all stations of the seismic network and checks if
there is a detection on a sufficient number of stations in the selected time window (we
set it to 5 s with respect the size of the WEBNET and REYKJANET networks). In
the next step we combine the detections together to make time intervals for events.
As a result we define time segments containing useful information. Thus, multiple
overlapping events, especially during a swarm, lead to one time interval containing
more events.
The number of stations, which are needed to declare an event, is closely related
to the number of false detections. Additionally, too many stations required might
cause loss of weaker events. Fig. 9 shows an example of a coincidence of four and
six stations and their comparison with the events detections performed manually
(by the experienced interpreter). If we compare the detection results of the four-
and six-station coincidence with a precise manual ones, it can be seen that the six-
station coincidence detects all the manually identified events correctly while four-
station coincidence detects also false events or events which are not interpretable.
Moreover, four station coincidence detecting more events which merge into a wave
train produce longer time window for detections of the events (broader stripes in Fig.
9). Two clearly separated event detections in six-station coincidence may merge into
one longer event detection in case of four-station coincidence. For both networks the
coincidence of six stations seems to be the best option.
4.5 Application to WEBNET and REYKJANET seismo-
grams
The WEBNET data are first processed by the PePin software (Fischer [2003]) pro-
viding automatic locations in near-real time which are sufficient for preliminary in-
terpretations. The events located by PePin are then re-interpreted by manual pro-
cessing. In order to get good location residuals, the PePin software is set up to
use only eight nearest stations around the Nový Kostel focal zone (the central part
of the network) which contains more than 90 percent of the total seismic moment
released in the whole seismoactive area since 1991 Jakoubková et al. [2018]). This
unfortunately may result in omitting events outside the main focal zone. During
November–December 2018 we compared in detail all event detections by the SLRNN
with precise manual readings and with the PePin results. In this period the local
seismicity was extremely low with maximum magnitude MLmax = 1.3. We took
into account only events with magnitude above ML = −0.5, which resulted in 183
events. The results of our analysis are displayed in Fig. 10a. There are 106 events
of ML > −0.5 successfully detected by both SLRNN and PePin (red circles in Fig.
10a), 73 events were successfully detected by the SLRNN only (they are missing in
the PePin catalog, yellow circles in Fig. 10a), and four events missing in the SLRNN
list were successfully located by PePin (green circles in Fig. 10a).
It is worth mentioning that significant part of the undetected events by the PePin
algorithm are located outside the main focal zone of Nový Kostel. The six-station
coincidence, which we found to be an optimum for the West Bohemia/Vogtland
15Figure 9: Example of the detection coincidence for four (cyan) and six (yellow)
WEBNET stations. In case of concurrent event detection by four and six station
coincidence the cyan stripes are overlaid by the yellow ones. Red trace above is the
vertical component of seismogram from NKC station from 2018 August 24 3:00–3:12
UTC. All events in yellow were also detected manually, magnitudes ML (from -0.5 to
1.5) are given above the yellow stripes. The first detected event in the seismogram is a
multiple event consisting of several weak overlapping events, therefore the magnitude
is not assigned (x sign is printed instead). Note the end of the record where two
yellow events merge into one longer cyan event.
16earthquake-swarm region, results in omitting four events which were located both
manually and by PePin; all four undetected events have magnitude MLmax ≈ −0.5.
If we use four-station coincidence then all manually located events are successfully
detected by the SLRNN but the number of event detections increase significantly.
A potential ANN trained on the South-West Iceland data from REYKJANET
poses quite a big problem because of the absence of complete catalogs/bulletins from
the REYKJANET network which would be necessary to train the ANN. It is because
of the REYKJANET recordings that have not been fully processed in detail like the
WEBNET ones. To create relevant bulletins from the REYKJANET stations by
manual processing of continuous recording would be extremely time-consuming, re-
quiring an experienced specialist. Consequently, we mostly use the catalogs of a
regional Icelandic network SIL provided by Icelandic Meteorological Office (IMO)
for the REYKJANET-data analysis. Therefore, an application of the SLRNN net-
work trained for the West Bohemia/Vogtland data (WEBNET) to data from South-
West Iceland (REYKJANET) has been a challenging task. I used one of the best-
performing SLRNNs as tested for WEBNET and applied it to the REYKJANET
data. Since the deployment of the REYKJANET network in 2013, the seismicity on
the Reykjanes Peninsula has typically been on a micro-earthquake level (magnitudes
ML < 3) except two earthquake swarms in October 2013 (which occurred on the
tip of the peninsula out of the REYKJANET network immediately after putting the
stations into operation) with MLmax = 4.8 and in July 2017 with MLmax = 3.9, and
few weaker swarm-like episodes with magnitudes up to MLmax = 3.5. We analyzed
in detail the detection results for
(i) four weak swarm-like activities from the period 2014–2015,
(ii) an intensive MLmax = 3.9 swarm of July 2017 and
(iii) scattered background seismicity on the Reykjanes Peninsula in June 2017
The SIL catalog is the primary reference for evaluation of the SLRNN-detection
results for both (i) and (ii). Besides, we used a catalog of the event detections
produced by PePin algorithm and Antelope software package (by Boulder Real Time
Technologies, Ltd.) that were applied to the REYKJANET data (i), and a detailed
bulletin of the 2017 swarm containing manual onset picks from all the REYKJANET
stations.
(i) First, we compared the total number of detected events by the SIL processing
at IMO, PePin algorithm, Antelope software and SLRNN in the individual weak
activities (see Fig. 11). The number of events detected by SIL, PePin and Antelope
is comparable for all the activities, while the number of detected events by the
SLRNN is about five times higher. We manually checked one of the activities with
a reasonable number of events—the mini-swarm of the 2015 March 31 (Fig. 12).
Inspecting the events manually, we found out none of the ‘catalogs’ (SIL, Antelope
and PePin) to have been a complete subset of another one; each catalog contained
some unique events which were missing in the other two catalogs. By combining
the SIL, PePin and Antelope catalogs we obtained 51 real events with minimum
magnitudes ML ≈ 0. Our SLRNN detected all of them and in addition to that
about three times more weak events. But many of the small detected events are
unsuitable for further processing because locating of such events would be unreliable
17(a)
(b)
Figure 10: Results of SLRNN application to WEBNET and REYKJANET data.
(a) Detection of local events during November and December 2018 in West Bo-
hemia/Vogtland. Red circles – events located manually and by PePin and also de-
tected by SLRNN, yellow circles – events located manually and detected by SLRNN
(not located by PePin), green circles – events located manually and by PePin (not
detected by SLRNN). (b) Analyzed seismic activities on the Reykjanes Peninsula.
Blue circles – 2014 October 30–31 (MLmax = 2.8), red circles – 2015 March 31
(MLmax = 2.2), yellow circles – 2015 April 28–30 (MLmax = 1.6), green circles – 2015
May 29–30 (MLmax = 3.5), cyan circles – 2017 July 26–28 (MLmax = 3.9).
18Figure 11: Number of detected events in analyzed micro-swarms on the Reykjanes
Peninsula.
due to unclear P- and S-wave onsets.
(ii) A prominent earthquake swarm in July–August 2017 MLmax = 3.9 was fairly
rapid. Most of the seismic moment released during 2 days from July 26 to 28 (Jak-
oubková [2018]), more than 1500 ML > 0 events have been listed in the SIL catalog
for these days. We concentrated on 1 hr of the swarm activity on July 26, from
11:00 to 12:00 UTC, that included the second strongest earthquake of the swarm
(ML = 3.7). This segment contains both calm and turbulent phase of the swarm.
We performed detailed manual processing of the continuous seismograms with the
assistance of an experienced expert who found 441 events in total out of which 281
were reliably located with magnitude above ML > 0. Then we compared the man-
ually obtained events with detections provided by the SLRNN and with the list of
events in SIL catalog (Fig. 13). All of the manually picked events were correctly
detected by the SLRNN and only one false SLRNN detection was found.
(iii) In order to prove the SLRNN ability to detect various local events on the
whole Reykjanes Peninsula we selected a time segment containing scattered back-
ground non-swarm seismicity only. We selected one week, 2017 June 6–12, where
the seismic events included in the SIL catalog were scattered in the whole area cov-
ered by the REYKJANET network. The SLRNN detected 183 events, 34 events of
which had been listed in the SIL catalog and no event present in SIL catalog was
missed. By manual processing of the waveforms we were able to confirm reliably 37
new events which we located and for which we estimated ML ranging from -0.5 to
1.3 (30 above ML = 0). Remaining 112 events were mostly unfit for location due
to insufficient number of clear P- and S-wave onset picks or they were real events
hidden in ambient noise, and probably some of them were also false alarms.
19Figure 12: Detailed examination of the SLRNN detection results and the SIL, An-
telope and PePin catalogs for mini-swarm of 2015 on the Reykjanes Peninsula. The
diagrams represent the individual catalogs; from top to bottom: SIL, Antelope and
PePin. Each column in the individual diagrams denotes a particular event in the
respective catalog (thus the number of columns in each diagram equals to the num-
ber of events in the catalog). The events in the SIL and PePin diagrams are ordered
according to magnitudes ML given in the SIL and PePin catalogs from the strongest
(on the left) to the weakest one (on the right); the events in the Antelope diagram
are sorted according to the origin time. The rows in the diagrams denote events
which are included (green cells)/missing (red cells) in the remaining three catalogs
(indicated on the right). Note that the each catalog (SIL, Antelope and PePin)
contains some events detected only by ANN and missed in the other two catalogs.
Figure 13: Comparison of the SLRNN detection results with the SIL and manual
REYKJANET catalog for 1 hr period of a larger 2017 swarm on the Reykjanes
Peninsula. High rate seismicity in the time window of 2017 July 26, 11:00 to 12:00
UTC, is examined. The diagram represents a comparison of the SLRNN results and
SIL catalog with the REYKJANET catalog (281 ML >0 events) created manually
by an experienced interpreter. The events are sorted according to the origin time.
205 Seismon_WB
Seismon_WB is a software which enables the interpreters to work with seismic data
comfortably using graphical user interface (GUI). The experts in seismic-data pro-
cessing and analyses do not need programming skills or heavy training to work with
this user-friendly intuitive software. On the other hand anyone can develop new
functions directly using MATLAB.
Seismon_WB is a modification of software Seismon created by Stefan Mertl in
MATLAB (Mertl and Hausmann [2009]), in 2011 the original Seismon started to be
rewritten in Python under a new name pSysmon (http://www.mertl-research.at/
projects/psysmon/). The original program Seismon was designed as an universal
tool for seismic experiments. For that purpose it consists of various tools and modules
that can be adapted and developed by the users. The main advantage of that software
is the close connection with the MySQL database. The database enables to store
the results, network configuration, information about instruments used on particular
stations at specific time and a list of available waveform files and the description of
their contents. Well organized database is very important property of a software
used for routine processing. But original Seismon did not meet all the requirements
for routine processing of continual recordings from the WEBNET stations. It was
therefore necessary to change many tools, often the whole behavior of the software
and develop number of new modules to satisfy specific needs for the WEBNET data
processing. This way I developed a new branch of Seismon differing significantly from
the former one, which we started to call Seismon_WB (Seismon for the WeBnet data
processing).
Seismon_WB replaced an obsolete program Seisbase (Fischer and Hampl [1997])
in 2013 and became the main processing tool for WEBNET data. Before introducing
the Seismon_WB in daily routines for the WEBNET data we took care to ensure
a compatibility with Seisbase and thus to preserve the consistency of the results
over the years. The behavior of Seismon_WB has been adapted to work similar to
Seisbase in order to be comfortable for the interpreters used to the former program.
Seisbase targeted to WEBNET data from the beginning was equipped with many
useful functions making a primary seismogram processing and data analyses more
effective. However, Seisbase was unable to handle miniSEED file format, continuous
records in general and it gradually became complicated to run this DOS-based soft-
ware on new computers. I consulted the most common steps in routine work with
the experienced interpreters and modified the program to be as helpful as possible
for the users. That resulted in fairly comfortable software which on contrary lost
some of its original universality. Seismon_WB has been used in continuous regime
from September 2014.
The Fig. 14 shows the data flow around Seismon_WB. The program itself serves
as an interface for the user that enables to access and process various data sets and
to call external programs. The primary storage is MySQL database mainly accessed
by Seismon_WB but it could be also fed by external programs. Most of the external
programs used for data interpretation (location, moment tensor inversion etc.) are
called by Seismon_WB and their results are saved to the database by Seismon_WB
21External External
programs programs
user
MySQL DB Seismon WB
Archive DB
Figure 14: Seismon interaction scheme. The user interacts with Seismon_WB soft-
ware to access the database and external programs. The archive data exported from
Paradox database can be converted to MySQL database tables with Seismon_WB
structure using specific packages of Seismon_WB itself.
itself. The Archive DB block represents the export from Paradox database (formerly
used by Seisbase) which can be converted to MySQL Seismon structure using specific
Seismon_WB package of functions. This is one of the features that enabled the
compatibility between Seismon_WB and Seisbase.
Seismon is designed as a modular software in order to be highly flexible and
effective. The task that needs to be performed is achieved by a sequence of mod-
ules, which are functional units performing particular operation. An ordered set
of modules is called a collection; typically each user defines few such collections for
his/her own needs. The basic objects and philosophy of original Seismon were mostly
preserved, although I developed many new modules and modified the most of the
existing ones.
Seismon is equipped with modules for viewing, modifying and exporting the
database, working with events, data files and waveforms. Some modules are stand-
alone, others need to be preceded or succeeded by another module, some modules are
editable and by setting the parameters we define the input arguments of the module
function. The parameters are set by using dialog windows.
In fact the automatic processing as a part of Seismon_WB itself or as an external
program can be used at any stage of the processing and the visual inspection of
automatic procedures can be comfortably supervised using Seismon_WB.
The program is written in MATLAB which offers advantages of well documented
toolboxes and functions easy to use. Due to limits of free MATLAB software spread-
ing I also created standalone version of Seismon_WB, that can be run without
MATLAB license.
Seismon_WB can be generally used on Windows, Linux and MAC platforms,
however only Windows and Linux versions have been tested.
22The development of the Seismon_WB software is still continuing adapting to
new requirements of the users for new or improved functionality, the compatibility
with up-to-date version of MATLAB is consistently maintained.
6 Conclusion
Dense local seismic networks WEBNET and REYKJANET contribute to detailed
studies of the seismic swarms dynamics, earthquake source and local structure of the
Earth’s crust. Without the automatic and semi-automatic processing of the seismic
networks WEBNET and REYKJANET it would be impracticable to process the
measured data in a full extent. My thesis consists of two parts: (i) Seismon_WB
- a software for interactive data processing that enables also to control automatic
and semi-automatic processing; and (ii) SLRNN detector of seismic events which is
the fundamental step in automatic seismic data processing. The design, training,
detailed testing and implementation of the SLRNN form a core part of this doctoral
thesis and is described in detail in two attached papers.
(i) First, I needed to concern the comfortable way to manually process the seismic
data. I contributed extensively to a development of new software used by the WEB-
NET working group by modifying, extending and debugging an existing Seismon
project. As a result Seismon_WB is an exclusive processing tool for all the rou-
tines applied to WEBNET (and REYKJANET) data since 2013. Not only classical
manual processing is achieved by Seismon_WB but also an evaluation and check of
automatic procedures applied. Nevertheless, the tuning and development of the soft-
ware still continues. Although the software development is strictly practical result
with very low direct scientific impact, it is an essential prerequisite for high quality
processing of seismic data provided by the WEBNET group.
(ii) Next, the detection algorithm has been developed, tested and introduced into
practice. We designed a new artificial neural network concept and successfully ap-
plied it not only to WEBNET data used for training the neural network but also
to data from REYKJANET network. The trained SLRNN is nowadays routinely
used to detect events in recordings of local seismic networks WEBNET and REYK-
JANET.
The main results and lessons learned from the SLRNN may be summed up as
follows:
• The SLRNN architecture is suitable for seismic event detection and eight neu-
rons proved to be sufficient. The higher number of neurons does not improve
the performance significantly as the training demands rise considerably. The
detection performance is enhanced by coincidence in the network.
• The training data must be prepared with special care, missing P- and S-wave
onset picks (especially if both are missing) complicate the proper training giving
bad examples during the training. Even rough picks of noisy events helped the
training significantly.
23• The training using gradient-based methods requires many trials to repeat to
find the optimum result. To evaluate the real detector performance, the sensi-
tivity, specificity and precision quantities must be used. To check the detection
results properly a lot of manual work is needed, because many of the SLRNN
detections are low-magnitude events which are often missing in available cata-
logs.
• It is impossible to achieve good results with low completeness magnitude using
one station detection. For fine result a coincidence in the network of seismic
stations must be used. Six stations coincidence is a reasonable choice for both
WEBNET and REYKJANET local seismic networks.
• Well-trained network can be successfully used for different region and a partly
different types of waveforms. This is the generalization property of a neural
network and the successful applicability of the detector trained on WEBNET
data to REYKJANET data is an exemplary utilization of that.
In the near future there is a potential to use our neural network to pre-process data
of the NEFOBS (Near Fault Observatory) deployed in the West Bohemia/Vogtland
region consisting of four broad-band seismometers placed in shallow boreholes (≈
400 m deep) drilled within ICDP project Drilling the Eger Rift (more on https:
//www.icdp-online.org/projects/world/europe/eger/ or Dahm et al. [2013])
supplemented with 3-D seismic arrays. The expected significantly larger amount of
high-frequency micro-events (with local magnitudes as low as ML ≈ −2) might be
successfully detected by our SLRNN.
The event detection is a starting point in the data processing chain for both
automatic and manual processing. Its quality affects the whole processing results. I
believe, I proved that the presented method provides high quality detections suitable
for effective post-processing and thus high-quality investigation of the seismicity of
the West Bohemia/Vogtland as well as South-West Iceland and potentially any other
seismically active region.
Bibliography
H. Čermáková and J. Horálek. The 2011 West Bohemia (Central Europe) earth-
quake swarm compared with the previous swarms of 2000 and 2008. Journal of
Seismology, pages 1–15, 2015. ISSN 1383-4649. doi: 10.1007/s10950-015-9502-3.
URL http://dx.doi.org/10.1007/s10950-015-9502-3.
T. Dahm, P. Hrubcová, T. Fischer, J. Horálek, M. Korn, S. Buske, and D. Wagner.
Eger rift ICDP: an observatory for study of non-volcanic, mid-crustal earthquake
swarms and accompanying phenomena. Scientific Drilling, 16:93–99, 2013. doi:
10.5194/sd-16-93-2013. URL https://www.sci-dril.net/16/93/2013/.
L. Dietz. Notes on configuring BINDER_EW: Earthworm’s phase associator, 2002.
URL http://www.isti2.com/ew/ovr/binder{_}setup.html.
24J. Doubravová, J. Wiszniowski, and J. Horálek. Single layer recurrent neural
network for detection of swarm-like earthquakes in W-Bohemia/Vogtland - the
method. Computers & Geosciences, 93:138 – 149, 2016. ISSN 0098-3004. doi:
https://doi.org/10.1016/j.cageo.2016.05.011. URL http://www.sciencedirect.
com/science/article/pii/S0098300416301327.
T. Fischer. Automatic location of swarm earthquakes from local network data. Studia
Geophysica et Geodaetica, 47(1):83–98, 2003. ISSN 0039-3169. doi: 10.1023/A:
1022251605990. URL http://dx.doi.org/10.1023/A%3A1022251605990.
T. Fischer and F. Hampl. SEISBASE - Principles of a Program and Database for
Routine Analysis of Data from Local Seismic Networks, Version 4.7. Acta Montana,
Ser. A(11):15–34, 1997.
T. Fischer, J. Horálek, J. Michálek, and A. Boušková. The 2008 West Bohemia
earthquake swarm in the light of the WEBNET network. Journal of Seismology,
14(4):665–682, 2010. ISSN 1383-4649. doi: 10.1007/s10950-010-9189-4. URL
http://dx.doi.org/10.1007/s10950-010-9189-4.
T. Fischer, J. Horálek, P. Hrubcová, V. Vavryčuk, K. Bräuer, and H. Kämpf.
Intra-continental earthquake swarms in West-Bohemia and Vogtland: A review.
Tectonophysics, 611:1 – 27, 2014. ISSN 0040-1951. doi: https://doi.org/10.1016/
j.tecto.2013.11.001. URL http://www.sciencedirect.com/science/article/
pii/S0040195113006458.
T. Fischer, C. Matyska, and J. Heinicke. Earthquake-enhanced permeability - evi-
dence from carbon dioxide release following the ML 3.5 earthquake in West Bo-
hemia. Earth and Planetary Science Letters, 460:60–67, 2017.
H. Geirsson, T. Árnadóttir, S. Hreinsdóttir, J. Decriem, P.C. LaFemina, S. Jóns-
son, R.A. Bennett, S. Metzger, A. Holland, E. Sturkell, T. Villemin, C. Völksen,
F. Sigmundsson, P. Einarsson, M.J. Roberts, and H. Sveinbjörnsson. Overview of
results from continuous GPS observations in Iceland from 1995 to 2010. Jökul, 60:
3–22, 2010.
G. E. Hinton. Connectionist learning procedures. Artificial Intelligence, 40:185 –
234, 1989. doi: http://dx.doi.org/10.1016/0004-3702(89)90049-0. URL http:
//www.sciencedirect.com/science/article/pii/0004370289900490.
J. Horálek. Reykjanet, 2013. URL http://www.fdsn.org/networks/detail/7E_
2013/.
J. Horálek and T. Fischer. Role of crustal fluids in triggering the West Bo-
hemia/Vogtland earthquake swarms: Just what we know (a review). Studia
Geophysica et Geodaetica, 52(4):455, Feb 2008. ISSN 1573-1626. doi: 10.1007/
s11200-008-0032-0. URL https://doi.org/10.1007/s11200-008-0032-0.
J. Horálek and T. Fischer. Intraplate earthquake swarms in West Bohemia/Vogtland
(Central Europe). Jokull, 60:67–88, 2010.
25You can also read