Analysis of properties of the 19 February 2018 volcanic eruption of Mount Sinabung in S5P/TROPOMI and Himawari-8 satellite data - DLR
←
→
Page content transcription
If your browser does not render page correctly, please read the page content below
Nat. Hazards Earth Syst. Sci., 20, 1203–1217, 2020
https://doi.org/10.5194/nhess-20-1203-2020
© Author(s) 2020. This work is distributed under
the Creative Commons Attribution 4.0 License.

Analysis of properties of the 19 February 2018 volcanic eruption of
Mount Sinabung in S5P/TROPOMI and Himawari-8 satellite data
Adrianus de Laat1 , Margarita Vazquez-Navarro2,a , Nicolas Theys3 , and Piet Stammes1
1 KNMI,   De Bilt, 3731 GK, the Netherlands
2 DLR,  Oberpfaffenhofen, 82234 Weißling, Germany
3 Royal Belgian Institute for Space Aeronomy (BIRA-IASB), Brussels, 1180, Belgium
a currently at: EUMETSAT, Darmstadt, Germany

Correspondence: Adrianus de Laat (laatdej@knmi.nl)

Received: 4 July 2019 – Discussion started: 2 August 2019
Revised: 27 March 2020 – Accepted: 31 March 2020 – Published: 4 May 2020

Abstract. This study presents an analysis of TROPOMI            tively, SO2 > 10). The presence of ice in volcanic ash clouds
cloud heights as a proxy for volcanic plume heights in the      is known to prevent the detection of volcanic ash clouds
presence of absorbing aerosols and sulfur dioxide for the       based on broadband geostationary satellite data. TROPOMI
19 February 2018 eruption plume of the Sinabung volcano         does not suffer from this effect and can provide valuable
on Sumatra, Indonesia.                                          and accurate information about volcanic ash clouds and ash
   Comparison with CALIPSO satellite data shows that all        top heights in cases where commonly used geostationary IR
three TROPOMI cloud height data products based on oxygen        measurements of volcanic ash clouds fail.
absorption which are considered here (FRESCO, ROCINN,
O22CLD) provide volcanic ash cloud heights comparable
to heights measured by CALIPSO for optically thick vol-
canic ash clouds. FRESCO and ROCINN heights are very            1   Introduction
similar, with the only differences for FRESCO cloud top
heights above 14 km altitude. O22CLD cloud top heights un-      Monitoring airborne volcanic ash is of crucial importance for
surprisingly fall below those of FRESCO and ROCINN, as          aviation planning, as volcanic ash is an environmental hazard
the O22CLD retrieval is less sensitive to cloud top heights     that can cause damage to avionics systems, abrasion of ex-
above 10 km altitude. For optically thin volcanic ash clouds,   posed airframe parts, engine damage, and even engine fail-
i.e., when Earth’s surface or clouds at lower altitudes shine   ure (Prata and Rose, 2015). From the early 1980s onwards
through the volcanic ash cloud, retrieved heights fall below    there have been several well-documented damaging encoun-
the volcanic ash cloud heights derived from CALIPSO data.       ters of (jet) aircraft with volcanic ash clouds. Since then, avi-
   Evaluation of corresponding Himawari-8 geostationary in-     ation authorities have set up working groups and task forces
frared (IR) brightness temperature differences (1BTs) – a       to develop guidelines, procedures, and rules on what to do in
signature for detection of volcanic ash clouds in geostation-   case of known or predicted volcanic ash (i.e., ICAO, 2012).
ary satellite data and widely used as input for quantitative    The advance of satellite remote-sensing techniques in the
volcanic ash cloud retrievals – reveals that for this partic-   early 2000s allowed for real-time global monitoring of vol-
ular eruption the 1BT volcanic ash signature changes to         canic eruptions and airborne volcanic ash and sulfur dioxide
a 1BT ice crystal signature for the part of the ash plume       (SO2 ), like the Support to Aviation Control Service – SACS
reaching the upper troposphere beyond 10 km altitude sev-       (http://sacs.aeronomie.be, last access: 24 April 2020; Brenot
eral hours after the start of the eruption and which TROPOMI    et al., 2014) – or the NOAA/CIMSS Volcanic Cloud Mon-
clearly characterizes as volcanic (SO2 > 1 DU – Dobson units    itoring platform (https://volcano.ssec.wisc.edu/, last access:
– and AAI > 4 – absorbing aerosol index – or, more conserva-    24 April 2020). Nevertheless, in 2010, an eruption of the
                                                                Icelandic volcano Eyjafjallajökull resulted in the closure of

Published by Copernicus Publications on behalf of the European Geosciences Union.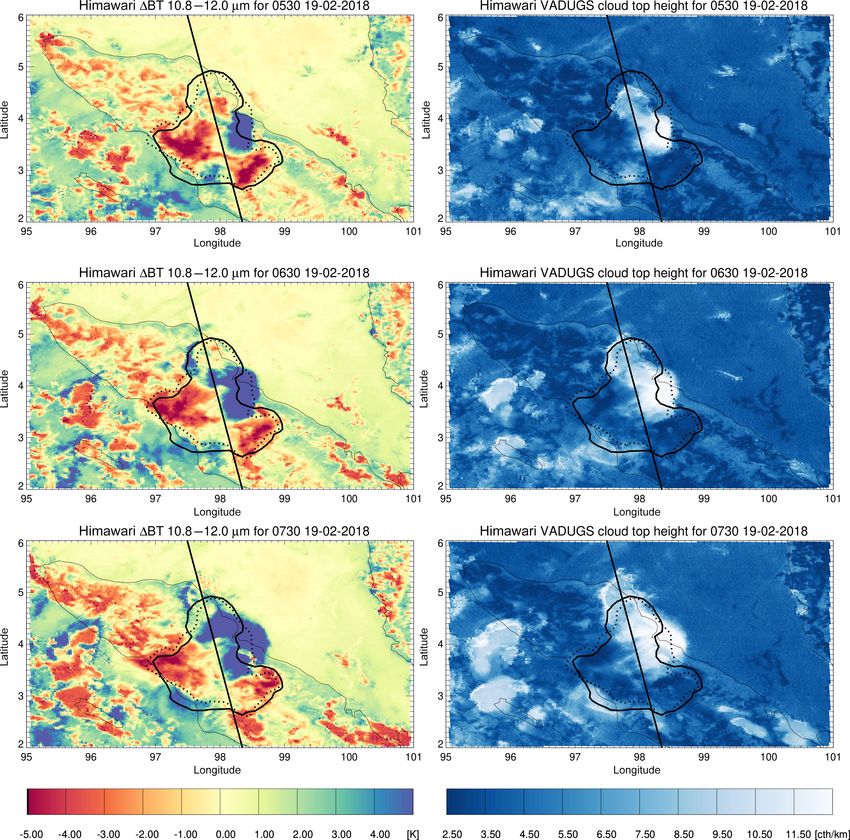
1204                                           A. de Laat et al.: Satellite data analysis of February 2018 Sinabung eruption

most of the European airspace, stranding more than 8.5 mil-        legacy provided by the satellite instruments OMI and SCIA-
lion people and profoundly affecting commerce (Alexan-             MACHY. Already a few weeks after launch, TROPOMI
der, 2013). The total economic damage was estimated at             started to provide promising high-spatial-resolution mea-
USD 2.2 billion (Oxford Economics, 2010). In the aftermath         surements (down to 3.5 km×7 km) of SO2 , the AAI, and
of the 2010 eruption of Eyjafjallajökull, aviation authorities     cloud heights from various retrieval algorithms (FRESCO,
were quick to realize that aviation guidelines for volcanic ash    O22CLD, ROCINN).
avoidance were too strict. Since then, guidelines have been           Compared to its predecessors, TROPOMI provides mea-
updated (ICAO, 2012), allowing for more flexibility for air-       surements with a better signal-to-noise ratio and much bet-
craft to maneuver around volcanic ash clouds and giving air-       ter spatial resolution (factor 10 or more, depending on the
liners more responsibility. Furthermore, it was also recom-        satellite that it is compared with). This allows for a much
mended to further develop global real-time volcanic eruption       better and more detailed characterization of volcanic ash and
and services monitoring volcanic ash clouds. Ongoing pro-          SO2 plumes. Furthermore, due to a better spatial resolution
grams by ICAO and WMO continue to work on improving                and better instrumental signal-to-noise ratio, TROPOMI is
volcanic ash cloud satellite data products that can be used        expected to provide improved height retrievals of volcanic
for real-time monitoring of volcanic eruptions and volcanic        ash clouds and volcanic SO2 , important for parameter moni-
ash clouds as well as for tactical and strategic flight planning   toring purposes (WMO, 2015).
(ICAO, 2012; WMO, 2015, 2017).                                        On 19 February 2018, at 08:53 local time, the Indonesian
   However, despite the clear need for constant monitoring of      volcano Mount Sinabung on Sumatra generated a dark grey
volcanic eruptions and volcanic ash clouds, and despite the        plume with a high volume of ash that quickly rose to an es-
availability of a wide variety of satellite remote-sensing data    timated 15–17 km a.s.l., according to the Darwin Volcanic
products to meet that particular need, a centralized facility to   Ash Advisory Centre (VAAC). Ash plumes were identified
access and analyze all available remote-sensing data on vol-       in satellite images, recorded by webcams and smartphones,
canic eruptions and volcanic ash clouds is still lacking. This     and widely shared on social media, also because of the time
strongly hampers integration of that information into aviation     of the eruption (early morning) and the clear skies at that
operations. As a consequence, volcanic eruptions continue to       time. The event was possibly the largest since the beginning
pose a larger-than-necessary risk for aviation.                    of the current episode of unrest at Sinabung, which started
   In order to fill this information gap, the European Union       in September 2013 (https://volcano.si.edu/volcano.cfm?vn=
funded the EUNADICS-AV project by the European Union’s             261080, last access: 1 February 2019; Eruptive History).
Horizon 2020 research program for “Societal challenges –              Mount Sinabung is located in Karo Regency, North
smart, green and integrated transport”. The main objective of      Sumatra Province (03◦ 100 N, 98◦ 23.50 E), with a height of
EUNADICS-AV is “to close the significant gap in European-          2460 m a.s.l. (Hendrasto et al., 2012; Primulyana et al., 2017;
wide data and information availability during airborne haz-        Global Volcanism Program, 2013). The stratovolcano had
ards”. Volcanic ash clouds are one of those airborne hazards.      been dormant for more than 1200 years before it became ac-
An important aspect of EUNADICS-AV is to verify how well           tive again in 2010, and especially since 2013 small eruptions
various satellite instrument are capable of monitoring vol-        have occurred regularly.
canic eruptions and volcanic ash clouds and how to integrate          The 19 February 2018 Sinabung eruption provides one
various satellite data products aboard a variety of satellites.    of the first possibilities to study the quality of TROPOMI
This requires integrated analyses of volcanic ash clouds with      data for volcanic cloud monitoring, also because there was
the current suite of satellites and remote-sensing data.           a fortunate overpass of the CALIOP instrument on the
   For more than a decade, satellite instruments such as           CALIPSO satellite. CALIPSO was part of the A-train con-
SCIAMACHY, OMI, GOME-2, OMPS, AIRS, and IASI                       stellation, which consists of several Earth-observing satel-
have been used to monitor volcanic eruptions in support of         lites that closely follow one another, crossing the Equator
aviation. Measurements of SO2 and the absorbing aerosol            in an ascending (northbound) direction at about 13:30 lo-
index (AAI) are currently provided in near-real time (within       cal solar time, within seconds to minutes of each other along
3 h after the satellite spectral measurements) to the aviation     the same or a very similar orbital “track”. The TROPOMI
community via the SACS web portal, which builds on the             Equator-crossing time is comparable to those of satellites in
TEMIS project, that in 2003 provided the first web-based           the A-train constellation. Note that after an orbital maneu-
service that allowed browsing and downloading atmospheric          ver in September 2018, CALIPSO has not been a part of the
satellite data products, also funded by the ESA.                   A-train constellation.
   On 13 October 2017, the ESA successfully launched the              In this paper, we evaluate satellite measurements of the
TROPOMI instrument as the single payload of the ESA’s              19 February 2018 Sinabung eruption, with a particular fo-
S5P satellite (Veefkind et al., 2012). TROPOMI is a grat-          cus on determining volcanic ash cloud heights combining
ing spectrometer that measures Earth-reflected radiances in        TROPOMI AAI data with TROPOMI cloud height data. We
the ultraviolet (UV), visible, near-infrared (NIR), and short-     also characterize the volcanic eruption plume in TROPOMI
wave infrared (SWIR) parts of the spectrum, building on the        data as well as compare TROPOMI data with geostation-

Nat. Hazards Earth Syst. Sci., 20, 1203–1217, 2020                        www.nat-hazards-earth-syst-sci.net/20/1203/2020/
A. de Laat et al.: Satellite data analysis of February 2018 Sinabung eruption                                              1205

ary Himawari-8 satellite IR data that are widely used for          tical columns by means of air mass factors (AMFs) obtained
volcanic ash cloud detection. TROPOMI-based volcanic ash           from radiative transfer calculations, accounting for the view-
cloud heights are also compared with measurements from the         ing geometry, clouds, surface properties, total ozone, and
CALIPSO satellite overpass.                                        SO2 vertical profile shapes. The TROPOMI SO2 data product
                                                                   provides four different SO2 VCDs for different SO2 vertical
                                                                   profile shapes, since they are not known at the time of the
2     Data                                                         measurement. For this paper, we use the standard SO2 VCD
                                                                   data product.
2.1    TROPOMI AAI

The AAI is a well-established data product that has been           2.3   TROPOMI cloud information
produced for several different satellite instruments spanning
a period of more than 30 years. The AAI was first calcu-           TROPOMI provides information about cloud properties by
lated as a correction for the presence of aerosols in column       use of oxygen absorption in either the O2 A-band around
ozone measurements made by the TOMS instruments (Her-              760 nm or the O2 –O2 band around 477 nm (Veefkind et
man et al., 1997; Torres et al., 1998) because it was ob-          al., 2016). In this study, we use the TROPOMI operational
served that ozone values were too high in typical regions of       ROCINN cloud height (Loyola et al., 2018; Cloud as Re-
aerosol emission and transport. The AAI is based on spectral       flecting Boundaries – or CRB – model) and FRESCO cloud
contrast in the ultraviolet spectral range for a given wave-       height (Wang et al., 2008, 2012), both based on the O2 A-
length pair, where the difference between the observed re-         band and on offline cloud height from the O22CLD algorithm
flectance and the modeled clear-sky reflectance results in a       based on the O2 –O2 band (Veefkind et al., 2016). Note that
residual value. When this residual is positive, it indicates the   TROPOMI operational cloud fractions are derived from the
presence of UV-absorbing aerosols, like dust, smoke, or vol-       OCRA algorithm (Loyola et al., 2018). Both the FRESCO
canic ash. Clouds yield near-zero residual values, and neg-        cloud height and the O2 –O2 cloud height are based on a Lam-
ative residual values can be indicative of the presence of         bertian cloud model. Therefore, the retrieved cloud height
non-absorbing aerosols (e.g., sulfate), as shown by sensitiv-      is the cloud mid-level rather than the cloud top (Wang et
ity studies of the AAI (e.g., de Graaf et al., 2005; Penning       al., 2008; Sneep et al., 2008). Note that because the current
de Vries et al., 2009). Unlike satellite-based aerosol opti-       TROPOMI surface albedo databases – which rely on OMI
cal thickness measurements, the AAI can also be calculated         data – are not fully representative for the TROPOMI spa-
in the presence of clouds so that daily global coverage is         tial resolution and/or wavelengths, this results in inaccurate
possible. This is ideal for tracking the evolution of episodic     or unrealistic cloud retrievals which are flagged as missing
aerosol plumes from dust outbreaks, volcanic eruptions, and        data. It is expected that in the coming years a surface albedo
biomass burning. For this study, we use the TROPOMI AAI            database will be developed based on the TROPOMI measure-
data for the wavelength pair 340–380 nm. For more details          ments itself, which should solve these retrieval artifacts.
about the TROPOMI AAI retrieval algorithm, see Stein-
Zweers (2016).                                                     2.4   Himawari-8 AHI

2.2    TROPOMI SO2                                                 The Advanced Himawari-8 Imager (AHI) is a geostationary
                                                                   satellite imager with 16 broadband spectral channels from
Since the late 1970s, a large number of UV-visible satellite       the visible to IR portion of the electromagnetic spectrum be-
instruments have been used for monitoring anthropogenic            tween 0.46 and 13.3 µm. The sub-satellite spatial resolution
and volcanic SO2 emissions. In some cases, operational SO2         of AHI is 1 km for all but one VIS channel and 2 km for IR
retrieval streams have also been developed, aiming to de-          channels. The Himawari-8 AHI is a multipurpose imager that
liver SO2 vertical column densities (VCDs) in near real-time       provides full-disk scans of Earth every 10 min from a geosta-
(NRT), i.e., typically with a delay of less than 3 h.              tionary orbit at 140.7◦ E. The imagery can be used for a va-
   The TROPOMI SO2 retrieval algorithm is based on the             riety of applications, including general environmental moni-
DOAS technique (BIRA, 2016; Theys et al., 2017, 2019).             toring (e.g., cloud-tracked winds) and numerical weather pre-
In brief, the log ratio of the observed UV-visible spectrum,       diction (Bessho et al., 2016). For the detection of volcanic
of radiation backscattered from the atmosphere, and an ob-         ash clouds, results from an ad hoc version of the VADUGS
served reference spectrum (solar or earthshine spectrum) are       algorithm are used (Graf et al., 2015). The VADUGS algo-
used to derive a slant column density (SCD), which repre-          rithm is a neural network based on a large number of radia-
sents the SO2 concentration integrated along the mean light        tive transfer simulations of geostationary IR brightness tem-
path through the atmosphere. This is done by fitting absorp-       peratures and retrieves the column mass loading (kg m−2 )
tion cross sections of SO2 to the measured reflectance in a        and the top altitude of volcanic ash clouds. VADUGS was
given spectral interval. In a second step, SCDs are corrected      initially developed for SEVIRI/Meteosat Second Generation
for possible biases. Finally, the SCDs are converted into ver-     (MSG); it has been adapted to Himawari-8 for the purpose

www.nat-hazards-earth-syst-sci.net/20/1203/2020/                         Nat. Hazards Earth Syst. Sci., 20, 1203–1217, 2020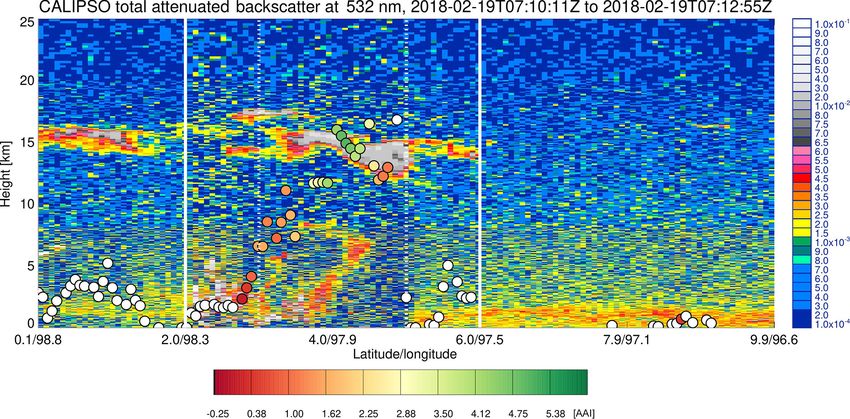
1206                                             A. de Laat et al.: Satellite data analysis of February 2018 Sinabung eruption

of this paper. VADUGS uses the 10.8–12.0 µm channel 1BT              3.2   TROPOMI
(brightness temperature difference) for geostationary IR vol-
canic ash cloud retrieval algorithms. The use of this particular     Figure 1a shows the TROPOMI FRESCO cloud height and
1BT is common practice (Prata, 1989), with negative 1BT              ROCINN cloud pressure, along with the TROPOMI AAI,
potentially indicating volcanic ash and positive 1BTs indica-        and the AAI = 0 contour and the SO2 =10 Dobson unit (DU)
tive of the presence of liquid water or ice content (Pavolonis       contour, with TROPOMI measurements within the figure
et al., 2006).                                                       area made at approximately 06:25 UTC, 4.5 h after the start
                                                                     of the eruption. By then, the volcanic plume had dispersed
2.5    CALIOP                                                        over an area with an approximate diameter of 200 km, while
                                                                     some parts of the volcanic ash cloud sufficiently thinned so
The CALIOP lidar aboard the CALIPSO platform delivers                that cumulus clouds lower down in the atmosphere could
global cloud and aerosol information. The vertical resolution        be identified in VIIRS imagery (see Fig. S2; note that
of atmospheric profiles is high, at 30–300 m, but the horizon-       TROPOMI flies in a so-called loose formation with VIIRS,
tal sampling is poor, as the satellite is in a low-altitude Earth    with a temporal separation between both of less than 5 min).
orbit, with a 16 d repeated cycle, and the horizontal resolu-        The AAI and SO2 contours agree well with the cloud struc-
tion is only 330 m to 5 km (Winker et al., 2007, 2009). In           ture associated with the volcanic plume, indicating that there
this study, we use 532 nm total attenuated backscatter (TAB)         was not a spatial separation between volcanic ash and SO2 ,
data from one CALIPSO orbit (data version 3.40) in a qual-           which is known to sometimes happen in volcanic eruptions
itative approach, i.e., detection of cloud and aerosol layers        (Cooke et al., 2014; Moxnes et al., 2014; Prata et al., 2017).
and their heights. The TAB signal strength is color-coded            Guided by the AAI and SO2 contour lines, the ash cloud
such that blues correspond to molecular scattering and weak          can be identified in the FRESCO cloud height and ROCINN
aerosol scattering and aerosols generally show up as yellow–         cloud pressure – in particular for cloud tops above 10 km
red–orange. Stronger cloud signals are plotted in grey scales,       – as well as in the FRESCO and O22CLD scene pressures
while weaker cloud returns are similar in strength to strong         (Fig. 1b), but not in the FRESCO cloud fraction (Fig. 1b),
aerosol returns and coded in yellows and reds. The TAB is            probably because of light absorption by ash. Comparing the
sensitive to atmospheric particles: both water and ice droplets      cloud height with the VIIRS reflectances (Fig. S2), the vol-
as well as various types of aerosols.                                canic plume altitudes occur where the ash cloud is suffi-
                                                                     ciently optically thick to not show the underlying surface and
3     Results                                                        clouds.
                                                                        All cloud height products show the same spatial structure,
3.1    Brief description of the spatiotemporal evolution of          with the highest clouds in the northern half of the ash plume.
       the volcanic ash cloud                                        The FRESCO and ROCINN cloud heights both consistently
                                                                     indicate cloud heights of 10 km or higher, the O22CLD cloud
The analysis of Himawari-8 AHI IR brightness temperatures            heights also reach 10 km but for fewer pixels, and in gen-
and IR-based volcanic ash cloud heights from CIMSS (Sup-             eral FRESCO and ROCINN cloud heights are higher than
plement Fig. S1) shows that the 19 February 2018 Sinabung            the O22CLD cloud heights (Fig. 1b). The O22CLD data
eruption consisted of two distinct components. The initial           product is based on absorption of the O2 –O2 complex and
eruption quickly reached the upper tropical troposphere (14–         is less sensitive to high-altitude clouds, as concentrations of
16 km altitude), after which the volcanic ash cloud was trans-       the O2 –O2 complex decrease strongly above approximately
ported in a north–northwesterly direction. These heights are         10 km altitude (Acarreta et al., 2004). The O22CLD algo-
consistent with results from the recently introduced new             rithm is therefore computationally limited to maximum cloud
TROPOMI SO2 height data product (Hedelt et al., 2019). Ap-           top pressures of 150 hPa (∼ 13 km). FRESCO and ROCINN
proximately 2 h after the start of the eruption the satellite data   are based on absorption of O2 , whose concentrations de-
show lower-altitude volcanic ash cloud 1BT signatures (up            crease much slower above 10 km altitude. The FRESCO and
to 6–8 km altitude) emerging from under the high-altitude            ROCINN cloud heights can therefore be used up to approx-
volcanic ash cloud at both the northwestern and southeastern         imately 17 km altitude (∼ 100 hPa; Wang et al., 2012). The
end of the high-altitude volcanic ash cloud. As these lower-         lower cloud height of O22CLD vs. FRESCO and ROCINN is
altitude plumes also move more or less in opposite direc-            thus most likely due to the lower sensitivity of O22CLD for
tion, they more likely reflect remnants of surface pyroclas-         high clouds. Differences between FRESCO and ROCINN for
tic flows and/or the eruption column collapse that are also          the volcanic plume appear less striking, most notably the lack
seen in the time-lapse webcam video footage on the internet          of saturated pixels in ROCINN (greys in FRESCO), which
(https://youtu.be/v45J5BO_ge0, last access: 24 April 2020).          is possible due to the neural network filling in the gaps with
                                                                     nearby cloud information or interpolating between cloud pix-
                                                                     els. However, it appears that FRESCO cloud heights are
                                                                     higher for the northern half of the ash plume. FRESCO cloud

Nat. Hazards Earth Syst. Sci., 20, 1203–1217, 2020                          www.nat-hazards-earth-syst-sci.net/20/1203/2020/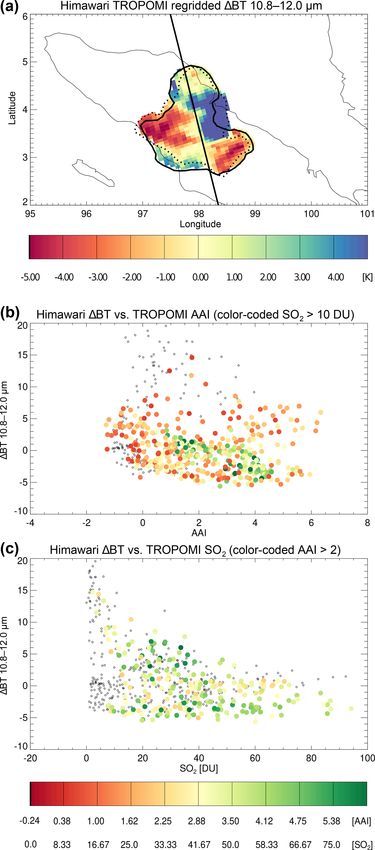
A. de Laat et al.: Satellite data analysis of February 2018 Sinabung eruption                                                         1207

Figure 1. (a) TROPOMI cloud pressure (ROCINN; a1 and 3) and TROPOMI FRESCO cloud heights (a2 and 4). TROPOMI SO2 (a1) and
the AAI (a2) for the overpass of the 19 February 2018 Sinabung eruption. The straight line denotes the path of the CALIPSO overpass, the
solid-line shape denotes the outline of > 10 DU SO2 columns, and the dotted-line shape denotes the AAI > 0 value. Note that for FRESCO and
ROCINN cloud heights certain pixels are greyed out (“no data”), related to yet-unresolved retrieval artifacts. (b) As in (a) but for TROPOMI
FRESCO cloud cover (b1), O22CLD cloud height (b2), FRESCO apparent scene pressure (b3), and O22CLD apparent scene pressure (b4).
cc is cloud cover, cth is cloud top height, and prs is cloud pressure and scene pressure.

www.nat-hazards-earth-syst-sci.net/20/1203/2020/                                Nat. Hazards Earth Syst. Sci., 20, 1203–1217, 2020
1208 A. de Laat et al.: Satellite data analysis of February 2018 Sinabung eruption
heights exceed 12.5 km, which is approximately 200 hPa; regardless of corresponding AAI value). The only differ-
ROCINN cloud pressure does not appear to exceed 200 hPa. ence occurs for FRESCO cloud heights > 14 km, where the
ROCINN cloud height appears to be nearly constant around
3.3 CALIOP 12 km or 200 hPa. For the O22CLD data the maximum
heights are on average lower than the FRESCO and ROCINN
Although the 19 February 2018 Sinabung eruption was small cloud heights. The lower cloud height of the O22CLD prod-
in spatial extent and rather short-lived, by mere accident there uct is likely related to the reduced sensitivity of O22CLD
was a perfect overpass with the CALIOP instrument in the for clouds above approximately 10 km altitude. Nevertheless,
A-train constellation (see Fig. 1). The CALIOP track goes all products clearly indicate volcanic cloud heights of 10 km
straight through the core of the volcanic ash cloud and across and higher, with the largest heights between 4 and 5◦ latitude,
the north–south gradient in cloud tops. consistent with the CALIOP observation that backscatter sig-
Figure 2 shows the CALIOP backscatter signal at 532 nm nals between 3 and 4◦ latitude are weaker than between 4 and
overlaid with the TROPOMI FRESCO cloud heights, which 5◦ latitude.
are color-coded according to the corresponding AAI values. Although the CALIOP overpass is perfect in space, the
The CALIOP overpass time of this area is between 07:09:56 time difference between TROPOMI and CALIOP of approx-
and 07:11:26 UTC, and the TROPOMI overpass time is be- imately 45 min is not insignificant. It is therefore unlikely
tween 06:24:23 and 06:26:00 UTC, a time difference of ap- that TROPOMI and CALIOP ash layers and structures ex-
proximately 45 min. The CALIOP data clearly show not actly match. The flow direction of the volcanic ash cloud was
only a cloud–ash layer around 15 km altitude but also two northwards, which means that CALIOP should also be dis-
cloud–ash structures extending from the ground up to ap- placed north compared to TROPOMI. A rough estimate of
proximately 10 km altitude, with an increase in height go- northward cloud motion based on the geostationary satellite
ing from south to north. There is also a layer detected in data indicates that the displacement may be approximately
CALIPSO at 18 km around 3◦ N, which likely is also vol- 0.5◦ h−1 , which makes it not unreasonable to assume that
canic, as the Himawari-8 1BT does not provide any indi- some of the discrepancies between TROPOMI and CALIOP
cation of other high clouds, while there are negative 1BTs could also be related to the differences in observation time.
near the CALIPSO track at 3◦ N, indicative of the presence Furthermore, volcanic eruption plumes have their own dy-
of volcanic ash. namics, with for example pyroclastic flows near the sur-
There is a good agreement between the location of en- face which appear to travel partly in the opposite direction
hanced TROPOMI AAI values, FRESCO cloud height, and of the background flow. The eruption dynamics may thus
the altitude of high backscatter signal in the CALIOP data. have additional effects on the ash plume displacement, for
The maximum cloud height in FRESCO agrees with the which time series of the complete three-dimensional view of
maximum backscatter height in CALIOP between 4 and 5◦ the eruption plume would be preferred. The current avail-
latitude. Between 3 and 4◦ latitude, the agreement is poor, as able satellite data only provide a two-dimensional view of
the FRESCO cloud height falls right in between the CALIOP the eruption plume from above (geostationary, polar orbit-
backscatter data between 13 and 18 km altitude and those ing), with information about changes over time in case of the
close to the surface. The CALIOP data also suggest that geostationary satellites and with some, but limited, informa-
backscatter signals between 3 and 4◦ latitude are weaker than tion about cloud and aerosol height. CALIOP measurements
between 4 and 5◦ latitude, which might indicate less dense only provide one two-dimensional cross section through the
ash or clouds. For a semi-transparent cloud or ash plume, eruption plume, without any information about changes over
it could be expected that FRESCO cloud heights are lower time.
than the actual height of the cloud or ash plume due the
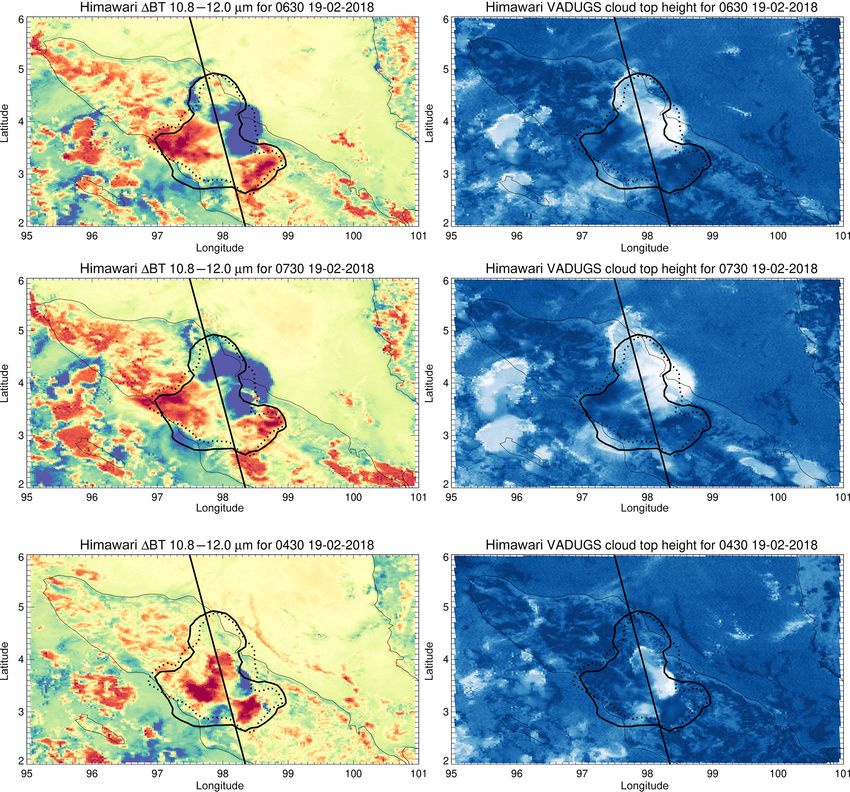
presence of bright clouds nearer to the surface. Note that 3.4 Himawari-8
CALIOP’s own feature mask does not identify hardly any
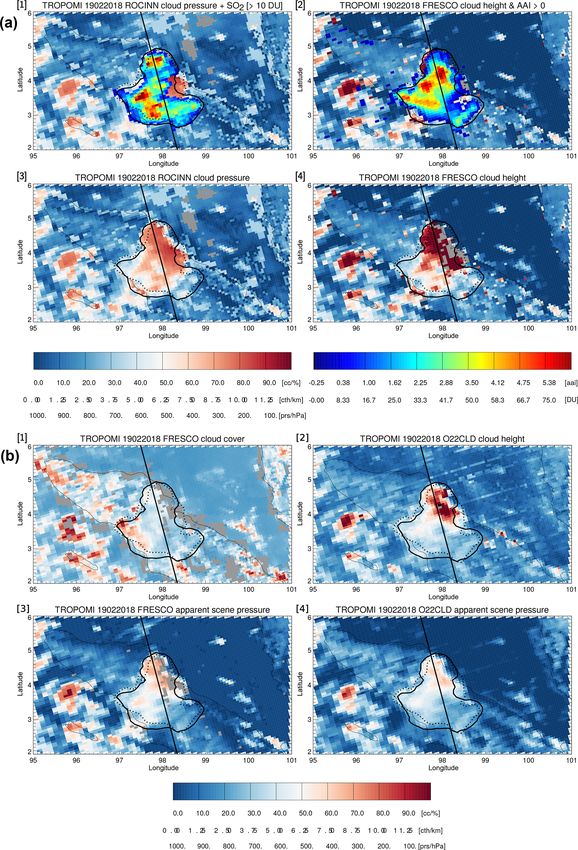
of these backscatter signals as aerosol (for CALIOP v4.10 The temporal evolution of the ash plume was further investi-
an occasional cloud pixel is flagged as aerosol; see Hedelt et gated using Himawari-8 geostationary IR observations. Fig-
al., 2019): the high-altitude structures are flagged as regular ure 4 shows the Himawari-8 10.8–12.0 µm channel (1BT) as
clouds, and the below-cloud structure as “totally attenuated”, observed between 02:30 and 07:30 UTC in hourly intervals,
even though clearly the attenuation is not complete. The lack including the TROPOMI SO2 and AAI contours shown in
of aerosol masking in the feature mask most likely is related Fig. 1.
to liquid water or ice contaminating the volcanic ash (Hedelt During the first few hours (02:30–03:30 UTC), the ash
et al., 2019). plume is clearly visible both in the 1BTs (reddish col-
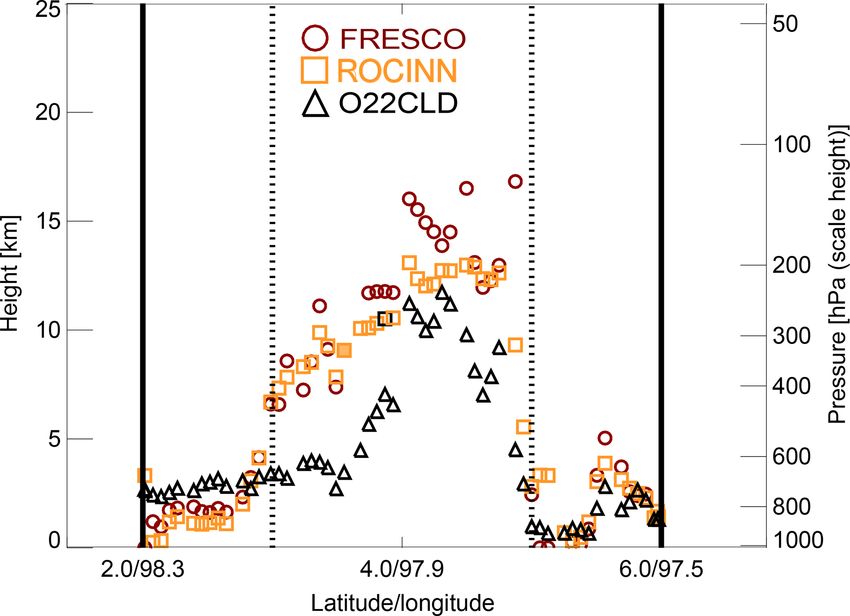
Figure 3 shows the corresponding cloud heights from ors) and cloud heights (whites). At 03:30 UTC, two distinct
the O22CLD and ROCINN algorithms. The ROCINN cloud clouds emerge with fairly negative 1BTs: one associated
height is very similar to the FRESCO cloud height (R 2 = also with a high cloud height (white cloud colors) and an-
0.98 for FRESCO cloud heights between 0.5 and 14 km other one further south with much lower cloud heights, likely
Nat. Hazards Earth Syst. Sci., 20, 1203–1217, 2020 www.nat-hazards-earth-syst-sci.net/20/1203/2020/A. de Laat et al.: Satellite data analysis of February 2018 Sinabung eruption 1209
Figure 2. CALIOP total attenuated backscatter profile for the Sinabung eruption on 19 February 2018 along the track indicated in Fig. 1. The
circles denote the TROPOMI FRESCO cloud heights, color-coded according to the TROPOMI AAI values as in Fig. 1. White dots indicate
AAI values < 0.
also VIIRS imagery in the SI and comparison of TROPOMI
with CALIPSO). The lack of larger AAI and SO2 values for
larger positive 1BT values therefore may reflect some kind
of shielding of the volcanic ash and SO2 by the iced upper
levels of the volcanic ash cloud. SO2 may have been con-
verted into sulfate as the SO2 depletion rate (e-folding time),
which, although uncertain, has been estimated to be as small
as 5–30 min (Oppenheimer et al., 1998; McGonigle et al.,
2004), scavenged by ice (Rose et al., 2000) or via ice nu-
cleation of volcanic ash particles (Durant et al., 2008). For
negative 1BTs – indicative of volcanic ash clouds – we also
find little evidence of a distinctive relation between either the
AAI or SO2 with 1BTs. This may similarly reflect a shield-
ing effect, as the largest aerosol concentrations are not asso-
ciated with the largest possible 1BTs (e.g., Prata and Prata,
Figure 3. TROPOMI cloud heights from the FRESCO, ROCINN 2012; Pavolonis et al., 2006).
and O22CLD algorithms. The solid vertical lines denote the 2 and The emergence of an IR ice–water cloud signature within
6◦ N latitudes; the dotted vertical lines denote the 3 and 5◦ latitudes. the volcanic ash cloud is consistent with analysis of avail-
The FRESCO data are identical to the FRESCO data shown Fig. 2. able video footage and pictures on social media that show
signs of condensation within the ash clouds soon after the
start of the eruption. This is indicative of a moist troposphere
low-altitude outflow or pyroclastic flows (blue cloud colors). in this area, which is further supported by the widespread de-
From 04:30 UTC onwards, a third region becomes visible, velopment of (late) afternoon thunderstorms on 19 February
with high cloud heights and large positive 1BTs (purple), throughout Sumatra. The eruption thus caused an increase
indicative of high ice clouds, which continues to grow and in high-altitude water vapor, either by moisture contained in
expand northward. the eruption itself or by the rapid vertical motions within the
Figure 5 shows a comparison of TROPOMI AAI and SO2 eruption column. The results presented here support the no-
data with regridded Himawari-8 1BTs (Fig. 5a). When fo- tion that the IR volcanic ash cloud 1BT signature disappears
cusing on AAI and SO2 values, it appears that larger 1BT when condensed water vapor or ice forms in a volcanic ash
values occur for smaller AAI values (< 2) and SO2 columns cloud, which is known to significantly hamper IR volcanic
(< 10 DU). The largest positive 1BTs are associated with op-
tically thicker and less transparent water and ice clouds (see
www.nat-hazards-earth-syst-sci.net/20/1203/2020/ Nat. Hazards Earth Syst. Sci., 20, 1203–1217, 20201210 A. de Laat et al.: Satellite data analysis of February 2018 Sinabung eruption
Figure 4.
ash cloud retrievals (Francis et al., 2012; Pavolonis et al., surface below the ash cloud are not visible, TROPOMI cloud
2015a, b; Zhu et al., 2017). heights also provide accurate information about the volcanic
ash cloud heights. The TROPOMI FRESCO and ROCINN
cloud heights agree with CALIOP cloud top measurements
4 Discussion and conclusions for optically thick volcanic ash clouds. However, there is
a difference between FRESCO and ROCINN for very high
Analysis of measurements from the polar-orbiting FRESCO heights (> 12.5 km or approximately 200 hPa).
TROPOMI satellite – with unprecedented spatial reso- This might indicate that the ROCINN neural network may
lution and accuracy – of the volcanic eruption of Mount not be sufficiently trained on clouds beyond 12 km or
Sinabung on Sumatra on 19 February 2018 has revealed 200 hPa. In passing we note that the unprecedented spatial
that the combination of the TROPOMI AAI and TROPOMI resolution of TROPOMI allows for detection of much
SO2 allows for accurate identification of the volcanic ash smaller eruptions than is currently possible with polar-
cloud location. In addition, under the condition that the orbiting satellite instruments like OMPS, GOME-2, and
ash plume is sufficiently thick so that clouds and the Earth
Nat. Hazards Earth Syst. Sci., 20, 1203–1217, 2020 www.nat-hazards-earth-syst-sci.net/20/1203/2020/A. de Laat et al.: Satellite data analysis of February 2018 Sinabung eruption 1211 Figure 4. Himawari-8 VADUGS cloud heights (right) and 10.8–12.0 µm 1BTs (left) for every hour between 02:30 and 07:30 UTC. The line denotes the CALIPSO overpass track. The solid and dotted contours denote outline of TROPOMI > 10 DU SO2 columns and TROPOMI AAI > 0 value, as shown in Fig. 1. OMI. Also note that it could be argued that it would be better as a proxy for a volcanic plume, although investigating the to use the TROPOMI SO2 15 km data product, as 15 km is accuracy and precision of satellite SO2 VCD observations in more consistent with the volcanic plume height. However, fresh volcanic plumes would be valuable, in particular with this 15 km data product assumes a “nice-and-tidy” SO2 soon-to-be-launched geostationary hyperspectral satellites. plume without any contamination, let alone the complexity Comparison with CALIOP aerosol and cloud heights of a fresh, optically very thick eruption plume and the pres- provides clear indications that ash height estimates using ence of condensed water, in combination with indications cloud heights and AAI values from UV–VIS satellites like of a shielding effect. Furthermore, the main focus of this TROPOMI may underestimate actual ash heights in case paper is ash heights rather than SO2 , which is mostly used of semi-transparent volcanic ash clouds, especially in the www.nat-hazards-earth-syst-sci.net/20/1203/2020/ Nat. Hazards Earth Syst. Sci., 20, 1203–1217, 2020
1212                                              A. de Laat et al.: Satellite data analysis of February 2018 Sinabung eruption

                                                                       presence of high concentrations of water vapor and for
                                                                       very high-altitude volcanic ash clouds. For volcanic ash
                                                                       clouds optically thin enough for light to pass through, the
                                                                       TROPOMI cloud heights are a weighted mean of the ash
                                                                       height and heights of other clouds or the surface and are
                                                                       therefore less useful for the purpose of monitoring volcanic
                                                                       ash cloud height. Some discrepancies between TROPOMI
                                                                       and CALIPSO may be related due to misalignment in ob-
                                                                       servation times of both satellite instruments (∼ 45 min). In
                                                                       addition, indications were found of shielding of volcanic ash
                                                                       by this ice and water near the top of the volcanic ash cloud.
                                                                          There are also clear indications in the geostationary IR
                                                                       data of the formation of water and ice near the top of the vol-
                                                                       canic ash cloud. The analysis of geostationary satellite data
                                                                       for this particular case revealed that under conditions of vol-
                                                                       canic ash mixed with ice of condensed water, the geostation-
                                                                       ary IR volcanic ash cloud 1BT signature is lost and geosta-
                                                                       tionary volcanic ash cloud retrievals cannot identify crucial
                                                                       parts of the ash plume. It is worth mentioning that the tem-
                                                                       poral resolution inherent in the geostationary orbit allows the
                                                                       observation of the onset and evolution of the plume, even in
                                                                       adverse conditions for the IR volcanic ash cloud retrieval al-
                                                                       gorithm.
                                                                          Polar-orbiting satellites like TROPOMI thus may be bet-
                                                                       ter able to detect volcanic ash when condensed ice and wa-
                                                                       ter are present in volcanic plumes, in particular when syner-
                                                                       gistically combining different satellite data products like the
                                                                       AAI and SO2 . Furthermore, for the present case study, large
                                                                       negative 1BTs appear not to be a good indicator of large
                                                                       AAI values (or large SO2 columns). This is not surprising, as
                                                                       highly negative 1BTs do not necessarily indicate large ash
                                                                       optical depth values (e.g., Prata and Prata, 2012; Pavolonis et
                                                                       al., 2006). Our results therefore highlight that there is added
                                                                       value in combining IR 1BT with the UV–VIS AAI and SO2 .
                                                                       Satellite measurements like those from TROPOMI measure-
                                                                       ments thus can add significant value to geostationary IR vol-
                                                                       canic ash cloud retrievals. Furthermore, in case of sufficiently
                                                                       dense ash, the cloud height data products provide accurate
                                                                       volcanic ash cloud heights, an important piece of information
                                                                       for aviation. For semi-transparent volcanic ash clouds, where
                                                                       the cloud top height retrievals become sensitive to other re-
Figure 5. (a) Himawari-8 1BTs for 19 February 2018 at 06:30 UTC        flective surfaces below the transparent volcanic ash clouds,
(see also Fig. 4) regridded to the TROPOMI measurement grid            detection of accurate volcanic ash cloud heights is limited.
of that day, and correlations between the Himawari-8 1BTs and             Hence, for AAI values larger than 4, TROPOMI cloud
TROPOMI (b) AAI and (c) SO2 . The solid and dotted contours de-        heights can be used for determining aerosol heights, and
note outline of TROPOMI > 10 DU SO2 columns and TROPOMI                in case also SO2 is detected, such measurements should
AAI > 0 value, as also shown in Fig. 4 and in Fig. 1. The color-       be interpreted as also containing volcanic ash (column val-
coding of the dots in the AAI scatterplots is indicative of the cor-   ues > 1 DU; Theys et al., 2017). For more conservative es-
responding SO2 value (> 10 DU), and the color-coding in the SO2        timates SO2 column values > 10 could be considered. This
scatterplot is indicative of the AAI value (AAI > 2); see also the
                                                                       AAI threshold value of 4 may be conservative but ensures
lower color bar. These color-codings were added for qualitatively
identifying possible relationships between 1BT and AAI or SO2
                                                                       that the aerosol layer very likely is opaque, as generally the
within the volcanic ash cloud.                                         associated aerosol optical depth will be (very) large (de Graaf
                                                                       et al., 2005). For the combination of UV–VIS cloud heights,
                                                                       the AAI and SO2 could also be used for other UV–VIS satel-
                                                                       lites like GOME-2, OMPS, and OMI. These results highlight

Nat. Hazards Earth Syst. Sci., 20, 1203–1217, 2020                             www.nat-hazards-earth-syst-sci.net/20/1203/2020/
A. de Laat et al.: Satellite data analysis of February 2018 Sinabung eruption 1213 the importance of the integrated use of multiple (satellite) data sources for the detection and characterization of vol- canic ash clouds, in particular for aviation purposes. This has been recognized by the European Union and is being further developed within the Horizon 2020 project EUNADICS-AV (http://www.eunadics.eu, last access: 24 April 2020). www.nat-hazards-earth-syst-sci.net/20/1203/2020/ Nat. Hazards Earth Syst. Sci., 20, 1203–1217, 2020
1214                                     A. de Laat et al.: Satellite data analysis of February 2018 Sinabung eruption

Appendix A: Glossary

 AAI               Absorbing aerosol index
 AIRS              Atmospheric infrared sounder
 AMF               Air mass factor
 AHI               Advanced Himawari-8 Imager
 BIRA              Belgian Institute for Space Aeronomy
 1BT               Brightness temperature difference
 CALIOP            Cloud-Aerosol Lidar with Orthogonal Polarization
 CALIPSO           Cloud-Aerosol Lidar and Infrared Pathfinder Satellite Observation
 CIMSS             Cooperative Institute for Meteorological Satellite Studies
 DOAS              Differential optical absorption spectroscopy
 DU                Dobson unit
 ESA               European Space Agency
 EUNADICS-AV       European Natural Airborne Disaster Information and Coordination System for Aviation
 FRESCO            Fast Retrieval Scheme for Clouds from the Oxygen A-band
 GOME-2            Global Ozone Monitoring Experiment–2
 ICAO              International Civil Aviation Organization
 IASI              Infrared atmospheric sounding interferometer
 IR                Infrared
 NOAA              National Oceanic and Atmospheric Administration
 NRT               Near-real time
 OCRA              Optical Cloud Recognition Algorithm
 OMI               Ozone monitoring instrument
 OMPS              Ozone Mapping Profiler Suite
 O22CLD            O2 –O2 cloud
 ROCINN            Retrieval Of Cloud Information using Neural Networks
 SACS              Support for Aviation Control Service
 SCD               Slant column density
 SCIAMACHY         SCanning Imaging Absorption spectroMeter for Atmospheric CHartographY
 SCOPE             Sustained, Coordinated Processing of Environmental Satellite Data for Nowcasting
 SO2               Sulfur dioxide
 S5P               Sentinel-5 Precursor
 TAB               Total attenuated backscatter
 TEMIS             Tropospheric Emission Monitoring Internet Service
 TOMS              Total Ozone Mapping Spectrometer
 TROPOMI           TROPOspheric Monitoring Instrument
 UTC               Universal time coordinated
 UV                Ultraviolet
 VAAC              Volcanic Ash Advisory Centre
 VADUGS            Volcanic Ash Detection Utilizing Geostationary Satellites
 VCD               Vertical column density
 VIS               Visible
 VIIRS             Visible Infrared Imaging Radiometer Suite
 WMO               World Meteorological Organization

Nat. Hazards Earth Syst. Sci., 20, 1203–1217, 2020                  www.nat-hazards-earth-syst-sci.net/20/1203/2020/
A. de Laat et al.: Satellite data analysis of February 2018 Sinabung eruption                                                          1215

Data availability. TROPOMI SO2 , AAI, ROCINN, and FRESCO               Alexander, D.: Volcanic ash in the atmosphere and risks for civil
data are publicly accessible via https://s5phub.copernicus.eu/ (ESA,     aviation: a study in European crisis management, Int. J. Dis-
2018). TROPOMI O22CLD data can be made available on request              ast. Risk Sc., 4, 9–19, https://doi.org/10.1007/s13753-013-0003-
by contacting the lead author or by contacting KNMI. Data were           0, 2013.
processed by Maarten Sneep (KNMI) and provided on 1 Febru-             Bessho K., Date, K., Hayashi, M., Ikeda, A., Imai, T., Inoue, H.,
ary 2019. CALIOP data are freely available via the ICARE Data            Kumagai, Y., Miyakawa, T., Murata, M., Ohno, T., Okuyama, A.,
and Services Center (http://www.icare.univ-lille1.fr/) (Vaughan et       Oyama, R., Sasaki, Y., Shimazu, Y., Shimoji, K., Y. Sumida, Y.,
al., 2019). HIMAWARI and VADUGS data were processed by Mar-              Suzuki, M., Taniguchi, H., Tsuchiyama, H., Uesawa, D., Yokota,
garita Vazquez Navarro (then at DLR, Germany) and provided on 29         Y., and Yoshida, R., An introduction to Himawari-8/9 – Japan’s
June 2018. Data can be made available on request by contacting the       new-generation geostationary meteorological satellites, J. Mete-
lead author. VIIRS imagery as shown in the Supplement is freely ac-      orol. Soc. Jpn., 94, 151–183, https://doi.org/10.2151/jmsj.2016-
cessible at NASA Worldview https://worldview.earthdata.nasa.gov/         009, 2016.
(last access: 1 February 2019).                                        BIRA: S5P/TROPOMI SO2 ATBD, S5P-BIRA-L2-400E-ATBD,
                                                                         available at: http://www.tropomi.eu/sites/default/files/files/
                                                                         S5P-BIRA-L2-ATBD-SO2_400E_v1.1.0_20181005.pdf (last
Supplement. The supplement related to this article is available on-      access: 1 February 2019), 2016.
line at: https://doi.org/10.5194/nhess-20-1203-2020-supplement.        Brenot, H., Theys, N., Clarisse, L., van Geffen, J., van Gent, J.,
                                                                         Van Roozendael, M., van der A, R., Hurtmans, D., Coheur, P.-F.,
                                                                         Clerbaux, C., Valks, P., Hedelt, P., Prata, F., Rasson, O., Sievers,
Author contributions. AdL contributed to the conceptualization, in-      K., and Zehner, C.: Support to Aviation Control Service (SACS):
vestigation, methodology, visualization, formal analysis, and writ-      an online service for near-real-time satellite monitoring of vol-
ing the original draft. MVN, NT, and PS contributed to data curation     canic plumes, Nat. Hazards Earth Syst. Sci., 14, 1099–1123,
and reviewing and editing the writing.                                   https://doi.org/10.5194/nhess-14-1099-2014, 2014.
                                                                       Cooke, M. C., Francis, P. N., Millington, S., Saunders, R., and
                                                                         Witham, C.: Detection of the Grímsvötn 2011 volcanic eruption
                                                                         plumes using infrared satellite measurements. Atmos. Sci. Lett.,
Competing interests. The authors declare that they have no conflict
                                                                         15, 321–327, https://doi.org/10.1002/asl2.506, 2014.
of interest.
                                                                       de Graaf, M., Stammes, P., Torres, O., and Koelemeijer, R. B.
                                                                         A.: Absorbing Aerosol Index: Sensitivity analysis, application
                                                                         to GOME and comparison with TOMS, J. Geophys. Res., 110,
Special issue statement. This article is part of the special issue       D01201, https://doi.org/10.1029/2004JD005178, 2005.
“Analysis and prediction of natural airborne aviation hazards”. It     Durant, A. J., Shaw, R. A., Rose, W. I., Mi, Y., and
is not associated with a conference.                                     Ernst, G. G. J.: Ice nucleation and overseeding of ice
                                                                         in volcanic clouds, J. Geophys. Res., 113, D09206,
                                                                         https://doi.org/10.1029/2007JD009064, 2008.
Acknowledgements. The authors thank the two anonymous referees         ESA: Sentinel-5P Pre-Operations Data Hub, available at: https://
for their thoughtful and valuable comments. This paper is supported      s5phub.copernicus.eu/dhus (last access: 1 February 2019), 2018.
by the European Union’s Horizon 2020 research and innovation           Francis, P. N., Cooke, M. C., and Saunders, R. W.: Retrieval of
program under grant agreement no. 723986, project EUNADICS-              physical properties of volcanic ash using Meteosat: A case study
AV (European Natural Airborne Disaster Information and Coordi-           from the 2010 Eyjafjallajökull eruption, J. Geophys. Res., 117,
nation System for Aviation).                                             D00U09, https://doi.org/10.1029/2011JD016788, 2012.
                                                                       Graf, K. Kox, S., Schmidl, M., and Gasteiner, J.: the VADUGS
                                                                         algorithm, Volcanic Ash Detection using Geostationary Satel-
Financial support. This research has been supported by the               lites, presentation at the WMO Intercomparison Workshop,
Horizon 2020 Societal Challenges, Horizon 2020 Transport                 Madison, Wisconsin, United States, 29 June–2 July 2015, avail-
(EUNADICS-AV (grant no. 723986)).                                        able      at:http://cimss.ssec.wisc.edu/meetings/vol_ash15/PDFs/
                                                                         20150630/Item2.10_20150630_WMO_Madison_Graf.pdf (last
                                                                         access: 1 February 2019), 2015.
Review statement. This paper was edited by Marcus Hirtl and re-        Global Volcanism Program: Mount Sinabung (261080),
viewed by two anonymous referees.                                        Volcanoes of the World, v4.8.6, edited by: E. Venzke,
                                                                         https://doi.org/10.5479/si.GVP.VOTW4-2013,             Smithsonian
                                                                         Institution, 2013.
                                                                       Hedelt, P., Efremenko, D. S., Loyola, D. G., Spurr, R., and Clarisse,
                                                                         L.: Sulfur dioxide layer height retrieval from Sentinel-5 Precur-
References                                                               sor/TROPOMI using FP_ILM, Atmos. Meas. Tech., 12, 5503–
                                                                         5517, https://doi.org/10.5194/amt-12-5503-2019, 2019.
Acarreta, J. R., de Haan, J. F., and Stammes, P.: Cloud pressure re-   Hendrasto, M., Surono, A., Budianto, K., Triastuty, H., Haerani,
  trieval using the O2 -O2 absorption band at 477 nm, J. Geophys.        N., Basuki, A., Suparman, Y., Primulyana, S., Prambada, O.,
  Res., 109, D05204, https://doi.org/10.1029/2003JD003915,               Loeqman, A., Indrastuti, N., Andreas, A. S., Rosadi, U., Adi,
  2004.

www.nat-hazards-earth-syst-sci.net/20/1203/2020/                              Nat. Hazards Earth Syst. Sci., 20, 1203–1217, 2020
1216 A. de Laat et al.: Satellite data analysis of February 2018 Sinabung eruption
S., Iguchi, M., Ohkura, T., Nakada, S., and Yoshimoto, M.: Prata, A. and Rose, W. I.: Volcanic Ash Hazards and Aviation,
Evaluation of volcanic activity at Sinabung volcano, after more Chapter 52 in The Encyclopedia of Volcanoes, second edition,
than 400 years of quiet, Journal of Disaster Research, 7, 37–47, edited by: Sigurdsson, H., Houghton, B., McNutt, S. R., Rymer,
https://doi.org/10.20965/jdr.2012.p0037, 2012. H., and Stix, J., ISBN 978-0-12-385938-9, 2015.
Herman, J. R., Bhartia, P. K., Torres, O., Hsu, C., Seftor, C., and Prata, F., Woodhouse, M., Huppert, H. E., Prata, A., Thordarson, T.,
Celarier, E. A.: Global distributions of UV-absorbing aerosols and Carn, S.: Atmospheric processes affecting the separation of
from NIMBUS 7/TOMS data, J. Geophys. Res., 102, 16911– volcanic ash and SO2 in volcanic eruptions: inferences from the
16922, https://doi.org/10.1029/96JD03680, 1997. May 2011 Grímsvötn eruption, Atmos. Chem. Phys., 17, 10709–
ICAO: Flight Safety and Volcanic Ash, ICAO Document 9974, 10732, https://doi.org/10.5194/acp-17-10709-2017, 2017.
available at: http://www.icao.int/publications/Documents/9974_ Primulyana, S., Kern, C., Lerner, A., Saing, U. B., Kunrat,
en.pdf, (last access: 1 May 2018), 2012. S. L., Alfianti, H., and Marlia, M.: Gas and ash emis-
Loyola, D. G., Gimeno García, S., Lutz, R., Argyrouli, A., Rom- sions associated with the 2010–present activity of Sinabung
ahn, F., Spurr, R. J. D., Pedergnana, M., Doicu, A., Molina Gar- Volcano, Indonesia, J. Volcanol. Geoth. Res., 382, 184–196,
cía, V., and Schüssler, O.: The operational cloud retrieval algo- https://doi.org/10.1016/j.jvolgeores.2017.11.018, 2017.
rithms from TROPOMI on board Sentinel-5 Precursor, Atmos. Rose, W. I., Bluth, G. J. S., and Ernst, G. G. J.: Integrating
Meas. Tech., 11, 409–427, https://doi.org/10.5194/amt-11-409- retrievals of volcanic cloud characteristics from satellite re-
2018, 2018. mote sensors: a summary, edited by: Francis, P., Neuberg, J.,
McGonigle, A. J. S., Delmelle, P., Oppenheimer, C., Tsanev, V. I., and Sparks, R. S. J., Philos. T. R. Soc. A, 358, 1585–1606,
Delfosse, T., Williams-Jones, G., Horton, K., and Mather, T. A.: https://doi.org/10.1098/rsta.2000.0605, 2000.
SO2 depletion in tropospheric volcanic plumes, Geophys. Res. Sneep, M., de Haan, J. F., Stammes, P., Wang, P., Van-
Lett., 31, L13201, https://doi.org/10.1029/2004GL019990, 2004. bauce, C., Joiner, J., Vasilkov, A. P., and Levelt, P.
Moxnes, E. D., Kristiansen, N. I., Stohl, A., Clarisse, L., Durant, A., F.: Three-way comparison between OMI and PARASOL
Weber, K., and Vogel, A.: Separation of ash and sulfur dioxide cloud pressure products, J. Geophys. Res., 113, D15S23,
during the 2011 Grímsvötn eruption, J. Geophys. Res.-Atmos., https://doi.org/10.1029/2007JD008694, 2008.
119, 7477–7501, https://doi.org/10.1002/2013JD021129, 2014. Stein-Zweers, D.: TROPOMI ATBD of the UV aerosol index,
Oppenheimer, C., Francis, P., and Stix, J.: Depletion rates of sulfur S5P-KNMI-L2-0008-RP, available at: http://www.tropomi.eu/
dioxide in tropospheric volcanic plumes, Geophys. Res. Lett., 25, sites/default/files/files/S5P-KNMI-L2-0008-RP-TROPOMI_
2671–2674, 1998. ATBD_UVAI-1.1.0-20180615_signed.pdf (last access: 1 Febru-
Oxford Economics: available at: https://www.tcd.ie/Economics/ ary 2019), 2016.
assets/pdf/SER/2014/elin_thora.pdf (last access: 1 Febru- Theys, N., De Smedt, I., Yu, H., Danckaert, T., van Gent, J., Hör-
ary 2019), 2010. mann, C., Wagner, T., Hedelt, P., Bauer, H., Romahn, F., Ped-
Pavolonis, M. J., Feltz, W. F., Heidinger, A. K., and Gal- ergnana, M., Loyola, D., and Van Roozendael, M.: Sulfur diox-
lina, G. M.: A Daytime Complement to the Reverse Ab- ide retrievals from TROPOMI onboard Sentinel-5 Precursor: al-
sorption Technique for Improved Automated Detection of gorithm theoretical basis, Atmos. Meas. Tech., 10, 119–153,
Volcanic Ash, J. Atmos. Ocean. Tech., 23, 1422–1444, https://doi.org/10.5194/amt-10-119-2017, 2017.
https://doi.org/10.1175/JTECH1926.1, 2006. Theys, N., Hedelt, P., De Smedt, I., Lerot, C., Yu, H., Vlietinck,
Pavolonis, M. J., Sieglaff, J., and Cintineo, J.: Spectrally Enhanced J., Pedergnana, M., Arellano, S., Galle, B., Fernandez, D., Car-
Cloud Objects – A generalized framework for automated detec- lito, C. J. M., Barrington, C., Taisne, B., Delgado-Granados,
tion of volcanic ash and dust clouds using passive satellite mea- H., Loyola, D., and van Roozendael, M.: Global monitoring
surements: 1. Multispectral analysis, J. Geophys. Res.-Atmos., of volcanic SO2 degassing with unprecedented resolution from
120, 7813–7841, https://doi.org/10.1002/2014JD022968, 2015a. TROPOMI onboard Sentinel-5 Precursor, Nat. Sci. Rep., 9, 2643,
Pavolonis, M. J., Sieglaff, J., and Cintineo, J.: Spectrally En- https://doi.org/10.1038/s41598-019-39279-y, 2019.
hanced Cloud Objects – A generalized framework for auto- Torres, O., Bhartia, P. K., Herman, J. R., Ahmad, Z., and Gleason, J.:
mated detection of volcanic ash and dust clouds using pas- Derivation of aerosol properties from satellite measurements of
sive satellite measurements: 2. Cloud object analysis and backscattered ultraviolet radiation: Theoretical basis, J. Geophys.
global application, J. Geophys. Res.-Atmos., 120, 7842–7870, Res., 103, 17099–17110, https://doi.org/10.1029/98JD00900,
https://doi.org/10.1002/2014JD022969, 2015b. 1998.
Penning de Vries, M. J. M., Beirle, S., and Wagner, T.: UV Vaughan, M., Pitts, M., Trepte, C., Winker, D., Detweiler, P., Gar-
Aerosol Indices from SCIAMACHY: introducing the SCat- nier, A., Getzewitch, B., Hunt, W., Lambeth, J., Lee, K.-P.,
tering Index (SCI), Atmos. Chem. Phys., 9, 9555–9567, Lucker, P., Murray, T., Rodier, S., Trémas, T., Bazureau, A.,
https://doi.org/10.5194/acp-9-9555-2009, 2009. and Pelon, J.: CALIPSO data management system data prod-
Prata, A. J.: Infrared radiative transfer calculations for vol- ucts catalog, document No. PC-SCI-503, Release 4.20, available
canic ash clouds, Geophys. Res. Lett., 16, 1293–1296, at: http://www-calipso.larc.nasa.gov/products/CALIPSO_DPC_
https://doi.org/10.1029/GL016i011p01293, 1989. Rev4x20.pdf, last access: 1 February 2019.
Prata, A. J. and Prata, A. T.: Eyjafjallajökull volcanic ash con- Veefkind, J. P., Aben, I., McMullan, K., Förster, H., de Vriese,
centrations determined using Spin Enhanced Visible and In- J., Otter, G., Claas, J., Eskes, H. J., de Haan, J. F., Kleipool,
frared Imager measurements, J. Geophys. Res., 117, D00U23, Q., van Weele, M., Hasekamp, O., Hoogeveen, R., Landgraf,
https://doi.org/10.1029/2011JD016800, 2012. J., Snel, R., Tol, P., Ingmann, P., Voorse, R., Kruizinga, B.,
Vink, R., Visser, H., and Levelt, P. F.: TROPOMI on the ESA
Nat. Hazards Earth Syst. Sci., 20, 1203–1217, 2020 www.nat-hazards-earth-syst-sci.net/20/1203/2020/A. de Laat et al.: Satellite data analysis of February 2018 Sinabung eruption 1217 Sentinel-5 Precursor: A GMES mission for global observations Winker, D. M., Vaughan, M. A., Omar, A., Hu, Y., Pow- of the atmospheric composition for climate, air quality and ell, K. A., Liu, Z., Hunt, W. H., and Young, S. A.: ozone layer applications, Remote Sens. Environ., 120, 70–83, Overview of the CALIPSO mission and CALIOP data doi:10.1016%2Fj.rse.2011.09.027, 2012. processing, J. Atmos. Ocean. Tech., 26, 2310–2323, Veefkind, J. P., de Haan, J. F., Sneep, M., and Levelt, P. F.: Im- https://doi.org/10.1175/2009JTECHA1281.1, 2009. provements to the OMI O2 –O2 operational cloud algorithm and WMO: Final Report of the Meeting on the Intercomparison of comparisons with ground-based radar–lidar observations, At- Satellite-based Volcanic Ash Retrieval Algorithms, Madison WI, mos. Meas. Tech., 9, 6035–6049, https://doi.org/10.5194/amt-9- USA 29 June–2 July 2015. 6035-2016, 2016. WMO: SCOPE Nowcasting, Volcanic Ash Algorithm Intercompar- Wang, P., Stammes, P., van der A, R., Pinardi, G., and van Roozen- ison – Pilot Project 2, available at: http://www.wmo.int/pages/ dael, M.: FRESCO+: an improved O2 A-band cloud retrieval prog/sat/meetings/documents/IPET-SUP-3_Doc_07-01-02_ algorithm for tropospheric trace gas retrievals, Atmos. Chem. SCOPE-NWC-PP2.pdf (last access: 1 February 2019), 2017. Phys., 8, 6565–6576, https://doi.org/10.5194/acp-8-6565-2008, Zhu, L., Li, J., Zhao, Y., Gong, H., and Li, W.: Re- 2008. trieval of volcanic ash height from satellite-based infrared Wang, P., Tuinder, O. N. E., Tilstra, L. G., de Graaf, M., and measurements, J. Geophys. Res.-Atmos., 122, 5364–5379, Stammes, P.: Interpretation of FRESCO cloud retrievals in case https://doi.org/10.1002/2016JD026263, 2017. of absorbing aerosol events, Atmos. Chem. Phys., 12, 9057– 9077, https://doi.org/10.5194/acp-12-9057-2012, 2012. Winker, D. M., Hunt, W. H., and McGill, M. J.: Initial perfor- mance assessment of CALIOP, Geophys. Res. Lett., 34, L19803, https://doi.org/10.1029/2007GL030135, 2007. www.nat-hazards-earth-syst-sci.net/20/1203/2020/ Nat. Hazards Earth Syst. Sci., 20, 1203–1217, 2020
You can also read