GWAS of allometric body shape indices in UK Biobank identifies loci suggesting associations with morphogenesis, organogenesis, adrenal cell ...
←
→
Page content transcription
If your browser does not render page correctly, please read the page content below
www.nature.com/scientificreports

                OPEN              GWAS of allometric body‑shape
                                  indices in UK Biobank identifies
                                  loci suggesting associations
                                  with morphogenesis,
                                  organogenesis, adrenal cell
                                  renewal and cancer
                                  Sofia Christakoudi1,2*, Evangelos Evangelou1,3, Elio Riboli1 & Konstantinos K. Tsilidis1,3

                                  Genetic studies have examined body-shape measures adjusted for body mass index (BMI), while
                                  allometric indices are additionally adjusted for height. We performed the first genome-wide
                                  association study of A Body Shape Index (ABSI), Hip Index (HI) and the new Waist-to-Hip Index and
                                  compared these with traditional indices, using data from the UK Biobank Resource for 219,872 women
                                  and 186,825 men with white British ancestry and Bayesian linear mixed-models (BOLT-LMM). One
                                  to two thirds of the loci identified for allometric body-shape indices were novel. Most prominent
                                  was rs72959041 variant in RSPO3 gene, expressed in visceral adipose tissue and regulating adrenal
                                  cell renewal. Highly ranked were genes related to morphogenesis and organogenesis, previously
                                  additionally linked to cancer development and progression. Genetic associations were fewer in
                                  men compared to women. Prominent region-specific associations showed variants in loci VEGFA
                                  and HMGA1 for ABSI and KLF14 for HI in women, and C5orf67 and HOXC4/5 for ABSI and RSPO3,
                                  VEGFA and SLC30A10 for HI in men. Although more variants were associated with waist and hip
                                  circumference adjusted for BMI compared to ABSI and HI, associations with height had previously
                                  been reported for many of the additional variants, illustrating the importance of adjusting correctly
                                  for height.

                                  Abbreviations
                                  ABSI	A body shape index
                                  ABSIUKB	A body shape index calibrated for UK Biobank participants
                                  ADAMTS	A disintegrin and metalloprotease domains with thrombospondins motifs
                                  AKR1C2	Aldo-keto reductase family 1 member C2
                                  BMI	Body mass index
                                  BOLT-LMM	Bayesian mixed-model association method
                                  C5orf67	Chromosome 5 open reading frame 67
                                  CADD	Combined Annotation Dependent Depletion
                                  CASC20	Cancer susceptibility 20
                                  CMIP	C-Maf inducing protein
                                  COBLL1	Cordon-bleu WH2 repeat protein like 1
                                  DLEU1	Deleted in lymphocytic leukemia 1
                                  eQTL	Expression Quantitative Trait Loci
                                  ERα	Oestrogen receptor α
                                  ERI1	Exoribonuclease 1

                                  1
                                   Department of Epidemiology and Biostatistics, School of Public Health, Imperial College London, St Mary’s
                                  Campus, Norfolk Place, London W2 1PG, UK. 2MRC Centre for Transplantation, King’s College London, Great Maze
                                  Pond, London SE1 9RT, UK. 3Department of Hygiene and Epidemiology, University of Ioannina School of Medicine,
                                  Ioannina, Greece. *email: s.christakoudi@imperial.ac.uk

Scientific Reports |   (2021) 11:10688               | https://doi.org/10.1038/s41598-021-89176-6                                            1

                                                                                                                                         Vol.:(0123456789)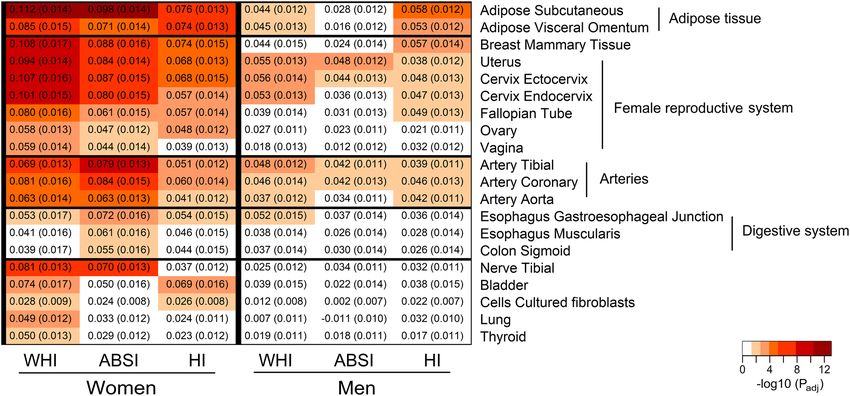
www.nature.com/scientificreports/
EYA Eyes absent homolog
FAM101A Filamin-interacting protein (readthrough region with ZNF664)
FGFR4 Fibroblast growth factor receptor 4
FUMA Functional Mapping and Annotation
GO Gene ontology
GWAS Genome-wide association study
HC Hip circumference
HCadjBMI Hip circumference adjusted for body mass index
HI Hip index
HIUKB Hip index calibrated for UK Biobank participants
HMGA1 High mobility group AT-hook 1
HPA Hypothalamic-pituitary-adrenal axis
KLF14 Kruppel-like factor 14
LD Linkage disequilibrium
MAF Minor allele frequency
MAGMA Multi-marker Analysis of GenoMic Annotation
MC1R Melanocortin 1 receptor
NEU1 Neutraminidase 1
NHANES National Health and Nutrition Examination Survey
PEMP Palmitoylated erythrocyte membrane protein
PLXND1 Plexin D1
SLC30A10 Solute carrier family 30 member 10
SNP Single nucleotide polymorphism
SSPN Sarcospan
TBX15 T-box transcription factor 15
TFAP4 Transcription factor AP-4
VEGFA Vascular endothelial growth factor-A
VEP Ensembl Variant Effect Predictor
WC Waist circumference
WCadjBMI Waist circumference adjusted for body mass index
WHI Waist-to-hip index
WHIUKB Waist-to-hip index calibrated for UK Biobank participants
WHR Waist-to-hip ratio
WHRadjBMI Waist-to-hip ratio adjusted for body mass index
WNT Wingless-type
XKR6 XK related 6
ZMIZ1 Zinc-finger MIZ-type containing 1
ZNF664 Zinc finger protein 664
The cardiometabolic complications of obesity are influenced by body shape, showing a positive association with
abdominal size and an inverse association with gluteofemoral size1. The waist-to-hip ratio (WHR) and body
mass index (BMI) are used correspondingly as an index of body shape and an index of general o besity2. The
WHR, however, is moderately correlated with BMI and cannot differentiate abdominal from gluteofemoral size.
Although waist (WC) and hip circumference (HC) are measures of specific body regions, they are both strongly
correlated with BMI. To account for the correlation with BMI, genome-wide association studies (GWAS) have
used traditionally residuals from linear models regressing each of WHR, WC, or HC on BMI, thus creating
body-shape indices independent from B MI3,4. Nevertheless, the adjustment of WC or HC for BMI introduces a
positive correlation with height, which is stronger than the association of WC or HC with height4.
An alternative approach to creating body-shape indices independent from body size and general obesity
has been implemented in the development of A Body Shape Index (ABSI) and Hip Index (HI)5,6. Similarly to
BMI, ABSI and HI are based on the principle of allometry, which accounts for the expansion of the dimensions
of individual body parts relative to the total body size with log-linear rather than linear models7. Similar to the
scaling of log-transformed weight to log-transformed height used for the development of BMI, log-transformed
WC and HC have each been scaled to log-transformed weight and log-transformed height to develop ABSI and
HI5,6. This scaling accounts for the expansion of body circumferences proportional to body size, as reflected in
height, and additionally accounts for the proportional expansion of body circumferences with general adiposity,
as reflected in body weight. Consequently, the allometric body-shape indices are independent by design from
height, as well as from BMI. Strong associations of ABSI with mortality and cardio-metabolic risk factors have
been reported5,8 and we have demonstrated that ABSI achieves better mortality risk stratification than alternative
body-shape indices, which are correlated with B MI9.
There are, however, no studies to date examining the genetic associations of ABSI and HI, no allometric
counterpart of WHR and no insight into the influence of the correlation of traditional body-shape indices with
height. The aims of our study, therefore, were to perform the first GWAS of allometric body-shape indices and
to compare allometric and traditional body-shape indices with respect to their genetic associations. Our GWAS
provides novel information for unbiased genetic associations of body-shape indices.
Scientific Reports | (2021) 11:10688 | https://doi.org/10.1038/s41598-021-89176-6 2
Vol:.(1234567890)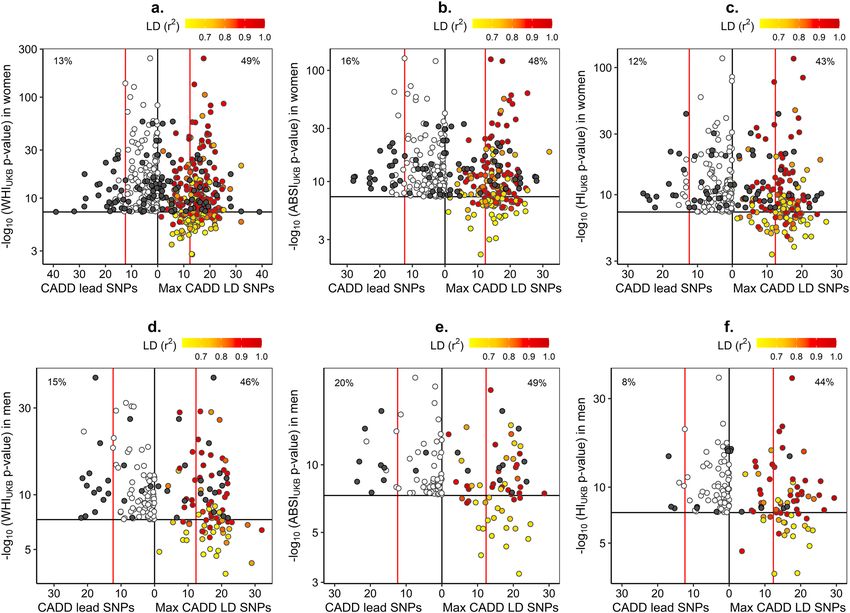
www.nature.com/scientificreports/
Results
We used data from the UK Biobank for 219,872 women and 186,825 men with white British ancestry (Sup-
plementary Table S1). For allometric body-shape indices, we used ABSI, HI and a waist-to-hip index (WHI)
calibrated for UK Biobank participants ( ABSIUKB, HIUKB and W HIUKB, see details in Methods). For traditional
body-shape indices, we used WC, HC and WHR adjusted for BMI in linear models (WCadjBMI, HCadjBMI and
WHRadjBMI). We examined women and men separately, as pronounced sexual dimorphisms have been reported
for the genetic associations of traditional body-shape i ndices10.
Genetic variants associated with allometric body‑shape indices. We determined independent
significant single nucleotide polymorphisms (SNPs) and consolidated them in independent genomic risk loci,
represented by a locus lead SNP, with Functional Mapping and Annotation (FUMA) (see details in Methods).
A larger number of independent genomic risk loci were associated with W HIUKB (282 in women, 97 in
men) compared to ABSIUKB (200 in women, 65 in men) and HIUKB (171 in women, 75 in men) (Table 1). The
highest-ranked lead SNPs associated with W HIUKB (rs72959041 in women and rs577721086 in men) were both
in the RSPO3 locus and in very strong linkage disequilibrium (r2 > 0.99). In addition, rs72959041 was the second
highest-ranked lead SNP for A BSIUKB in women and was the highest-ranked lead SNP for H IUKB in both sexes
(Supplementary Table S2). This variant stood out with some of the largest effect sizes, with a positive sign of
the regression coefficients for A BSIUKB and W HIUKB and a negative sign for H IUKB, reflecting the phenotype of
the minor allele. Most of the independent variants associated with WHIUKB similarly showed regression coef-
ficients with opposite signs for A BSIUKB and HIUKB (Supplementary Fig. S1). Nevertheless, some variants were
associated preferentially with A BSIUKB or H IUKB. In women, the most outstanding examples of loci associated
exclusively with ABSIUKB were VEGFA and HMGA1, while the most prominent locus associated exclusively with
HIUKB was KLF14. In men, prominent loci with variants associated exclusively with A BSIUKB were AC022431.2
(C5orf67), RP11-115J16.1, RP5-859D4.3 (CASC20) and the region including loci HOXC4, RP11-834C11.14 and
HOXC5, while the most prominent loci associated exclusively with HIUKB were RSPO3, VEGFA and RP11-95P13.2
(SLC30A10) (Supplementary Fig. S2).
Approximately two thirds of the independent significant SNPs but less than one fifth of the correspond-
ing genomic risk loci associated in our study with W HIUKB were novel, i.e. they have not been reported in the
NHGRI-EBI GWAS C atalog11 in association with WHR or WHR adjBMI (Table 1, Supplementary Table S3).
Nevertheless, over two thirds of the independent significant SNPs and one third of the corresponding genomic
risk loci associated with A BSIUKB were novel, i.e. not previously reported in association with WC or W CadjBMI.
Further, most of the independent significant SNPs and over two thirds of the corresponding genomic risk loci
associated with H IUKB were novel, i.e. not previously reported in association with HC or H CadjBMI. It was notable,
however, that many of the novel highest-ranked lead SNPs associated with allometric body-shape indices were
in strong linkage disequilibrium (LD at r2 ≥ 0.6) with variants previously reported in association with the corre-
sponding traditional body-shape index, which in our study showed lower significance (Fig. 1). Exceptions were
the novel highly ranked lead SNPs associated with HIUKB in men, rs998584 in the VEGFA locus and rs6066114
in the EYA2 locus, which did not include in their clumps variants previously reported in association with HC or
HCadjBMI, while for rs113733630 in the TFAP4 locus, the previously reported variant was not in the same LD
block (Supplementary Table S2).
The deleteriousness Combined Annotation Dependent Depletion (CADD) score was above the recommended
cut-off 12.3712 for 8% to 20% of the locus lead SNPs associated with allometric body-shape indices (Fig. 2).
Nevertheless, almost half of all locus lead SNPs were in strong LD with a variant with genome-wide significance
showing higher CADD than the cut-off.
Following recent reports of a fine-scale population structure in UK Biobank13, we checked matches with
the SNPs reported in association with birth location. Only rs1805007 (MC1R), reported in association with
height, was identified in our study as a candidate SNP and was included in the LD block of locus lead SNPs
for WCadjBMI and H CadjBMI in women and men (lowest P = 4.4*10–11). Although rs9268556 (MHC region),
reported in association with forced vital capacity, was additionally identified as a candidate SNP for W HIUKB,
ABSIUKB and W HRadjBMI in women and H CadjBMI in men (lowest P = 2.4*10–9), this was not included in the
LD block of a locus lead SNP.
Sexual dimorphism in the genetic associations of allometric body‑shape indices. The genetic
association patterns of allometric body-shape indices differed considerably between women and men. The her-
itability was larger in women compared to men, with up to three times more independent significant SNPs
identified in women (Table 1), when the excess of women vs men in the dataset was only approximately 20%.
Some 30% of the independent significant SNPs for A BSIUKB but 10% or less for H
IUKB showed sex differences
sex < 5*10–6 (Table 1). Several highly ranked variants, however, were particularly affected (Sup-
in effect size at p
plementary Fig. S3). Thus, prominent associations with WHIUKB and A BSIUKB in women but not in men showed
variants in loci COBLL1, RP11-95P13.1, ADAMTS9-AS2, CMIP and AC022431.2 (C5orf67) and variants in the
region including loci ZNF664 and FAM101, while KLF14 was the most prominent locus associated with HIUKB
in women but not in men (psex < 5*10–28 for all independent significant SNPs in these loci). In addition, although
variants in RSPO3 locus were the highest-ranked associated with WHIUKB and HIUKB in both sexes, variants in
the VEGFA and RSPO3 loci were associated with ABSIUKB almost exclusively only in women, while variants in
the VEGFA locus were associated with HIUKB mainly in men (Supplementary Fig. S3).
Scientific Reports | (2021) 11:10688 | https://doi.org/10.1038/s41598-021-89176-6 3
Vol.:(0123456789)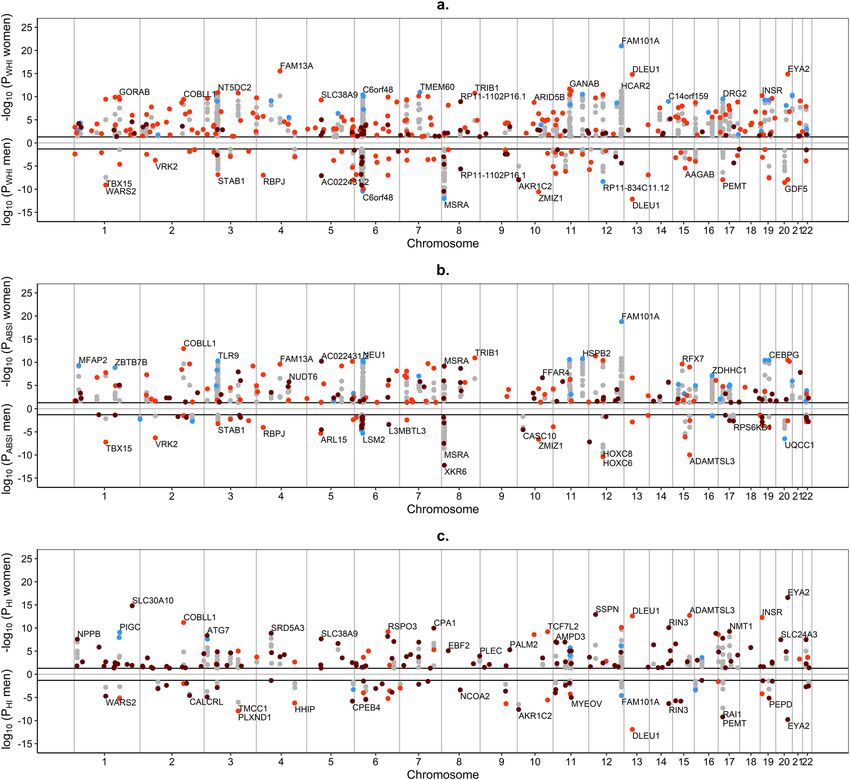
www.nature.com/scientificreports/
WHIUKB WHRadjBMI ABSIUKB WCadjBMI HIUKB HCadjBMI
Women
Total number
a
Genomic Risk Loci (SNP-based) 282 276 200 270 171 329
a
Lead SNPs 586 579 368 502 282 618
a
Independent Significant SNPs 1,988 1,959 1,273 1,586 814 2,008
a
Candidate SNPs 58,203 58,172 42,447 49,768 21,553 65,934
b
Genomic Risk Regions (gene-based) 237 229 158 228 136 295
b
Significant Genes 759 748 584 707 299 923
c
Reported for Index in GWAS Catalog
Genomic Risk Loci (SNP-based) 236 (84) 237 (86) 119 (60) ** 201 (74) ** 31 (18) * 87 (26) *
Independent Significant SNPs 729 (37) 718 (37) 278 (22) *** 478 (30) *** 40 (4.9) 121 (6.0)
Genomic Risk Regions (gene-based) 181 (76) 177 (77) 100 (63) 157 (69) 26 (19) 72 (24)
Significant Genes 342 (45) 337 (45) 172 (29) * 262 (37) * 33 (11) 90 (9.8)
d
Reported for Height in GWAS Catalog
Locus Lead SNPs 41 (15) 42 (15) 39 (20) ** 93 (34) ** 18 (11) *** 165 (50) ***
Independent Significant SNPs 132 (6.6) 127 (6.5) 103 (8.1) *** 227 (14) *** 52 (6.4) *** 440 (22) ***
Lead Genes 92 (39) 89 (39) 71 (45) 117 (51) 63 (46) * 174 (59) *
Significant Genes 196 (26) 188 (25) 141 (24) * 228 (32) * 96 (32) * 373 (40) *
d
Reported for Cancer in GWAS Catalog
Locus Lead SNPs 19 (6.7) 20 (7.2) 20 (10) 23 (8.5) 9 (5.3) 30 (9.1)
Independent Significant SNPs 92 (4.6) 96 (4.9) 73 (5.7) 66 (4.2) 26 (3.2) * 104 (5.2) *
Lead Genes 66 (28) 66 (29) 53 (34) 66 (29) 41 (30) 80 (27)
Significant Genes 149 (20) 150 (20) 129 (22) * 120 (17) * 70 (23) 227 (25)
e
Sex Difference
Independent Significant SNPs 489 (25) 482 (25) 373 (29) *** 328 (21) *** 85 (10) *** 66 (3.3) ***
f
Difference from Alternative Index
Independent Significant SNPs 64 (3.2) 48 (2.5) 259 (20) * 399 (25) * 103 (13) *** 987 (49) ***
Correlation
Allometric vs Traditional Index rallo_trad 0.995 0.923 0.785
Women vs Men rsex 0.163 0.161 0.144 0.185 0.143 0.255
2 h
Heritability h g 0.258 (0.001) 0.253 (0.001) 0.211 (0.001) 0.244 (0.001) 0.178 (0.001) 0.273 (0.001)
Men
Total number
a
Genomic Risk Loci (SNP-based) 97 82 65 188 75 262
a
Lead SNPs 146 122 81 273 93 435
a
Independent Significant SNPs 617 571 266 842 222 1,400
a
Candidate SNPs 23,462 22,398 11,505 29,621 7,328 47,701
b
Genomic Risk Regions (gene-based) 83 77 61 164 52 222
b
Significant Genes 303 312 183 421 106 724
c
Reported for Index in GWAS Catalog
Genomic Risk Loci (SNP-based) 88 (91) 76 (93) 42 (65) 141 (75) 18 (24) 80 (31)
Independent Significant SNPs 173 (28) 161 (28) 65 (24) * 283 (34) * 22 (9.9) 110 (7.9)
Genomic Risk Regions (gene-based) 60 (72) 58 (75) 31 (51) * 108 (66) * 17 (33) 68 (31)
Significant Genes 106 (35) 104 (33) 45 (25) * 162 (38) * 22 (21) * 86 (12) *
d
Reported for Height in GWAS Catalog
Locus Lead SNPs 25 (26) 16 (20) 22 (34) *** 119 (63) *** 14 (19) *** 162 (62) ***
Independent Significant SNPs 64 (10) 55 (9.6) 40 (15) *** 235 (28) *** 30 (14) *** 373 (27) ***
Lead Genes 40 (48) 35 (45) 25 (41) * 103 (63) * 25 (48) 140 (63)
Significant Genes 76 (25) 80 (26) 47 (26) *** 182 (43) *** 38 (36) 297 (41)
d
Reported for Cancer in GWAS Catalog
Locus Lead SNPs 10 (10) 10 (12) 10 (15) 19 (10) 6 (8.0) 26 (9.9)
Independent Significant SNPs 56 (9.1) 57 (10) 28 (11) * 49 (5.8) * 12 (5.4) 93 (6.6)
Lead Genes 28 (34) 27 (35) 22 (36) 47 (29) 17 (33) 59 (27)
Significant Genes 99 (33) 103 (33) 50 (27) 88 (21) 25 (24) 170 (23)
e
Sex Difference
Independent Significant SNPs 35 (5.7) 29 (5.1) 10 (3.8) 32 (3.8) 16 (7.2) ** 28 (2.0) **
f
Difference from Alternative Index
Independent Significant SNPs 73 (12) 65 (11) 58 (22) *** 397 (47) *** 44 (20) *** 877 (63) ***
Correlation
Allometric vs Traditional Index rallo_trad 0.994 0.879 0.759
2 h 0.170 (0.002) 0.162 (0.002) 0.149 (0.002) 0.225 (0.002) 0.145 (0.002) 0.276 (0.002)
Heritability h g
*** *** *** *** ***
Scientific Reports | (2021) 11:10688 | https://doi.org/10.1038/s41598-021-89176-6 4
Vol:.(1234567890)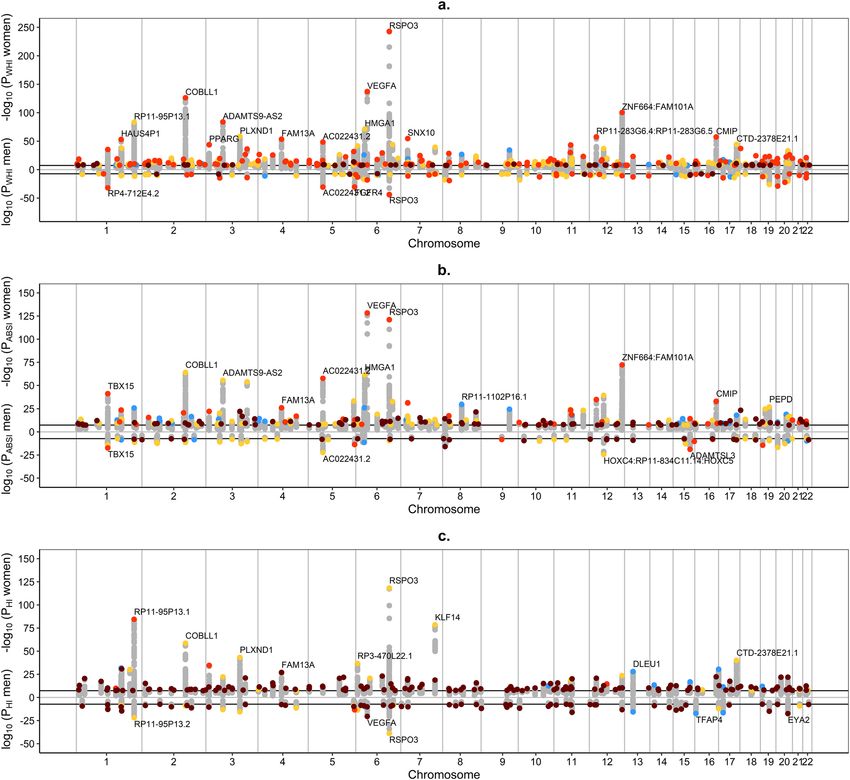
www.nature.com/scientificreports/
Table 1. Counts and overlaps of independent genetic variants and loci associated with allometric and
traditional body-shape indices in women and men. a Based on FUMA; bBased on MAGMA; cNumber
(percentage from total per index) reported in the NHGRI-EBI GWAS C atalog11 (https://www.ebi.ac.uk/gwas/
home, accessed on 07/04/2021) in association with the corresponding traditional body-shape index (with
or without adjustment for body mass index, BMI), i.e. the waist-to-hip ratio for W HIUKB and WHRadjBMI
(catalogue sets EFO_0004343, EFO_0007788, EFO_0004302), waist circumference for A BSIUKB and W CadjBMI
(EFO_0004342, EFO_0007789, EFO_0004302), hip circumference for H IUKB and HCadjBMI (EFO_0005093,
EFO_0008039, EFO_0004302). To ensure novelty, a match was counted for an independent significant SNP if
any of the candidate SNPs in the LD block was reported and for a genomic risk locus (or region) if any of the
corresponding independent significant SNPs (or genes) was reported; dNumber (percentage from total per
index), counting indirect matches only for SNPs in strong LD, i.e. candidate SNPs within the corresponding LD
block for independent significant SNPs and for a genomic risk locus (or region) only a match of the independent
significant SNP (or gene) promoted to a locus lead SNP (or lead gene) (EFO_0004339, EFO_0004302 for height;
EFO_0000311 for cancer); eNumber (percentage from total per index) showing sex difference ( pdifference < 5*10–6
for any candidate SNP within the corresponding LD block); fAs for ebut reflecting difference from the
corresponding alternative body-shape index, i.e. WHRadjBMI for WHIUKB, WCadjBMI for ABSIUKB, HCadjBMI
for HIUKB and vice versa; ABSIUKB-a body shape index calibrated for UK Biobank participants; HCadjBMI-
hip circumference adjusted for BMI; H IUKB-hip index calibrated for UK Biobank participants; WCadjBMI-
waist circumference adjusted for BMI; W HIUKB-waist-to-hip index calibrated for UK Biobank participants;
WHRadjBMI-waist-to-hip ratio adjusted BMI; h 2g-estimated (pseudo-) heritability, based on the genetic
relationship matrix in BOLT-LMM (approximate standard error, 316/number of individuals), comparison
between men and women; r sex-Spearman’s rank correlation coefficient between regression coefficients in women
and men across all examined genetic variants (used in the test for difference of effect size or heritability);
rallo-trad-correlation coefficient as for r sex but between the corresponding allometric and traditional index; Fisher’s
exact test was used to compare percentages between allometric and traditional body-shape indices: *P < 0.05;
**P < 0.001; ***P < 0.0001.
Gene‑level associations with allometric body‑shape indices. We examined gene-level associations
with Multi-marker Analysis of GenoMic Annotation (MAGMA) employed in FUMA, which uses the associa-
tion statistics of all SNPs included in a gene (see Methods for details).
Similar to SNP-based analyses, a larger number of non-overlapping genomic risk regions were associated
with WHIUKB (237 in women, 83 in men) compared to ABSIUKB (158 in women, 61 in men) and HIUKB (136 in
women, 52 in men) and the proportions of novel gene-based regions were comparable to the proportions of novel
SNP-based loci (Table 1). There were, however, differences in the lead genes (Fig. 3). The highest-ranked region
for WHIUKB and ABSIUKB in women was FAM101A and for W HIUKB and HIUKB in men was DLEU1. Prominent
novel genes with their corresponding genomic risk regions were XKR6 for ABSIUKB and ERI1 for WHIUKB
and ABSIUKB in men, EYA2 for HIUKB in both women and men, SLC30A10 and SSPN for HIUKB in women and
PEMP and AKR1C2 for HIUKB in men (Supplementary Table S4). Although few independent significant SNPs
had previously been reported in association with cancer (or were in strong LD with previously reported SNPs,
Supplementary Fig. S4), one third of the lead genes had previously been reported in association with cancer
(Table 1), including the prominent lead genes DLEU1 and ZMIZ1 and a notable cluster of significant genes in
the region of NEU1 on chromosome 6 (Supplementary Fig. S5).
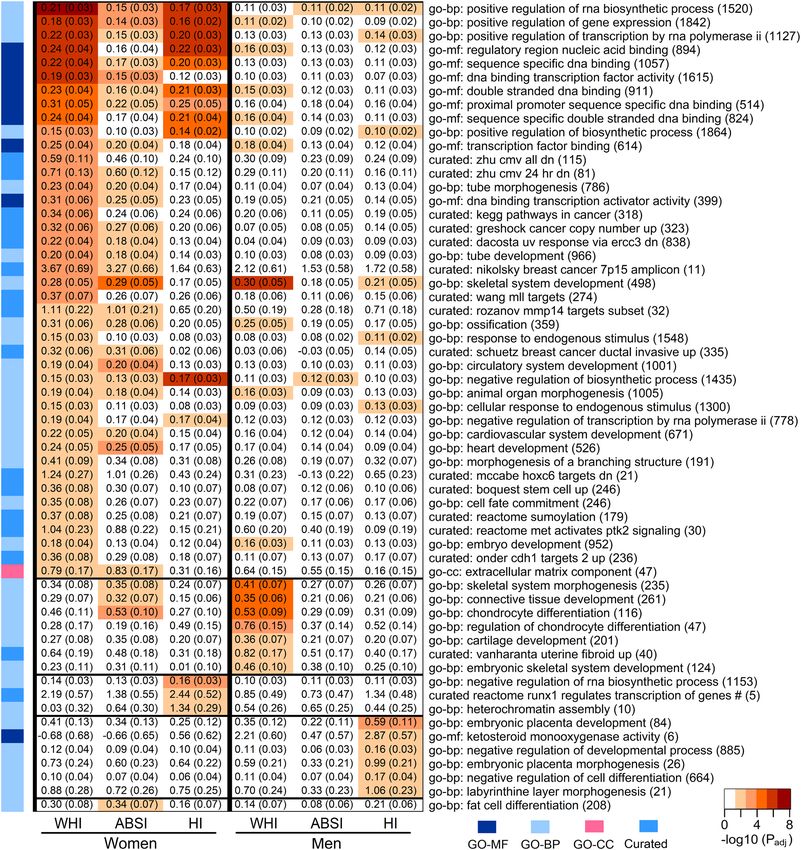
Competitive gene-set analysis showed associations of allometric body-shape indices with gene sets related
to embryonal morphogenesis and organogenesis, regulation of DNA binding, gene expression, biosynthetic
processes and cell differentiation, transcription factor complexes, extracellular matrix component, circulatory
system development, skeletal system development, ossification and chondrocyte differentiation and several can-
cers, with only a single gene set related to fat cell differentiation, which was associated with ABSIUKB in women
(Fig. 4). A larger number of gene sets showed significant associations with W HIUKB and A BSIUKB in women (42
and 29, correspondingly) compared to men (16 and 2) but a similar number were associated with H IUKB (14 in
women, 12 in men), although with only three overlapping.
Associations with expression Quantitative Trait Loci (eQTL) were significant in both women and men for
adipose tissue (subcutaneous and visceral omentum), arteries (tibial, coronary and aorta) and, unexpectedly,
for female reproductive organs (breast mammary tissue, uterus, ectocervix, endocervix and fallopian tube) and,
in women only, also for ovary and vagina (Fig. 5).
Comparison between allometric and traditional body‑shape indices. On the one hand, WHIUKB
and WHRadjBMI were very strongly phenotypically correlated with each other and both were uncorrelated with
height or BMI (Supplementary Table S5). Correspondingly, the ranking of independent significant SNPs associ-
ated with them was in excellent agreement, especially in women (Fig. 6a,d, Supplementary Fig. S6), with only
some 5% showing differences in effect size at pdifference < 5 * 10–6 (Table 1, Supplementary Fig. S7 for women, Sup-
plementary Fig. S8 for men), mainly for variants previously reported in association with height (Supplementary
Fig. S9 for women, Supplementary Fig. S10 for men).
On the other hand, while the allometric indices A BSIUKB and HIUKB were phenotypically uncorrelated with
height and BMI, the traditional indices W
CadjBMI and HCadjBMI were uncorrelated only with BMI. The adjust-
ment for BMI was apparently introducing a moderate positive correlation with height, as height was only weakly
Scientific Reports | (2021) 11:10688 | https://doi.org/10.1038/s41598-021-89176-6 5
Vol.:(0123456789)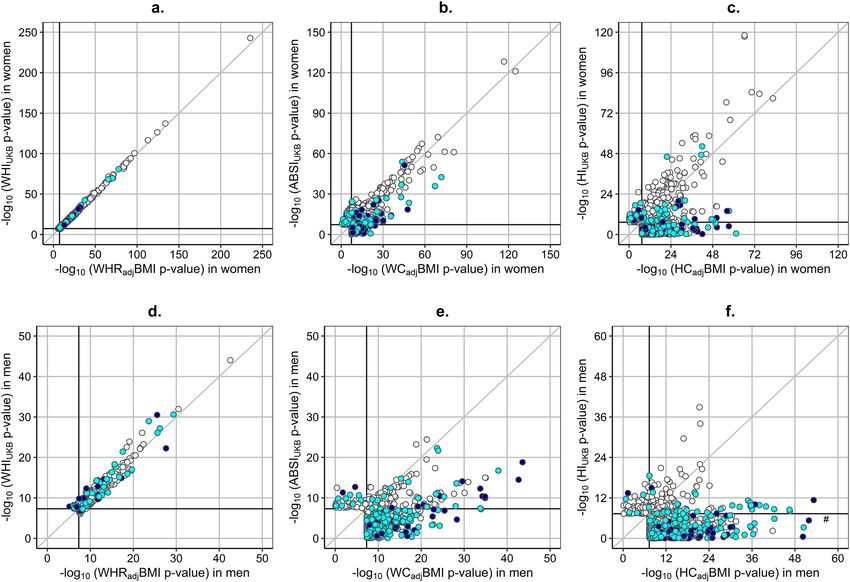
www.nature.com/scientificreports/
Figure 1. Miami plots of candidate SNPs identified for allometric body-shape indices in women and men.
(a) GWAS of waist-to-hip index calibrated for UK Biobank participants ( WHIUKB); (b) GWAS of a body shape
index calibrated for UK Biobank participants ( ABSIUKB); (c) GWAS of hip index calibrated for UK Biobank
participants (HIUKB); P-P-values were derived from BOLT-LMM infinitesimal models; SNP-single nucleotide
polymorphism; horizontal lines correspond to the genome-wide significance cut-off P = 5*10–8. Genomic risk
loci with their corresponding locus lead SNPs were identified with FUMA v1.3.6a. All candidate SNPs are
shown in grey, locus lead SNPs are colour-coded as follows: (grey circle) candidate SNPs; (dark red circle)
novel genomic risk locus identified in the current study, with no previously reported candidate SNPs; (orange
circle) genomic risk locus with a previously reported locus lead SNP; (yellow circle) genomic risk locus with a
previously reported SNP in strong linkage disequilibrium (LD) with the locus lead SNP at r 2 ≥ 0.6; (cyan circle)
genomic risk locus with previously reported other candidate SNP. SNPs identified for allometric body-shape
indices in the current study were matched against SNPs reported in the NHGRI-EBI GWAS C atalog11 (https://
www.ebi.ac.uk/gwas/home, accessed on 07/04/2021) in association with the corresponding traditional body-
shape index (with or without adjustment for body mass index, BMI), i.e. the waist-to-hip ratio for W HIUKB
(catalogue sets EFO_0004343, EFO_0007788, EFO_0004302); waist circumference for A BSIUKB (EFO_0004342,
EFO_0007789, EFO_0004302); hip circumference for H IUKB (EFO_0005093, EFO_0008039, EFO_0004302).
correlated with unadjusted WC and HC (Supplementary Table S5). Notably, a larger number of independent
significant SNPs were associated with W CadjBMI and H CadjBMI, with half or more of them showing significant
differences in effect size compared to their allometric counterparts ABSIUKB and HIUKB (Table 1, Supplementary
Scientific Reports | (2021) 11:10688 | https://doi.org/10.1038/s41598-021-89176-6 6
Vol:.(1234567890)www.nature.com/scientificreports/
Figure 2. Deleteriousness (CADD) score of locus lead SNPs identified for allometric body-shape indices.
(a) waist-to-hip index (WHIUKB) calibrated for UK Biobank women (n = 282 genomic risk loci with the
corresponding locus lead SNPs); (b) a body shape index ( ABSIUKB) calibrated for UK Biobank women
(n = 200); (c) hip index (HIUKB) calibrated for UK Biobank women (n = 171); (d) WHIUKB for UK Biobank men
(n = 97); (e) ABSIUKB for UK Biobank men (n = 65); (f) HIUKB for UK Biobank men (n = 75). CADD-Combined
Annotation Dependent Depletion; LD-linkage disequilibrium; SNP-single nucleotide polymorphism; red
vertical lines-recommended cut-off 12.37 for CADD (the higher the more deleterious)12; horizontal line-
genome-wide significance cut-off (P = 5*10–8); left-hand side-CADD for the locus lead SNP of each genomic risk
locus, with the proportion above the cut-off; right-hand side-candidate SNPs in strong LD with the locus lead
SNP (colour-coded according to r2 ≥ 0.6), showing the maximum CADD within the LD block, plotted with the
corresponding significance on the y-axis; PWHI / ABSI / HI-P-values for body-shape indices, derived from BOLT-
LMM infinitesimal models; (black circle)-marks the locus lead SNP when this is showing the maximum CADD
within the corresponding LD block; percentages (top corners)-percentage above the cut-offs for both, CADD
and genome-wide significance (all differences between left-hand side and right-hand side proportions were
significant at P < 0.0001 when compared with Fisher’s exact test, except for A BSIUKB in men (P = 0.0008).
Fig. S7, Supplementary Fig. S8), except for W CadjBMI and A BSIUKB in women, which showed more similarity
(Fig. 6b). The main differences between W CadjBMI and A BSIUKB (Fig. 6b,e) and between HCadjBMI and H IUKB
(Fig. 6c,f) concerned independent variants which were either previously reported in association with height or
were in strong LD with variants reported in association with height (Supplementary Fig. S9, Supplementary
Fig. S10). Half or more of the locus lead SNPs for WCadjBMI in men and for HCadjBMI in men and women had
previously been associated with height, compared to less than one third for A BSIUKB and H
IUKB (Table 1). More
comparable proportions of lead genes (with gene-level significance) had previously been reported in association
with height (less than half for allometric indices, Supplementary Fig. S11, and more than half for traditional
indices), but the absolute number of lead genes identified for traditional indices was considerably larger (Table 1).
Discussion
Our study presents the first GWAS of allometric body-shape indices, performed separately in women and men
with white British ancestry, and a comparison with traditional body-shape indices. One third of the genomic
risk loci associated with A
BSIUKB and over two thirds of the genomic risk loci associated with H
IUKB in our study
were novel. Genetic associations were sexually dimorphic, with fewer independent variants identified in men
compared to women. The highest-ranked independent variant for W HIUKB, ABSIUKB in women and H IUKB was
Scientific Reports | (2021) 11:10688 | https://doi.org/10.1038/s41598-021-89176-6 7
Vol.:(0123456789)www.nature.com/scientificreports/
Figure 3. Miami plots of significant genes identified for allometric body-shape indices in women and men.
(a) waist-to-hip index calibrated for UK Biobank participants (WHIUKB); (b) a body shape index calibrated for
UK Biobank participants (ABSIUKB); (c) hip index calibrated for UK Biobank participants (HIUKB); P-P-values
were derived from MAGMA v1.08 employed in FUMA v1.3.6a and were adjusted with Bonferroni correction
for 19,088 protein-coding genes; SNP-single nucleotide polymorphism; horizontal lines-correspond to P = 0.05
after Bonferroni correction. Significant genes within 250 kb window were consolidated in genomic risk regions
represented by a lead gene. All significant genes are shown in grey, lead genes are colour-coded as follows:
(grey circle)-significant genes; (dark red circle)-novel genomic risk region identified in the current study, with
no previously reported significant gene; (orange circle)-genomic risk region with a previously reported lead
gene; (cyan circle)-genomic risk region including a previously reported significant gene (not the lead gene).
Genes identified for allometric body-shape indices in the current study were matched against genes reported in
the NHGRI-EBI GWAS Catalog11 (https://www.ebi.ac.uk/gwas/home, accessed on 07/04/2021) in association
with the corresponding traditional body-shape index (with or without adjustment for body mass index, BMI),
i.e. the waist-to-hip ratio for W
HIUKB (catalogue sets EFO_0004343, EFO_0007788, EFO_0004302); waist
circumference for ABSIUKB (EFO_0004342, EFO_0007789, EFO_0004302); hip circumference for H IUKB
(EFO_0005093, EFO_0008039, EFO_0004302).
rs72959041 in the RSPO3 locus. W HIUKB, combining WC and HC, showed higher sensitivity to detect genetic
associations compared to the regional indices A
BSIUKB and H
IUKB, based individually on WC or HC. The genetic
association patterns of WHIUKB and W
HRadjBMI were very similar. ABSIUKB and H IUKB showed fewer genetic
Scientific Reports | (2021) 11:10688 | https://doi.org/10.1038/s41598-021-89176-6 8
Vol:.(1234567890)www.nature.com/scientificreports/
Figure 4. Gene sets associated with allometric body-shape indices. ABSI-a body shape index calibrated for UK
Biobank participants ( ABSIUKB); Currated-curated gene set; GO-BP-gene ontology biological process; GO-CC-
gene ontology cellular component; GO-MM-gene ontology molecular function; HI-hip index calibrated for
UK Biobank participants ( HIUKB); WHI-waist-to-hip index calibrated for UK Biobank participants ( WHIUKB);
#-reactome runx1 regulates transcription of genes involved in wnt signaling. The figure includes gene sets
identified using competitive gene-set analysis with MAGMA v1.08 employed in FUMA v1.3.6a as significant
for at least one of the allometric indices in women or men with adjusted P adj < 0.05, incorporating Bonferroni
correction for multiple comparisons for 15,485 gene sets. Gene sets with P adj < 0.05 for WHIUKB in women
were sorted in descending order of Padj, for WHIUKB in women, then the remaining gene sets with Padj < 0.05
for WHIUKB in men were sorted in descending order of Padj for WHIUKB in men, then the remaining gene sets
with Padj < 0.05 for HIUKB in women were sorted in descending order of Padj for HIUKB in women and last, the
remaining gene sets with Padj < 0.05 for HIUKB in men were sorted in descending order of Padj for HIUKB in men,
leaving a single gene set associated only with ABSIUKB in women. The horizontal lines mark the start of the next
sorting criterion. White cells are gene sets with P adj ≥ 0.05 for the corresponding body-shape index.
Scientific Reports | (2021) 11:10688 | https://doi.org/10.1038/s41598-021-89176-6 9
Vol.:(0123456789)www.nature.com/scientificreports/
Figure 5. eQTLs associated with allometric body-shape indices. ABSI-a body shape index calibrated for UK
Biobank participants ( ABSIUKB); eQTLs-expression Quantitative Trait Loci; HI-hip index calibrated for UK
Biobank participants ( HIUKB); WHI-waist-to-hip index calibrated for UK Biobank participants ( WHIUKB).
The figure includes specific tissues from the Genotype-Tissue Expression (GTEx) v8.0 database, queried for
associations with eQTLs with gene-property analysis, which were identified by MAGMA v1.08 employed
in FUMA v1.3.6a as significant for at least one of the allometric indices in women or men, i.e. with adjusted
Padj < 0.05, incorporating Bonferroni correction for multiple comparisons for 54 tissues. White cells are tissues
with Padj ≥ 0.05 for the corresponding body-shape index.
associations compared correspondingly to WCadjBMI and HCadjBMI, which were associated with a larger pro-
portion of variants previously reported in association with height.
Our study highlights the importance of the RSPO3 locus for body shape and fat distribution in individuals
with white British ancestry and potentially in individuals with white ethnic background. RSPO3 protein, together
with wingless-type WNT proteins, activate the canonical WNT/β-catenin pathway, which plays a depo-specific
role in regulating locally adipocyte hyperplasia, hypertrophy and b rowning14. RSPO3 shows differential expres-
sion in adipose depots, with the highest expression in visceral, intermediate in abdominal subcutaneous and low-
est in gluteal subcutaneous adipose tissue15. RSPO3 additionally promotes angioblast specification and vascular
development16, plays a key role throughout life in maintaining the structural zonation and the replenishment of
damaged cells in the adrenal g lands17, regulates the renewal and differentiation of stem c ells18, and contributes to
cancer development and p rogression19,20. Genetic variants in the RSPO3 locus associated with abdominal obesity
have additionally been associated with dyslipidaemia21, thus relating the RSPO3 gene to the metabolic syndrome.
The highest-ranked RSPO3 variants, rs72959041 (in women) and rs577721086 (in men), which are in strong
linkage disequilibrium, are specific to European p opulations22 and have previously been reported in association
with WHRadjBMI3,4,23. The active variant, however, may be rs577721086, as this is located in the attachment site
of CCCTC‑binding factor, which acts as a gene repressor, insulator or activator, but also regulates the chromatin
structure and enables inter-chromosomal i nteractions24.
Although the genetic associations of body-shape indices are interpreted traditionally from the perspective
of the adipose tissue and insulin r esistance25, highly ranked variants associated with body shape are located in
genes coding transcription factors, receptors and enzymes involved in morphogenesis, embryonal developmental,
cell proliferation and cell survival, which have additionally been linked to various cancers. Thus, in addition to
the RSPO3 proteins, HMGA1 and TFAP4 activate the WNT/β-catenin pathway, stimulate cell migration and
invasion and promote cancer progression26,27. VEGFs, which are upregulated by hypoxia, are key factors for
tumour-associated angiogenesis, tissue infiltration and metastasis28. PLXND1, which is involved in angiogenesis
and is upregulated by VEGFs, has a constitutively low expression in adult tissues but is overexpressed in cancer
tissues and their v asculature29. KLF14 is associated with insulin resistance, dyslipidaemia, type 2 diabetes and a
female-specific shift of body fat from gynoid to abdominal stores, in agreement with the hip-specific association
in women found in our study. In mice, adipocyte-specific deletion of Klf14 results in similar metabolic effects,
while Klf14 knockout results in spontaneous t umorigenesis30. TBX15 belongs to a family of transcription factors
regulating differentiation, proliferation, tissue integrity and epithelial-mesenchymal transition, which are relevant
to cancer development and metastasis31. Overexpression, mutations and epigenetic silencing of ADAMTS genes
have been reported in different tumours32. SLC30A10 is a zinc transporter maintaining zinc homeostasis, which
when dysregulated can result in cancer initiation and p rogression33. FGFR4 plays a critical role in embryonic
development, tissue repair, tumour angiogenesis and progression34. EYA1-4 proteins can influence tumour pro-
gression through several m echanisms35. Homeobox (HOX) genes code transcription factors with DNA-binding
Scientific Reports | (2021) 11:10688 | https://doi.org/10.1038/s41598-021-89176-6 10
Vol:.(1234567890)www.nature.com/scientificreports/
Figure 6. Significance ranking of independent significant SNPs: comparison between pairs of traditional and
allometric body-shape indices. (a) independent significant SNPs (at r2 < 0.6 within 1 Mb window) for WHIUKB
(n = 1,988) or WHRadjBMI (n = 1,959) in women; (b) independent significant SNPs for ABSIUKB (n = 1,273)
or WCadjBMI (n = 1,586) in women; (c) independent significant SNPs for HIUKB (n = 814) or HCadjBMI
(n = 2,008) in women; (d) independent significant SNPs for WHIUKB (n = 617) or WHRadjBMI (n = 571) in
men; (e) independent significant SNPs for ABSIUKB (n = 266) or WCadjBMI (n = 842) in men; (f) independent
significant SNPs for H
IUKB (n = 222) or HCadjBMI (1,400) in men. Association statistics p-values were derived
from BOLT-LMM infinitesimal models. A BSIUKB-a body shape index calibrated for UK Biobank participants;
BMI-body mass index; HCadjBMI-hip circumference adjusted for BMI; HIUKB-hip index calibrated for UK
Biobank participants; SNP-single nucleotide polymorphism; WCadjBMI-waist circumference adjusted for
BMI; WHRadjBMI-waist-to-hip ratio adjusted for BMI; WHIUKB-waist-to-hip index calibrated for UK Biobank
participants. Colour scale-colour-marked were only SNPs reported as associated with height in the NHGRI-EBI
GWAS Catalog11 (https://www.ebi.ac.uk/gwas/home, accessed on 07/04/2021), i.e. included in catalogue sets
EFO_0004339 or EFO_0004302; (navy circle)-independent significant SNP reported in association with height;
(cyan circle)-independent significant SNP in strong LD (at r2 ≥ 0.6) with a SNP reported in association with
height.
activity, which regulate the formation of axial patterns and body shape during embryogenesis and have been
implicated in cancer d evelopment36. COBLL1 is the ancestor of a family of proteins involved in morphogenesis
and embryonal patterning in organisms with axial symmetry and is upregulated in castrate-resistant prostate
cancer with poor p rognosis37. Upregulation of DLEU1 can also promote t umorigenesis38. A question, therefore,
emerges whether excess abdominal fat mediates the development of cancers associated with abdominal o besity39,
or abdominal obesity and cancer are parallel outcomes with shared genetic predisposition. Although studies
exploring a causal relationship between body shape and cancer are limited, Mendelian randomisation based
on traditional body-shape indices has already provided evidence for causal positive associations of WHR or
WHRadjBMI with colorectal cancer40,41 and renal cell carcinoma42 but an inverse association with breast cancer43.
Allometric body-shape indices showed sexually dimorphic genetic association patterns, like traditional body-
shape indices3,4,10,44, with an overall lower heritability in men. There were, however, fewer genetic associations
and with lower significance in men then would correspond proportionally to the slightly smaller sample size
compared to women, as noted for traditional i ndices3. In contrast height, which is also phenotypically dimorphic
between sexes, shows considerably larger heritability than body-shape indices and a closer agreement of the
genetic association patterns between women and m en45. This raises the question, how women and men differ
with respect to the regulatory factors determining fat distribution and body shape.
Scientific Reports | (2021) 11:10688 | https://doi.org/10.1038/s41598-021-89176-6 11
Vol.:(0123456789)www.nature.com/scientificreports/
Sex steroid hormones play a central role in the regulation of fat distribution. Oestrogens counter fat accumula-
tion in the abdominal area and favour fat accumulation in the gluteofemoral area46. Oestrogen levels in b lood47
48
and the expression of ERα in the abdominal area decrease after the menopause, which permits a functional
androgen dominance and the development of android type obesity in post-menopausal women49. Nevertheless,
age-related differences in the genetic associations have been reported only for BMI and not for WHRadjBMI10. In
contrast, testosterone levels in women remain lower than in men at all a ges50 and are comparable between pre-
and post-menopausal women, as ovarian androgen production is largely maintained long after the m enopause51.
The stress hormone cortisol, regulated by the hypothalamic–pituitary–adrenal (HPA) axis, is also closely involved
in the regulation of fat distribution, with chronic cortisol excess resulting in the development of visceral adiposity
and the metabolic syndrome52. Notably, the HPA axis shows a sexually dimorphic activity, with stronger responses
to stimulation and suppression in women compared to m en53,54 and increased responses to HPA stimulation in
men after suppression of gonadal testosterone p roduction55. Abdominal obesity also influences HPA responsive-
ness, with larger WHR associated with a stronger response to HPA s timulation56 and a weaker response to HPA
suppression53. Animal studies provide further evidence for a sexually dimorphic adrenal function, suggesting
that androgens rather than oestrogens are important for adrenal regulation57. Furthermore, absence of the
androgen receptor in mice results in downregulation of the glucocorticoid receptor in the pituitary gland, adre-
nal hypertrophy and glucocorticoid o verproduction58. Thus, the higher HPA responsiveness in women, enabled
by constitutively lower testosterone levels, may engage a more complex regulatory network and present more
opportunities for genetic polymorphisms to act as rate-limiting steps in fat distribution, potentially explaining the
pronounced sexual dimorphism in the heritability and the genetic association patterns of body-shape indices4,45.
Despite the genetic and phenotypic differences in body-shape between women and men, the eQTL associa-
tions of genes associated with body-shape indices were in line with an involvement of adipose and vascular
tissues, but also intriguingly of female reproductive organs in men as well as in women. This apparently para-
doxical association in men may not be completely illogical, as female reproductive organs would be responsive
to oestrogen-activated pathways and the formation of the Mullerian duct, from which the uterus and its adnexa
are derived, is regulated by WNT signalling p athways59, which may have pleiotropic roles.
We have previously demonstrated the need to adjust body-shape indices for BMI prior to using them in
statistical models examining phenotypic associations9. We have now shown that it is also essential to account
correctly for height, in order to avoid an “over-adjustment” arising from constraining the relationship between
weight and height to a fixed proportion in BMI. In the case of WCadjBMI and HCadjBMI, the adjustment for BMI
does not reflect correctly the scaling of WC or HC with height and introduces phenotypic and genetic associa-
tions with height. When WC and HC are adjusted for height, in addition to BMI or weight, as in the allometric
indices ABSIUKB and HIUKB, the relationship between weight and height is unconstrained and the correlation
of WC and HC with height, as well as with BMI, is minimised. In the case of WHRadjBMI, the phenotypic and
genetic association patterns were very similar to the allometric counterpart WHIUKB, despite the lack of additional
adjustment for height, because the scaling coefficients for weight and height in individuals with white British
ancestry were in proportion 1:2, similar to BMI. Nevertheless, given the large ethnic variability in body shape,
this may not be universally applicable to other ethnicities. It would thus be advisable to use body-shape indices
adjusted for height, as well as for BMI or weight, in order to minimise correlations with body size. Evaluating
correctly the pleiotropic contributions is particularly important as many variants and genes associated with
allometric body-shape indices are apparently related to growth and regulatory factors and a sizeable proportion
of them have previously been reported in association with height. A mechanistic parallel with a pathway affecting
either height or regional size when dysregulated in different periods of life could be drawn with growth hormone
signalling. Growth hormone excess in adolescents is associated with increased height but an excess in adults,
after epiphyseal closure, is associated with regional enlargement of the hands, feet and the face, i.e. acromegaly.
Growth hormone signalling is further related to metabolic alterations and some cancers60. A similar principle
could be relevant to other growth or regulatory factors.
Our study benefited from a large sample size, anthropometric measurements performed by trained personnel
according to standardised protocols and access to established bioinformatics pipelines. There were, however,
several limitations. It should first be acknowledged, that the UK Biobank cohort is not representative of the UK
population at the time of recruitment and is subject to a healthy volunteer bias which should be considered when
interpreting the findings61. In addition, we lacked a validation cohort of similar ethnicity to the discovery dataset,
although this would affect mainly the validity of associations with lower and borderline significance, while the
highest-ranked genetic polymorphisms showed very strong and convincing associations. We also lacked data-
sets of comparable size including individuals with different ethnic backgrounds, as less than 5% of UK Biobank
participants reported black or Asian ethnic background. Further, there were no reliable imaging measures of
body composition (i.e. from dual-emission X-ray absorptiometry scans or magnetic resonance imaging) with
comparable sample size. Furthermore, we did not perform a meta-analysis of waist and hip indices, since there
are no other GWAS of ABSI and HI and we have already argued that WCadjBMI and HCadjBMI are not reliable
body-shape indices. It would be useful, however, to consider a multi-trait meta-analysis a pproach62 when stud-
ies of other ethnicities are available. We did not specifically adjust our analyses for geographical location, which
has been highlighted as a source of residual confounding of associations with BMI, bioelectric impedance fat
mass measurements and height in UK Biobank13, as we minimised the number of adjustment variables to avoid
introducing collider bias. There were, however, no matches of the reported variants related to geographical loca-
tion with the main variants identified in our study, hence a confounding from fine-scale population structure is
unlikely. Further, we could not perform mechanistic investigations linking genetic polymorphisms to adrenal
function or cancer, which were beyond the scope of our study. Lack of Mendelian randomisation analysis, which
may support a causal effect of the identified variants and genes on cancer and may further clarify the relationships
in the network of m ediators63, is clearly a limitation. This, however, was also beyond the scope of the current
Scientific Reports | (2021) 11:10688 | https://doi.org/10.1038/s41598-021-89176-6 12
Vol:.(1234567890)www.nature.com/scientificreports/
study. Due to the large heterogeneity of cancers, associations would need to be consider separately for each indi-
vidual cancer location and for each major histological type and the question of potential pleiotropy, which is very
likely, would need to be addressed in detail. It should last be noted, that although examining A
BSIUKB and H IUKB
enabled the identification of variants associated exclusively with the abdominal or the gluteofemoral regions,
these associations may be determined by features other than fat accumulation, e.g. the status of lean mass in the
gluteofemoral region. It would therefore be important to examine the association patterns of genetic variants
identified for anthropometric indices with measures of body compositions, which would become available in
the future for a larger part of UK Biobank participants.
In conclusion, in the first GWAS of allometric body-shape indices, we have identified novel genetic variants
and genes and have obtained unbiased association statistics for individuals with white British ancestry, which
would inform future studies of fat distribution, body shape and the disorders associated with them. The highest-
ranked genes associated with body-shape indices have previously been associated in mechanistic studies with
adrenal cell renewal, vascularisation and cancer development and progression, in addition to their functions in
adipose tissue. The comparison of allometric and traditional body-shape indices demonstrated that adjustment
of body-shape indices for height, as well as for BMI or weight, is warranted to avoid associations with height,
which were more pronounced for W CadjBMI and HCadjBMI. Differences between allometric and traditional
body-shape indices with respect to their phenotypic and genetic associations were minimal when accounting
correctly for height.
Methods
Study participants. UK Biobank is a prospective cohort with an ongoing follow-up, including 502,543
participants. Recruitment and data collection have previously been described64,65. We excluded in total 95,846
participants. Exclusions were determined by a lack of genetic data or withdrawn consent (n = 15,229); outliers
for heterozygosity or missing genotyping rate, or sex chromosome aneuploidy, or a mismatch between genetic
and self-reported sex (n = 843); age below 40 or above 70 years when attending an assessment centre at baseline
(n = 14); missing weight, height, waist or hip circumference measurements (n = 2,097); or pregnancy at baseline
(n = 115). We further restricted the selection to participants with white British ancestry, defined by UK Biobank
according to their genetic characteristics (excluded n = 77,548). The final dataset comprised 406,697 participants.
Genotyping and imputation. Genotyping, imputation and quality control were performed centrally
escribed65. Two genotyping arrays were used: Applied Biosystems
by UK Biobank and have previously been d
UK BiLEVE Axiom Array (~ 50,000 participants) and a closely related Applied Biosystems UK Biobank Axiom
Array (~ 450,000 participants).
Outcome measures and indices. We converted all anthropometric measurements to body-shape indices
with adjustments either for BMI in linear models, or for weight and height in log-linear models. BMI was calcu-
lated by dividing weight (kg) by squared height (m).
For traditional body-shape indices, we used residuals of linear models regressing each of WC (cm), HC (cm)
or WHR on BMI (WHRadjBMI, WCadjBMI, HCadjBMI). For the corresponding allometric body-shape indices,
we used ABSI and HI, and created a new waist-to-hip index (WHI), in order to complete the set. The published
formulas for ABSI and HI have previously been derived for participants in the National Health and Nutrition
Examination Survey (NHANES)5,6:
ABSI = WC ∗ Weight−2/3 ∗ Height5/6
HI = HC ∗ Weight−0.482 ∗ Height0.310
To avoid phenotypic correlations between anthropometric indices arising from differences in the anthropo-
metric characteristics of UK Biobank and NHANES participants and to enable comparability with traditional
residual methods, we calibrated ABSI and HI, as well as WHI, for UK Biobank participants (ABSIUKB, HIUKB and
WHIUKB). We derived the power coefficients from linear models regressing each of log-transformed WC (cm),
HC (cm) or WHR on log-transformed weight (kg) and height (m) measured at baseline:
log (Measure) ∼ β ∗ log Weight + γ ∗ log Height
and generated allometric body-shape indices according to the general formula:
Index = Measure ∗ Weight −β ∗ Height −γ
where β and γ are the regression coefficients for weight and height (Supplementary Table S6). We included ABSI
and HI calculated with the published regression coefficients from NHANES only for the phenotypic comparisons.
The absolute values of the power coefficients for weight and height for WHRUKB were close to a ratio of 1:2 in
both men and women, which corresponds to the relationship weight/height2 in BMI (Supplementary Table S6).
Therefore, in analogy to ABSI, for which the published coefficients were derived by rounding the power coef-
ficients obtained in NHANES to simple f ractions5, we generated for comparison a simplified version of WHI
with the formula:
−1/4
WHI = WHR ∗ Weight kg /Height2 (cm)
Scientific Reports | (2021) 11:10688 | https://doi.org/10.1038/s41598-021-89176-6 13
Vol.:(0123456789)www.nature.com/scientificreports/
As body-shape patterns show distinct differences between s exes10, we generated all indices and performed all
statistical analyses separately for men and women. We used Blom’s method for inverse normal transformation
of anthropometric indices (package RNOmni in R), as i n66.
Association testing. We obtained Pearson’s coefficient for partial phenotypic correlation between anthro-
pometric indices with function pcor (package ppcor in R), adjusting for age at baseline.
We used Bayesian linear mixed-model analysis BOLT-LMM v2.3 for genome-wide association testing67,68,
which incorporates in the statistical algorithm a correction for population stratification and thus accounts for
the relatedness between UK Biobank participants. To estimate the parameters of the LMM, we used linkage dis-
equilibrium (LD) scores from the 1000 Genomes EUR samples from individuals with European a ncestry69 and
selected a coreset with high-quality genetic variants by restricting the list of variants released by UK Biobank after
the centrally performed quality control to variants with missingness < 0.015, minor allele frequency MAF > 5%
and Hardy–Weinberg exact test P > 1*10–6 (Supplementary Table S7). We performed the main analyses with vari-
ants with MAF ≥ 1% and imputation quality factor INFO > 0.1. We adjusted all models for age at baseline, age
squared and a binary indicator of genotyping array. Supplementary Table S8 includes quality control parameters
for BOLT-LMM. We obtained heritability estimates (h2g) from BOLT-LMM, based on the genetic relationship
matrix. We report association statistics based on the BOLT-LMM infinitesimal models, which use a Gaussian
single nucleotide polymorphism (SNP) effect prior.
Mapping, annotation and prioritisation of genetic variants. Individual genetic variants were
defined with the chromosome, the genomic position in base pairs, the minor (alternative) allele and the major
(reference) allele. For some SNPs there were more than one alternative alleles, hence the total number of genetic
variants associated with a given body-shape index could be higher than the total number of SNPs. We used the
SNP2GENE process of the web application Functional Mapping and Annotation (FUMA) v1.3.6a70 to perform
positional mapping, clumping and annotation of genetic variants according to the p-values of the association
statistics obtained from the corresponding BOLT-LMM infinitesimal model for variants with high imputation
quality (INFO > 0.9). Independent significant SNP were defined as variants with genome-wide significance
(P ≤ 5*10–8), which were in approximate linkage equilibrium with each other, at r2 < 0.6 within a 1 Mb win-
dow. Variants with nominal significance (P < 0.05) in LD with an independent significant SNP (r2 ≥ 0.6 within a
1 Mb window) formed the corresponding LD block of candidate SNPs. To map LD, we used the “UKB release2b
10 k White British” panel in FUMA. Independent significant SNPs in LD with each other (r2 ≥ 0.1 within 1 Mb
window) were consolidated in a clump, represented by a lead SNP with the lowest p-value. Lead SNPs with cor-
responding clump boundaries less than 250 kb apart were merged into a genetic risk locus, represented by the
locus lead SNP with the lowest p-value. All candidate SNPs were mapped to genes within a maximum distance
of 1 kb (based on their genomic position) and for functional consequences (based on Ensemble genes v92) with
ANNOVAR employed in FUMA71. We used as a measure of pathogenicity of a given variant the deleterious-
ness score (Combined Annotation Dependent Depletion (CADD) score) calculated in FUMA and evaluated
this against the recommended cut-off of 12.3712. We additionally annotated the functionality of candidate SNPs
with genome-wide significance with Ensembl Variant Effect Predictor (VEP) v9072. This maps each variant to
the gene or location with the nearest protein-coding transcription start site within a window of 200 kb from the
position of the examined variant.
Gene‑based association analysis. For gene-level, gene-set and gene-property analysis, we used Multi-
marker Analysis of GenoMic Annotation (MAGMA) v.1.0873, which is employed in FUMA v1.3.6a with default
settings. The reference panel for LD and the Ensemble version for assigning SNPs to genes (within a symmetric
window of 1 kb from both sides) were set as described for SNP annotation and prioritisation above.
Gene analysis was based on the summary SNP statistics of all variants with INFO > 0.9 (i.e. including the
complete distribution). A SNP-wide mean model was used to calculate an association statistic and p-value for
each gene. Significant genes were considered those with P < 0.05, after applying Bonferroni correction for multiple
comparisons for 19,088 identified protein-coding genes. Significant genes with boundaries within 250 kb of each
other were clumped in genomic risk regions, represented by a lead gene with the lowest P-value.
Competitive gene-set analysis was performed as a gene-level linear regression model to test whether the genes
included in each gene-set (a binary indicator) showed stronger (positive) associations with the phenotype than
other genes, generating a one-sided p-value. The model was conditioned by default on gene size, gene density
(reflecting LD between SNPs in the gene), the inverse of the mean MAF in the gene (to account for potential
power loss in very low MAF SNPs), and the log values of the three v ariables73. FUMA v1.3.6a uses gene sets
obtained from the Molecular Signatures Database (MSigDB) v7.0, including curated gene sets from online
pathway databases and gene ontology (GO) terms. The significance of associations with gene sets was evaluated
at P < 0.05, after Bonferroni correction for 15,485 examined gene sets.
The Genotype-Tissue Expression (GTEx) v8.0 database was used to perform gene-property analysis, as imple-
mented in FUMA v1.3.6a, which examines associations with expression Quantitative Trait Loci (eQTL). This
uses a similar linear regression model to gene-set analysis, but with the average l og2 transformed gene expression
values per tissue (a continuous variable), to test the (positive) relationship between highly expressed genes in a
specific tissue and genetic associations represented by gene-level statistics, generating a two-sided p-value. The
significance of associations with eQTLs was evaluated at P < 0.05, after Bonferroni correction for 54 individual
tissue types.
Scientific Reports | (2021) 11:10688 | https://doi.org/10.1038/s41598-021-89176-6 14
Vol:.(1234567890)You can also read