Assessing whether ad hoc clinician-generated patient questionnaires provide psychometrically valid information - Health and Quality of Life Outcomes
←
→
Page content transcription
If your browser does not render page correctly, please read the page content below
Lee et al. Health and Quality of Life Outcomes            (2020) 18:50
https://doi.org/10.1186/s12955-020-01287-2

 RESEARCH                                                                                                                                         Open Access

Assessing whether ad hoc clinician-
generated patient questionnaires provide
psychometrically valid information
Minji K. Lee1*, Jeffrey R. Basford2 , Allen W. Heinemann3 and Andrea Cheville1,2

  Abstract
  Background: The provision of psychometrically valid patient reported outcomes (PROs) improves patient outcomes
  and reflects their quality of life. Consequently, ad hoc clinician-generated questionnaires of the past are being
  replaced by more rigorous instruments. This change, while beneficial, risks the loss/orphaning of decades-long
  information on difficult to capture/chronically ill populations. The goal of this study was to assess to the quality of
  data retrieved from these legacy questionnaires.
  Methods: Participants included 8563 patients who generated a total of 12,626 hospital admissions over the 2004–
  2014 study period. Items used to screen for issues related to function, mood, symptoms, and social support among
  patients with chronic disease were identified in our medical center’s patient information questionnaire. Cluster and
  exploratory factor analyses (EFA) followed by multidimensional item response theory (MIRT) analyses were used to
  select items that defined factors. Scores were derived with summation and MIRT approaches; inter-factor
  relationships and relationships of factor scores to assigned diagnostic codes were assessed. Rasch analyses assessed
  the constructs’ measurement properties.
  Results: Literature review and clinician interviews yielded four hypothesized constructs: psychological distress/
  wellbeing, symptom burden, social support, and physical function. Rasch analyses showed that, while all had good
  measurement properties, only one, function, separated individuals well. In exploratory factor analyses (EFA), 11
  factors representing depression, respiratory symptoms, musculoskeletal pain, family support, mobility, activities of
  daily living, alcohol consumption, weight loss, fatigue, neurological disorders, and fear at home were identified.
  Based on the agreement between EFA and cluster analyses as well as Cronbach’s alpha, six domains were retained
  for analyses. Correlations were strong between activities of daily living and mobility (.84), and moderate between
  pain and mobility (.37) and psychological distress (.59) Known-group validity was supported from the relationships
  between factor scores and the relevant diagnostic code assignments (.12 to .20).
  Conclusions and discussion: Items from ad hoc clinician-generated patient information questionnaires can be
  aggregated into valid factors that assess supportive care domains among chronically ill patients. However, the
  binary response options offered by many screening items limit their information content and consequently, as
  highlighted by Rasch analyses, their ability to meaningfully discriminate trait levels in these populations.
  Keywords: Patient reported outcome, PRO, Psychometrics, Past medical history, Social history, Item response
  theory, Factor analysis, Quality of life, Review of systems

* Correspondence: Lee.Minji@mayo.edu
1
 Kern Center for the Science of Health Care Delivery, Mayo Clinic, 200 First
Street SW, Rochester, MN 55905, USA
Full list of author information is available at the end of the article

                                         © The Author(s). 2020 Open Access This article is distributed under the terms of the Creative Commons Attribution 4.0
                                         International License (http://creativecommons.org/licenses/by/4.0/), which permits unrestricted use, distribution, and
                                         reproduction in any medium, provided you give appropriate credit to the original author(s) and the source, provide a link to
                                         the Creative Commons license, and indicate if changes were made. The Creative Commons Public Domain Dedication waiver
                                         (http://creativecommons.org/publicdomain/zero/1.0/) applies to the data made available in this article, unless otherwise stated.
Lee et al. Health and Quality of Life Outcomes (2020) 18:50 Page 2 of 17 Introduction hospitalized patients, improve long-term outcomes, re- Patient reported outcomes (PROs) have gained acceptance duce post-acute care requirements, and prevent 30-day as an important component of clinical care. This accept- readmissions. The goals of this initial paper were more ance is likely to grow as an increasing body of research modest and two-fold. The first was to describe the suggests that the provision of PRO data to clinicians at the methods that we used to identify, cluster, and score point of care can improve outcomes and even survival [1, items related to patients’ care needs that they reported 2]. Such findings support the idea that these tools can ac- before hospitalization. The second was to outline the curately reflect constructs such as symptom burden and utility and drawbacks of these methods as a guide to psychological well-being, that can have a broad effect on a others who might be planning to assess the value of their patient’s functional status, longevity, and quality of life. In institution’s “homegrown” questionnaires. addition, emerging associations between PROs and un- planned health care utilization, e.g., 30-day readmissions, Methods suggest that they may also have a role in improving med- The study was approved by the Mayo Clinic Institutional ical care, reducing health care inefficiencies, and the deliv- Review Board. Informed consent was waived as it uti- ery of supportive care [3]. lized de-identified data collected from patients as part of The collection of PRO data is not new. Many healthcare routine clinical care. institutions have collected PROs for decades with the use of empirically developed, facility-specific questionnaires. Sample While ad hoc instruments are used frequently for clinical The sample was derived from patients who were admit- screening and to fulfill review of system requirements, ted to one of the Rochester-based Mayo Clinic hospitals their use is increasingly being orphaned by the widespread for coronary artery disease (CAD), chronic obstructive recognition of the need for psychometric rigor in instru- pulmonary disease (COPD), myocardial infarction (MI), ment development [4, 5]. Such standards have resulted in congestive heart failure (CHF), and/or pneumonia over a new measures and improved PRO data quality. However, 10-year period between May 2004 and May 2014. Exclu- as a consequence of this advance, we now have vast sets of sion criteria were residence more than 130 km (80 miles) ad hoc PRO-based data that at best may not be used to away (to minimize loss of data due to hospitalization their full advantage and, at worse, be discarded. elsewhere), lack of a research authorization, death or an Although these legacy data sets lack the psychometric age 18 years at any time during the study period. We se- vetting now expected of PROs, they have many lected records for patients who provided a questionnaire strengths. Specifically, they are often huge, have high within 6 months prior to a hospital admission and com- rates of completion due to institutional mandates, span pleted at least 70% of the 84 items. decades, and include longitudinal information on diffi- cult to capture populations. In particular, many have a Identification of unusable CVI items high proportion of chronically ill patients who are gener- As with many forms developed for clinical use, our institu- ally under-represented in medical studies, and may, tions’ questionnaire evolved over time with respect to item therefore, be of value in informing the delivery of geriat- inclusion, wording, and response options. Therefore, we ric, rehabilitative and supportive care services. reviewed all versions in order to eliminate items that had In the case of our institution, the systematic collection of been altered substantially. Four forms were used over the institution-wide PRO information began in the early-1990s study period. Form A, completed by 1002 patients, was in the form of patient responses to a “Current Visit Infor- used until early 2005. Form B (the dominant and current mation” (CVI) questionnaire. The instrument is completed questionnaire) evolved from Form A, and was completed at six-month intervals, and queries patients about their by 7988 patients. The Spanish language Form C, which function, symptoms, habits, and psychological well-being, was identical in content to Form B, was completed by 9 as well as other issues such as medication use and allergies. patients. An online form, D, was used from 2009 to 2014 While the items have never been formally validated, the by 41 patients, with content similar to Form B. questionnaire, with a few minor variations, has served as a Forms B and C consist of 4 sections that include items point-of-care clinical resource for over 20 years. The result related to: 1) Review of Symptoms (fatigue, fever, weight has been the accumulation of a vast amount of informa- gain/loss, appetite, depressed mood, etc.); 2) Social His- tion: the past decade alone includes more than 4 million tory (living situation, ethanol and tobacco use); and 3) assessments from over a million patients. Functional status (activities of daily living, need for and Our long-term goal is to establish whether patient- availability of assistance with home care, mobility, and reported data systematically collected in outpatient set- use of assistive devices). All items potentially related to tings with a non-validated instrument can be used to im- underlying latent traits were included in subsequent prove and individualize the services delivered to steps to identify relevant item clusters. All, excepting a
Lee et al. Health and Quality of Life Outcomes   (2020) 18:50                                                                               Page 3 of 17

Table 1 Demographic and clinical characteristics of the study           Table 1 Demographic and clinical characteristics of the study
participants                                                            participants (Continued)
N                                                 8,563                   Facility                                                     1,680 (20%)
Age, min, Q1, median, Q2 max                      19, 62, 73, 82, 104   Note. Emergency – The patient required immediate medical intervention as a
                                                                        result of severe, life threatening, or potentially disabling conditions. Generally,
Sex (female), n (%)                               3,265 (38%)           the patient was admitted through the emergency room. Urgent – The patient
Race/ Ethnicity, n (%)                                                  required immediate attention for the care and treatment of a physical or
                                                                        mental disorder. Generally, the patient was admitted to the first available and
    White                                         8,002 (93%)           suitable accommodation. Trauma Center – visits to a trauma center/hospital as
                                                                        licensed or designated by the State or local government authority authorized
    Black/ African American                       86 (1%)               to do so, or as verified by the American college of Surgeons and involving a
    Asian                                         68 (0.8%)             trauma activation

    American Indian/ Alaskan Natives              17 (0.2%)
    Hispanic                                      30 (0.4%)
                                                                        single item, “Can you climb two flights of stairs without
Marital status, n (%)                                                   stopping to rest?.” offered binary response options.
    Married                                       5,535 (65%)
    Single/never married                          728 (9%)              Identification of constructs related to care needs,
    Divorced/ separated                           714 (8%)              disposition, and re-admission risk
    Widowed                                       1,558 (18%)           Several methods were used to identify item clusters that
Highest level of school completed                                       might represent constructs relevant to potential care
    8th grade or less                             881 (10%)
                                                                        needs. First, we conducted a literature review on the pre-
                                                                        dictors of 30-day hospital readmission and the need for
    Some high school, but did not graduate        672 (8%)
                                                                        institutionalized post-acute care. We found that, among
    High school graduate or GED                   3,262 (38%)           the many predictors, those that could be assessed using
    Some college or 2-year degree                 1,747 (20%)           CVI data included comorbidities, symptoms, functional
    4-year college graduate                       686 (8%)              impairments, and demographic/social variables (e.g., liv-
    post graduate studies                         736 (9%)              ing arrangements, and social support) [6–11].
Employment status
                                                                           Second, clinician content matter experts; hospitalists,
                                                                        palliative care, and rehabilitation medicine physicians with
    Employed                                      1,397 (16%)
                                                                        > 10 years of practice experience, initially identified 81
    Self-employed                                 354 (4%)              items in the CVI (Supplement 1) that assessed aspects of
    Retired                                       4,907 (57%)           potentially actionable constructs that had been identified
    Unemployed                                    264 (3%)              through the literature review. We hypothesized that four
    Work disabled                                 383 (4%)              constructs associated with hospital care needs (psycho-
    Full-time homemaker                           200 (2%)
                                                                        logical distress/wellbeing, symptom burden, social sup-
                                                                        port, and physical function0 could be estimated by
Disease category, n (%)
                                                                        aggregating and scoring the CVI items. Following hypoth-
    CAD                                           2,662 (31%)           esis generation, the item pool was reduced from 81 to 56
    CHF                                           1,791 (21%)           items because 25 items had less than 10% response rates,
    COPD                                          652 (8%)              while 56 retained items had response rates > 70 + %.
    MI                                            1,651 (19%)
    Pneumonia                                     1,807 (21%)           Addressing missingness
Admit type                                                              Missing values were filled in with a nonparametric, mixed-
    Trauma Center                                 3 (0.03%)
                                                                        type imputation method using Random Forest algorithm
                                                                        which has been validated in similar studies [12, 13].
    Emergency                                     8,007 (59%)
    Urgent                                        849 (10%)
    Semi-urgent                                   47 (0.5%)             Determination of whether hypothesized constructs were
                                                                        supported by CVI items
    Routine (Reserved)                            2,576 (30%)
                                                                        Once the four constructs (psychological distress/well-
Distance in miles, mean (SD)                      25.3 (19.6)
                                                                        being, symptom burden, social support, and physical func-
Discharge disposition, n (%)                                            tion) were identified, we used a two-pronged approach to
    Home                                          6,413 (75%)           evaluate whether the CVI items could be aggregated. First,
    Home with health care                         470 (5%)              we used Rasch analyses to assess whether the four hypoth-
                                                                        esized constructs have good measurement properties.
Lee et al. Health and Quality of Life Outcomes (2020) 18:50 Page 4 of 17
Table 2 Descriptive statistics of item responses
Content of items and the name of the constructs (bolded) that the items were hypothesized to measure Mean Missing responses
(SD) (%)
Psychological Distress/ Well being
1. Do relatives/ friends worry about your alcohol consumption? 0.03 (0.2) 493 (6%)
2. Recurring thoughts of death or suicide? 0.01 (0.1) 616 (7%)
3. Have you ever felt the need to cut down on your alcohol consumption? 0.06 (0.2) 438 (5%)
4. Have you felt anxious or nervous? 0.10 (0.3) 615 (7%)
5. Have you felt restless and irritable? 0.06 (0.2) 615 (7%)
6. Have you felt sad most of the time? 0.04 (0.2) 616 (7%)
7. Have you had difficulty concentrating? 0.06 (0.2) 616 (7%)
8. Have you had little interest or pleasure in relationships or activities? 0.06 (0.2) 616 (7%)
Symptom Burden
9. Bothered with coughing? 0.22 (0.4) 20 (0.2%)
10. Bothered with shortness of breath? 0.40 (0.5) 20 (0.2%)
11. Bothered with wheezing? 0.13 (0.3) 20 (0.2%)
12. Difficulty with pain? 0.36 (0.5) 1,893 (22%)
13. Had abnormal swelling in the legs or feet? 0.22 (0.4) 28 (0.3%)
14. Back pain 0.22 (0.4) 28 (0.3%)
15. Changes in bowel movement 0.03 (0.2) 14 (0.2%)
16. Difficulty moving an arm or leg 0.16 (0.4) 29 (0.3%)
17. Difficulty swallowing 0.07 (0.3) 14 (0.2%)
18. Difficulty with leaking urine 0.11 (0.3) 13 (0.2%)
19. Diminished hearing 0.14 (0.3) 28 (0.3%)
20. Excessive daytime drowsiness 0.13 (0.3) 616 (7%)
21. Fatigue 0.25 (0.4) 615 (7%)
22. Joint pain 0.25 (0.4) 28 (0.3%)
23. Joint swelling 0.07 (0.3) 29 (0.3%)
24. Loss of appetite 0.09 (0.3) 615 (7%)
25. Muscle pain 0.15 (0.4) 29 (0.3%)
26. Nausea 0.08 (0.3) 13 (0.2%)
27. No symptom(s) 0.87 (0.3) 616 (7%)
28. Problems falling asleep 0.18 (0.4) 615 (7%)
29. Significant Headaches 0.10 (0.3) 28 (0.3%)
30. Significant problems with constipation 0.10 (0.3) 13 (0.2%)
31. Significant problems with diarrhea 0.07 (0.3) 13 (0.2%)
32. Weight gain of more than 10 pounds 0.05 (0.2) 39 (0.5%)
33. Weight loss of more than 10 pounds 0.07 (0.2) 38 (0.4%)
Social Support
34. Ever fearful for your own safety? 0.02 (0.1) 1,255 (15%)
35. Ever feel afraid in your own home? 0.02 (0.1) 1,123 (13%)
36. A living will or other advance directive? 0.45 (0.5) 1,706 (20%)
37. Family/friends who can provide assistance with homecare needs 0.75 (0.4) 554 (6%)
38. Divorced or widowed in the past year? 0.04 (0.2) 726 (8%)
39. Assisted Living-created from “Current living arrangements” 0.11 (0.3) 322 (4%)
40. Committed relationship-created from “Current relationship status” 0.64 (0.5) 343 (4%)Lee et al. Health and Quality of Life Outcomes (2020) 18:50 Page 5 of 17
Table 2 Descriptive statistics of item responses (Continued)
Content of items and the name of the constructs (bolded) that the items were hypothesized to measure Mean Missing responses
(SD) (%)
41. Living with family-created from “With whom do you live?” 0.70 (0.5) 456 (5%)
Function
42. Can climb two flights of stairs without stopping to rest? 1.05 (0.8) 1,465 (17%)
43. Depend on any assistive devices (wheelchair, cane) or assistance from other people to perform activities 0.34 (0.5) 1,032 (12%)
important in your daily life?
44. Difficulty bathing by yourself 0.15 (0.4) 739 (9%)
45. Difficulty climbing stairs by yourself 0.38 (0.5) 738 (9%)
46. Difficulty dressing by yourself 0.12 (0.3) 739 (9%)
47. Difficulty eating by yourself 0.03 (0.2) 739 (9%)
48. Difficulty housekeeping by yourself 0.23 (0.4) 738 (9%)
49. Difficulty performing these activities by yourself—None 0.48 (0.5) 739 (9%)
50. Difficulty taking medications by yourself 0.15 (0.4) 739 (9%)
51. Difficulty transportation by yourself 0.14 (0.3) 739 (9%)
52. Difficulty using the toilet by yourself 0.07 (0.2) 739 (9%)
53. Difficulty walking by yourself 0.26 (0.4) 738 (9%)
54. Difficulty getting in and out of bed by yourself 0.09 (0.3) 1,354 (16%)
55. Difficulty preparing meals by yourself 0.17 (0.4) 1,354 (16%)
56. Tendency to fall easily 0.08 (0.3) 616 (7%)
Then, we investigated whether different groups of items Part 1. Rasch analyses
could be obtained using statistical methods such as ex- Rasch analysis rests on the assumption/requirement that
ploratory factor analysis and cluster analysis. For the latter a set of items measures one underlying construct and
approach, we evaluated the fit of items to the new con- that the items form a hierarchy from easiest to hardest
structs using confirmatory analyses such as multidimen- to endorse. In our case, we hypothesized that the 56
sional IRT. items comprise four constructs; psychological distress,
Table 3 Item measurement results
Psychological Distress Symptom Burden Social Support Function
Measures
Mean 0.00 0.00 0.00 0.00
SD 0.89 1.61 2.46 2.12
N 8 25 8 15
OUTFIT
Mean 0.97 1.03 1.30 1.53
SD 0.25 0.49 0.40 2.28
> 2 (count) 0 1 1 1
INFIT
Mean 1.00 1.00 0.99 0.97
SD 0.19 0.06 0.10 0.33
> 2 (count) 0 0 0 0
a
PBIS (Counts)Lee et al. Health and Quality of Life Outcomes (2020) 18:50 Page 6 of 17
Table 4 Respondent’s measurement results for measured (non-extreme) person
Psychological Distress Symptom Burden Social Support Function
Measures
Mean -1.52 -2.08 -1.50 -2.26
SD 0.92 1.47 1.13 0.46
N 1768 7754 8314 6276
OUTFIT
Mean 0.97 0.96 1.00 0.93
SD 0.67 1.01 1.87 1.73
> 2 (count) 78 421 1008 438
INFIT
Mean 1.00 0.99 0.95 0.88
SD 0.22 0.67 0.81 0.86
> 2 (count) 0 171 863 365
a
Reliability of Separation 0.00 0.50 0.00 0.75
a
The numbers in parentheses are the reliabilities computed by excluding ill-fitting examinees
symptom burden, social support, and physical function. Cluster analysis We assessed the robustness of the fac-
Using the Rasch model, we determined whether the CVI tor structure identified with EFA using cluster analysis
items and respondents were separated adequately along to produce an operational classification. We performed a
a logit scale for each hypothesized construct. We also hierarchical agglomerative cluster analysis to partition
examined separation reliability for items and respon- the sample into homogeneous classes using Ward’s
dents to provide a measure of the degree to which the method applying squared Euclidean Distance as the dis-
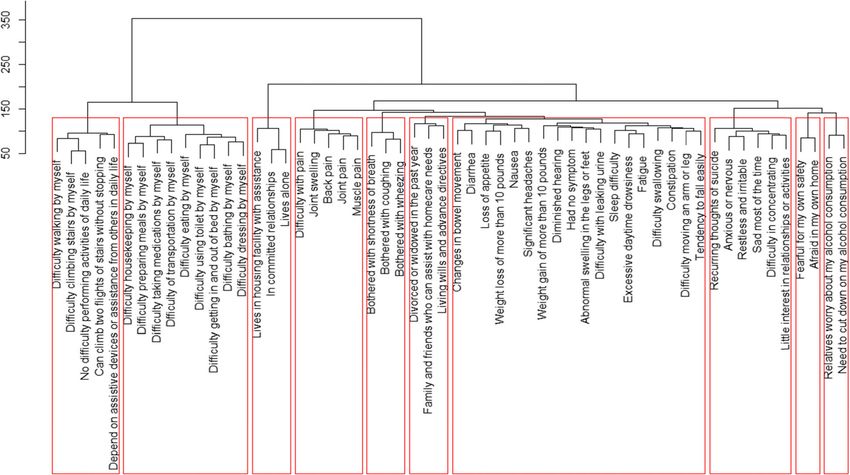
respondents or items are separated. To address both tance measure. A hierarchical tree diagram (i.e., a den-
item fit and person fit (consistency), we estimated fit sta- drogram) was produced to show the linkage points.
tistics such as the outfit mean statistics, the unweighted
mean square residual differences between observed
Confirmation and refinement of constructs
values and expected values [14]. WINSTEPS 4.0.1 [15]
Using the second half of the sample, we applied two ap-
was used for these analyses.
proaches to obtain fit statistics for the factor structure
identified through the EFA and cluster analyses.
Part 2. Exploratory factor analysis/cluster analysis followed
by confirmatory factor analysis and multidimensional item Multidimensional 2-parameter item response theory (MIRT)
response theory analysis analysis
We performed MIRT analysis for several reasons. First,
Exploratory factor analysis Rather than assuming par- it permitted an assessment of item position along the
ticular item-to-construct relationships, we created con- unidimensional trait continua which allowed us to evalu-
structs using statistical methods. We created two equal- ate whether items discriminated in the trait range rele-
sized random samples, one for exploratory analyses, and vant to hospitalized patients. Second, several constructs
the other for confirmatory analyses of the constructs. were supported by only a limited number of items, and
We defined the constructs using exploratory factor MIRT approaches enable “borrowing” of information
analysis (EFA) [16]. The number of factors extracted was from correlated constructs.
determined by parallel analysis [17]. Maximum likeli- MIRT confirmatory nonlinear factor analysis was per-
hood nonlinear EFA with promax rotation was per- formed using the normal Ogive Harmonic Analysis ro-
formed to approximate the independent-clusters bust method as described by McDonald [20]. Fit indices
structure. The strengths (correlations) of item-to-factor such as root mean square residual (RMSR), root mean
loadings were evaluated to identify meaningful clusters square error of approximation (RMSEA), and the Ta-
using the cutoff of |.32| [18], which represents 10% of naka goodness-of-fit index were used to evaluate the
the shared variance between the item and factor. Coeffi- model fit [21, 22]. We obtained the item parameters (i.e.,
cients greater than |0.60| were considered large, and item discrimination and item difficulty) from the IRT
those of |0.35|-|0.59| moderate [19]. analyses noted above. The item difficulty parameterLee et al. Health and Quality of Life Outcomes (2020) 18:50 Page 7 of 17
results of the different scoring strategies were estimated.
Analyses were performed using R version 3.3.0, R package
“sirt” for IRT estimation [26], and flexMIRT® for multidi-
mensional IRT scoring [27].
Discriminant and convergent validit and known group
comparisons
We tested the validity of the summed construct scores
over an interval spanning 1 year before and after hospital
admission. Specifically, we estimated correlations between
the different construct scores, as well as comparisons of
the scores associated with the assignment of ICD-9 codes
for diagnoses associated with the hypothesized constructs:
anxiety (300), pulmonary symptoms (786, 460–519, 786),
musculoskeletal pain (710–739, 338.2), and arthritis (714–
716). For known-group validity, we used Mann-Whitney
U tests to compare the factor scores from the groups with
or without the diagnoses.
Results
Sample
The sample consisted of 8563 patients who generated a
total of 12,626 hospital admissions over the period of the
study (Table 1). In brief, the sample included more men
(62%) than women with a median age of 73 years (inter-
quartile range (IQR 62 to 82)). Four diagnoses (CAD 31%,
CHF 21%, pneumonia 21%, and MI 19%) accounted for
more than 90% of the admissions, while 8% involved
COPD. About 70% of the admissions were charted as
“emergency”, “urgent” or “semi-urgent” and 30% as “non-
emergent.” The mean distance between patients’ residence
and hospital was 40 km (25 miles). About three-fourths
(75%) of the admissions were discharged home, 5% home
with home health care, and 20% post-acute care. Roughly
Fig. 1 Variable map for psychological distress 64% had some high school or general equivalency diploma
(GED) as their highest level of education; 37% had gone to
typically ranges from − 3 to 3, and decreases in value as at least some college or more. Nearly two-thirds (65%)
the item becomes easier to endorse. were married, 18% were widowed, most were retired
(57%), and 20% were employed.
Final constructs and items
The investigative team and clinician content experts CVI data characteristics
reviewed the results of the confirmatory factor, MIRT, and The 56 items used in the analyses ranged in data complete-
Rasch analyses. Final constructs and their constituent items ness from 73 to 95% with a mean of 87%. On average, the
were determined through a Delphi consensus process. questionnaires had been administered 57 (median 37) days
prior to hospital admission. The degree of missingness did
Scoring not differ significantly across disease- or demographically-
Several scoring approaches were used and compared. defined subgroups. The mean interval between a question-
First, constructs were scored using the item parameters naire’s completion and hospitalization was about 1 month
from the MIRT model using a Metropolis-Hastings longer for the CHF, COPD and pneumonia groups (2.5
Robbins-Monro estimation [23–25]. Second, summed months) compared to those with CAD or MI (1.5 months).
scores were calculated from the raw data. Third, summed This interval was also slightly longer for emergency and ur-
item scores weighted by factor loadings from confirmatory gent admissions (2 months) compared to those rated as
factor analyses were developed. Correlations between the non-emergent care admissions (1.5 months).Lee et al. Health and Quality of Life Outcomes (2020) 18:50 Page 8 of 17
Fig. 2 Variable map for symptom burden
Table 2 lists summary statistics of the responses to the social support suggested that the items in the scale are
56 items. All items were binary with 1 indicating “yes”, working well together to define their construct. The out-
except one, which measured function, “Can climb two fit mean square for function was 1.53, which does not
flights of stairs without stopping to rest?” A response of degrade the measurement system but is unproductive
0 on this item indicated no difficulty, 1 some difficulty, for construction. Upon close examination of the outfit
and 2 inability. statistic for each item, the “tendency to fall” item had an
outfit statistic of 9.90, and thus should be removed from
Part 1. Rasch analyses evaluation of the measurement function domain.
properties of the hypothesized constructs However, the separation reliability values for respon-
Unidimensional Rasch models were fit for the four hy- dents (Table 4) were unacceptably low for three of the
pothesized constructs, each having at least 8 items. The four scales; psychological distress (0.00), symptom bur-
infit mean square for persons of 0.88 to 1.00 suggested den (0.50), and social support (0.00), indicating that they
that, overall, the four scores allow for valid measurement did not separate persons along the constructs. The sep-
of each person. The item separation reliabilities (Table 3) aration reliability for respondents was also low for the
ranged from 0.99 to 1 depending on constructs, which function measure (0.75) using a cutoff of 0.80 for accept-
indicated that each of the four measures can distinguish ability [28]. Figures 1, 2, 3 and 4 show the variable maps
a wide range of its respective construct. for the four constructs. The item and respondent map in
Additionally, the overall outfit mean squares of 0.97 to Fig. 2 for psychological distress indicates that most re-
1.30 for psychological distress, symptom burden, and spondents endorsed few psychological symptoms. As aLee et al. Health and Quality of Life Outcomes (2020) 18:50 Page 9 of 17
support domain, and (c) “tendency to fall easily” from the
function domain, exhibited outfit values greater than 2.0,
suggesting that their information may be of little value.
Part 2. Determination of constructs using factor analyses
and cluster analysis
Exploratory factor analysis
A parallel analysis suggested that the 56 items could be
combined into 13 factors (F). Table 5 shows the result of
a nonlinear EFA model with the 13 factors that had
loadings equal to or greater than 0.32. The following fac-
tors were inferred from salient item loadings: F1 ethanol
consumption, F2 psychological distress or depression, F3
neurological symptoms, F5 respiratory symptoms, F6
musculoskeletal pain, F7 gastrointestinal symptoms, F8
fear, F9 housing situation, F10 dependence on assistance,
F11 difficulty walking, F12 difficulty with mobility, and
F13 difficulty with activities of daily living. It should be
noted that items measuring fear and alcohol consump-
tion formed their own clusters rather than clustering
with psychological distress, and the hypothesized con-
struct “symptom burden” was broken into more-specific
groups (e.g., F3, F5, F6, F7).
Some items and factors were, on the basis of explora-
tory analysis, excluded from subsequent confirmatory
factor and MIRT analyses. For example, “fatigue”, “di-
minished hearing”, “headaches”, “had no symptoms”,
“family or friends who can assist with homecare needs,”
“divorced or widowed in the past year”, and “living wills
or advanced directives” did not form coherent clusters
with other items in EFA and were excluded from further
analyses. Some of the standardized loadings in Table 5
were greater than one (e.g., item 17 on F5, item 40 on
F9), which could result from too many common factors
extracted. Therefore, in the subsequent analyses three
factors without clear structures were eliminated. Two
had only two items: F10 (“afraid in home” and “depend
on assistive devices or assistance from others in daily
life”) and F11 (“difficulty walking by myself” which was
more highly loaded on the mobility factor and
“dependent on assistive devices or assistance from
others in daily life”). The third, F4 consisted of only one
Fig. 3 Variable map for social support
item “fatigue”. In summary, 3 of the 13 factors were
excluded.
result, most patients were assigned the lowest scores.
The separation reliability for persons, seen in Table 4, Cluster analyses
was 0 for both “psychological distress” and “housing The findings from the hierarchical agglomerative cluster-
situation,” and 0.50 for “symptom burden” excluding ex- ing are presented in Fig. 5 and are similar to the EFA re-
treme observations, consistent with poor separation. sults. The following clusters, (displayed from left to right
In addition, the Rasch models identified items that in Fig. 1) were identified: (1) mobility, (2) activities of
added little additional information. Three items, (a) “no daily living, (3) housing situation, (4) musculoskeletal
symptom(s)” from the symptom burden domain, (b) “di- pain, (5) respiratory symptoms, (6) family or social sup-
vorced or widowed in the past year?” from the social port, (7) other symptoms, (8) psychological distress, (9)Lee et al. Health and Quality of Life Outcomes (2020) 18:50 Page 10 of 17
Fig. 4 Variable map for function
fear, and (10) ethanol consumption. Unlike the case in validity [29], and also because these constructs were not
EFA, gastrointestinal and neurological symptoms did not identified uniformly between EFA and cluster analyses,
appear in a hierarchical agglomerative cluster solution. these four constructs were removed from further analyses.
Conversely family or social support while it appeared in The reliability of psychological distress was .70, respiratory
the agglomerative clustering did not appear in the EFA symptom .64, musculoskeletal pain .68, housing situation
solution. Both methods agreed on the following do- .71, mobility .85, and activities of daily living .89. These lat-
mains: (1) mobility, (2) activities of daily living, (3) hous- ter constructs were reviewed by the expert panel for their
ing situation, (4) musculoskeletal pain, (5) respiratory content validity and retained for further analyses.
symptoms, and (6) psychological distress.
Confirmatory nonlinear factor analyses were conducted
Confirmation and refinement of constructs using MIRT
Reliability estimates (i.e., α coefficients) of the neurological MIRT analysis
and gastrointestinal symptoms were small, .59 and .54 re- The MIRT model included 33 items loading on six fac-
spectively. Reliability was only .55 for the ethanol consump- tors (i.e., Psychological Distress, Respiratory Symptoms,
tion and fear domains. As reliability is prerequisite to test Musculoskeletal Pain, Family Connectedness, Mobility,Lee et al. Health and Quality of Life Outcomes (2020) 18:50 Page 11 of 17
Table 5 Loadings from nonlinear exploratory factor analysis with 56 items and 13 factors
F1 F2 F3 F4 F5 F6 F7 F8 F9 F10 F11 F12 F13
1. Relatives worry alcohol consumption 0.93
2. Need to cut down on alcohol consumption 0.71
3. Thoughts of suicide 0.88
4. Anxious or nervous 0.79
5. Restless and irritable 0.89
6. Sad most of the time 0.89
7. Difficulty in concentrating 0.64
8. Little interest in relationships or activities 0.67
9. Excessive daytime drowsiness 0.32
10. Sleep difficulty 0.42
11. Fatigue 0.93
12. Fearful of safety 0.81
13. Afraid in home 0.94
14. Tendency to fall easily 0.36 0.59
15. Coughing 0.85
16. Shortness of breath 0.46
17. Wheezing 1.03 0.37
18. Had no symptom
19. Difficulty with pain 0.47
20. Abnormal swelling in legs or feet 0.61
21. Back pain 0.69
22. Difficulty moving an arm or a leg 0.35
23. Joint pain 0.33 0.80
24. Joint swelling 0.54 0.62
25. Muscle pain 0.89
26. Changes in bowel movement 0.46
27. Loss of appetite 0.95
28. Nausea 0.61
29. Diarrhea 0.72
30. Weight loss of > 10 lbs 0.69
31. Constipation 0.42
32. Weight gain of > 10 lbs 0.41
33. Difficulty swallowing 0.33
34. Leaking urine 0.45
35. Diminished hearing
36. Headaches 0.36
37. Family or friends who can assist with homecare needs
38. divorced or widowed in the past year -0.34
39. In committed relationships 1.00
40. Lives alone 1.02
41. Lives in housing facility with assistance 0.40
42. Living wills or advance directives
43. Can climb two flights of stairs without stopping 0.39 0.41
44. Difficulty climbing stairs by myself 0.82 0.43Lee et al. Health and Quality of Life Outcomes (2020) 18:50 Page 12 of 17
Table 5 Loadings from nonlinear exploratory factor analysis with 56 items and 13 factors (Continued)
F1 F2 F3 F4 F5 F6 F7 F8 F9 F10 F11 F12 F13
45. No difficulty performing activities of daily life 0.71 0.48
46. Difficulty walking by myself -0.54 0.69 0.55
47. Depend on assistive devices or assistance from others in daily life 0.71 0.32 0.47
48. Difficulty bathing 0.94
49. Difficulty dressing 0.91
50. Difficulty eating 0.88
51. Difficulty housekeeping 0.80
52. Difficulty taking medications 0.86
53. Difficulty of transportation 0.85
54. Difficulty using toilet 0.90
55. Difficulty getting in and out of bed 0.90
56. Difficulty preparing meals 0.93
Note. Loadings equal to or greater than |0.32| are presented
Activities of Daily Living) and was fitted using the sec- symptoms and problems with activities. Figure 6 shows
ond split-half sample (n = 4282). This model had an ex- that for each of these constructs, the peak of the infor-
cellent fit according to three fit indices (RMSR = 0.005, mation function from MIRT analyses is at the higher
Tanaka fit index = 0.997, RMSEA = 0.072) although χ2 end of the score continuum, whereas the peak of the
test of good fit was rejected (χ2 = 11,098.8, df = 480, score density function is at the lower end. These results
p < .001). Table 6 presents item discrimination and diffi- agree with the Rasch findings, in which psychological
culty parameters for this model. The items for psycho- distress, symptom burden, and social support did not
logical distress, musculoskeletal pain, respiratory separate patients’ scores very well, because items were
symptoms, or activities of daily living were better at either almost uniformly endorsed by everyone or seldom
measuring greater rather than smaller degrees of the endorsed by anyone.
Fig. 5 Hierarchical tree diagram from hierarchical agglomerative clusteringLee et al. Health and Quality of Life Outcomes (2020) 18:50 Page 13 of 17
Table 6 Item Parameters from the multidimensional IRT model with six factors
a1 a2 a3 a4 a5 a6 b
1. Thoughts of suicide 1.27 0 0 0 0 0 3.67
2. Anxious or nervous 1.41 0 0 0 0 0 2.25
3. Restless and irritable 1.88 0 0 0 0 0 3.29
4. Sad most of the time 1.72 0 0 0 0 0 3.52
5. Difficulty in concentrating 1.57 0 0 0 0 0 2.89
6. Little interest in relationships or activities 1.61 0 0 0 0 0 3.07
7. Sleep difficulty 0.86 0 0 0 0 0 1.19
8. Difficulty with pain 0 0.91 0 0 0 0 0.51
9. Back pain 0 0.96 0 0 0 0 1.04
10. Difficulty moving an arm or a leg 0 1.28 0 0 0 0 1.60
11. Joint pain 0 1.01 0 0 0 0 0.93
12. Joint swelling 0 0.90 0 0 0 0 1.95
13. Muscle pain 0 1.15 0 0 0 0 1.57
14. Coughing 0 0 1.12 0 0 0 1.22
15. Shortness of breath 0 0 1.22 0 0 0 0.39
16. Wheezing 0 0 1.96 0 0 0 2.50
17. In committed relationships 0 0 0 3.00 0 0 -1.25
18. Lives alone 0 0 0 3.00 0 0 -1.75
19. Lives in housing facility with assistance 0 0 0 0.93 0 0 -1.29
20. Can climb two flights of stairs without stopping 0 0 0 0 2.11 0 1.00
21. Difficulty climbing stairs by myself 0 0 0 0 3.00 0 1.19
22. No difficulty performing activities of daily life 0 0 0 0 3.00 0 0.34
23. Difficulty walking by myself 0 0 0 0 1.72 0 1.37
24. Depend on assistive devices or assistance from others in daily life 0 0 0 0 0 2.04 1.18
25. Difficulty bathing 0 0 0 0 0 3.00 3.61
26. Difficulty dressing 0 0 0 0 0 2.09 2.98
27. Difficulty eating 0 0 0 0 0 1.10 2.81
28. Difficulty housekeeping 0 0 0 0 0 3.00 2.62
29. Difficulty taking medications 0 0 0 0 0 1.51 2.04
30. Difficulty of transportation 0 0 0 0 0 1.79 2.39
31. Difficulty using toilet 0 0 0 0 0 2.49 4.24
32. Difficulty getting in and out of bed 0 0 0 0 0 1.68 2.83
33. Difficulty preparing meals 0 0 0 0 0 2.64 2.92
Note. a’s denote item discrimination and b denotes item difficulty parameters. The numbers following a’s denote their respective factors
Scoring the weighted scores (.95 to .98) depending on the do-
We computed scores based on six final constructs from main. Correlations between the MIRT and the weighted
the MIRT analyses rather than the four hypothesized scores ranged from .87 to .97. The high correlations in-
constructs on which the Rasch analyses were conducted. dicate that the three different scoring strategies pro-
We made this choice because the six constructs had ad- duced scores that increased or decreased for the most
equate internal consistency estimates (at least .70 as part in parallel, and can be used interchangeably.
noted above) and our expert panel agreed that the item’s
contents were well aligned with their respective con- Convergent and discriminant validity
structs. MIRT-based scores were highly correlated with The factor score correlations estimated from the
the raw summed scores, with coefficients ranging from MIRT model are presented in the lower diagonal
.85 to .98. Raw scores were also highly correlated with matrix of Table 7. The strength of correlation isLee et al. Health and Quality of Life Outcomes (2020) 18:50 Page 14 of 17
Psychological distreess Respiratory Sympptom
Musculoskeletal paiin Livving situatioon
Mobility
M Activitties of daily lliving
Fig. 6 Test information curve (Up) and score distribution (Bottom) from MIRT analyses
greater for factor scores compared to that of raw Known-groups comparison
scores in the upper diagonal because the former have Having a diagnosis of anxiety was associated with higher
higher reliabilities. The pattern of correlations were as psychological distress MIRT scores. Diagnoses of arth-
follows: Mobility and Activities of Daily Living were ritis or diseases of musculoskeletal/ connective tissues
highly correlated, providing evidence of convergent were associated with higher Pain, higher difficulty with
validity, but only moderately or weakly correlated Mobility, and higher difficulty with Activities of Daily
with other constructs, providing evidence of discrim- Living scores. Diagnoses of dyspnea and diseases of re-
inant validity. Psychological Distress was moderately spiratory system, and pulmonary symptoms were associ-
correlated with Respiratory Symptoms and Musculo- ated with higher Respiratory Symptoms scores (Table 8).
skeletal Pain scores, and weakly correlated with Mo-
bility and Activities of Daily Living. Being more Discussion
connected with family was negatively associated with Our study shows that conventional psychometric
function as well as psychological and physical methods can be applied in a meaningful way to assess
symptoms. the validity of clinician-developed “home grown”Lee et al. Health and Quality of Life Outcomes (2020) 18:50 Page 15 of 17
Table 7 Correlations among six domain scores
Psychological Musculoskeletal Respiratory Living situation (family Mobility ADL
Distress Pain Symptoms connectedness)
Psychological Distress 1 .36 .26 -.07 .17 .14
Musculoskeletal Pain .59 1 .21 -.08 .25 .16
Respiratory Symptoms .48 .33 1 -.06 .26 .12
Living situation (family -.12 -.09 -.09 1 -.27 -.26
connectedness)
Mobility .27 .37 .34 -.34 1 .62
ADL .27 .26 .15 -.38 .84 1
Note. The lower diagonal contains the correlations estimated from multidimensional IRT, and the upper diagonal contains raw sum score correlations. All
correlations were statistically significant at .001 level
screening items that are relevant to the needs and clin- minimal discrimination or clinically actionable informa-
ical care of patients with chronic disease. However, re- tion in several domains. Fifth, all scoring approaches
sults from the Rasch analyses reveal the limited were essentially comparable.
information provided by the binary screening items, Two straightforward steps following the identification
even in aggregate, and their inability, apart from physical of candidate constructs may have saved us time and ef-
function, to discriminate trait levels in the target popula- fort; namely 1) Identifying problematic gaps in item
tion. Our findings are both encouraging and sobering as coverage of construct subdomains, and 2) Examining the
they demonstrate that while conventional methods can degree of variation in patients’ responses. For example,
identify constructs that discriminate in a clinically useful the former could have been achieved through focus
manner, such constructs may be limited in number- groups or a modified Delphi process. Had we included
particularly if individual variations were captured more this step, we may have abandoned further investigation
with binary than polytomous items [30]. Our results of the social construct given that key subdomains were
offer a cautionary tale (although perhaps not as caution- not represented. Regarding the second point, we noticed
ary for institutions that may have achieved more preci- early on that few patients endorsed psychological dis-
sion in their questionnaires as might be provided by tress. The Rasch and MIRT analyses subsequently con-
instruments such as ordinal or numerical rating scales.) firmed a lack of variation in patients’ responses.
to others seeking to leverage and clinically apply the Despite our ability to isolate useful information, our re-
huge amounts of data collected with “psychometrically sults highlight the need for developing instruments and
naïve” screening tools. items with rigorous psychometric methods. Apart from
Systematic collection of patient reported information function, all other scales not only lacked discrimination,
using wholly or partially “homegrown” questionnaires has but also had problematic gaps in subdomain coverage. This
been a common practice across many institutions and is partly because our form was created as a screening ra-
represents are potentially valuable sources of data to in- ther than a monitoring tool. Among the latent factors iden-
form often overlooked dimensions of patient care. The tified in this study, most function items were similar to
steps followed in our effort to establish the psychometric those in the validated measures widely used for functional
soundness of these data are relatively straightforward, assessment in elderly and chronically ill populations [7, 31,
grounded in widely accepted methods. As such, they may 32]. This fact may explain the superior performance of the
guide others in their own efforts with similar datasets. function scale, as well as its inclusion of a polytomous item
Our results offer several insights that may save other which permitted a greater variability in responses.
investigators time and resources. First, the literature In this paper, we focused on identifying and validating
search and clinician content expert inputs provided valu- latent constructs, which can be thought of as the causes
able information and required limited investment. Sec- of responses to items. In the case of symptom burden
ond, our multi-pronged, hypothesis-driven approach to originally identified by clinician experts, an alternative
identify constructs and items relevant a specific areas of conception of a trait as a composite of distinct attributes
interest (in our case hospital-based rehabilitation and may have been more sensible. That is, there may be no
supportive care) proved both effective and parsimonious. common cause of musculoskeletal pain and coughing,
Third, EFA and cluster analyses proved useful means of but together they could form the composite of symptom
assessing the robustness of the hypothesized constructs burden. In this formative model, there is no directional
and identifying overlooked constructs. We also used reli- relationship from the constructs to the items. An ex-
ability estimates to exclude some domains. Fourth, both ample would be the FACT symptom indices, in which
MIRT and Rasch analyses showed that the items offered bone pain, coughing, and sleeping difficulty define aLee et al. Health and Quality of Life Outcomes (2020) 18:50 Page 16 of 17
Table 8 Known-groups comparisonusing diagnosis variables external to the scales
Diagnosis of anxiety (N=2,564) No diagnosis of anxiety (N=10,095) Wilcoxon rank p value
sum W
statistic
Psychological Distress median= 0.22 median= -0.08 8,208,987 < .001
MIRT score
Diagnosis of arthritis (N=4,276) No diagnosis of arthritis (N=8,383) Wilcoxon rank p value
sum W
statistic
Pain MIRT score median= 0.24 median= -0.14 13,694,869 < .001
Difficulty with Mobility median= 0.15 median= -0.23 13,969,526 < .001
MIRT score
Difficulty with Activities median= 0.15 median= -0.17 14,039,972 < .001
of Daily Living MIRT
score
Diagnosis of diseases of musculoskeletal No diagnosis of diseases of musculoskeletal Wilcoxon rank p value
system and connective tissues (N=9,297) system and connective tissues (N=3,362) sum W
statistic
Pain MIRT score median= 0.06 median= -0.32 11,555,660 < .001
Mobility MIRT score median= 0.09 median= -0.38 10,897,243 < .001
Activities of Daily Living median= 0.08 -0.39 10,721,472 < .001
MIRT score
Diagnosis of dyspnea, diseases of No diagnosis of dyspnea, diseases of Wilcoxon rank p value
respiratory system, pulmonary symptoms respiratory system, pulmonary symptoms sum W
(N=11,476) (N=1,183) statistic
Respiratory symptoms median= 0.13 median= -0.46 4,547,788 < .001
MIRT score
disease-related symptom burden [33]. In a future investi- information; EFA: Exploratory factor analysis; GED: general equivalency
gation, we could study whether a summation of all diploma; ICD: International classification of disease; MI: Myocardial infarction;
PRO: Patient reported outcome; RMSEA: Root mean square error of
symptoms originally identified by our content experts approximation; SD: Standard deviation
can predict 30-day hospital readmission.
Acknowledgments
Conclusion The authors would like to thank the statistical program analysts who
contributed their skills and time to this project.
The post hoc application of conventional psychometric
methods can be used to aggregate and evaluate the val- Authors’ contributions
idity of clinician-developed “home grown” PRO items ML designed and conducted all analyses and drafted the manuscript. AC
that are relevant to the needs and clinical care of pa- assisted in study design and manuscript preparation. JB assisted in data
interpretation and manuscript preparation. All authors read and approved
tients with chronic disease. This finding is important the final manuscript.
given the vast amounts of longitudinal data that have
been collected from under-represented clinical and Funding
demographic patient subgroups using these tools. Unfor- Funding was provided through the Mayo Clinic’s Kern Center for the Science
of Health Care Delivery.
tunately, questionnaires relying on a small number of
binary screening items rather than more granular mea- Availability of data and materials
sures or with restricted content coverage may limit the The data described in this manuscript have not been de-identified and are
information gained. therefore not publicly available.
Ethics approval and consent to participate
Supplementary information Ethical approval was granted by the Mayo Clinic Rochester Institutional
Supplementary information accompanies this paper at https://doi.org/10. Review Board. The study used retrospective data previously collected in the
1186/s12955-020-01287-2. course of routine. Therefore, clinical informed consent was not obtained.
Additional file 1. Content of items and their response rates. Consent for publication
Not applicable.
Abbreviation
ADL: Activities of daily living; CAD: Coronary artery disease; CHF: Congestive Competing interests
heart failure; COPD: Chronic obstructive pulmonary disease; CVI: Current visit The authors declare that they have no competing interests.Lee et al. Health and Quality of Life Outcomes (2020) 18:50 Page 17 of 17
Author details 25. Houts CR, Cai L. flexMIRT® user's manual version 2: flexible multilevel
1
Kern Center for the Science of Health Care Delivery, Mayo Clinic, 200 First multidimensional item analysis and test scoring. Vector Psychometric Group:
Street SW, Rochester, MN 55905, USA. 2Department of Physical Medicine and Chapel Hill; 2013.
Rehabilitation, Mayo Clinic, Rochester, MN, USA. 3Center for Rehabilitation 26. Robitzsch A. sirt: Supplementary item response theory models. R package
Outcomes Research, Shirley Ryan AbilityLab, and the Department of Physical version 1.8–9; 2015.
Medicine and Rehabilitation, Northwestern University, Chicago, IL, USA. 27. Cai L. flexMIRT® version 2: flexible multilevel multidimensional item analysis
and test scoring. Vector Psychometric Group: Chapel Hill; 2013.
Received: 1 December 2019 Accepted: 10 February 2020 28. Linacre JM. WINSTEPS® Rasch measurement computer program User's
guide. Oregon: Winsteps.Com: Beaverton; 2019.
29. Wells CS, Wollack J. An instructor's guide to understanding test reliability.
Madison: Testing & Evaluation Services, University of Wisconsin; 2003.
References 30. MacCallum RC, Zhang S, Preacher KJ, Rucker DD. On the practice of
1. Snyder CF, Aaronson NK. Use of patient-reported outcomes in clinical dichotomization of quantitative variables. Psychol Methods. 2002;7:19–40.
practice. Lancet. 2009;374:369–70. 31. Katz S, Ford AB, Moskowitz RW, Jackson BA, Jaffe MW. Studies of illness in
2. Basch E, Deal AM, Kris MG, et al. Symptom monitoring with patient-reported the aged. The index of Adl: a standardized measure of biological and
outcomes during routine Cancer treatment: a randomized controlled trial. J psychosocial function. JAMA. 1963;185:914–9.
Clin Oncol. 2016;34:557–65. 32. Reijneveld SA, Spijker J, Dijkshoorn H. Katz' ADL index assessed functional
3. Hansen TB, Thygesen LC, Zwisler AD, et al. Self-reported health-related performance of Turkish, Moroccan, and Dutch elderly. J Clin Epidemiol.
quality of life predicts 5-year mortality and hospital readmissions in patients 2007;60:382–8.
with ischaemic heart disease. Eur J Prev Cardiol. 2015;22:882–9. 33. Rothrock NE, Jensen SE, Beaumont JL, Abernethy AP, Jacobson PB, Syrjala K,
4. Calvert M, Blazeby J, Altman DG, Revicki DA, Moher D, Brundage MD. Cella D, et al. Value Health. 2013;16:789–96.
Reporting of patient-reported outcomes in randomized trials: the CONSORT
PRO extension. JAMA. 2013;309:814–22.
5. Reeve BB, Wyrwich KW, Wu AW, et al. ISOQOL recommends minimum Publisher’s Note
standards for patient-reported outcome measures used in patient-centered Springer Nature remains neutral with regard to jurisdictional claims in
outcomes and comparative effectiveness research. Quality Life Res. 2013;22: published maps and institutional affiliations.
1889–905.
6. Zhou H, Della PR, Roberts P, Goh L, Dhaliwal SS. Utility of models to predict
28-day or 30-day unplanned hospital readmissions: an updated systematic
review. BMJ Open. 2016;6:e011060.
7. Dunlay SM, Manemann SM, Chamberlain AM, et al. Activities of daily living
and outcomes in heart failure. Circ Heart failure. 2015;8:261–7.
8. Dunlay SM, Weston SA, Killian JM, Bell MR, Jaffe AS, Roger VL. Thirty-day
rehospitalizations after acute myocardial infarction: a cohort study. Ann
Intern Med. 2012;157:11–8.
9. Pederson JL, Warkentin LM, Majumdar SR, McAlister FA. Depressive
symptoms are associated with higher rates of readmission or mortality after
medical hospitalization: a systematic review and meta-analysis. J Hosp Med.
2016;11:373–80.
10. Katzan IL, Spertus J, Bettger JP, et al. Risk adjustment of ischemic stroke
outcomes for comparing hospital performance: a statement for healthcare
professionals from the American Heart Association/American Stroke
Association. Stroke. 2014;45:918–44.
11. Chokshi DA, Chang JE. Preventing early readmissions. JAMA. 2014;312:1344–
5.
12. Stekhoven DJ. missForest: Nonparametric Missing Value Imputation using
Random Forest. R package version 1.4 ed; 2013.
13. Stekhoven DJ, Buehlmann P. MissForest - non-parametric missing value
imputation for mixed-type data. Bioinformatics. 2012;28:112–8.
14. Wright B, Masters G. Rating scale analysis: Rasch measurement. Chicago:
MESA Press; 1982.
15. Linacre JM. Winsteps® Rasch measurement computer program. Oregon:
Winsteps.com: Beaverton; 2019.
16. Nunnally JC, Bernstein IH. Psychometric Theory. 3rd ed. New York: McGraw-
Hill; 1994.
17. Horn JL. A rationale and test for the number of factors in factor analysis.
Psychometrika. 1965;30:179–85.
18. Tabachnick BGF, Fidell LS. Using multivariate statistics. 6th ed. Pearson:
Harlow, England; 2014.
19. Kieffer KM. Orthogonal versus oblique factor rotation: a review of the
literature regarding the pros and cons. New Orleans: American Educational
Research Association; 1998.
20. McDonald RP. Test theory: a unified treatment. Lawrence Earlbaum
Associates: Mahwah; 1999.
21. Hooper D, Coughlan J, Mullan M. Structural equation modelling: guidelines
for determining model fit. Electron J Bus Res Methods. 2008;6:53–60.
22. McDonald RP, editor. Normal-ogive multidimensional model. New York:
Springer; 1997.
23. Cai L. High-dimensional exploratory item factor analysis by a Metropolis-
Hastings Robbins-Monro algorithm. Psychometrika. 2010;75:33–57.
24. Cai L. Metropolis-Hastings Robbins-Monro algorithm for confirmatory item
factor analysis. J Educ Behav Stat. 2010;35:307–35.You can also read