FIXED INCOME Credit Insights| South Africa - SA Sovereign Rating Preview November 2017 - Nedbank
←
→
Page content transcription
If your browser does not render page correctly, please read the page content below

FIXED INCOME
                                               Credit Insights| South Africa

                                                           SA Sovereign Rating Preview
                                                                      November 2017

DCM Credit Insights|21 November 2017 |PAGE 1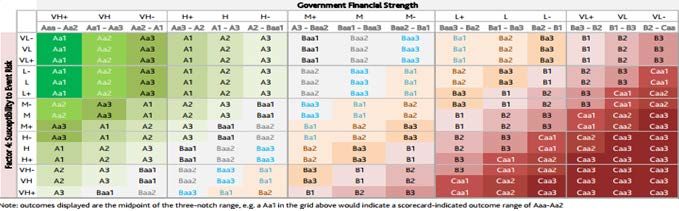
ANALYST                                      DISCLAIMER

   Analyst Details
                                               The information furnished in this report, brochure, document, material, or communication (‘the Commentary’), has been prepared by
                                               Nedbank Limited (acting through its Nedbank Capital division), a registered bank in the Republic of South Africa, with registration
   Jones Gondo                                 number: 1951/000009/06 and having its registered office at 135 Rivonia Road, Sandton, Johannesburg (‘Nedbank’). The information
                                               contained herein may include facts relating to current events or prevailing market conditions as at the date of this Commentary,
   Senior Research Analyst: DCM Credit         which conditions may change and Nedbank shall be under no obligation to notify the recipient thereof or modify or amend this
                                               Commentary. The information included herein has been obtained from various sources believed by Nedbank to be reliable and
                                               expressed in good faith, however, Nedbank does not guarantee the accuracy and/or completeness thereof and accepts no liability in
   Tel: +27 11 294 4484                        relation thereto. Nedbank does not expressly, or by implication represent, recommend or propose that any securities and/or financial
                                               or investment products or services referred to in this Commentary are appropriate and or/or suitable for the recipient’s particular
   Email: jonesg@nedbank.co.za                 investment objectives or financial situation. This Commentary should not be construed as ‘advice’ as contemplated in the Financial
                                               Advisory and Intermediary Services Act, 37 of 2002 in relation to the specified products. The recipient must obtain its own advice
   jonesg@nedbank.co.za                        prior to making any decision or taking any action whatsoever.
                                               This Commentary is neither an offer to sell nor a solicitation of an offer to buy any of the products mentioned herein. Any offer to
                                               purchase or sell would be subject to Nedbank’s internal approvals and agreement between the recipient and Nedbank. Any prices or
                                               levels contained herein are preliminary and indicative only and do not represent bids or offers and may not be considered to be
                                               binding on Nedbank. All risks associated with any products mentioned herein may not be disclosed to any third party and the
                                               recipient is obliged to ascertain all such risks prior to investing or transacting in the product or services. Products may involve a high
                                               degree of risk including but not limited to a low or no investment return, capital loss, counterparty risk, or issuer default, adverse or
                                               unanticipated financial markets fluctuations, inflation and currency exchange. As a result of these risks, the value of the product may
                                               fluctuate. Nedbank cannot predict actual results, performance or actual returns and no guarantee, assurance or warranties are given
                                               in this regard. Any information relating to past financial performance is not an indication of future performance.
                                               Nedbank does not warrant or guarantee merchantability, non‐infringement or third party rights or fitness for a particular purpose.
                                               Nedbank, its affiliates and individuals associated with them may have positions or may deal in securities or financial products or
                                               investments identical or similar to the products.
                                               This Commentary is available to persons in the Republic of South Africa, financial services providers as defined in the FAIS Act, as
                                               well as to other investment and financial professionals who have experience in financial and investment matters.
                                               All rights reserved. Any unauthorized use or disclosure of this material is prohibited. This material may not be reproduced without the
                                               prior written consent of Nedbank, and should the information be so distributed and/or used by any recipients and/or unauthorized
                                               third party, Nedbank disclaims any liability for any loss of whatsoever nature that may be suffered by any party by relying on the
                                               information contained in this Commentary.
                                               Certain information and views contained in this Commentary are proprietary to Nedbank and are protected under the Berne
                                               Convention and in terms of the Copyright Act 98 of 1978 as amended. Any unlawful or attempted illegal copyright or use of this
                                               information or views may result in criminal or civil legal liability.
                                               All trademarks, service marks and logos used in this Commentary are trademarks or service marks or registered trademarks or
                                               service marks of Nedbank or its affiliates.
                                               Nedbank Limited is a licensed Financial Services Provider and a Registered Credit Provider (FSP License Number 9363 and
                                               National Credit Provider License Number NCRCP 16).

DCM Credit Insights|21 November 2017 |PAGE 2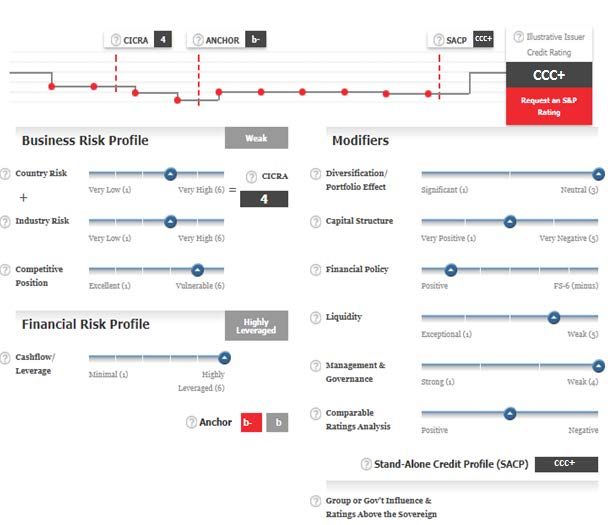
RATING FISCAL TRANSITIONS
 The investment/speculative grade transition point is one of the most important rating statistics, but it is notoriously
 difficult to adjudicate

 •   The purpose of this special credit note is to highlight some of the key credit considerations that will probably be debated in rating agencies’ credit committees this week and to speculate on
     what the possible rating outcomes could be.
 •   Credit ratings have often been said to be both an art and a science. Not every rating transition path is the same, but the aim remains to provide credit rankings in a globally consistent
     manner.
 •   Credit rating opinions are guided (but not dictated) by models and methodologies, peer comparisons, third party information and primary information gathered in discussions with the issuer
     and various other stakeholders. This means that the interpretation and application of the criteria is critical in deducing a relative credit story and distilling this insight into a binary outcome
     (eg affirm or downgrade a rating).
 •   Ultimately, the rating opinion is the outcome of a committee voting process that seeks to find consensus among sometimes divergent views around credit strengths and weaknesses. The
     majority vote then determines the opinion. Therefore, it is notoriously difficult to predict a rating outcome based on the strict application of methodology alone. One has to consider all the
     possible paths that could lead to a particular rating outcome and estimate how a number of individuals are likely to debate, reason and vote on the most credible ratings path.
 •   Our approach here has been to analyse the criteria and highlight some peer relativities so as to form a baseline view on SA’s fundamental credit metrics. This helps us to measure how much
     discretion the ratings committees have used in the past to arrive at the final rating outcome. It also illustrates how certain components contribute to the overall outcome (eg politics vs
     institutions vs growth). It is these nuances that speak to the 'art' of credit ratings. In the case of the South African sovereign (which faces the risk of a rating transition to speculative grade)
     there is great uncertainty around the timing of a downgrade and whether rating agencies would ‘wait and see’ how political events develop before ‘pulling the trigger’.
 •   The fact is that the country’s fiscal metrics have deteriorated significantly between February and October 2017 when compared to what the rating agencies had calculated (although it had
     been flagged that revenue shortfalls could be realised). The question here, in our mind, is whether the deterioration on its own is enough to shift the rating. Our answer is “not necessarily”.
     There is a need for a nuanced approach in order to understand the context in which these numbers were realised:
      ‒ Was the February budget credible in the first place? Should we doubt the MTBPS numbers and forecasts? Can the sovereign institutions justify a rating level in investment grade over the
        next 18-24 months if in just the last eight months alone the sovereign’s budgetary, revenue collection, state-owned enterprises and political institutions have failed to keep to promises
        of reform and fiscal prudence?
      ‒ Will the rating agencies be bullish about growth prospects and economic reforms depending on which ANC faction wins the elective conference?
      ‒ If there was no ANC elective conference event this December, would the rating agencies be inclined to downgrade now?
 •   If one was to take a point-in-time rating today, we think a downgrade by Moody’s and S&P would be justified and credible, especially so on a peer comparison basis. However, the issue is
     whether this would remain justified over the medium-term (due to the fact that it would be anchoring South Africa’s rating firmly in the speculative grade space).
 •   In our opinion, we think S&P will need to close the gap between their foreign and local currency rating. Moody’s on the other hand would need to look to “automatic adjustment” factors to
     transition the rating to speculative grade, and there might be some division in their committee around this. Potentially, this could leave Moody’s as the only agency rating South Africa as
     investment grade.

DCM Credit Insights|21 November 2017 |PAGE 3
2017 HAS BEEN EVENTFUL FOR CREDIT AND WE EXPECT THE SAME IN 2018
SA credit prospects will continue to be shaped by local politics, global flows and sentiment
January February March April 2018
• 17-18 Jan
• 24 Jan - SARB MPC • 1 Feb – US FOMC • 15 Mar – US FOMC • 7 Apr – Moody’s SA Sovereign Rating (MPC)
• 24 Jan – Brexit Supreme Court • 7 Feb – Pre-SONA Investor Briefing • 15 Mar – Netherlands General 23 Apr – French Presidential • 30-31 Jan
• 9 Feb – SA State of the Nation Election Elections (1st Round) (FOMC)
Ruling
Address • 16 Mar - US Debt Ceiling • Feb (SONA &
Budget
• 21 Feb - US State of the Union • 29 Mar – Expected Brexit Invocation
Speech)
Address • 30 Mar – SARB MPC • 26-28 Mar
• 22 Feb – SA National Budget Speech (MPC)
• 1-2 May
(FOMC)
May June July August • 22-24 May
• 3 May – US FOMC • Fitch SA Sovereign Review (No Public • 20 Jul – SARB MPC • 11 Aug – Moody’s SA Sovereign (MPC)
• 24 May (Latest
7 May – French Presidential Elections Release Schedule - Timing Uncertain) 26 Jul – US FOMC Rating (No review took place)
• • date for
(2nd Round) • 2 Jun – S&P SA Sovereign Rating Moody’s &
S&P rating
• 25 May – SARB MPC • 14 Jun – US FOMC reviews, but
• 26 Jun – ANC Policy Conference could be
earlier than
this date)
• 12-13 Jun
September October November December (FOMC)
• 20 Sep – US FOMC • China’s Politburo • Fitch SA Sovereign Review (No Public • 13 Dec – US FOMC
• 22 Oct - Germany General Election Release Schedule - Timing Nov’17) • 16-20 Dec ANC 54th National
• 21 Sep - SARB MPC
• 1 Nov – US FOMC Conference
• 25 Oct – SA Medium Term Budget
• 23 Nov – SARB MPC
Policy Statement
• 24 Nov – Moody’s SA Sovereign
Rating Update
• 24 Nov – S&P SA Sovereign Rating
SA Events, SA Credit Ratings, US Events, Europe Events, China Events, Other Comments
Source: Bloomberg, National Treasury, Nedbank CIB, Moody’s, S&P, South African Reserve Bank (SARB)
DCM Credit Insights|21 November 2017 |PAGE 4SOUTH AFRICA SOVEREIGN RATING
Downgrade is a virtual certainty in our opinion, but timing is the big question
FITCH
Expected outcome: Maintain BB+ ratings.
Change outlook to negative with a view to
downgrade in 1Q18 .
Current (FC): BB+/Stable/B Current (FC): Baa3/Negative/P-3 Current (FC): BB+/Negative/B
MOODY’S
Expected outcome: Lower the applicable Initial Rating: BB/--/- Initial Rating: Baa3/--/- Initial Rating: BB/Stable/-
rating range from Baa2-Ba1 to Baa3-Ba2. (22-Sept-1994) (3-oct-1994) (3-Oct-1994)
Maintain Baa3 local and foreign currency
rating. Place ratings on “Review for Next Rating Review Date Next Rating Review Date Next Rating Review Date
downgrade” to assess the implications of the (Uncertain, but expected 20-24 Nov. 2017) (11-Aug-2017; 24-Nov-2017) (24-Nov-2017)
ANC policy conference on investor sentiment,
business confidence and policy
implementation prospects (in as far as growth
and fiscal outcomes are concerned). South Africa’s Long-Term (FC) Rating History (1994-2017)
A2/AA
S&P A3/AA-
Expected outcome: Lower local currency
rating from BBB- to BB+ and equalize with the Baa1/BBB+
foreign currency rating at the BB+ level.
Maintain a negative outlook with a view to Baa2/BBB
lowering both ratings in 2018 if politics
remain an inhibitor to growth and Baa3/BBB-
institutional/structural reforms (even after the
ANC policy conference). Ba1/BB+
Ba2/BB
• We think the committee decisions will not
be unanimous, which makes prediction Ba3/BB-
difficult (majority vote rules).
• Commentary by rating analysts after the B1/B+
Oct-94
Oct-95
Oct-96
Oct-97
Oct-98
Oct-99
Sep-00
Sep-01
Sep-02
Sep-03
Sep-04
Sep-05
Sep-06
Sep-07
Sep-08
Sep-09
Sep-10
Sep-11
Sep-12
Sep-13
Sep-14
Jul-16
MTBPS are not the views of the
committee, but merely the views of one or
two voters in the committee. S&P Moody's Fitch
Source: Fitch, Moody’s, S&P
DCM Credit Insights|21 November 2017 |PAGE 5INDEX EXCLUSION
SA will remain in smaller Emerging Market indices, but the WGBI is the most important in our view
• South Africa is/was included in a variety of government South Africa's Eligibility in the Citi World Government Bond Index
bond indices, used by tracker-funds to benchmark
portfolio performance.
• These include the following from a ratings eligibility • WGBI Market Value US$21,148 billion;
perspective: • South Africa Market Value ~US$93 Billion, or 0.44% and includes ~15 note issues (since the last change in March 2017)
• Citi World Government Bond Index (WGBI) – Investment 31-Oct-17 • Passive tracker outflow amount eatimated ~ US$8-US$10 billion
grade local currency rating from both S&P and Moody’s.
• The WGBI also has sub-indices such as the Citi
Criteria Generic Eligibility South Africa's Eligibility
Emerging Market Government Bond Index – Ratings
above 'C' or 'Ca' by S&P and Moody’s respectively (SA Coupon Fixed-Rate, non-callable Yes; excludes ZCBs for South Africa
currently included).
• Barclays Global Aggregate Index – Investment grade local South Africa uses the three-legged instrument approach (R186, R2044
currency rating from any two global ratings agencies (SA and R2048) where the stated maturity of each bundle is the middle
currently included). However, it takes either S&P or
Minimum Maturity At least one year maturity date. Consequently the WGBI only assesses the minimum
Moody’s to go sub-investment grade to meet exclusion
based on the first maturity date across the aggregate, rather than per
requirements.
leg.
• JP Morgan Government Bond Index EM – No ratings
eligibility, but requires low barriers-to-entry for foreign
investors (SA included). Minimum Issue Size ZAR 10 billion Yes, multiple times > R10 billion in issue within the three legs.
• JP Morgan Emerging Market Bond Index (EMBIG) –
Investment grade foreign currency rating from any two • SA entered with index quality 'A' in 2012 comprising an LC rating of
global ratings agencies (SA excluded 28 April 2017). 'A' from S&P and 'A3' from Moody's.
* Entry: A- by S&P and A3 by Moody's for all new
• JP Morgan Government Bond Index EM GD – Investment • Currently, SA faces high risk of exit with an index quality of 'BBB-'
Minimum Credit Quality markets.
grade local currency rating from all three global ratings consisting of an S&P LC rating and outlook of 'BBB-/Neg.' and
agencies (SA excluded 31 May 2017). * Exit: Below BBB- by S&P and Baa3 by Moody's
'Baa3/Neg.' from Moody's.
• The three main indices are the WGBI, the Barclays Global • Both need to be sub-investment grade to exit.
Aggregate and the JP Morgan EMBIG. South Africa has
already been excluded from the JP Morgan EMBIG,
without inducing a significant amount of volatility, seeing * Entry: A market should actively encourage foreign
as many of the fund managers shifted their holdings to investor participation and show a commitment to its
other EM-focused funds which accommodate the bonds own policies
Generally, South Africa maintains open participation by foreign
without mandate restrictions. The key index of concern is * Exit: Circumstantial, but commonly includes
the WGBI in our mind, given its relatively larger size. Barriers-to-Entry investors with a floating exchange rate regime, independent and
situations where a new policies could result in
credible monetary policy
• When South Africa’s government bond index was included ownership restrictions and capital controls which
in the WGBI in 2012, it accounted for 0.45% of the WGBI’s might encumber investors' ability to replicate that
market value and ranked 17th out of 23 sovereigns by market's return contribution to the index.
market weighting. South Africa’s weighting was
approximately 0.44% (US$87 billion) in March 2017. Source: The Yield Book – Citi Fixed Income Indices
DCM Credit Insights|21 November 2017 |PAGE 6CDS MARKET-DERIVED SIGNAL
The market is pricing-in at least a two-notch downgrade on the FC ratings
S&P Global Market Implied Rating – Republic of South Africa (3Y – Nov 2014 to Nov 2017)
Do market signals matter?
• Market signals explicitly matter at Moody’s as
they form part of the Government Liquidity Risk
assessment. This is an underpin of the
sovereign’s perceived susceptibility to event risk.
• As a general principle, ratings primarily depend
on fundamental analysis (data for which is only
available with a lag). Therefore, market events
that alter investor sentiment in the short-run
may not persist into the medium-term and may
not materially alter fundamental credit metrics
over the forecast horizon. If anything, rating
agencies are more likely to respond to market
events using the rating outlook (either
CreditWatch statements over the short-run or
Pos./Neg. outlooks over the medium-term). Moody’s Market Implied Rating – Republic of South Africa (3Y – Nov’14 to Nov’17)
• Certainly, significant shocks could lead to
fundamental changes to ratings and market
expectations. This would reflect coincidence in
the movement of the issuer credit rating and the
market implied signal.
• Nevertheless, the charts illustrate the well-
established fact that credit ratings consistently
lag the market.
• The October MTBPS moved spreads enough to
imply a downgrade, and so we wait to see if the
agencies will concur with the market sentiment
in November 2017 or defer the action until 2018.
Source: Moody’s, S&P
DCM Credit Insights|21 November 2017 |PAGE 7SOAF 5Y CDS VS R186 10Y INDEX
Dissonance in the market – could sovereign ratings be the catalyst for a correction?
Real yield EM investors are not overly
concerned about investment grade vs
speculative grade ratings or relative
creditworthiness, in as much as they care
about relative yields.
Compared to the CDS-implied ratings charts
presented previously, this chart illustrates that
perhaps the CDS is not pricing-in a potential
downgrade; especially when directly
compared to the yields reflected in the R186
index.
The gap between CDS and the R186 (the most
liquid benchmark sovereign bond) is widening
and this is not unique to South Africa.
Other EM curves look the same, and so we
believe that this is reflective of a broader EM
theme rather than a South Africa-specific one.
Source: Bloomberg
DCM Credit Insights|21 November 2017 |PAGE 8S&P RATING TRANSITION OVERVIEW
S&P likely to lower the local currency rating and equalize FC with LC at the 'BB+' level with a negative outlook
We believe there is a high
risk of movement to Fiscal
Moderately Weak (4.0) Institutional Economic External Fiscal Debt Monetary
Flexibility &
owing to the deterioration Assessment Assessment Assessment Burden Assessment
in income levels (GDP per Performance
Neutral (3.0) Weakness (4.0) Neutral (4.0) Weakness (5.0) Weakness (4.0) Strength (2.0)
capita in US$) and reduced
policy effectiveness,
stability and predictability
due to fractious politics. If Institutional & Economic Profile Flexibility & Performance Profile
this were to happen, then
the indicative rating would Intermediate (3.5) Moderately Weak (4.0) after adjustments for contingent liabilities
be 'BB'.
Sovereign Indicative Rating Level (bb+)
Supplementary Adjustment Factors: Allows one notch,
up/down, for qualitative adjustment of the indicative
rating. We believe South Africa previously benefitted
from a notch uplift to 'BBB-' which has now been
removed.
Foreign-currency sovereign rating (BB+)
Zero to two notches uplift: South Africa currently
benefits from a one notch uplift, given its openness to
international investment flows and ZAR liquidity in
international FX trade being near 1%. However we
assess the fiscal score at '6' compared to an average of
~3.25 across all other component scores. This is > 1
point difference. Hence the closing of LC vs FC gap.
Local-currency sovereign rating (BBB- BB+) Source: Nedbank CIB, S&P
DCM Credit Insights|21 November 2017 |PAGE 9MOODY’S RATING TRANSITION OVERVIEW
We expect an overall change in the indicative bond rating range from (Baa2 – Ba1) to (Baa3 - Ba2), but expect the Baa3
rating to be placed on 'Review For Downgrade'
• MTBPS data directly affects the Fiscal Strength assessment, and we believe
this will lower the assessment from 'Moderate (+)' to 'Moderate'. This is Moody’s sovereign rating model logical framework
mainly owing to significantly deteriorated trends for debt affordability and
debt burden. Susceptibility to
There is scope for an additional negative adjustment for 'Other non- Economic strength Institutional strength Fiscal strength
•
financial public sector debt/GDP' which could result in a 'Moderate (-)'
event risk
overall Fiscal Strength assessment. Moderate (+) Moderate (+) Moderate (+) Moderate Moderate (-)
• There is a time lag for Institutional Strength measures as these are drawn or Moderate (-)
from third party sources. However Moody’s has the discretion to adjust
these if they do not reflect reality as they perceive it to be. Economic resiliency
• In our view, there is scope for Moody’s to adjust for 'Other Policy Moderate (+)
Considerations' beyond monetary policy effectiveness (which is their
baseline measure). This could take account of the fiscal slippage and the Government financial strength
'hollowing-out' of the National Treasury’s institutional memory through key
departures. However, even if the Institutional Strength score were lowered
Moderate (+) Moderate
to 'Moderate' from 'Moderate (+)' the combination with a 'Moderate (+)'
Economic Strength component would not change the Economic Resiliency Government bond rating range
assessment. We think Moody’s would look to lower Economic Resiliency (Baa2 – Ba1) (Baa3 – Ba2)
overall, if they think the Growth Dynamics are worse than National
Treasury has forecast (i.e. averaging less than 1.25% between 2012-2021F,
from 1.6% currently over the same period).
Model rating outcome is the mid-point of a three-notch range: Eg. Ba1 is in the range Baa3-Ba2
• Furthermore, we see pressure on 'Government Liquidity Risk' with a
significant rise in the non-resident share of government ZAR-denominated
debt and the CDS-implied ratings rising from Ba1 to Ba2.
• When we consider South Africa’s peers, especially Turkey, it becomes clear
that a downgrade now in November 2017 is probably justified in order to
maintain credit relativities on a model basis. However, we think South
Africa could benefit once again due to ‘the timing not being right’ (if we are
to read into the agency’s most recent commentary).
• For this reason, we feel that the November committee decision will not be
unanimous. We think some committee members will follow the model
rating (which we calculate at Ba1) and seek to maintain peer relativities,
while a few others will rather take their time to consider the aftereffects of
the ANC policy conference and the February budget to assess the new fiscal
path under potentially a new government.
• The commentary provided after the MTBPS by Moody’s gives an insight
into the primary analysts’ disposition, but it represents only one or two
analysts’ considered views (and not the global committee’s views).
Source: Moody’s, Nedbank CIB
DCM Credit Insights|21 November 2017 |PAGE 10BORDERLINE SOVEREIGN CREDIT METRICS
Wealth levels, government effectiveness, debt burden have breached (or fall close to) key transition thresholds
US$, 000's Despite the
S&P lower- GDP per capita trend, The key Index points World Government Effectiveness Index
bound point is that the
8500 0.8
threshold combination of
$5,940. 8000 weaker 0.7
Depending on institutions and
USD/ZAR 7500 0.6
growth dynamics
forecasts & 7000 needs to result in 0.5
population a lower Moody’s lower-bound
growth vs GDP 6500 0.4
'Economic threshold range 0.11-0.25
growth, S&P 6000 Resiliency' score 0.3
could see their of at least
5500 0.2
forecast fall 'Moderate‘,
below the red 5000 firmly anchoring 0.1
line. Enough the indicative
4500
to downgrade rating range in 0
the indicative 4000 sub-investment -0.1
rating to 'BB'. grade (Ba1 to
Ba3) -0.2
S&P’s Debt Level Fiscal debt burden
ZAR Mil. measures have been
assessment
Net debt-to-GDP ratio breached, % Debt Burden
range is
currently 30%- 80% underpinning a lower
overall 'Fiscal 250
60%. Threshold
5 000 000 Strength' assessment.
If contingent 160%
liabilities are The combination of 200
Threshold
added, S&P 4 000 000 60% 'Fiscal Strength' and
looks to see if Threshold 'Economic Resilience' 150
the range shifts 17% underpins the overall
3 000 000 'Government
to a worse 18% 17.5% 100
category (61%- 18% Financial Strength' 55%
2 000 000 17% assessment (which is Threshold
80%). Currently. 15%
14% core to the ratings). 50
S&P currently
49% 49% We think this will slip
estimates public 1 000 000 46% 48%
42% 45% from 'Moderate (+)' 0
sector debt/GDP 39%
at 70%, with risk to 'Moderate'
of further - inducing an
slippage in the 2013/14 2014/15 2015/16 2016/17 2017/18 2018/19 2019/20 indicative issuer
near-term to the credit rating of Ba1
from Baa3 currently. Gen. Govt. Debt/ GDP Gen. Govt. Debt/ Gen. Govt. Revenue
81%-100% GDP Net loan debt Contingent Liabilities
range. Source: Moody’s, National Treasury, Nedbank CIB, S&P
DCM Credit Insights|21 November 2017 |PAGE 11BORDERLINE SOVEREIGN CREDIT METRICS
Financial performance and flexibility, debt affordability, NFPE guarantee exposures
We think
National Change in debt/GDP Debt service costs/ Revenues
% %
Treasury tried to
keep this within 7 16.0
the 3%-5%
range, but we 6 S&P 14.0
think S&P will 11%-15%
estimate the
5 Threshold 12.0
range at 4%-7%.
We also think 10.0
that this will be a 4 Moody’s
catalyst for S&P 12%-13% 8.0
to revise their 3 Threshold
overall 'Fiscal 6.0
Assessment' 2 Debt
lower, alongside 4.0
affordability is
negative
1 still within
adjustments for 2.0
tolerance
contingent
ranges for S&P,
liabilities. 0 but will breach –
2011 2012 2013 2014 2015 2016 2017 2018 2019 2020 for Moody’s 2015 2016 2017F 2018F 2019F 2020F
ZAR Billions 2016/17 Government Guarantee Exposures
400
Debt rollover risk
Liquidity management risk
Management & Governance risk
300 Regulatory risk (NERSA)
Revenue collection (Municipalities & falling manufacturing output)
62% Extremely High default risk
200
Legal & Regulatory risk Management & Governance
Revenue collection Management & Governance Debt rollover risk 63%
Moderate default risk Management & Governance
Business restructure Liquidity risk
Debt rollover risk Revenue collection
100 Business model restructure
Debt rollover risk Business restructure
Low default risk Extremely High default risk Extremely High default risk
77% 38%
Very high default risk
81% 100% 94%
109% 89% 100% 0% 91%
0
ESKOM SANRAL DFIs Transnet South African Post Trans-Caledon Denel Public-private South African South African South African Independent power
Office Tunnel Authority partnerships Reserve Bank Airways Express producers
Risk of increased exposure Guarantee Exposure Entities on National Treasury’s watchlist
Source: Moody’s, National Treasury, Nedbank CIB, S&P
DCM Credit Insights|21 November 2017 |PAGE 12ESKOM ANALYSIS
Eskom’s debt is approximately 10x EBITDA and 9% of FY2016 GDP. It is ‘too big to fail’, but willingness vs ability to
support might prove that timely sovereign intervention is becoming more difficult
B+ (three notches of uplift for government support)
When an entity enters the 'CCC' category, all rating criteria and stand-alone components measured become irrelevant.
The 'CCC' criteria becomes the main assessment tool. Accordingly this is what a 'ccc+' rating means:
One-in-two likelihood of default.
An obligation rated 'CCC' is currently vulnerable to non-payment, and is dependent upon favourable
business, financial, and economic conditions for the obligor to meet its financial commitment on the
obligation. In the event of adverse business, financial, or economic conditions, the obligor is not likely to
have the capacity to meet its financial commitment on the obligation.
Eskom benefits from extraordinary government support and has benefited in the past. Therefore, there is no evidence to
suggest that government is unwilling to support. However, the ability to support is in some doubt, causing concerns over
the timeliness of support. Fitch has recently placed Eskom’s unguaranteed debt ratings on 'Ratings Watch Negative'
because of concerns around Eskom’s near-term liquidity risks and the timeliness of sovereign support for these
unguaranteed debt obligations. As such, the combination of willingness plus inability means Eskom cannot expect the full
credit uplift or substitution for all its senior unsecured obligations. Eskom, along with the Sovereign, might be forced to
choose which obligations to support (the guaranteed debt) and which to default (unguaranteed debt).
The sovereign has a few options :
1. Distressed exchange – exchange RSA sovereign bonds for Eskom bonds (effectively fiscalizing the
contingent liability). This is considered a default at S&P on the exchanged notes.
2. Create an asset management company for distressed SOC debt that takes these assets off-balance sheet
for investors and banks, and replaces them with sovereign-backed notes.
3. Negotiate with lenders for a debt standstill and then restructure or reschedule obligations.
4. Convert government (including PIC and GEPF) unguaranteed debt or bilateral loans into equity.
5. Inject ~ZAR80bn in new capital to ensure liquidity recovers to at least 1.2x sources-to-uses of cash. The
entity needs R3-4bn/month to meet average working capital needs, which can only be reduced to about
R2-3bn by reducing capex and other measures.
• Either way, the sovereign would rather bail-out Eskom to some extent than face a systemic spillover into the financial
system (which would seize-up the derivatives market and interbank system, and cost the sovereign more due to it
having to guarantee the stability of the financial system directly).
Source: Nedbank CIB, S&P
DCM Credit Insights|21 November 2017 |PAGE 13PRESCRIBED ASSETS – SIGNS OF WEAKENING INSTITUTIONAL STRENGTH
All these debates point to attempts to try to 'politically capture' the treasury and the weakening of institutional integrity
• Prescribed assets is a pre-democratic South African relic, and the investment community is probably loath to ever go back to the days when the state dictated asset allocation for investors “in the
national interest”.
• Academically-speaking, prescription and directed lending have a place in economic development. However, development practitioners always caution that market-based principles and adherence to risk
management principles need to be preserved in the policy formulation in order to minimize market distortions (such as the age-old problem of moral hazard and adverse selection which could result in
catastrophic economic losses).
• We feel that South Africa can achieve its development aims and outcomes without resorting to prescription by simply focusing on the ESG-principles that underpin 'Responsible Investing' as an
investment class. On the part of government and its political principals, this means implementing the country’s long-term growth plans, which would bring many more bankable infrastructure projects
into the pipeline (Water and Sanitation, Road and Rail infrastructure, Education and Health Infrastructure etc).
• In the earlier part of this decade, Minister Patel engaged the private sector on this very subject (development bonds) and the facts presented then are still relevant now. Furthermore, the unanswered
questions still remain unanswered:
‒ Is the problem a lack of savings or a lack of investible projects?
‒ Who has the knowledge and ability to set the appropriate level of prescription and to monitor and regulate compliance?
‒ Who will monitor and regulate the SOCs and government agencies that are meant to generate the economic returns, and what rights will investors have?
‒ Is it even constitutionally sound for the state to pursue prescription?
‒ Should the state provide guarantees, and if so would this be credit negative for the sovereign and result in higher funding costs that could make the projects non-viable and reduce risk appetite and
the pool of funds available for investment?
‒ Would these assets rank senior or subordinated to existing notes and what market mechanism would be used to price these assets?
‒ Would investors be able to repo these assets or exit their positions?
‒ Would the state make a market in these notes and provide two-way pricing and liquidity or would they be illiquid instruments?
• In our opinion, the market has already shown an appetite for project bonds and Green bonds, and continues to support SOC debt in a responsible fashion (especially when one considers that about one-
fifth of new debt issuance every year typically comes from SOC and Municipal debt issuers in the domestic debt capital market). One would probably find in an economic experiment/hypothesis, that the
'appropriate' level of prescription would result in asset allocation similar to the amount actually being invested in the target assets currently.
• It is also important to remember that state-owned pension and insurance funds are already heavily invested directly or through third party fund managers in SOC bonds. An analysis of debt holders
across a sample of SOC bonds outstanding shows that more than 50% of notes outstanding are held for the benefit of state-owned pension and insurance beneficiaries.
• All-in-all, the important point to underscore from a credit perspective is that the debate on prescribed assets, pronouncements about using UIF funds to sponsor free tertiary education, or dipping
into the PIC to rescue failing SOCs all point (in our opinion) to attempts to weaken the political integrity or independence of state institutions such as the Treasury (which recently culminated in the
resignation of yet another senior National Treasury official). Ultimately, this only justifies the credit concerns already cited by ratings agencies about the sovereign. However, the question is whether
this political and policy deterioration will come to an abrupt halt following from the ANC Elective Conference (thereby resulting in the formal adoption of earlier policy conference resolutions)?
DCM Credit Insights|21 November 2017 |PAGE 14SOC HOLDERS ANALYSIS
Distribution of Top 100 SOC Bondholders. The Top 20 account for nearly 80% of outstanding notes
Rank Managing Firm Name % Held Rank Managing Firm Name % Held
1 GOVERNMENT EMP PENSION FD 46.72% 52 SAMWU NATIONAL PROV FUND 0.17%
2 PUBLIC INVESTMENT CORP 5.73%
53 GRANTHAM MAYO VAN OTTERLOO & CO 0.17%
3 MMI GROUP LIMITED 2.81% 54 SECLEND POOLED COLLATERAL 0.16%
4 RMB CAPITAL MARKETS PROP 2.24% 55 FNB PENSION PENSION COLOUR 0.16%
5 OLD MUTUAL PLC 2.10% 56 LIBERTY GROUP LTD 0.15%
6 INVESTEC PLC 2.07% Based on ~R475 billion in notes outstanding on Bloomberg
7 SANLAM LIFE INSURANCE LTD 1.70% 57 VIRTUS INVESTMENT PARTNERS INC 0.15%
8 BLACKROCK 1.48%
58 LANDESBANK BERLIN INVESTMENT GMB 0.15%
9 STD BK SA CAP MRKTS 1.22% 59 SIMLEND MAIN ACCOUNT 0.15%
10 STANLIB ASSET MANAGEMENT 1.05% 60 SCHRODERS PLC 0.14% GEPF (47.8%)
11 ABSA TREASURY BONDS 0.98% 61 LAZARD LTD 0.13%
62 UBS 0.13%
Others (21%) 50% PIC (5.7%)
12 LIBERTY LIFE ASSURANCE AFRICA 0.94% Domestic Primary Dealers (RMB,
63 HARCOURT STREET 0.13% Credit Agricole Groupe (Beneficiaries: 45%
13 AIPF-NT 0.88% 64 MOMENTUM 0.13% Standard Bbank, ABSA, Nedcor,
AMUNDI Funds; 0.7%) 40%
14 ESKOM PENSION & PROVIDENT FUND 0.78% 65 RAND MUTUAL ASSUR COMPANY 0.13% Investec 5.6%)
15 PRUDENTIAL FINANCIAL INC 0.77% 66 ALLAN GRAY LIFE GLOBAL BAL 0.12% Prudential Financial Inc 35%
16 TRANSNET LIMITED 0.75% 67 LHWP TRANS CALEDON TUNNEL 0.12% (Beneficiaries: Prudential, PIMCO, T. MMI Group (2.8%)
17 NEDCOR CAPITAL TREASURY 0.75% 68 MIBFA PENSIONER POOL EIPF 0.12%
Rowe Price, JPM Funds; 0.77%) 30%
18 SA NATIONAL RD AGENCY 0.72%
69 DURBAN PENSION FUND COLOUR 0.12% 25%
19 CREDIT AGRICOLE GROUPE 0.70%
70 SASOL PENSION FUND 0.12%
20 ABSA BANK LIMITED 0.68%
GOVERNMENT EMPLOYEES PENSION 71 INVESTMENT SOLUTIONS UNIT TRUST 0.11% Blackrock (ETF Beneficiaries, 1.5%) 20% Investec PLC (2.1%)
21 FD 0.67%
72 PRINCIPAL FINANCIAL GROUP INC 0.11% 15%
22 TRANSNET SECOND DEF BEN FD 0.64%
23 TRANSNET SCND DEFINED BEN 0.63% 73 VAN ECK ASSOCIATES CORPORATION 0.11% 10%
24 ALLIANZ SE 0.52% Allianz SE (Beneficiaries: PIMCO,
25 T ROWE PRICE GROUP INC 0.45% 74 PRUDENT KWAZULU NATAL PENS 0.10%
Allianz, AFM Insurance, Blue Ccross & 5% Sanlam Life Insurance (1.7%)
75 EIPF SANLAM BOND 0.10%
26 INVESTEC MERCHANT BANK OWN 0.44% 76 TCW GROUP INC 0.10% Blue Shield of Kansas Inc; 0.52%) 0%
27 TIAA-CREF 0.43% 77 EIPF COLOURFIELDS 0.10%
28 ASHMORE GROUP PLC 0.43% 78 VOYA INVESTMENT MANAGEMENT LLC 0.10%
29 METAL INDUSTRIES PROVIDENT 0.43%
30 NEDGROUP INVESTMENTS 0.41% 79 CHURCHILL ASSET MANAGEMENT LLC 0.10% Nedgroup Investments (0.5%) Old Mutual PLC (2.1%)
31 PRUDENTIAL PLC 0.40% 80 FIL LIMITED 0.09%
32 FMR LLC 0.40% 81 SYDINVEST INTERNATIONAL 0.09%
33 SANLAM LTD 0.39% 82 DEUTSCHE BANK AG 0.09%
83 MUNICH REINS LIFE SAFE CUS 0.09%
34 NORTHERN TRUST LUX MGMT CO SA 0.38% 84 OMIGNAM NAMIBIA 0.09% Sanlam Limited (0.7%) Liberty Life Assurance Africa (0.98%)
35 ORBIS ALLAN GRAY LTD 0.33% 85 NAMIB GOV INSTITUTIONS FD 0.09%
36 ROYAL BANK OF CANADA 0.31% 86 MINEWORKERS PROVIDENT FUND 0.09%
37 ALLAN GRAY BALANCED FUND 0.30%
38 NGI FLEX INC FUND 0.30% 87 BOUTIQUE COLLECTIVE INV RF PTY 0.09% Transnet Scnd Defined Benefit Fund
Stanlib Asset Management (1.1%)
39 INVESTEC CORPORATE BOND FD 0.29% 88 GOLDMAN SACHS GROUP INC 0.08% 1.27%)
40 NN GROUP NV 0.28%
89 DISCOVERY HEALTH MED SCHEM 0.08%
41 DANSKE BANK A/S 0.26%
Transnet Ltd (0.75%) AIPF-NT (0.88%)
90 FORT WASHINGTON INVEST ADVISORS 0.08% Eskom Pension & Provident Fund
42 SEMPER CONSTANTIA PRIVATBANK AG 0.25% 91 MITTAL STEEL PEN CORONATN 0.08% SA National Rd Agency (0.72%)
43 BUSHA J M 0.25% (0.78%)
44 LIBERTY GROUP SHARE PORT 0.24% 92 RAIFFEISEN BANK INTERNATIONAL 0.08%
45 ENGINEERING INDUSTRIES PEN 0.20% 93 ESKOM PENSION PROVIDENT FD 0.08%
94 INVESTEC SECURITES BONDS 0.08%
46 PRESCIENT INCOME PROVIDER 0.20%
95 INVESTEC CAUTIOUS MANAGED 0.08%
47 NORDEA BANK AB 0.19%
96 BNY MELLON 0.08%
48 RAND MUTUAL ASSURANCE COMP 0.19% 97 VONTOBEL HOLDING AG 0.07%
98 TRF FUTURE GROWTH BONDS 0.07%
49 JMPF COLOURFIELD LIABILITY 0.19%
50 JPMORGAN CHASE & CO 0.18% 99 METROPOLITAN COLLECTIVE INVEST 0.07%
100 SBSA ITF NEDG INV OPP FUND 0.07% Source: Bloomberg, Nov, 2017
51 NEUBERGER BERMAN GROUP LLC 0.18% 101 POST OFFICE RETIRE FUTUREG 0.07%
DCM Credit Insights|21 November 2017 |PAGE 15APPENDIX Moody’s Rating Scorecard S&P Rating Scorecard DCM Credit Insights|21 November 2017 |PAGE 16
Our interpretation of Moody's rating scorecard vs peers
South Africa Brazil Russia Turkey
Indicative factor Indicative Final score Indicative Final score Indicative Final score
Rating Factors Sub-factor weighting Indicator* Final score factor Indicator Indicator Indicator
score factor score factor factor score factor factor score factor
Factor 1: Economic strength
M+ M+ M M H- M+ H H
Growth Dynamics
50%
Average real GDP growth (2012-2021F)
1.6 0.9 1.1 4.4
Volatility in real GDP growth (std. dev., 2007-2016)
1.9 3.8 4.7 4.5
WEF Global Competitiveness index (2016)
4.5 4.1 4.5 4.4
Scale of the economy
25%
Nominal GDP (US$ billion, 2016)
294.3 1796.2 1283.2 857.7
National Income
25%
GDP per capita (PPP, US$, 2016)
12 679 15 238 26 490 24 912
Automatic adjustments
[-3;0] Scores applied Scores applied Scores applied Scores applied
Credit boom
0 0 0 0
Factor 2: Institutional strength
H- M+ M- M VL- L M+ M-
Institutional framework and effectiveness
75%
Worldwide Government Effectiveness index (2015)
0.3 -0.2 -0.2 0.2
Worldwide Rule of Law index (2015)
0.1 -0.1 -0.7 -0.1
Worldwide Control of Corruption index (2015)
0 -0.4 -0.9 -0.1
Policy credibility and effectiveness
25%
Inflation level (%, 2012-2021F)
5.7 5.7 6.2 8.1
Inflation volatility (std. dev., 2007-2016)
1.9 1.7 3.4 1.3
Automatic adjustments
[-3;0] Scores applied Scores applied Scores applied Scores applied
Track record of default
0 0 -3 -1
Other considerations for policy effectiveness
0 --> -1
Economic Resiliency (Factor 1 x Factor 2) H- M+ M M L- M- H- M+
Factor 3: Fiscal strength
M+ --> M M+ --> M L- L VH+ VH H+ H-
Debt Burden
50%
General government debt/GDP (2016)
51.3 --> 54.2 69.9 16.1 28.3
General government debt/revenue (2016)
141.5 --> 186 214.5 49.8 82.5
Debt affordability
50%
General government interest payments/revenue
(2016)
9.7 --> 12.9 19.9 2.8 6.1
General government interest payments/GDP (2016)
3.3 6.5 0.9 2.1
Automatic adjustments
[-6;+4] Scores applied Scores applied Scores applied Scores applied
Debt trend (2013-2018F)
0 -2 0 0
Foreign currency debt/general government debt
(2016)
0 0 -1 -3
Other non-financial public sector debt/GDP (2016)
-1 0 0 0
Public sector assets/general government debt (2016) 0 0 1 0
Government financial strength (Factor 1 x Factor 2 x
Factor 3) H- --> M+ M+ --> M L+ M- M H- H M+
Factor 4: Susceptibility to event risk Max. function M- M- M- M H H H- H-
Political risk
M- M- M- M- H H H- H-
Worldwide voice & accountability index (2015)
0.6 0.5 -1.1 -0.4
Government liquidity risk
VL+ --> L+ L VL- VL+ VL M+ L L-
Gross borrowing requirements/GDP
5.5 --> 5.3 21 3.7 9.3
Non-resident share of general government debt (%)
29.9 --> 40 5.2 17.2 41
Market-Impled Ratings
Ba1 --> Ba2 A1 Baa2 Ba2
Banking sector risk
L+ L M- M M+ M+ M M
Average baseline credit assessment (BCA)
baa3 ba2 ba3 ba2
Total domestic bank assets/GDP
113 136 93 105
Banking system loan-to-deposit ratio
95 88 106 119
L L VL- VL- VL- L M+ H-
External vulnerability risk
(Current account balance + FDI Inflows)/GDP
-2.5 3 4.5 -2.4
External vulnerability indicator (EVI)
89.1 45.4 25.1 202.3
Net international investment position/GDP
3.8 -33.6 17.3 -41.5
(A3-Baa2) --> (Baa3- (Baa2-Ba1) --> (Baa3-
Ba2-B1 Ba1-Ba3 Ba2-B1 Baa2-Ba1 A3-Baa2 Baa3-Ba2
Government bond rating range (Factor 1 x Factor 2 x Ba2) Ba2)
Factor 3 x Factor 4)
Assigned foreign currency Baa3* Risk of ∆ to Ba1 Ba2 Ba1 Ba1
government bond ratingOur interpretation of S&P's sovereign rating scorecard versus peers
South Africa Brazil Russia Turkey
Scores [1-6] Scores [1-6] Scores [1-6] Scores [1-6]
Factor 1 Institutional Effectiveness 3 Neutral 4 Neutral 6 Weakness 5 Weakness
SA faces reduced predictability of future policy responses, due to moderate risk of challenges to political instituions
owing to demands by parts of the population desiring greater economic participation. This is consistent with a
primary factor score of "4" in our view.
There is increasing risk of this score falling to "5" as we see institutions such as the National Treasury "hollowed-out"
3
and losing its technical and institutional capacity which has until now withstood undue political interference. This 4 5 5
(risk of ∆ to "4")
Primary Factor (effectiveness, stability & predictability of trend may gradually impair the capability and willingness of the sovereign to maintain sustainable finances and social
policymaking, political institutions & civil society) tensions could heighten -- reducing the capacity of political institutions to respond to societal priorities.
S&P currently believes SA has a strong democracy with independent media and reporting and that the sovereign will
Secondary Factor: Transparency & accountability of instituions, continue to maintain checks and balances through the judiciary and other independent instituions. This is consistent
data, and processes with a score of "2" in our opinion.
Sovereign's debt payment culture 0 Neutral 0 0 0
External Security risks 0 Neutral 0 +1 0
Factor 2 Economic Assessment 4 Weakness 5 Weakness 6 Weakness 3 Neutral
An initial assessment of "4" corresponds with GDP
per capita thresholds in the range: $5,400-$15,800.
South Africa's current GDP per capital for FY2017 is
expected to be $6,090 by the IMF. If this number is
4 assessed within 10% of the lower-bound i.e. ≤
(risk of a ∆ to "5" if income levels $5,940 in FY2017, then the initial assessment could 4 4 4
fall below $5,940 per capita) be lowered to "5" from "4". Therefore, the USD-ZAR
exchange rate and projected real per capita GDP
growth S&P assumes will matter for this metric
going forward as it has been borderline on a
Income level: GDP per capita threshold forecasted basis for a while.
Trend growth is 1.73% and after the 2017 MTBPS,
this has lowered to 1.65% using National Treasury
forecasts. Countires, with an initial assessment of
0 "3" or "4" are expected to exhibit trend growth +1 0 0
between 1%-4%. Compared to peers such as Brazil,
Russia and Turkey; South Africa exhibits below-
Economic growth prospects: (trend growth: 2011 - 2020) average trend growth -- in our opinion.
Economic diversity and volatility 0 Neutral 0 +1 -1
EXTREMELY MODERATELY
Institutional & Economic Profile: Average(F1 + F2) 3.5 INTERMEDIATE (Risk of falling to Moderately Weak "4") 4.5 WEAK 6.0 4.0
WEAK WEAK
Factor 3 External Assessment 4 Neutral 2 Neutral 1 Strength 6 Weakness
Reserve currency: > 3% of of the world's total allocated foreign exchange (FX) reserves based on IMF data.
< 1% Actively traded currency: > 1% of global FX market turnover based on BIS Triennial Survey. In 2016, the BIS recorded < 1% > 1% > 1%
the ZAR at slightly < 1% of global FX turnover and resulting a change in the currency status to "ordinary" from
"actively traded" according to S&P criteria; prompting the agency to close the 2-notch gap between the FC and LC
Currency status in international transactions ratings to only 1-notch currently.
External liquidity: {Gross external financing needs / (CAR + 101%-150% 50%-100% 50%-100% Over 150%
Usable reserves)} FY2017: 101.7% and is forecast to remain above 101% to FY2020; and therefore in the range (101%-150%)
1%-50% FY2017: 17.8% and is forecast to average 21.5% over the next 3 years. The range is wide (1%-50%), and SA's metrics -50% - 0% -50% - 0% 101%-150%
External indebtedness {narrow net external debt/CAR} are expected to remain around the mid-point of this range.
SA has large external financing needs, which are now set to climb, rather than reduce following the MTBPS. S&P
+1 +1 0 +1
remains concerned about the sensitivity of funding its currenct account deficit with portfolio and other investment
Negative adjustments flows; which they deem to be volatile
Factor 4 Fiscal Assessment: Average(Sub-F1 + Sub-F2) 6 Weak 6 Weak 2.5 Neutral 2.5 Strength
The forecast average ratio is 4.3% with a slowly declining fiscal deficit trend from -3.4% in 2017 to -2.7% by 2020 --
resulting in an initial assessment of "4" or a "∆ in GG debt/GDP" ratio in the range of "3%-5%".
The 2017 MTBPS revised the FY2017 "∆ in GG debt" significantly from 5.3% expected by S&P to 6.9%. However, the
4 --> 5 revised forecast growth rate assumes a slow y-o-y rate averaging 4.2% over the next 2-3 years. The fiscal deficit is 6 2 3
now expected to remain stable at -3.9%. In our view, S&P is likely to take a more conservative view on the deficit
trend.
Fiscal performance and flexibility: {∆ in general government As such we expect a score change to "5" from "4" which implies a new range for the "∆ in GG debt/GDP ratio"
Sub-Factor 1 debt/GDP} (2017-2020) between "4%-7%".
0 While revenue shortfalls were pronounced and tax moraity risks are rising, we do not think a negative adjustment 0 0 0
from an intial score of "5" is warranted. However, if S&P believes that the initial score should remain at "4", we think
Negative adjustments they could then make a negative adjustment notch to compensate for the slippage in fiscal performance.
Sub-Factor 2 Debt Burden 4 6 1 2
S&P expected FY2017 ratio of 48.7% and three-year forecast averaging 50%. 2017 MTBPS revisions result in a
30%-60% FY2017 ratio of 49.1% and three-year forecast averaging 53.7%. The revisions are still within the 30%-60% range 61%-80% Below 30% Below 30%
Debt level: (Net general government debt/GDP) currently assessed.
S&P expected FY2017 ratio of 11.5% and three-year forecast averaging 12%. 2017 MTBPS revisions result in a
Cost of debt: (General government interest expenditure/general 11%-15% FY2017 ratio of 12% and three-year forecast averaging 12.7%. The revisions are still within the 11%-15% range Above 15% Below 5% 5%-10%
government revenues) currently assessed.
Contingent liabilities Moderate Limited Moderate Limited
Banking Industry Country Risk Assessment (BICRA) Group 1-5 Economic Risk (6) + Industry risk (4) = BICRA Group (5) 6 or 7 8 or 9 6 or 7
Banks' claims on resident non-government sector/GDP 50%-100% Consistent with an initial assessment of "Limited" 50%-100% 50%-100% 50%-100%
S&P estimated FY2017 public sector debt/GDP ratio at 70%. If contingent liabilities were fiscalized the net debt level
realised would be outside the 30%-60% range initially assessed in the Debt Burden score; hence S&P made a
negative adjustment of contingent liabilites from "Limited" to "moderate".
If S&P were to revise its net public sector debt/GDP estimate > 80%, this could result in a two-notch negative
adjustment with contingent liabilities described as "High" instead of "moderate".
+1 There is a strong possibility that extraordinary support from the sovereign will be sought from distressed SOC's such
as Denel, Eskom, SAA, SAPO, SANRAL and TCTA -- beyond some of the budget-neutral options (such as state asset 0 +1 0
(risk of ∆ to "+2")
sales and guarantee extensions). Eskom is the largest contingent liability and its going concern status critically
depends upon its ability to achieve the 20% tariff hike it has applied for, as well as revenue claw-backs through the
regulatory clearing account. Meanwhile Denel's ability to redeem or roll its outstanding bonds is minimal without
extraordinary sovereign support and similarly for SAA with its banking facilities. While the latter exposures are
small, the market reaction to default would heighten the refinancing risk across all SOCs as an asset class causing
systemic indigestion in the financial system and the sovereign.
Negative adjustments
Factor 5 Monetary Assessment 2 Strength 3.2 Neutral 2.6 Neutral 3.2 Neutral
Exchange rate regime 2 Free-floating currency 2 2 2
2 4 3 4
Monetary policy credibility & effectiveness & inflation trends Track record of operational independence and price stability with transparent and credible policies.
MODERATELY
Flexibility & Performance Profile: Average (F3 + F4 +F5) 4.0 MODERATELY WEAK 3.7 INTERMEDIATE 2.0 VERY STRONG 3.9
WEAK
Indicative Rating Level bb+ bb bb+ bb
Supplemental Adjustment 0 no supplementary notches of flexibility 0 0 0
Foreign-currency sovereign rating BB+ BB BB+ BB (unsolic.)
+1 notch --> zero notch
0 +1 notch +1 notch
differential The fiscal assessment (scored "5") is more than one-point weaker than the average of the other four components
(average score "3.25"). We think this gap is likely to remain over the next 24 months given the trend and level of
Uplift from FC-rating to Determine LC-Rating fiscal metrics and gradual weakening of the institutional framework due to politics.
Local-currency rating BBB- --> BB+ Equalize FC & LC at the BB+ level BB BBB- BB+ (unsolic.)You can also read