Mixed-phase orographic cloud microphysics during StormVEx and IFRACS - atmos-chem-phys.net
←
→
Page content transcription
If your browser does not render page correctly, please read the page content below
Atmos. Chem. Phys., 19, 5387–5401, 2019
https://doi.org/10.5194/acp-19-5387-2019
© Author(s) 2019. This work is distributed under
the Creative Commons Attribution 4.0 License.

Mixed-phase orographic cloud microphysics
during StormVEx and IFRACS
Douglas H. Lowenthal1 , A. Gannet Hallar1,2 , Robert O. David3,a , Ian B. McCubbin1 , Randolph D. Borys1 , and
Gerald G. Mace2
1 Desert Research Institute, 2215 Raggio Pkwy., Reno, NV 89509, USA
2 Department of Atmospheric Sciences, University of Utah, 135 S 1460 E, Salt Lake City, UT 84112, USA
3 ETH Zürich, Universitätstrasse 16, 8092 Zürich, Switzerland
a now at: Department of Geosciences, University of Oslo, P.O. Box 1022, Blindern, Oslo 0315, Norway

Correspondence: Douglas H. Lowenthal (dougl@dri.edu)

Received: 13 August 2018 – Discussion started: 10 September 2018
Revised: 15 February 2019 – Accepted: 8 April 2019 – Published: 24 April 2019

Abstract. Wintertime mixed-phase orographic cloud (MPC)        particle production by contact or immersion freezing. The ef-
measurements were conducted at the Storm Peak Laboratory       fect of blowing snow was evaluated from the relationship be-
(SPL) during the Storm Peak Lab Cloud Property Valida-         tween wind speed and Ni and by comparing the relative (per-
tion Experiment (StormVEx) and Isotopic Fractionation in       cent) ice particle PSDs at high and low wind speeds. These
Snow (IFRACS) programs in 2011 and 2014, respectively.         were similar, contrary to expectation for blowing snow. How-
The data include 92 h of simultaneous measurements of su-      ever, the correlation between wind speed and ice crystal con-
percooled liquid cloud droplet and ice particle size distri-   centration may support this explanation for high crystal con-
butions (PSDs). Average cloud droplet number concentra-        centrations at the surface. Secondary processes could have
tion (CDNC), droplet size (NMD), and liquid water content      contributed to high crystal concentrations but there was no
(LWC) were similar in both years, while ice particle concen-   direct evidence to support this. Further experimental work is
tration (Ni ) and ice water content (IWC) were higher during   needed to resolve these issues.
IFRACS. The consistency of the liquid cloud suggests that
SPL is essentially a cloud chamber that produces a consis-
tent cloud under moist, westerly flow during the winter. A
variable cloud condensation nuclei (CCN)-related inverse re-   1   Introduction
lationship between CDNC and NMD strengthened when the
data were stratified by LWC. Some of this variation is due     Aerosols and their effects on cloud microphysical properties
to changes in cloud base height below SPL. While there was     have been shown to alter precipitation formation and dis-
a weak inverse correlation between LWC and IWC in the          tribution over complex terrain (e.g., Pruppacher and Klett,
data as a whole, a stronger relationship was demonstrated      1997; Borys et al., 2003; Rosenfeld and Givati, 2006; Lowen-
for a case study on 9 February 2014 during IFRACS. A           thal et al., 2011; Saleeby et al., 2013). Higher concentrations
minimum LWC of 0.05 g m−3 showed that the cloud was            of cloud condensation nuclei (CCN) produce more numerous
not completely glaciated on this day. Erosion of the droplet   but smaller cloud droplets (Twomey et al., 1984; Peng et al.,
distribution at high IWC was attributed to the Wegener–        2002; Lowenthal et al., 2002). This leads to decreased rim-
Bergeron–Findeisen process as the high IWC was accom-          ing efficiency and decreased precipitation on the windward
panied by a 10-fold increase in Ni . A relationship between    slope (Borys et al., 2000, 2003) and has been shown to re-
large cloud droplet concentration (25–35 µm) and small ice     distribute precipitation over mountain barriers in modeling
particles (75–200 µm) under cold (< −8 ◦ C) but not warm       studies (Saleeby et al., 2009, 2013).
(> −8 ◦ C) conditions during IFRACS suggests primary ice          There are numerous studies and reviews of ice nucle-
                                                               ation theory, measurements, and modeling (Vali, 1996, 1999;

Published by Copernicus Publications on behalf of the European Geosciences Union.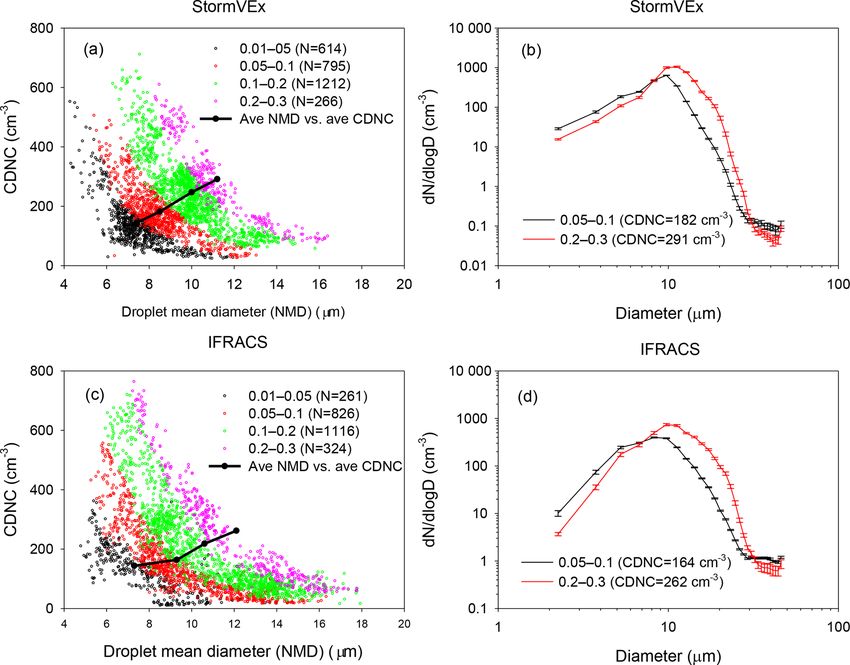
5388                D. H. Lowenthal et al.: Mixed-phase orographic cloud microphysics during StormVEx and IFRACS

Diehl et al., 2006; Hoose and Möhler, 2012; Ladino Moreno            Previous studies have furthered our understanding of
et al., 2013; Murray et al., 2012; Knopf and Alpert, 2013;        precipitation formation and distributions in complex ter-
Kanji et al., 2017; Knopf et al., 2018). In mixed-phase clouds    rain from dynamical and microphysical perspectives but
(MPCs), a small fraction of aerosols can act as heterogeneous     have been unable to establish a link between cloud micro-
ice-nucleating particles (INPs) and produce ice through four      physics aloft and at the surface. Rogers and Vali (1987) ob-
known freezing modes: deposition, immersion, condensa-            served cloud microphysics at the Elk Mountain Observatory
tion, and contact freezing. Contact freezing has been found       (EMO) located in the Medicine Bow Mountains of southern
to occur at higher temperatures than immersion freezing for       Wyoming and from the University of Wyoming Queen Air
a given INP (Pitter and Pruppacher, 1973; Lohmann and             (UWQA) aircraft. Comparisons between crystal concentra-
Diehl, 2006; Nagare et al., 2016). Biological INPs have been      tions at EMO and on the UWQA routinely showed higher
found to produce ice at relatively higher temperatures than       crystal concentrations at the surface. The authors attributed
non-biological INPs (Levin and Yankofsky, 1983; Du et al.,        higher surface concentrations to an unspecified process of ice
2017).                                                            crystal production in supercooled orographic clouds in con-
   Secondary ice production (SIP) processes were reviewed         tact with snow-covered mountain surfaces. However, blow-
by Field et al. (2017). Sullivan et al. (2018) modeled SIP        ing snow can also introduce the potential for artifacts in ob-
by rime splintering (Hallett–Mossop process), droplet shat-       served ice crystal concentrations at mountaintop locations
tering, and collisional breakup with ice particle enhancement     (Roger and Vali, 1987; Geerts et al., 2015).
depending on temperature, updraft velocity, and INP concen-          The Storm Peak Lab Cloud Property Validation Experi-
tration. Rime splintering is thought to occur when a super-       ment (StormVEx) was conducted from 15 November 2010 to
cooled droplet with a diameter larger than ∼ 25 µm freezes        25 April 2011 at the Desert Research Institute’s (DRI) Storm
onto an ice particle or other surface and shatters at temper-     Peak Laboratory (SPL) to produce a correlative data set to
atures between −8 and −3 ◦ C (Hallett and Mossop, 1974;           validate cloud retrievals using in situ measurements at SPL
Mossop, 1985). Keppas et al. (2017) found evidence for rime       (Mace et al., 2010; Matrosov et al., 2012). The Isotopic Frac-
splintering in warm (−6 to 0 ◦ C) frontal clouds. Here, lollie-   tionation in Snow (IFRACS) study was conducted at SPL
shaped crystals formed by riming of columnar crystals by          from 20 January to 27 February 2014 to explore the impacts
droplets larger than 100 µm were associated with high con-        of microphysical processes in wintertime orographic clouds
centrations of small columnar crystals. Rangno and Hobbs          on the water isotopic composition of falling snow (Lowen-
(2001) concluded that shattering of freezing droplets larger      thal et al., 2016; Moore et al., 2016). This paper examines
than 50 µm could have accounted for high observed ice par-        microphysical properties of wintertime orographic MPC at
ticle concentrations in Arctic stratus.                           SPL using data collected during StormVEx and IFRACS. A
   At mountaintop observatories, ice crystal concentrations       large record of concurrent measurements of ice and super-
frequently exceed aircraft measurements by an order of mag-       cooled liquid water was produced by these studies. These
nitude or more (Rogers and Vali, 1987; Geerts et al., 2015;       data enable exploration of statistical relationships among mi-
Lloyd et al., 2015; Beck et al., 2018). Lloyd et al. (2015)       crophysical properties, the temporal variation of cloud prop-
considered blowing snow, rime splintering, and detachment         erties over two winters at this site, the relationship between
of surface frost (Bacon et al., 1998) as sources of high ice      the ice and liquid phases, and ice production mechanisms.
particle concentrations at the Jungfraujoch Sphinx Observa-       Potential measurement artifacts due to instrumental charac-
tory (JFJ). They ultimately favored the latter mechanism by       teristics and blowing snow are evaluated.
process of elimination, albeit with no direct evidence. In con-
trast, Beck et al. (2018) suggested that the enhanced ice crys-
tal concentrations at the Sonnblick Observatory (SBO) were        2   Methods
due to blowing snow, turbulence near the mountain surface,
                                                                  SPL (3210 m a.s.l.; 40.456570◦ N, 106.739948◦ W) is lo-
or convergence of ice crystals near mountaintop due to oro-
                                                                  cated on the summit of Mt. Werner in the Park Range near
graphic lifting.
                                                                  Steamboat Springs, Colorado (Wetzel et al., 2004). In win-
   Several studies have shown a link between cloud droplet
                                                                  tertime, SPL is in snowing, supercooled liquid cloud roughly
size and ice particle concentrations (e.g., Hobbs and Rangno,
                                                                  25 % of the time (Borys and Wetzel, 1997). Storms oc-
1985; Rangno and Hobbs, 2001; Lance et al., 2011; de Boer
                                                                  cur roughly weekly under a variety of synoptic conditions
et al., 2011). Hobbs and Rangno (1985) found a strong re-
                                                                  (Rauber and Grant, 1986; Rauber et al., 1986; Borys and
lationship between the width of cloud droplet spectra and
                                                                  Wetzel, 1997). As noted by Lowenthal et al. (2016), given
ice particle concentrations in cumuliform and stratiform
                                                                  sufficient moisture during winter, a cloud forms and produces
clouds where cloud top temperature ranged between −36 and
                                                                  persistent snowfall at SPL. Winds are generally from the west
−6 ◦ C. Lance et al. (2011) found higher concentrations of ice
                                                                  or northwest during snowfall events. Clouds and snowfall can
particles larger than 400 µm in clean Arctic clouds with larger
                                                                  be inhibited by blocking from the Flat Top range (maximum
droplets sizes than in polluted Arctic clouds with smaller but
                                                                  elevation 3768 m a.s.l.) under flow from the southwest.
more numerous drops.

Atmos. Chem. Phys., 19, 5387–5401, 2019                                            www.atmos-chem-phys.net/19/5387/2019/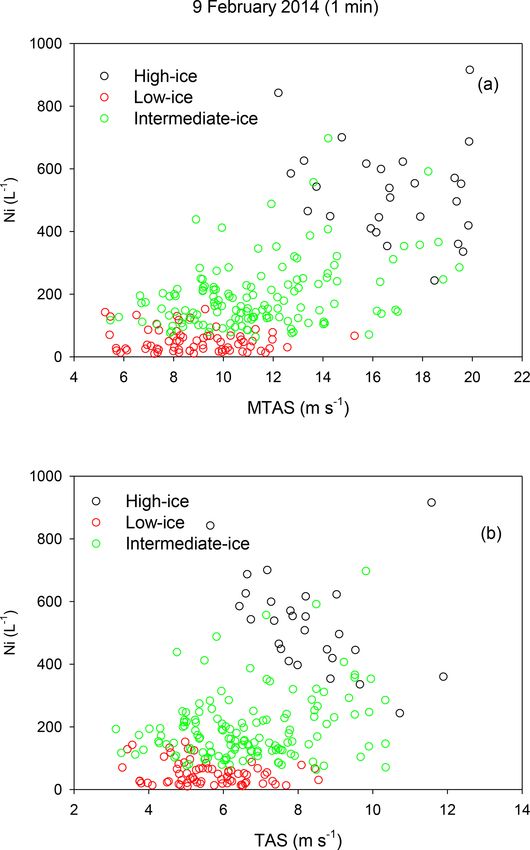
D. H. Lowenthal et al.: Mixed-phase orographic cloud microphysics during StormVEx and IFRACS 5389
Cloud microphysical properties were measured with the
same instruments during StormVEx and IFRACS. The cloud
probes were mounted on a rotating wind vane (to orient them
into the wind) located on the west (upwind) railing of the
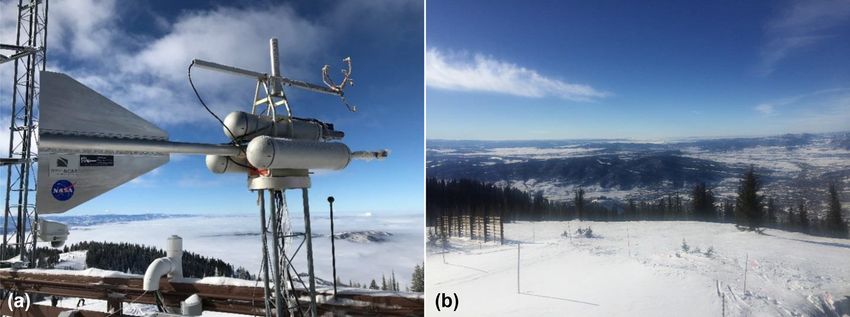
roof approximately 6 m above the snow surface (Fig. 1).
2955
2580
No.i
Cloud droplet number concentrations (CDNCs) and particle
a Cloud Imaging Probe (CIP) concentration from 75 to 200 µm. b CIP concentration ≥ 400 µm. c CIP concentration ≥ 75 µm. d Ice water content. e Cloud droplet number concentration. f Cloud liquid water content.
size distributions (PSDs) from 2 to 47 µm were measured
Table 1. Average of concurrent 1 min CIP and FSSP-100 measurements during StormVEx and IFRACS. The values in parentheses are the coefficients of variation.
Temp.
(◦ C)
−12.8 (22)
−8.2 (44)
with an aspirated Particle Measurement Systems (PMS),
Inc. (Boulder, CO) FSSP-100 forward-scattering spectrom-
eter probe that was electronically modified by Droplet Mea-
surement Technologies (DMT), Inc. (Boulder, CO). Liquid
water content was calculated from the FSSP-100 PSDs. Dur-
(m s−1 )
6.1 30)
6.0 (35)
TASh
ing IFRACS, the FSSP-100 inlet was equipped with a “scarf
tube”, which narrows and accelerates the flow in the sam-
ple volume to 25 m s−1 according to PMS. The air speed at
(µm)
9.2 (22)
10.1 (27)
NMDg
the center of the inlet was measured at 9.4 m s−1 , which cor-
responds to a velocity of 26.7 m s−1 in the sample volume.
The scarf tube was removed during StormVEx such that the
air speed at the inlet should have been the same as that in
FSSP-100
(g m−3 )
0.117 (63)
0.126 (54)
LWCf
the sample volume. Attempts were made to measure the air
speed at the inlet during StormVEx but these were incon-
sistent. Therefore, StormVEx FSSP-100 concentrations were
calculated using the face velocity of 9.4 m s−1 measured dur-
(cm−3 )
211 (54)
199 (73)
CDNCe
ing IFRACS.
g Cloud droplet number-weighted mean diameter. h TAS is the horizontal wind speed. i Number of 1 min observations in the average.
Ice particle PSDs were measured with a DMT Cloud
Imaging Probe (CIP; 25–1600 µm) optical array probe (OAP)
with 64 size channels and a resolution of 25 µm. An array
(g m−3 )
0.090 (118)
0.193 (109)
IWCd
diode is triggered when a particle obscures > 50 % of the
incident laser energy on the diode. During IFRACS, an Ap-
plied Technologies, Inc. (ATI) (Longmont, CO) SATI three-
axis sonic anemometer supplied the wind speed along the
Large/
Ni (%)
3.7
7.2
horizontal axis of the CIP probe. For aircraft measurements,
this is referred to as true air speed (TAS). This terminology is
adopted to refer to horizontal air speed. During StormVEx,
Conc75-200/
Ni (%)
91
83
a Lufft Ventus UMB two-axis sonic anemometer was sub-
stituted for the ATI instrument after 8 February 2011. Data
were collected at 1 Hz. The cloud probes were calibrated and
serviced at DMT prior to each field campaign.
CIP
The 2-D CIP images from StormVEx and IFRACS
95 (132)
141 (142)
Nic
were processed using the Optical Array Shadow Imag-
ing Software (OASIS) program developed at the Univer-
sity of Manchester (Crosier et al., 2011; Lloyd et al., 2015)
and marketed by DMT (http://www.dropletmeasurement.
(L−1 )
2.4 (129)
5.9 (112)
Largeb
com/optical-array-shadow-imaging-software-oasis, last ac-
cess: 15 April 2019). The CIP depth of field was corrected
as a function of particle size (Baumgardner and Korolev,
1997). Ice particle shattering on the probe tips was found to
(L−1 )
88 (116)
123 (146)
Conc75-200a
be insignificant based on particle interarrival time (Field et
al., 2006). This is consistent with relatively low wind speeds
at the surface compared with aircraft speeds (∼ 100 m s−1 ).
Concentrations in the first two CIP channels (nominally
smaller than 62.5 µm) were ignored because of sizing uncer-
StormVEx
IFRACS
tainties (Korolev et al., 1998; Strapp et al., 2001) and be-
cause some of these particles are likely to be cloud droplets
in MPC. The total CIP concentration excluding the first two
www.atmos-chem-phys.net/19/5387/2019/ Atmos. Chem. Phys., 19, 5387–5401, 2019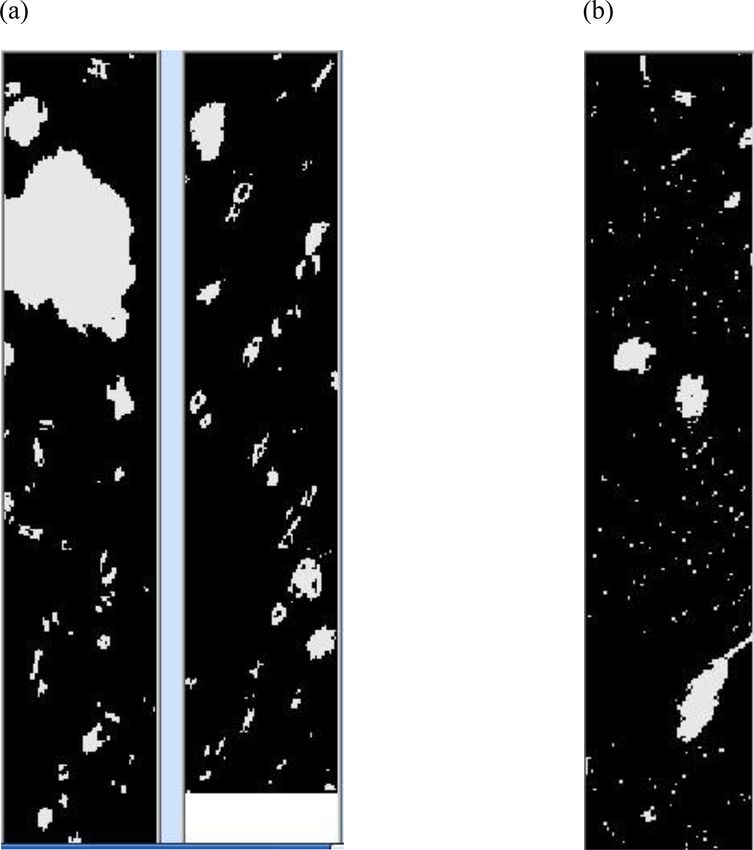
5390                D. H. Lowenthal et al.: Mixed-phase orographic cloud microphysics during StormVEx and IFRACS

Figure 1. Recent picture of SPL probe stand with FSSP-100 in the foreground, Cloud Imaging Probe (CIP) in the background, and sonic
anemometer on top (a); view facing west over the railing (b).

channels is referred to as Ni . The center-in approach, which       and humidity were measured by the SPL weather station.
includes particles that obscure an end diode, was used to           Water vapor concentration and isotopic composition were
identify particles and estimate the sample volume (Heyms-           measured during IFRACS with a Picarro L2130-i water va-
field and Parrish, 1978). Particle size was described as the        por isotopic analyzer (Lowenthal et al., 2016).
area-equivalent diameter, i.e., the diameter of a circle with
the same area as the particle, as determined from the num-
ber of shadowed pixels and the probe resolution. Ice water          3     Results and discussion
content (IWC) was estimated by OASIS using the approach
of Brown and Francis (1995). This estimate is uncertain be-         The full StormVEx program lasted nearly 6 months, from
cause mass-dimensional relationships vary significantly with        November 2010 to April 2011, while IFRACS was designed
ice particle habit, riming extent, aggregation, and tempera-        as a 6-week field project in January and February 2014. Dur-
ture (Mitchell, 1996; Schmitt and Heymsfield, 2010).                ing IFRACS, the Picarro analyzer began collecting data on
   In aircraft studies, the volume of air sampled by cloud          20 January; however, the weather was clear until 27 Jan-
probes is proportional to TAS. At aircraft speeds, particles        uary (Lowenthal et al., 2016). For a consistent comparison
are sampled along the horizontal axes of, and perpendicular         between the two studies, StormVEx data are limited to Jan-
to, the sample area of the cloud probes. This is not neces-         uary and February 2011. Cloud probe measurements were
sarily the case with ground-based sampling, even when the           made on 30 d during StormVEx and 15 d during IFRACS.
probes are mounted on a wind vane such as those used at SPL         Measurement periods during StormVEx were intended for
or JFJ, where cloud probes were mechanically oriented into          comparison with ground-based remote sensing instruments.
the wind based on sonic anemometer measurements (Lloyd              The probes were turned on when it started snowing but were
et al., 2015). If the particle trajectory is not as described       not necessarily turned off if SPL was not in MPC. Measure-
above, the particles can appear misshapen but not necessar-         ments during IFRACS were started only when SPL was in
ily incorrectly sized according to the area-equivalent diame-       MPC to sample liquid and ice for isotopic analysis. While
ter. CIP data used in the following analysis were constrained       there were twice as many sampling days during StormVEx,
as follows: (1) 1 s TAS > 1 and < 20 m s−1 . A lower limit is       the CIP probe measured particles for 101.4 and 77.2 h dur-
needed to ensure that particles traversed the CIP diode array       ing StormVEx and IFRACS, respectively. The 1 s data were
as close to horizontally as possible. Note that the updraft near    averaged to 1 min with a 75 % (at least 45 s) data complete-
the mountain tends to impart a horizontal trajectory on falling     ness requirement. To ensure that the measurements repre-
ice particles (Borys et al., 2000). An upper limit is needed        sented MPC, only seconds when Ni was > 0, LWC was >
to guard against contamination by blowing snow. During              0.01 g m−3 and CDNC was ≥ 10 cm−3 were included. With
StormVEx and IFRACS, snow and supercooled cloud water               these constraints, there were 49.2 and 43 h of concurrent
samples were collected in bags and on cloud sieves (Borys           MPC measurements during StormVEx and IFRACS, respec-
et al., 2000). Such sampling is not practical at wind speeds        tively.
above 15 m s−1 , where snow may blow out of the bags and
the cloud sieves may become overloaded. For the January             3.1    FSSP-100 and CIP particle size distributions
and February period during StormVEx, TAS was > 20 m s−1
during 34 out of 492 995 (0.007 %) 1 s CIP measurements.            Average PSDs calculated from concurrent 1 min average
The corresponding frequency during IFRACS was 3663 out              FSSP-100 and CIP measurements are shown in Fig. 2a and b
of 338 230 (1.1 %). The 5 min average temperature, pressure,        for StormVEx and IFRACS, respectively. The average PSDs
                                                                    were similar in the two studies. Corresponding averages of

Atmos. Chem. Phys., 19, 5387–5401, 2019                                              www.atmos-chem-phys.net/19/5387/2019/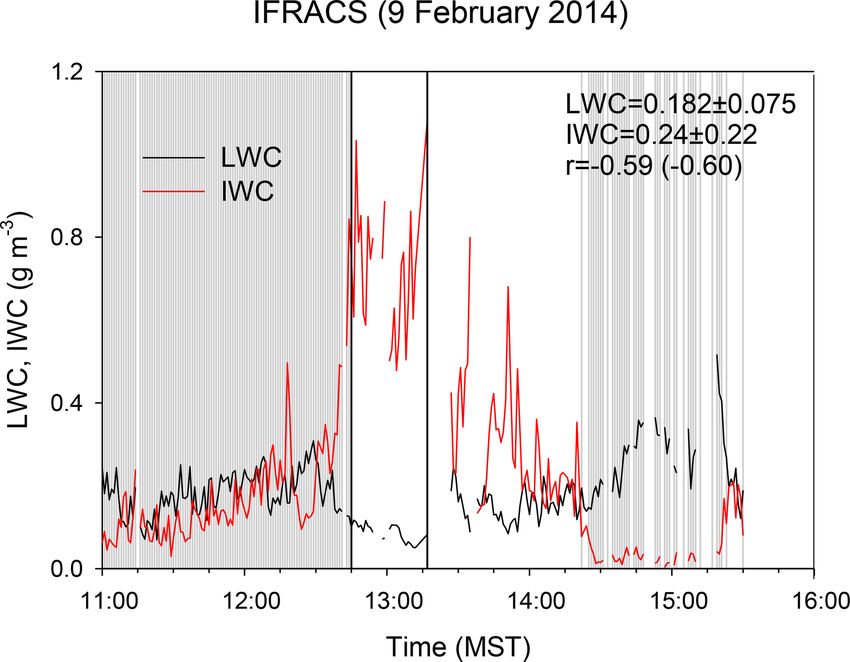
D. H. Lowenthal et al.: Mixed-phase orographic cloud microphysics during StormVEx and IFRACS                               5391

                                                                  IFRACS, respectively. During these periods, average CDNC,
                                                                  LWC, and NMD were similar, i.e., 200 cm−3 , 0.105 g m−3 ,
                                                                  and 9.1 µm, respectively, during StormVEx, and 210 cm−3 ,
                                                                  0.103 g m−3 , and 9.2 µm, respectively, during IFRACS. Av-
                                                                  erage TAS was 6.1 m s−1 during StormVEx and 6.0 m s−1
                                                                  during IFRACS. At an FSSP-100 sampling flow speed of
                                                                  9.4 m s−1 at the inlet and an average TAS of ∼ 6 m s−1 , sam-
                                                                  pling is super-isokinetic, leading to undersampling of larger
                                                                  droplets. Gerber et al. (1999) demonstrated inertial enhance-
                                                                  ment of large drop concentrations in the aspirated FSSP fitted
                                                                  with a flow accelerator (scarf tube). Thus, the loss of large
                                                                  droplets caused by super-isokinetic sampling may have been
                                                                  partially offset by inertial concentration of large droplets by
                                                                  the scarf tube during IFRACS. However, it is difficult to
                                                                  see how undersampling would have totally eliminated large
                                                                  droplets when they were present.
                                                                     Spherical liquid drops and ice particles can be distin-
                                                                  guished with image analysis; however, this is only possi-
                                                                  ble for particles with area-equivalent diameters larger than
                                                                  about 110 µm for the CIP with 25 µm resolution (Crosier
                                                                  et al., 2011). The average of 1 s CIP PSDs in mixed-phase
                                                                  (wet) cases were compared with dry cases when Conc75-
                                                                  200 was > 0 and LWC was 0 (no particles detected by the
                                                                  FSSP-100). Figure 3 shows the ratio of the average of 1 s
                                                                  wet to average dry CIP concentrations as a function of size
                                                                  for StormVEx and IFRACS. In both studies, the ratio was
                                                                  elevated in the first CIP channel only. The ratio decreased
                                                                  significantly and was flat between the third and eighth CIP
                                                                  channels, i.e., Conc75-200. This suggests that, on average,
                                                                  the CIP measurements were only affected by cloud droplets
Figure 2. Average of concurrent 1 min FSSP-100 and CIP particle   in the first CIP channel.
size distributions (PSDs) from StormVEx (a) and IFRACS (b).          Average Conc75-200 was higher under wet than dry con-
                                                                  ditions: 78 versus 49 L−1 during StormVEx and 118 ver-
                                                                  sus 21 L−1 during IFRACS. Average TAS values under wet
1 min CIP and FSSP-100 concentrations are summarized              and dry conditions were similar, i.e., 5.9 and 6.5 m s−1 , re-
in Table 1, which shows that LWC and CDNC were sim-               spectively, during StormVEx and 5.9 and 5.2 m s−1 , respec-
ilar in the two studies. Average IWC during IFRACS was            tively, during IFRACS. The potential impact of ice particles
twice that during StormVEx. Small (75–200 µm, referred to         on FSSP-100 measurements cannot be observed directly with
as Conc75-200) and large (> 400 µm) ice particle concentra-       these instruments. However, the magnitude of the ratio of
tions were also higher during IFRACS. The average LWC             wet/dry concentrations in CIP channel 1 constrains the effect
at SPL was more than an order of magnitude lower than             of ice particles on the FSSP-100 measurements. The relative
LWC observed in the Sierra Nevada (1.5 g m−3 ) and Cascade        fraction of crystals in CIP channel 1 can be estimated from
(2 g m−3 ) mountains, respectively (Lamb et al., 1976; Hobbs,     the ratio of wet/dry in CIP channel 1 to the average of the
1975). The ratios of average Conc75-200 to average Ni were        ratios of wet/dry in CIP channels 3–8, where droplets were
91 % and 83 % during StormVEx and IFRACS, respectively.           absent and where the ratios of wet/dry were constant. These
Based on their coefficients of variation, liquid cloud proper-    values, 2.3 and 6 for StormVEx and IFRACS, respectively,
ties (CDNC and LWC) were much less variable than Conc75-          imply that 43 % (1/2.3) and 16.7 % (1/6) of particles in CIP
200, large ice particles, and Ni at SPL.                          channel 1 were ice crystals during StormVEx and IFRACS,
   While the first CIP channel, nominally 12.5–37.5 µm, lines     respectively. Because of the sizing uncertainty for particles
up with the FSSP-100 PSD at ∼ 25 µm in both studies               which triggered a single diode (CIP channel 1), it is impos-
(Fig. 2), concentrations of FSSP-100 particles larger than        sible to know precisely which FSSP-100 channels were im-
25 µm undershot the CIP PSD during StormVEx, and to               pacted by ice crystals.
a lesser extent, during IFRACS. The FSSP-100 reported                The distributions of Conc75-200, wind speed, and tem-
non-zero concentrations of particles larger than 25 µm for        perature as a function of wind direction during StormVEx
14 % and 56 % of 1 s measurements during StormVEx and             and IFRACS are summarized in Table 2. During StormVEx,

www.atmos-chem-phys.net/19/5387/2019/                                              Atmos. Chem. Phys., 19, 5387–5401, 2019
5392 D. H. Lowenthal et al.: Mixed-phase orographic cloud microphysics during StormVEx and IFRACS
Table 2. Frequency distribution of Conc75-200, wind speed, and temperature as a function of wind direction.
StormVEx IFRACS
Wind Wind Wind
direction Conc75-200 speed Temp.a No.b Conc75-200 speed Temp. No.
(◦ ) (L−1 ) (m s−1 ) (◦ C) (L−1 ) (m s−1 ) (◦ C)
> 0–30 – – – – 27 3.9 −10.6 5
> 180–210 18.2 8.3 −9.3 36 27 4.9 −9.2 114
> 210–240 67 6.0 −10.7 252 56 5.3 −9.9 560
> 240–270 77 6.9 −11.7 420 68 6.1 −6.9 387
> 270–300 91 6.1 −13.5 1728 149 6.5 −8.0 724
> 300–330 66 5.0 −13.2 446 191 6.2 −7.5 590
> 330–360 150 6.2 −11.3 11 165 6.5 −6.7 79
a Temperature based on 5 min average measurements.
b There were 2893/2955 and 2459/2580 1 min measurements when the wind vane was not frozen during StormVEx and IFRACS,
respectively.
mostly all of the NNW (300 to 360◦ ) cases were on 22 Jan- ranges of LWC in Fig. 4 and are plotted in the figures as a
uary 2011. The 5 min average wind direction was exactly the function of LWC. NMD and CDNC increased monotonically
same (351.9◦ ) for 3.5 h. It is not likely that a 5 min average with LWC in both studies. This is consistent with enhanced
value could be the same to a tenth of a degree for two con- growth of droplets as cloud base drops below SPL. However,
secutive 5 min periods, much less 18. During IFRACS, many for CDNC to increase with LWC, either the supersaturation
of the NNW wind directions exhibited the same value for must increase or CCN aerosols must become entrained in the
30 min or more. The reason is that the wind vane can become cloud between cloud base and SPL. Figure 4b and d present
iced by riming and does not move. The data were screened average FSSP-100 PSDs for low (0.05–0.1 g m−3 ) and high
for repeated 5 min wind speeds and these were eliminated. (0.2–0.3 g m−3 ) LWC, corresponding to Fig. 4a and c, re-
This reduced the number of 1 min observations by 2 % and spectively. The distributions are shifted to larger sizes at high
4.7 % during StormVEx and IFRACS, respectively. Winds LWC and the increase in CDNC is evident for droplet sizes
were from the NW sector ∼ 75.3 % and 57 % of the time larger than 10 µm. Note that the shift in the PSDs to larger
during StormVEx and IFRACS, respectively. There was one sizes at high LWC stops at about 35 µm; i.e., the concentra-
5 min period during IFRACS when the wind direction was tion of very large drops is higher at low LWC.
11◦ . High Conc75-200 values were seen in the NW sector in
both studies but the highest concentrations were seen in the 3.3 Relationship between LWC and IWC
NNW sector, albeit at low frequency. When segregated by
wind direction, there was no relationship between Conc75- As noted above with respect to Table 1, liquid cloud micro-
200 and temperature or wind speed in either study. physical properties at SPL were less variable than those of
the ice phase. One reason for this is that the ice phase is
3.2 Supercooled liquid cloud microphysics impacted by processes occurring upwind and at higher alti-
tude. Lowenthal et al. (2011, 2016) estimated that most of the
In non-precipitating warm clouds, an increase in CCN should snow mass was formed within 1 km above SPL. This does not
increase CDNC while decreasing droplet size at constant preclude ice nucleation at higher altitudes, as small, freshly
LWC (Albrecht, 1989). Smaller drops may inhibit collision nucleated crystals contribute little to IWC. Even though rim-
coalescence and precipitation and increase LWC (Zheng et ing occurs, most efficiently for large droplets, it is not ap-
al., 2010). Borys et al. (2000) demonstrated a direct rela- parent from Fig. 2 that the liquid cloud was impacted by
tionship between clear-air-equivalent sulfate concentration (a the ice phase. Indeed, the Pearson and Spearman rank (non-
surrogate for pre-cloud CCN) and CDNC and an inverse re- parametric) correlations between all concurrent 1 min aver-
lationship between CDNC and droplet size (NMD) in MPC age IWC and LWC were only −0.18 and −0.10, respectively,
at SPL. In such clouds, the droplet distribution may be im- during StormVEx and −0.13 and −0.16, respectively, dur-
pacted by riming of ice particles and by transitions between ing IFRACS. The effect of outliers, characteristic of skewed
the liquid and ice phases. Figure 4 presents the relation- distributions, is reduced with the non-parametric statistic.
ship between 1 min droplet NMD and CDNC in MPC during Henceforth, the Spearman rank correlation is displayed in
StormVEx (Fig. 4a) and IFRACS (Fig. 4c). The relationship parenthesis after the Pearson correlation. Scatter plots of
is stronger when the data are stratified by LWC. The aver- IWC versus LWC are shown in Fig. 5a and b for StormVEx
age NMD and CDNC were calculated for each of the four and IFRACS, respectively. The edge in the data suggests that
Atmos. Chem. Phys., 19, 5387–5401, 2019 www.atmos-chem-phys.net/19/5387/2019/D. H. Lowenthal et al.: Mixed-phase orographic cloud microphysics during StormVEx and IFRACS 5393
100 PSDs were calculated for a high-ice period between
12:45 and 13:17 MST (Fig. 6) and for low-ice periods out-
side of that interval with the additional constraint that the
LWC/IWC ratio was greater than 2. These PSDs are pre-
sented in Fig. 7. Figure 8a and b present CIP images from the
high- and low-ice periods, respectively. Note the relatively
higher concentration of “dots” in Fig. 8b (low IWC, high
LWC). These represent cloud droplets that occluded a single
CIP diode. The average IWC and LWC were 0.72 and 0.088
and 0.054 and 0.25 g m−3 for the high- and low-ice periods,
respectively. The average IWC and LWC during the high-
ice periods were 3.7 and 1.98 times higher, respectively, than
the study-wide averages (Table 1). Compared with the low-
ice period, the high-ice FSSP-100 PSD displays a marked
loss of particles with diameters between ∼ 5 and 23 µm. The
corresponding loss of liquid water was 0.181 g m−3 (Fig. 7).
The most obvious explanation is evaporation of droplets
(Wegener–Bergeron–Findeisen process). The loss of LWC
is much lower than the more-than-order-of-magnitude differ-
ence in IWC for the two cases. The high-ice period is char-
acterized by an order of magnitude higher Ni concentration
(525 L−1 ) compared with 50 L−1 during the low-ice period.
The correlation between IWC and Ni was 0.98 (0.98). There
were no relationships between LWC or IWC and either tem-
perature or water vapor concentration, which were relatively
invariant, i.e., −5.4 ± 0.3 ◦ C and 8064 ± 204 ppmv, respec-
tively.
3.4 Liquid-mediated ice production
In this section, the hypothesis that ice production in MPC
at SPL was related to large droplet concentration is exam-
ined. Large droplets are defined as CDNC25-35 with di-
ameters between 25 and 35 µm. Because of the paucity of
CDNC25-35 concentrations > 0 during StormVEx, the anal-
Figure 3. Ratio of average mixed-phase (LWC > 0.01 g m−3 , ysis is confined to IFRACS. The 30 s averages were calcu-
CDNC > 10 cm−3 ) wet to dry (LWC = 0) PSDs for StormVEx (a) lated for periods with CDNC25-35 > 0 and Conc75-200 > 0
and IFRACS (b). using the 75 % data completeness criterion. The relationships
between 30 s average CDNC25-35 and Conc75-200 were ex-
amined under cold (< −8 ◦ C) and warm (> −8 ◦ C) condi-
there were periods when IWC and LWC were more strongly tions. This is intended to distinguish cold and warm primary
anti-correlated. If only days with at least 2 h of valid, 1 min or secondary (e.g., Hallett–Mossop rime splintering) ice pro-
average data are considered, there were 4 out of 11 and 3 out duction processes. Figure 9a and b present relationships for
of 11 d during StormVEx and IFRACS, respectively, where IFRACS under cold and warm conditions, respectively. The
the Pearson and Spearman rank correlations between IWC average temperatures for the cold and warm periods were
and LWC were less than −0.5. −11.2±1.5 and −5.8±0.8 ◦ C, respectively. Figure 9a shows
A sampling day during IFRACS with relatively high aver- a moderate relationship (r = 0.72 [0.73]) between CDNC25-
age IWC (0.23 g m−3 ) and LWC (0.182 g m−3 ) was identified 35 and Conc75-200 at cold temperatures but no relationship
for closer examination. Figure 6 presents time series of 1 min at warm temperatures (r = 0.161 [−0.165]).
average IWC and LWC on 9 February 2014. In this case, Given the relationships between large droplet and small ice
the correlation between IWC and LWC was −0.59 (−0.60), crystal concentrations, is the temperature range at SPL con-
suggesting interaction between the ice and liquid phases. sistent with immersion and/or contact freezing? This appears
The minimum 1 min average LWC was 0.05 g m−3 and there to be the case at colder temperatures (< −8 ◦ C) at SPL for
were no “dry” (LWC = 0) 1 s sample periods on this day. contact freezing, as seen in Figs. 7 and 13 in Ladino Moreno
To contrast periods with high and low IWC, average FSSP- et al. (2013) and for immersion freezing, particularly for bi-
www.atmos-chem-phys.net/19/5387/2019/ Atmos. Chem. Phys., 19, 5387–5401, 20195394 D. H. Lowenthal et al.: Mixed-phase orographic cloud microphysics during StormVEx and IFRACS
Figure 4. Relationships among 1 min average mean cloud droplet diameter (NMD) and concentration (CDNC), segregated by liquid water
content (LWC, g m−3 ), as shown by colors in the legend, during StormVEx (a) and IFRACS (c). Corresponding average PSDs for low
(0.01–0.05 g m−3 ) and high (0.2–0.3 g m−3 ) LWC are shown in panels (b) and (d). The error bars in panels (b) and (d) are standard errors.
ological INPs (Levin and Yankofsky, 1983; Du et al., 2017; the Colorado Airborne Multiphase Cloud Study (CAMPS)
Kanji et al., 2017). The lack of a relationship at warm temper- when the aircraft was in the vicinity of SPL. Concentra-
atures would appear to preclude secondary ice formation by tions were considerably higher at SPL when the maximum
the Hallett–Mossop process. As noted above, the FSSP-100 wind speed associated with 5 min average measurements was
cannot distinguish liquid droplets from ice crystals. It is pos- above about 4 m s−1 . This was attributed to blowing snow.
sible that the relationship between CDNC25-35 and Conc75- However, a valid comparison between aircraft and surface
200 represents an autocorrelation between two segments of measurements depends on the assumption that both plat-
the ice crystal distribution. Two factors argue against this: forms measure the same ice crystal population. This would
(1) Fig. 3 suggests that ice particles are 6 times more preva- require establishing crystal trajectories from a point upwind
lent than droplets in the large droplet size range; and (2) the aloft to a point downwind at the surface. Even if a direct link
relationship does not exist at > −8 ◦ C. Higher-resolution in- between the PSDs aloft and at the surface could be demon-
struments, such as the holographic imagers used by Beals et strated, the falling crystal PSD is likely to be modified by
al. (2015) and Beck et al. (2018), should be used to address depositional growth at ice supersaturation in the low-level
this issue. liquid cloud, riming and aggregation, or sublimation in sub-
saturated regions. Beck et al. (2018) reported a large increase
3.5 Blowing snow in Ni when the maximum wind speed increased from 14–16
to ≥ 16 m s−1 at the Sonnblick Observatory in Rauris, Aus-
Blowing snow can cause significant artifacts in ice crystal tria, when winds were from the south.
measurements at surface locations. Rogers and Vali (1987) Figure 10a plots the 1 s maximum TAS (MTAS) during
found higher ice crystal concentrations at the Elk Mountain a 1 min period and the corresponding 1 min average TAS
Observatory compared with those observed aloft on the Uni- (Fig. 10b) against 1 min average Ni for high-ice, low-ice,
versity of Wyoming Queen Air but discounted blowing snow and all other (intermediate-ice) periods on 9 February 2014.
as the explanation for this difference. Lloyd et al. (2015) MTAS was highly correlated with TAS [0.90 (0.90] over the
concluded that high ice crystal concentrations at JFJ were course of the day. The highest Ni values correspond to the
not caused by blowing snow. Geerts et al. (2015) compared highest MTAS (and TAS), and vice versa. Average MTAS
CIP concentrations (≥ 75 µm) at SPL with those measured was 16.6 ± 2.4, 8.9 ± 2.0, and 11.3 ± 2.8 m s−1 during high-,
aboard the University of Wyoming King Air (UWKA) during low-, and intermediate-ice periods, respectively. This could
Atmos. Chem. Phys., 19, 5387–5401, 2019 www.atmos-chem-phys.net/19/5387/2019/D. H. Lowenthal et al.: Mixed-phase orographic cloud microphysics during StormVEx and IFRACS 5395
Figure 6. Time series of LWC and IWC on 9 February 2014 during
IFRACS. The high-ice period is from 12:45 to 13:17 MST. The low-
ice periods are indicated by the shaded areas.
Figure 5. Relationships between LWC and IWC during
StormVEx (a) and IFRACS (b).
Figure 7. Average PSDs for high-ice (12:45–13:17 MST) and
low-ice (< 12:45 or > 13:17 MST and LWC/IWC > 2) periods in
imply that high Ni resulted from blowing snow when the Fig. 6. The values in the middle of the plot are the differences be-
winds were higher in the early afternoon. However, con- tween the high (red) and low (black) cumulative LWC in the three
trary to results reported by Beck et al. (2018), there was no sections of the distributions defined by the vertical dotted lines. The
step function in Ni corresponding to a threshold in MTAS. error bars are standard errors.
Further, there appears to be an inverse relationship between
1 min MTAS and 1 min Ni , especially for the high- and low-
ice regimes. Beck et al. (2018) noted that a correlation be- MTAS and Ni were actually negative under high- and low-ice
tween MTAS and blowing snow could be reduced if the av- conditions. These results are not consistent with the blowing
eraging time was too long or obscured because of an (indeter- snow hypothesis.
minate) lag between the arrival of the gust and the particles Examining all available data, Table 3 presents average
that may have been lofted by it. Beck et al. (2018) suggested Conc75-200 over ranges of TAS during StormVEx and
using an averaging time of 10–15 s. Figure 11 plots 15 s av- IFRACS. Conc75-200 increases monotonically, if not lin-
erage (using the 75 % data completeness criterion) MTAS early, with TAS in both studies. If it is assumed that smaller
against Ni for the high-ice, low-ice, and intermediate-ice pe- crystals should be lofted more efficiently from the snow sur-
riods on 9 February 2014. Figure 11 shows that while both face and remain suspended farther downwind than larger
MTAS and Ni varied considerably in each case, there was no ones (Schmidt Jr., 1982), blowing snow should result in a
apparent wind speed threshold and the correlations between relative enrichment of small crystals in the CIP PSD, inde-
www.atmos-chem-phys.net/19/5387/2019/ Atmos. Chem. Phys., 19, 5387–5401, 20195396 D. H. Lowenthal et al.: Mixed-phase orographic cloud microphysics during StormVEx and IFRACS
Figure 8. CIP images from 9 February 2014: (a) 13:12:19 MST,
high-ice and low-LWC, and (b) 12:29:09 MST, low-ice and high-
LWC periods. The vertical bars contain all of the images sampled
in 1 s. The width of each bar corresponds to 1600 µm.
Table 3. Relationships between TAS and small ice crystal concen-
trations (Conc75-200) during StormVEx and IFRACS. r is the Pear- Figure 9. Relationships between 30 s average concentrations of
son (Spearman rank) correlation. large cloud droplets (CDNC25-35) and small ice crystals (Conc75-
200) during IFRACS under cold conditions (< 8 ◦ C) and warm
(> 8 ◦ C) conditions. The number of observations and the Pearson
StormVEx IFRACS
(Spearman rank) correlations are shown.
TAS Conc75-200 No. Conc75-200 No.
(m s−1 ) (L−1 ) (L−1 )
trations of Conc75-200 at high and low wind speeds, which
1–3 39 51 46 110
are factors of 4.5 and 6.5 during StormVEx and IFRACS,
3–5 51 928 49 801
respectively (Table 3). They also do not explain the large
5–8 84 1463 112 1258
8–12 175 513 301 382 differences between surface and aircraft measurements ob-
12–16 – – 616 29 served by Rogers and Vali (1987) and Geerts et al. (2015).
r 0.38 (0.36) 0.54 (0.47) Correlation of wind speed with crystal concentrations does
not necessarily imply blowing snow. In mountain clouds, ice
crystal concentrations vary with synoptic and orographic dy-
namics. Stronger uplift nucleates more crystals upwind and
pendent of absolute concentration. Average 1 min CIP PSDs above the mountain barrier as droplets continue to grow and
were calculated, normalized to average Ni , and expressed as temperatures decrease (e.g., Neiman et al., 2002; Stoelinga
percentages. These are presented for high (8–12 m s−1 ) and et al., 2013). The correlations between 1 min average TAS
low (1–3 m s−1 ) TAS in Fig. 12. During StormVEx, Conc75- and vertical velocity were 0.75 (0.72) and 0.66 (0.67) during
200 was 83 % and 93 % of Ni at low and high TAS, re- StormVEx and IFRACS, respectively.
spectively. The corresponding percentages during IFRACS
were 79 % and 87 %, respectively. The relative enrichments 3.6 Secondary ice production
of Conc75-200 at high TAS, i.e., 10 % and 8 %, during
StormVEx and IFRACS, respectively, are consistent with Secondary ice production (SIP) mechanisms have been ex-
expectations for blowing snow. However, these percentages tensively reviewed (e.g., Field et al., 2017). Sullivan et
cannot explain the large differences in the absolute concen- al. (2018) modeled SIP by rime splintering, droplet shatter-
Atmos. Chem. Phys., 19, 5387–5401, 2019 www.atmos-chem-phys.net/19/5387/2019/D. H. Lowenthal et al.: Mixed-phase orographic cloud microphysics during StormVEx and IFRACS 5397
Figure 11. Relationships between 15 s average Ni and MTAS
for high-ice (a), low-ice (b), and intermediate-ice (c) periods on
Figure 10. Relationships between maximum 1 s TAS (MTAS) (a) 9 February 2014.
and 1 min average TAS (b) and Ni for high-ice, low-ice, and
intermediate-ice (all other 1 min periods) periods on 9 Febru-
ary 2014.
at SPL, leaving no undisturbed icy surface to accumulate
frost. Rime splintering (Hallett–Mossop) is thought to oc-
cur at temperatures above −8 ◦ C. During StormVEx, average
ing, and collisional breakup. Rangno and Hobbs (2001) con- Conc75-200 was 13.6 and 89 L−1 at temperatures warmer
cluded that shattering of large droplets (> 50 µm) upon freez- than −8 ◦ C and colder than −12 ◦ C, respectively. The cor-
ing could have accounted for high observed ice particle con- responding average TAS values were 5.8 and 5.2 m s−1 , re-
centrations in Arctic stratus. While there is no evidence of spectively. During IFRACS, average Conc75-200 was 95 and
droplets this large at SPL, they could be present upwind and 116 L−1 at temperatures warmer than −8 ◦ C and colder than
above SPL. Keppas et al. (2017) concluded that rime splin- −12 ◦ C, respectively. The corresponding average TAS values
tering occurred in warm (−6 to 0 ◦ C) frontal clouds. Lollie- were 6.1 and 4.9 m s−1 , respectively. While rime splintering
shaped crystals were taken as evidence of riming of columnar may have occurred, it was not the dominant ice formation
crystals by droplets larger than 100 µm. Neither ice lollies nor mechanism.
droplets this large have been observed in MPC at SPL. Lloyd
et al. (2015) considered blowing snow, rime splintering, and
detachment of surface frost (Bacon et al., 1998) as sources 4 Conclusions
of high ice particle concentrations at JFJ. They ultimately fa-
vored the latter process, albeit with no direct evidence. There Studies of orographic MPCs were conducted at SPL in north-
is also no evidence regarding surface frost splinters at SPL. western Colorado in January and February during StormVEx
Snow was continually falling during measurement periods (2011) and IFRACS (2014). In total, the data represent ∼
www.atmos-chem-phys.net/19/5387/2019/ Atmos. Chem. Phys., 19, 5387–5401, 20195398 D. H. Lowenthal et al.: Mixed-phase orographic cloud microphysics during StormVEx and IFRACS
hanced activation or entrainment of CCN below SPL. Fu-
ture studies at SPL would benefit from direct measurement
of cloud base height. There was a weak relationship be-
tween LWC and IWC for all data (the correlation was −0.18
(−0.10) and −0.13 (−0.16) during StormVEx and IFRACS,
respectively); however, a stronger inverse relationship was
evident on several days during each study. This was demon-
strated for a case on 9 February 2014, where the correlation
between IWC and LWC was −0.59 (−0.60). During a pe-
riod of maximum IWC on this day, the droplet PSD showed
a significant loss of liquid water and a decrease in droplet
concentration compared to periods with low IWC and high
LWC. As there was an order of magnitude increase in the
ice crystal concentration (Ni ) between the high- and low-ice
periods, the loss of LWC was likely due to crystal growth
at the expense of evaporating droplets (Wegener–Bergeron–
Findeisen process).
A relationship between large cloud droplets (CDNC25-35)
and small ice crystals (Conc75-200) during IFRACS sug-
gests that droplet freezing (contact or immersion) was in-
volved in ice production at SPL. This relationship was only
evident at temperatures below −8 ◦ C. There was no evi-
dence that secondary ice production mechanisms such as
rime splintering, large droplet freezing, or frost splintering
influenced Conc75-200 at SPL. It is unclear how these pro-
cesses could have produced the observed correlation between
large droplet and small ice crystal concentrations. Blowing
snow can significantly impact surface ice crystal concentra-
tions and has been invoked to explain large differences be-
tween surface and aircraft ice crystal measurements. The po-
tential effect of blowing snow on ice crystal measurements
at SPL was evaluated from two perspectives. On 9 Febru-
ary 2014, during IFRACS, 1 min average Ni increased with
both 1 min average TAS and the 1 s maximum TAS (MTAS),
Figure 12. Averages of 1 min relative (% of Ni ) CIP PSDs at low although there was no threshold wind speed or step func-
(1–3 m s−1 ) and high (8–12 m s−1 ) TAS during StormVEx (a) and
tion in Ni . However, during high-ice and low-ice periods,
IFRACS (b). Average TAS values are shown in parentheses.
there was an inverse correlation between 15 s average Ni
and MTAS over a wide range of MTAS. This is not con-
sistent with blowing snow. For the entire data set, Ni also
92 h when SPL was immersed in supercooled liquid cloud increased with wind speed. To test the hypothesis that this
and it was snowing. On average, liquid cloud PSDs, CDNC, was caused by blowing snow, it was assumed that blowing
NMD, and LWC were similar between years, while Ni snow should preferentially enhance the relative abundance
and IWC were 48 % and 114 % higher, respectively, during of small crystals (Conc75-200) in the CIP PSD. Comparison
IFRACS. Average wind speeds were similar (∼ 6 m s−1 ) in of the relative (expressed as percentages of Ni ) ice crystal
both studies, while average temperatures were colder during PSDs at high (8–12 m s−1 ) and low (1–3 m s−1 ) TAS showed
StormVEx (−12.8 ◦ C) than IFRACS (−8.2 ◦ C). Supercooled that Conc75-200 was enriched by 8 %–10 % at higher TAS.
liquid cloud properties at SPL were consistent between the However, this level of enrichment cannot explain the factor
two studies. The microphysical properties of ice particles of 4.5–6.5 higher Conc75-200 at high TAS at SPL or pre-
were more variable as they depend on the structure of the viously reported orders of magnitude differences between
cloud above and upstream of SPL. surface and aircraft measurements. Stronger dynamics, es-
The inverse relationship between cloud droplet size pecially orographic and/or convective uplift, also contribute
(NMD) and concentration (CDNC) is related to CCN at SPL to ice production upwind and above the mountain. It is pos-
(Borys et al., 2000). This relationship is stronger when the sible that both primary production and blowing snow were
data are stratified by LWC. Both CDNC and NMD increase active at SPL. These results highlight the need for targeted
with increasing LWC, demonstrating droplet growth and en- experiments to quantify the contributions of blowing snow
Atmos. Chem. Phys., 19, 5387–5401, 2019 www.atmos-chem-phys.net/19/5387/2019/D. H. Lowenthal et al.: Mixed-phase orographic cloud microphysics during StormVEx and IFRACS 5399
to ice crystal concentrations at mountaintop locations. They References
also demonstrate the limitations of instrumentation such as
the FSSP-100 and CIP (2-D optical array probe) for distin- Albrecht, B. A.: Aerosols, cloud microphysics, and
guishing liquid droplets from small ice crystals in mixed- fractional cloudiness, Science, 245, 1227–1230,
https://doi.org/10.1126/science.245.4923.1227, 1989.
phase clouds. Higher-resolution instruments are required for
Bacon, N. J., Swanson, B. D., Baker, M. B., and Davis, E. J.:
this purpose. Breakup of levitated frost particles. J. Geophys. Res., 103,
13763–13775, https://doi.org/10.1029/98JD01162, 1998.
Baumgardner, D. and Korolev, A.: Airspeed corrections for
Data availability. Data are available at https://www.dri.edu/ optical array probe sample volumes, J. Atmos. Ocean.
doug-lowenthal-research-reviews, last access: 15 April 2019. Tech., 14, 1224–1229, https://doi.org/10.1175/1520-
0426(1997)0142.0.CO;2, 1997.
Beals, M. J., Fugal, J. P., Shaw, R. A., Lu, J., Spuler, S. M.,
Author contributions. DHL is Professor Emeritus at DRI, was the and Stith, J. L.: Holographic measurements of inhomogeneous
principal investigator on IFRACS, worked on the IFRACS field ex- cloud mixing at the centimeter scale, Science, 350, 87–89,
periment, analyzed the StormVEx and IFRACS data, and produced https://doi.org/10.1126/science.aab0751, 2015.
the first draft and subsequent revisions of the manuscript and the re- Beck, A., Henneberger, J., Fugal, J. P., David, R. O., Lacher,
sponses to the reviewers. AGH is the director of the Desert Research L., and Lohmann, U.: Impact of surface and near-surface pro-
Institute’s Storm Peak Laboratory, was a principal investigator on cesses on ice crystal concentrations measured at mountain-
StormVEx and co-principal investigator on IFRACS, contributed to top research stations, Atmos. Chem. Phys., 18, 8909–8927,
the first draft and subsequent revisions of the manuscript, and pro- https://doi.org/10.5194/acp-18-8909-2018, 2018.
vided input on the responses to the reviewers. ROD was a graduate Borys, R. D. and Wetzel, M. A.: Storm Peak Lab-
student at DRI who worked on the IFRACS field experiment, used oratory: a research, teaching, and service facil-
the results in his Master’s thesis, contributed to the first draft and ity for the atmospheric sciences, B. Am. Meteorol.
subsequent revisions of the manuscript, and provided input on the Soc., 78, 2115–2123, https://doi.org/10.1175/1520-
responses to the reviewers. IBM is the site manager at Storm Peak 0477(1997)0782.0.CO;2, 1997.
Laboratory, supervised the StormVEx and IFRACS field programs, Borys, R. D., Lowenthal, D. H., and Mitchell, D. L.: The relation-
and participated in the StormVEx and IFRACS field experiments. ships among cloud microphysics, chemistry, and precipitation
RDB is Professor Emeritus at DRI, participated in the IFRACS field rate in cold mountain clouds, Atmos. Environ., 34, 2593–2602,
experiment, and provided input to the first draft of the manuscript. https://doi.org/10.1016/S1352-2310(99)00492-6, 2000.
GGM was a principal investigator on StormVEx and provided input Borys, R. D., Lowenthal, D. H., Cohn, S. A., and Brown, W. O.
to the first draft of the manuscript. J.: Mountaintop and radar measurements of aerosol effects on
snow growth and snowfall rate, Geophys. Res. Lett., 30, 1538,
https://doi.org/10.1029/2002GL016855, 2003.
Competing interests. The authors declare that they have no conflict Brown, P. R. A. and Francis, P. N.: Improved measurements of
of interest. the ice water-content in cirrus using a total-water probe, J. At-
mos. Ocean. Tech., 12, 410–414, https://doi.org/10.1175/1520-
0426(1995)0122.0.CO;2, 1995.
Acknowledgements. This work was supported by Department Crosier, J., Bower, K. N., Choularton, T. W., Westbrook, C. D., Con-
of Energy Atmospheric System Research Program grant DE- nolly, P. J., Cui, Z. Q., Crawford, I. P., Capes, G. L., Coe, H.,
SC0014304 and by National Science Foundation Division of At- Dorsey, J. R., Williams, P. I., Illingworth, A. J., Gallagher, M. W.,
mospheric Sciences grant AGS-1260462. Logistical assistance from and Blyth, A. M.: Observations of ice multiplication in a weakly
the Steamboat Ski and Resort Corporation is greatly appreci- convective cell embedded in supercooled mid-level stratus, At-
ated. The Desert Research Institute is an equal opportunity ser- mos. Chem. Phys., 11, 257–273, https://doi.org/10.5194/acp-11-
vice provider and employer and is a permittee of the Medicine 257-2011, 2011.
Bow–Routt National Forests. We would especially like to thank de Boer, G., Morrison, H., Shupe, M. D., and Hildner, R.: Evi-
and acknowledge the hard work of many people who made the dence of liquid dependent ice nucleation in high-latitude strat-
StormVEx project possible, including the many DOE ATSC and iform clouds from surface remote sensors, Geophys. Res. Lett.,
ASR staff, Storm Peak Laboratory (SPL) local volunteers, the 38, L01803, https://doi.org/10.1029/2010GL046016, 2011.
Steamboat Ski and Resort Corporation, the US Forest Service, the Diehl, K., Simmel, M., and Wurzler, S.: Numerical sensi-
Grand Junction National Weather Service office, and all of the grad- tivity studies on the impact of aerosol properties and
uate students (Betsy Berry, Stewart Evans, Ben Hillman, Will Mace, drop freezing modes on the glaciation, microphysics,
Clint Schmidt, Carolyn Stwertka, Adam Varble, and Christy Wall), and dynamics of clouds, J. Geophys. Res., 111, D07202,
who put considerable effort into data collection. https://doi.org/10.1029/2005JD005884, 2006.
Du, R., Du, P., Lu, Z., Ren, W., Liang, Z., Qin, S., Li, Z., Wang,
Y., and Fu, P.: Evidence for a missing source of efficient ice nu-
clei, Sci. Rep.-UK, 7, 39673, https://doi.org/10.1038/srep39673,
Review statement. This paper was edited by Ottmar Möhler and re-
2017.
viewed by two anonymous referees.
Field, P. R., Heymsfield, A. J., and Bansemer, A.: Shat-
tering and particle interarrival times measured by opti-
www.atmos-chem-phys.net/19/5387/2019/ Atmos. Chem. Phys., 19, 5387–5401, 20195400 D. H. Lowenthal et al.: Mixed-phase orographic cloud microphysics during StormVEx and IFRACS cal array probes, J. Atmos. Ocean. Tech., 23, 1357–1371, Ocean. Tech., 15, 708–720, https://doi.org/10.1175/1520- https://doi.org/10.1175/JTECH1922.1, 2006. 0426(1998)0152.0.CO;2, 1998. Field, P. R., Lawson, R. P., Brown, P. R. A., Lloyd, G., West- Ladino Moreno, L. A., Stetzer, O., and Lohmann, U.: Contact freez- brook, C., Moisseev, D., Miltenberger, A., Nenes, A., Blyth, A., ing: a review of experimental studies, Atmos. Chem. Phys., 13, Choularton, T., Connolly, P., Buehl, J., Crosier, J., Cui, Z., Dear- 9745–9769, https://doi.org/10.5194/acp-13-9745-2013, 2013. den, C., DeMott, P., Flossmann, A., Heymsfield, A., Huang, Y., Lamb, D., Nielsen, K. W., Klieforth, H. E., and Hal- Kalesse, H., Kanji, Z. A., Korolev, A., Kirchgaessner, A., Lasher- lett, J.: Measurement of liquid water content in Trapp, S., Leisner, T., McFarquhar, G., Phillips, V., Stith, J., and cloud systems over the Sierra Nevada, J. Appl. Me- Sullivan, S.: Secondary ice production: current state of the sci- teorol., 15, 763–775, https://doi.org/10.1175/1520- ence and recommendations for the future, Meteorological Mono- 0450(1976)0152.0.CO;2, 1976. graphs, 58, 7.20, https://doi.org/10.1175/AMSMONOGRAPHS- Lance, S., Shupe, M. D., Feingold, G., Brock, C. A., Cozic, J., Hol- D-16-0014.1, 2017. loway, J. S., Moore, R. H., Nenes, A., Schwarz, J. P., Spackman, Geerts, B., Pokharel, B., and Kristocich, D. A. R.: Blowing J. R., Froyd, K. D., Murphy, D. M., Brioude, J., Cooper, O. R., snow as a natural glaciogenic cloud seeding mechanism, Mon. Stohl, A., and Burkhart, J. F.: Cloud condensation nuclei as a Weather Rev., 143, 5017–5033, https://doi.org/10.1175/MWR- modulator of ice processes in Arctic mixed-phase clouds, At- D-15-0241.1, 2015. mos. Chem. Phys., 11, 8003–8015, https://doi.org/10.5194/acp- Gerber, H., Frick, G., and Rodi, A. R.: Ground-based FSSP 11-8003-2011, 2011. and PVM measurements of liquid water content, J. Atmos. Levin, Z. and Yankofsky, S. A.: Contact versus immersion freezing Ocean. Tech., 16, 1143–1149, https://doi.org/10.1175/1520- of freely suspended droplets by bacterial ice nuclei, J. Appl. Me- 0426(1999)0162.0.CO;2, 1999. teorol. Climatol., 22, 1964–1966, https://doi.org/10.1175/1520- Hallett, J. and Mossop, S. C.: Production of secondary 0450(1983)0222.0.CO;2, 1983. particles during the riming process, Nature, 249, 26–28, Lloyd, G., Choularton, T. W., Bower, K. N., Gallagher, M. W., https://doi.org/10.1038/249026a0, 1974. Connolly, P. J., Flynn, M., Farrington, R., Crosier, J., Sch- Heymsfield, A. and Parrish, J. L.: A computational tech- lenczek, O., Fugal, J., and Henneberger, J.: The origins of nique for increasing the effective sampling volume of ice crystals measured in mixed-phase clouds at the high- the PMS 2-D particle size spectrometer, J. Appl. Me- alpine site Jungfraujoch, Atmos. Chem. Phys., 15, 12953–12969, teorol., 17, 1566–1572, https://doi.org/10.1175/1520- https://doi.org/10.5194/acp-15-12953-2015, 2015. 0450(1978)0172.0.CO;2, 1978. Lohmann, U. and Diehl, K.: Sensitivity studies of the impor- Hobbs, P. V.: The nature of winter clouds and precipita- tance of dust ice nuclei for the indirect aerosol effect on tion in the Cascade Mountains and their modification stratiform mixed-phase clouds, J. Atmos. Sci., 63, 968–982, by artificial seeding: Part I. Natural conditions, J. Appl. https://doi.org/10.1175/JAS3662.1, 2006. Meteorol., 14, 783–804, https://doi.org/10.1175/1520- Lowenthal, D. H., Borys, R. D., and Wetzel, M. A.: 0450(1975)0142.0.CO;2, 1975. Aerosol distributions and cloud interactions at a Hobbs, P. V. and Rangno, A. L.: Ice particle concentration in clouds, mountaintop laboratory, J. Geophys. Res., 107, 4345, J. Atmos. Sci., 42, 2523–2549, https://doi.org/10.1175/1520- https://doi.org/10.1029/2001JD002046, 2002. 0469(1985)0422.0.CO;2, 1985. Lowenthal, D. H., Borys, R. D., Cotton, W., Saleeby, S., Hoose, C. and Möhler, O.: Heterogeneous ice nucleation Cohn, S. A., and Brown, W. O. J.: The altitude of on atmospheric aerosols: a review of results from labo- snow growth by riming and vapor deposition in mixed- ratory experiments, Atmos. Chem. Phys., 12, 9817–9854, phase orographic clouds, Atmos. Environ., 45, 519–522, https://doi.org/10.5194/acp-12-9817-2012, 2012. https://doi.org/10.1016/j.atmosenv.2010.09.061, 2011. Kanji, Z. A., Ladino, L. A., Wex, H., Boose, Y., Burkert- Lowenthal, D. H., Hallar, A. G., McCubbin, I., David, R., Bo- Kohn, M., Cziczo, D. J., and Kramer, M.: Overview of rys, R., Blossey, P., Muehlbauer, A., Kuang, Z., and Moore, M.: ice nucleating particles, Meteorological Monographs, 58, Isotopic fractionation in wintertime orographic clouds. I: iso- 1.1–1.33, https://doi.org/10.1175/AMSMONOGRAPHS-D-16- topic measurements, J. Atmos. Ocean. Tech., 33, 2663–2678, 0006.1, 2017. https://doi.org/10.1175/JTECH-D-15-0233.1, 2016. Keppas, S. C., Crosier, J., Choularton, T. W., and Bower, Mace, J., Matrosov, S., Shupe, M., Lawson, P., Hallar, G., K. N.: Ice lollies: An ice particle generated in super- McCubbin, I., Marchand, R., Orr, B., Coulter, R., Sed- cooled conveyor belts, Geophys. Res. Lett., 44, 5222–5230, lacek, A., Avallone, L., and Long, C.: StormVEx: The https://doi.org/10.1002/2017GL073441, 2017. Storm Peak Lab Cloud Property Validation Experiment science Knopf, D. A. and Alpert, P. A.: A water activity based model and operations plan, U.S. Department of Energy Tech Rep. of heterogeneous ice nucleation kinetics for freezing of water DOE/SCARM-10-021, 45 pp., available at: https://www.arm. and aqueous solution droplets, Faraday Discuss., 165, 513–534, gov/publications/programdocs/doe-sc-arm-10-021.pdf (last ac- https://doi.org/10.1039/c3fd00035d, 2013. cess: 7 August 2018), 2010. Knopf, D. A., Alpert, P. A., and Wang, B.: The role Matrosov, S. Y., Mace, G. G., Marchand, R., Shupe, M. D., Hallar, of organic aerosol in atmospheric ice nucleation: A. G., and McCubbin, I. B.: Observations of ice crystal habits a review, ACS Earth Space Chem., 2, 168–202, with a scanning polarimetric W-band radar at slant linear de- https://doi.org/10.1021/acsearthspacechem.7b00120, 2018. polarization ratio mode, J. Atmos. Ocean. Tech., 29, 989–1008, Korolev, A., Strapp, J., and Isaac, G.: Evaluation of the https://doi.org/10.1175/jtech-d-11-00131.1, 2012. accuracy of PMS Optical Array Probes, J. Atmos. Atmos. Chem. Phys., 19, 5387–5401, 2019 www.atmos-chem-phys.net/19/5387/2019/
You can also read