Physical properties of shallow ice cores from Antarctic and sub-Antarctic islands - The Cryosphere
←
→
Page content transcription
If your browser does not render page correctly, please read the page content below
The Cryosphere, 15, 1173–1186, 2021
https://doi.org/10.5194/tc-15-1173-2021
© Author(s) 2021. This work is distributed under
the Creative Commons Attribution 4.0 License.

Physical properties of shallow ice cores from Antarctic
and sub-Antarctic islands
Elizabeth Ruth Thomas1 , Guisella Gacitúa2 , Joel B. Pedro3,4 , Amy Constance Faith King1 , Bradley Markle5 ,
Mariusz Potocki6,7 , and Dorothea Elisabeth Moser1,8
1 British  Antarctic Survey, Ice Dynamics and Paleoclimate, Cambridge, CB3 0ET, UK
2 Centro   de Investigación Gaia Antártica, Universidad de Magallanes, Punta Arenas, Chile
3 Australian Antarctic Division, Kingston, 7050, Australia
4 Australian Antarctic Programme Partnership, Hobart, Tasmania 7001, Australia
5 California Institute of Technology, Pasadena, CA 91125, USA
6 Climate Change Institute, University of Maine, Orono, ME 04469, USA
7 School of Earth and Climate Sciences, University of Maine, Orono, ME 04469, USA
8 Institut für Geologie und Paläontologie, University of Münster, 48149 Münster, Germany

Correspondence: Elizabeth Ruth Thomas (lith@bas.ac.uk)

Received: 18 April 2020 – Discussion started: 24 June 2020
Revised: 14 January 2021 – Accepted: 18 January 2021 – Published: 3 March 2021

Abstract. The sub-Antarctic is one of the most data-sparse          the bottom ages of a 100 m ice core drilled on Peter 1 Island
regions on earth. A number of glaciated Antarctic and sub-          would reach ∼ 1856 CE and ∼ 1874 CE at Young Island.
Antarctic islands have the potential to provide unique ice
core records of past climate, atmospheric circulation, and
sea ice. However, very little is known about the glaciol-
ogy of these remote islands or their vulnerability to warm-         1   Introduction
ing atmospheric temperature. Here we present melt his-
tories and density profiles from shallow ice (firn) cores           The sub-Antarctic region sits at the interface of polar and
(14 to 24 m) drilled on three sub-Antarctic islands and             mid-latitude climate regimes, making it highly sensitive to
two Antarctic coastal domes. Additionally, complementary            shifting climate over time. However, the sub-Antarctic and
ground-penetrating radar (GPR) data were collected to fur-          the Southern Ocean region is one of the most data-sparse re-
ther characterize each site and assess the spatial distribution     gions on earth. A recent compilation of climate data spanning
of the observed melt layers. This study includes the first ever     the 20th century revealed that of the 692 records that exist
firn cores from Bouvet Island (54◦ 250 1900 S, 03◦ 230 2700 E)      globally (Emile-Geay et al., 2017), none are available for the
in the South Atlantic, from Peter I Island (68◦ 510 0500 S,         Southern Ocean. The vast expanse of open water makes cli-
90◦ 300 3500 W) in the Bellingshausen Sea, and from Young           mate and palaeoclimate observations difficult, but a number
Island (66◦ 310 4400 S, 162◦ 330 2100 E) in the Ross Sea sector’s   of glaciated sub-Antarctic islands (SAIs; defined here as is-
Balleny island chain. Despite their sub-Antarctic location,         lands south of the Southern Ocean polar front) may be suit-
surface melt is low at most sites (melt layers account for          able for extracting palaeoclimate information from ice cores
∼ 10 % of total core), with undisturbed ice layers in the up-       (Fig. 1).
per ∼ 40 m, suggesting minimal impact of meltwater perco-              Many of these SAIs sit within the westerly wind belt and
lation. The exception is Young Island, where melt layers ac-        the transitional sea ice zone (Fig. 1). Westerly winds drive
count for 47 % of the firn core. Surface snow densities range       ocean upwelling and basal melt of Antarctic ice shelves
from 0.47 to 0.52 kg m−3 , with close-off depths ranging from       (Favier et al., 2014; Joughin et al., 2014), and the 20th-
21 to 51 m. Based on the measured density, we estimate that         century increase in Antarctic snowfall has been attributed to
                                                                    changes in their circulation (Medley and Thomas, 2019). Sea

Published by Copernicus Publications on behalf of the European Geosciences Union.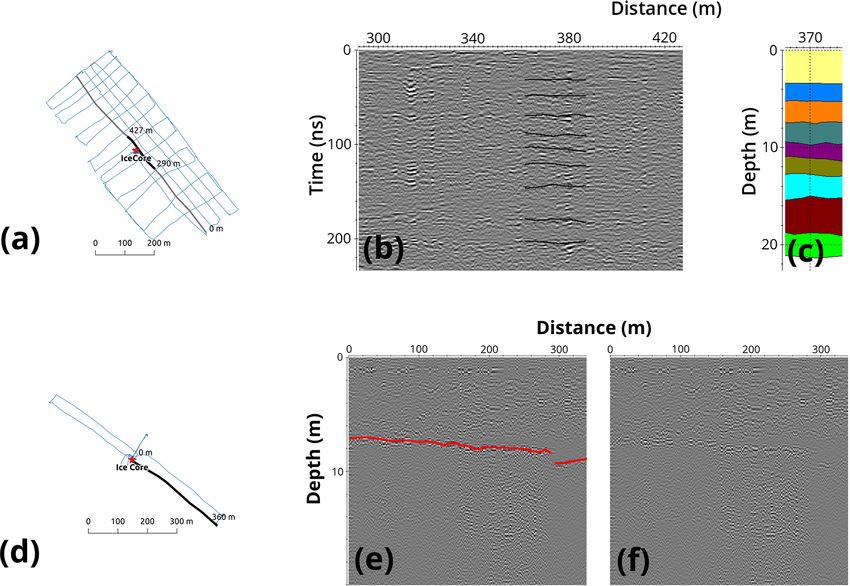
1174                                                                E. R. Thomas et al.: Physical properties of shallow ice cores

Figure 1. Map of subICE ice core locations (stars), with insert maps of each site. Overlain on mean summer surface temperatures (coloured
contours) from ERA-5 (1979–2017). Location of the maximum (blue) and minimum (purple) sea ice extent (from the National Snow and
Ice Data Centre, NSIDC, 1981–2017) and the polar front (black). (a) Bouvet Island (image credit: Google Earth). (b) Peter I Island and
(c) Mount Siple (images from Sentinel-2 Copernicus data). (d) Map of Mertz Glacier, showing the location of the two ice cores from Cape
Hurley and Fisher Bay and (e) Young Island (Landsat image courtesy of the US Geological Survey, USGS). All contours derived from the
TanDEM-X 90 m digital elevation model (DEM).

ice modulates the earth’s albedo and governs the area avail-           rently the most prolific of the three, with a number of records
able for exchange of heat and CO2 between the ocean and                retrieved on the New Zealand SAIs up to 12 000 years old
the atmosphere. However, records of both westerly winds                (McGlone, 2002) and on Crozet and South Georgia up to
and sea ice are short, with major uncertainty in the trends            6000 and 11 000 years old, respectively (Van der Putten et al.,
prior to the satellite era (i.e. pre-1970s). SAIs on the very          2012). One limitation is that annual layers are not preserved
margin of maximum winter sea ice extent could potentially              in such records, and carbon dating carries with it uncertain-
identify local-scale changes in sea ice rather than rely on            ties in the decadal to centennial range, which complicates the
ice core records from the Antarctic continent, which record            identification of annual- to decadal-scale climate variations
mostly ocean-sector-scale trends (Thomas and Abram, 2016;              and the precise timing of climate shifts (Van der Putten et al.,
Thomas et al., 2019). An ice core from Bouvet Island, pre-             2012). Peat deposits are also lacking on the more southerly
sented in this study, has already proven successful in recon-          SAIs.
structing past sea ice variability in the adjacent ocean (King            Lake sediments are similarly useful for studying vegeta-
et al., 2019).                                                         tion composition on the SAIs. These are related to a wide
   Palaeoclimate records do exist on some SAIs from lake               range of environmental parameters within and around the
sediments, peat cores, and ice cores. Peat records are cur-            lake used to reconstruct past natural variability (Saunders et

The Cryosphere, 15, 1173–1186, 2021                                                        https://doi.org/10.5194/tc-15-1173-2021
E. R. Thomas et al.: Physical properties of shallow ice cores                                                                 1175

al., 2008). Diatom and geochemical proxies from Marion Is-        to the ice core laboratories at the British Antarctic Survey
land have been used to track the migration of westerly winds      (BAS).
over the past 700 years (Perren et al., 2020). A novel proxy,
based on sea salt aerosols in lake sediments on Macquarie Is-     2.1.1   Bouvet Island (Bouvetøya)
land, reconstructed past westerly wind strength over the past
12 300 years (Saunders et al., 2018). However, damage from        A 14 m firn core was drilled from the volcanic island of Bou-
introduced rabbits at this site has compromised the data dur-     vet in the central South Atlantic (54◦ 250 1900 S, 03◦ 230 2700 E;
ing the last ∼ 100 years.                                         50 km2 ), also known as Bouvetøya (Fig. 1a). This was the
   Ice core records offer complementary archives to peat and      most northerly site, but the island’s location within the polar
lake archives on glaciated or ice-capped islands and are in       front (Fig. 1) classifies it as sub-Antarctic.
some cases unique records of where peat and lake deposits            Bouvet is almost entirely ice-covered (∼ 50 km2 ) except
are not available. Shallow ice cores have been drilled from       for a few rocky outcrops around the coast. Ice flows down
low-elevation plateaus and glacial termini on South Geor-         the flanks of the volcano, with no visible crevassing, giving
gia, the largest glaciated SAI. The estimated age of the ice at   way to shear ice cliffs and near-vertical icefalls into the sea.
bedrock for the glacial termini sites is between 8000–12 000      The island is the southernmost extension of the mid-Atlantic
years old (Mayewski et al., 2016). However, surface temper-       ridge, located at the triple junction between the African,
atures on South Georgia have risen by ∼ 1 ◦ C during the 20th     South American, and Antarctic plates. These pronounced sea
century (Whitehead et al., 2008), and 97 % of the 103 coastal     floor features drive the cold Antarctic Circumpolar Current
glaciers have retreated since the 1950s (Cook et al., 2010).      close to the island, keeping surface temperature cold and al-
Thus, the valuable palaeoclimate archive contained in South       lowing sea ice to extend north of the island.
Georgia and potentially the other SAI glaciers may be at risk        The last known volcanic eruption on Bouvet was 50 BCE;
from surface melt.                                                however, visible ash and dust layers suggest eruptions may be
   The sub-Antarctic Ice Core drilling Expedition (subICE)        more frequent. At several locations, the ice edge has broken
was part of the international Antarctic Circumnavigation Ex-      vertically away (Fig. S1), revealing horizontal bands of clean
pedition (ACE) 2017–2018 (Walton, 2018), which offered an         and dirty layers in the vertical stratigraphy. The island’s re-
exceptional opportunity to access multiple SAIs. In this study    mote location and absence of significant local dust sources
we present the density profiles, melt histories, and ground-      suggest a local volcanic source from either Bouvet or the
penetrating radar (GPR) data collected during subICE. These       South Sandwich Islands. The 3.5 km wide Wilhelmplataet
include the first-ever firn core records from three of the        caldera appears entirely ice-filled. This potentially offers the
glaciated Antarctic islands and SAIs in the Pacific and South     deepest coring location; however, it is unclear if this is in-
Atlantic sector of the Southern Ocean, together with two con-     stead an ice bridge formed since the last eruption.
tinental firn cores collected from coastal domes in East and
West Antarctica. The aim of this study is to (1) evaluate the     2.1.2   Peter I Island
firn conditions and internal layering in the upper ice column,
                                                                  A 12 m firn core was drilled from Peter I Island (68◦ 510 0500 S,
(2) determine the extent of surface melt and the potential im-
                                                                  90◦ 300 3500 W), in the Bellingshausen Sea (Fig. 1b). The for-
pact on proxy preservation, and (3) estimate potential bottom
                                                                  mer shield volcano (154 km2 ) is almost completely covered
ages for future deep-drilling expeditions.
                                                                  by a heavily crevassed ice cap and sits within the seasonal
                                                                  sea ice zone. The core was drilled on a ridge (Midtryggen) at
                                                                  730 m a.s.l., in a small saddle on the eastern side of the island
2     Methods and data                                            overlooking the main glacier Storfallet.

                                                                  2.1.3   Mount Siple
2.1    Firn cores
                                                                  A 24 m firn core was drilled on Mount Siple (73◦ 430 S,
Six firn cores were drilled as part of subICE, between Jan-       126◦ 660 W) on the Amundsen Sea coast, West Antarctica
uary and March 2017 (Table 1). The teams were deployed            (Fig. 1c). Mount Siple is an active shield volcano rising to
to the sites via helicopter from the ship Akademik Tryosh-        3110 m a.s.l. at its peak from Siple Island on the coast of
nikov, allowing between 3 and 8 hours of drilling time, de-       Marie Byrd Land, surrounded by the Getz Ice Shelf. The core
pendent on weather conditions and logistical capability. The      was drilled at 685 m a.s.l.
firn cores were drilled using a Mark III Kovacs hand auger
with sidewinder winch and power head, retrieving sections         2.1.4   Young Island
of approximately 70 cm in length. The firn was measured,
placed inside pre-cut lay-flat tubing, and packed in insulated    A 17 m firn core was drilled on Young Island (66◦ 170 S,
ice core storage boxes for transportation. During the voyage,     162◦ 250 E), the northernmost island in the Balleny island
the ice was stored in a −25 ◦ C freezer and later transported     chain (245 km2 ), off the coast of Adélie Land (Fig. 1d).

https://doi.org/10.5194/tc-15-1173-2021                                                 The Cryosphere, 15, 1173–1186, 2021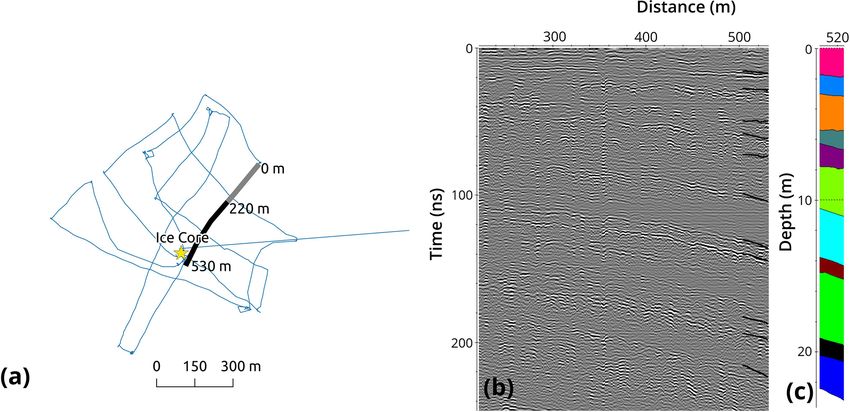
1176                                                                          E. R. Thomas et al.: Physical properties of shallow ice cores

Table 1. Site metadata for the subICE cores. Measured GPS location, elevation of ice core, and ice core borehole depth. Annual average
P −E, annual average temperature (maximum monthly temperature in brackets) from ERA-5 (1979–2017) at 2 m elevation and corrected for
ice core elevation (using a lapse rate of 0.68◦ /100 m). Where available the maximum recorded automatic weather station (AWS) temperature
is shown at the AWS elevation and corrected for ice core elevations, with years of operation in brackets.

    Site              Latitude              Longitude         Elevation    ERA-5       ERA-5 annual average     AWS max recorded temperature
    name                                                           (m)     annual     (max) temperature (◦ C)        (◦ C) during years
                                                                          average                                       of operation
                                                                          P −E              2m      Elevation             AWS       Elevation
                                                                                                    corrected                       corrected
    Bouvet            54◦ 250 1900 S        03◦ 230 2700 E         350       0.72       −0.5            −2.9    8.8 (1997–2005)           6.7
                                                                                      (2−0.1)
    Peter I           68◦ 510 0500 S        90◦ 300 3500 W         730       0.56          −4.6        −9.5          7.1 (2006)           3.0
                                                                                           (1.3)      (−3.7)
    Mt Siple          73◦ 190 1400 S        126◦ 390 4700 W        685       0.82          −9.6       −14.2     5.5 (1992–2015)           2.4
                                                                                          (−0.3)      (−5.0)
    Young             66◦ 310 4400 S        162 330 2100 E         238       0.81          −7.6        −9.2     4.2 (1991–1997)           2.8
                                                                                           (0.6)      (−1.0)
    Mertz             67◦ 330 3400 S        145◦ 180 4500 E        320       0.54         −15.2       −17.4                 NA            NA
                                                                                          (−1.1)      (−6.3)
    Mertz fast        67◦ 260 2800 S        145◦ 340 2800 E          6       0.66         −14.5           n/a               NA            NA
    ice                                                                                   (−0.8)

  n/a: not applicable. NA: not available.

The Balleny Islands comprise three major dormant vol-                               found impact on local sea ice conditions and the formation
canic islands – Young, Buckle, and Sturge (Hatherton et                             of dense shelf water (Campagne et al., 2015).
al., 1965) – which sit in the Antarctic seasonal sea ice
zone at the boundary of the polar westerlies and Antarctic                          2.2    Firn core analysis
coastal easterlies. Young Island is characterized by a thick
ice cover, marine-terminating piedmont-glacier tongues, and                         Firn core analysis was carried out in the −20 ◦ C cold lab-
steep coastal cliffs and is therefore described as “among                           oratories at BAS. The section length, diameter, and weight
the most inaccessible places in the world” (Hatherton et al.,                       were measured to provide a density and the visible melt lay-
1965). The core was drilled at 238 m a.s.l.                                         ers logged and measured (only layers > 1 mm).

                                                                                    2.3    Ground-penetrating radar
2.1.5    Adélie Land coast (Mertz)
                                                                                    GPR measurements were performed around each firn core
Two firn cores were drilled on the coast of Adélie Land                             site. We used a SIR3000 unit equipped with a 400 MHz cen-
in East Antarctica (Fig. 1e); a 20 m core (Mertz 1) from                            tral frequency antenna (GSSI Inc.). The system was pulled
Cape Hurley, a low-elevation ice dome on the eastern side                           on a sledge while walking in parallel and transversal lines
of the Mertz Glacier (67◦ 330 S, 145◦ 180 E), and a 9 m firn                        of 100 to 500 m, depending on the site surface conditions
core (Mertz fast ice) drilled on a triangular wedge of fast ice                     and available time at each site. The penetration depth of the
in Fisher Bay (67◦ 260 S, 145◦ 340 E), bounded on the east by                       propagated wave is strongly controlled by the electrical prop-
the Mertz Glacier and on the west by the AAE (Australian                            erties of the subsurface combined with the central frequency
Antarctic Expedition) glacier.                                                      of the system. The equipment used provides a good compen-
   The Mertz Glacier extends into the ocean from coastal                            sation between these parameters in polar snow. Vertical res-
King George V Land, with a floating ice tongue. The tongue                          olution is approximately 0.35 m, reaching up to 100 m depth
traps pack ice upstream, forming the Mertz Glacier polynya                          in very dry snow (ideal conditions), such as in the Antarc-
along its western flank during winter, the third-most produc-                       tic Plateau (Spikes et al., 2004). However, the resolution and
tive polynya in Antarctica (Lacarra et al., 2014). In 2010, the                     maximum reachable depth are expected to decrease dramat-
impact from the B9B iceberg caused this tongue to calve off,                        ically at lower latitudes. This GPR was intended to obtain
producing an ∼ 80 km long iceberg. This event had a pro-                            data from the near surface (up to 40 m) to complement the

The Cryosphere, 15, 1173–1186, 2021                                                                    https://doi.org/10.5194/tc-15-1173-2021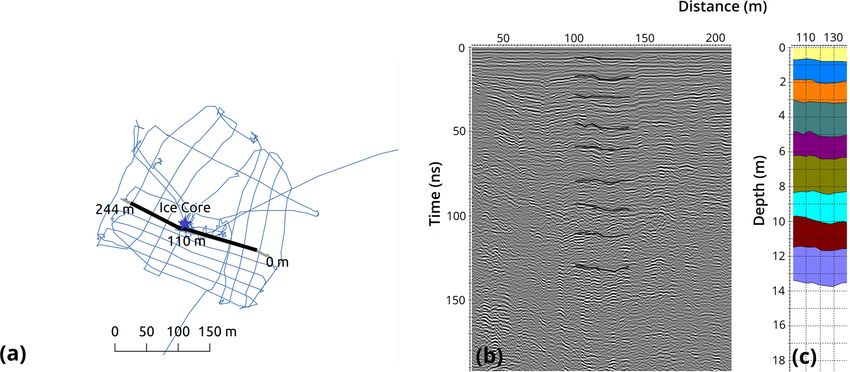
E. R. Thomas et al.: Physical properties of shallow ice cores                                                                 1177

firn core observations and to better characterize the stratigra-   temperature at the drilling sites. This value is observed on the
phy of each site.                                                  western Antarctic Peninsula (Martin and Peel., 1978), where
    The data collected (radargram) represent the number of         the climate and maritime conditions are expected to closely
traces received (x axis) and the two-way travel time of the        resemble those of the SAIs.
wave in nanoseconds (ns) (y axis), which is the time the sig-
nal takes from the transmitter to the receiver when reflected
from the internal ice discontinuities (melt layers). During        3     Results
data collection the maximum time window was set to a value
between 400–600 ns, according to the expected maximum              3.1     GPR
depth of signal propagation at the SAI sites. GPR data were
monitored in situ for calibration and stored. Data process-        Given the scope of this paper, one example of a representa-
ing was done using a commercial software (ReflexW) and             tive profile taken near the firn core is shown in the following
included removal of repetitive traces (same position), correc-     section. Figures 2–5 show (a) a reference map of the track of
tion of the surface position and distance covered, frequency       measurements, (b) a section of the radargram, and (c) the es-
filters, gain function adjustments, stacking, and other visual     timated depth (up to 20 m) of the picked layers considering
enhancements to improve the interpretation of the reflecting       the variations in the propagation velocity given the density
layers. Each collected file was analysed independently and         profile.
layers picked manually in full resolution. If layers were not
                                                                   3.1.1    Bouvet Island
sufficiently clear and continuous, they were not picked.
    We used the density profile (see Sect. 3.3) of the firn
                                                                   GPR data obtained at Bouvet Island generally show layers of
core to obtain dielectric values through depth, based on the
                                                                   accumulated snow. The reference map (Fig. 2a) shows the se-
Looyenga model (Looyenga, 1965), and estimated the wave
                                                                   lected profile (grey line) descending from 357 to 339 m a.s.l.
velocity variations and corresponding depth of the layers.
                                                                   towards the south-east. Figure 2b shows the interpreted lay-
                                                                   ers observed near the firn-core-extraction site. The estimated
2.4   Meteorological data
                                                                   depth of the layers shows that there is about 2 m of contin-
                                                                   uous horizontal layering of snow. Below this layer, there is
Meteorological data come from the European Centre for
                                                                   stratified firn that has been eroded by the effect of wind and
Medium-Range Weather Forecasts (ECMWF) ERA-5 anal-
                                                                   the surface slope, reaching a layer of solid ice at 15 m from
ysis (1979–2017) (Copernicus Climate Change Service,
                                                                   the surface. Another layer is detected at 36 m depth, which
2017), the fifth generation of ECMWF reanalysis. ERA-5
                                                                   is interpreted as the bedrock. This depth is consistent with
reanalysis currently extends back to 1979, providing hourly
                                                                   the estimated ice thickness observed from the ice cliffs to
data at 0.25◦ resolution (∼ 31 km). Annual average precip-
                                                                   the south of the firn core-drilling site (Fig. S1). Ice thickness
itation minus evaporation (P − E) and maximum monthly
                                                                   from the photograph is estimated relative to the expected size
temperatures (1979–2017) are presented in Table 1. We note
                                                                   of the observed fur seals on the beach.
that the resolution of ERA-5 is currently unable to capture
local climate conditions on the SAIs; however, a recent study      3.1.2    Peter I Island
from the Antarctic Peninsula confirmed its high accuracy in
representing the magnitude of and variability in near-surface      Snow surface at the Peter I site was smooth (maximum 5◦
air temperature and wind regimes (Tetzner et al., 2019).           slope). Internal layers were only (and partially) traceable for
   Limited in situ meteorological observations are available       the upper ∼ 25 m of the snow or firn pack. The maximum
from the University of Wisconsin-Madison Antarctic Mete-           time window was set to reach an estimated depth of ∼ 43 m
orology programme, and the Norwegian Polar Institute auto-         (Table 2), and bedrock was not detected. Figure 3a shows
matic weather station (AWS) data are available from Bouvet         the track of measurements performed at the Peter I Island
Island (April 1997–December 2005), Peter I Island (Septem-         site, and the profile shown (Fig. 3b) is a section of the line
ber 2006–January 2007; not complete), Mount Siple (Jan-            (grey line), taken at increasing elevation from 718 m a.s.l. up
uary 1992–January 2015), and Young Island (January 1991–           to 726 m a.s.l. in a north-westerly direction. Figure 3c shows
December 1997).                                                    that the estimated depth for the stratified layers of snow in
   The 2 m temperature from ERA-5 (Fig. 1) and the AWS             the upper 14 m was mostly continuous.
sites (typically at low elevations) are expected to be warmer
than the firn core-drilling locations as a result of the adia-     3.1.3    Mount Siple
batic rate of temperature change for vertically moving air.
This lapse rate varies with both temperature and mixing ra-        The surface of the studied area at the Mount Siple site was
tio, from a dry rate of 0.98◦ /100 m to a saturated rate of        relatively smooth (max 4◦ slope). Figure 4a shows the length
0.44◦ /100 m at 20 ◦ C (Martin and Peel., 1978). As a best         and position of a full profile taken in a south-westerly direc-
guess, we use a lapse rate of 0.68◦ /100 m to calculate the        tion, taken in an south-westerly direction rising from 678 to

https://doi.org/10.5194/tc-15-1173-2021                                                   The Cryosphere, 15, 1173–1186, 2021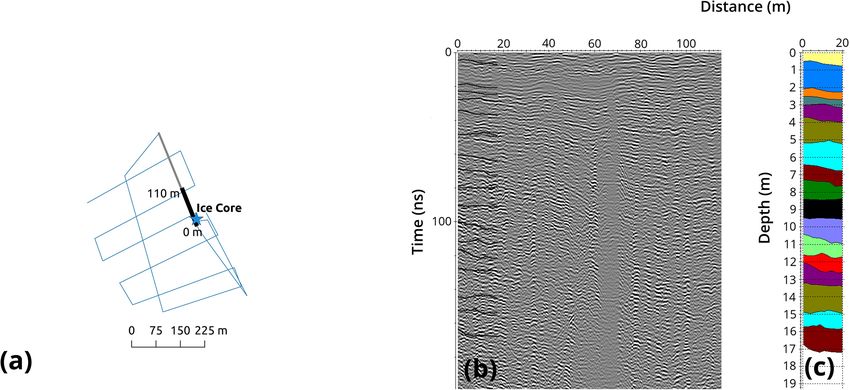
1178 E. R. Thomas et al.: Physical properties of shallow ice cores
Figure 2. Bouvet GPR. (a) Reference map depicts the full track of measurements (blue), the profile (grey), and the section shown in the
radargram (black). (b) Radargram obtained in a south-easterly direction (downward) from 346 to 329 m a.s.l., shown with layer interpretation
and (c) estimated depth of layers.
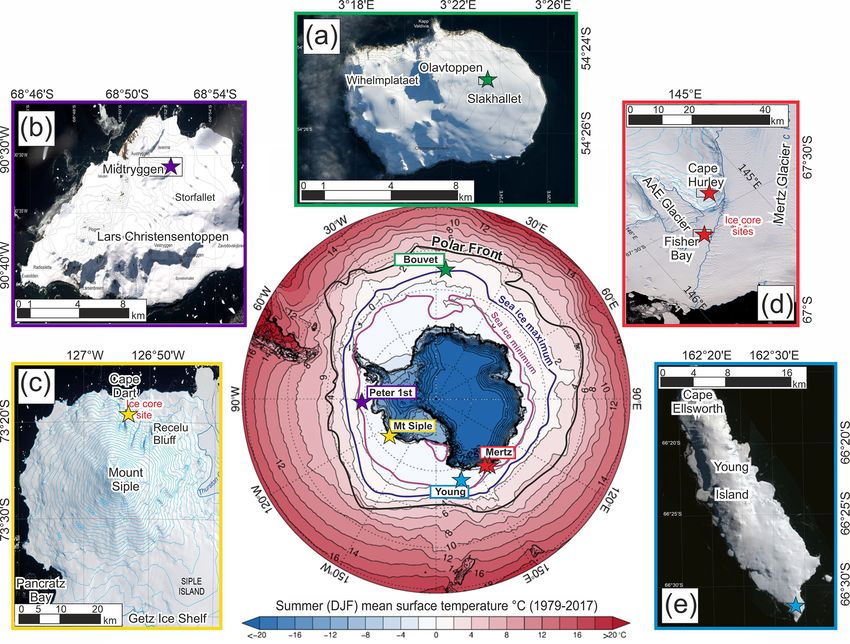
Figure 3. Peter I GPR. (a) Reference map depicts the full track of measurements (blue), the profile (grey), and the section shown in the
radargram (black). (b) Section of a radargram taken in an east-westerly direction with layer interpretation and (c) estimated depth of layers.
685 m a.s.l., and ending at the firn-core-extraction position. guished in the upper ∼7 m of snow and only reflected weakly
Figure 4b shows the selected section where clear layering can beneath this depth; 11 distinct but discontinuous layers were
be observed for the upper 20 m, with smooth depth variation identified down to a depth of 62 m (bedrock was not de-
through the profile length. Bedrock was not detected. tected). We estimated this to be the approximate limit of sig-
nal propagation of the GPR system at this site. Figure 6a–c
3.1.4 Young Island show a section of a profile taken in a north-westerly direction
and the interpretation of layer depth in the upper 20 m near
The Young Island site surface was flat with a compact snow. the firn core extraction.
The maximum estimated depth of detected layers was ∼ 36 m Data quality for the Mertz fast-ice site was very poor
(Table 2), and bedrock was not detected. Figure 5b shows a (Fig. 6d–e). A single continuous layer at 6.8 m depth was
section of a selected profile taken in a north-westerly direc- the only one identified.
tion starting at the firn-core-extraction position; here multiple
layers can be identified, but they are discontinuous, and the
3.2 Melt records
small distance between layers resulted in merging; thus they
are not traceable through the full profile length.
Given their location, we expect all sites to experience some
3.1.5 Adélie Land coast (Mertz) degree of surface melt. The elevation-corrected temperature
for each SAI is compared with the 2 m temperature and
The Mertz 1 site (Cape Hurley) had a flat surface, consistent uncorrected AWS temperature in Table 1. Surprisingly, the
with observed internal layering. Layers could not be distin- site least affected by melt is Bouvet, the warmest and most
The Cryosphere, 15, 1173–1186, 2021 https://doi.org/10.5194/tc-15-1173-2021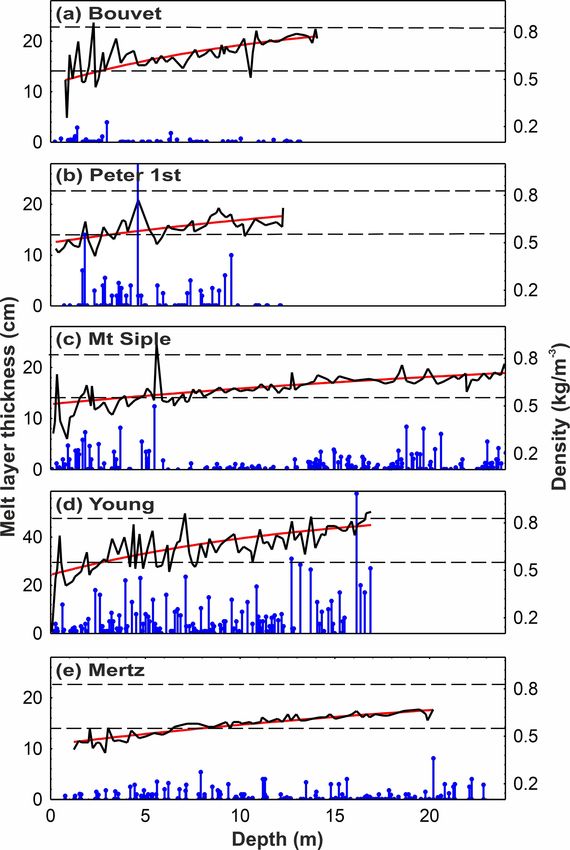
E. R. Thomas et al.: Physical properties of shallow ice cores                                                                                        1179

Table 2. Wave velocity and maximum depth detected from the GPR. Frequency (number of layers per metre), percentage (of whole core),
average, and maximum layer thickness measured in the ice cores.

                                                 GPR                                                        Ice core
           Site name             Wave velocity          Max depth           Melt frequency (m−1 )        Average thickness   Maximum thickness
                                       (m/ns)          detected (m)                and percentage                     (cm)                (cm)
           Bouvet                            0.19                    40                 5.26 (1.6 %)                   0.3                   4.0
           Peter I                           0.20                    43                  6.02 (11 %)                   1.8                  30.0
           Mt Siple                          0.20                    36                  7.66 (10 %)                   1.3                  12.4
           Young                             0.20                    36                  7.44 (47 %)                   6.4                  58.0
           Mertz 1                           0.20                    63                   5.26 (6 %)                   1.0                   8.1
           Mertz fast ice                    0.21                   6.8                4.58 (0.3 %)∗                   0.1                   0.3
         ∗ Melt layers in the Mertz fast-ice core were only measured in the top three bags (0–2.4 m).

Figure 4. Mount Siple GPR. (a) Reference map depicts the full track of measurements (blue), the profile (grey), and the section shown in
the radargram (black). (b) Radargram ending at the position of the ice core extraction (star) shown with layer interpretation and (c) estimated
depth of layers.

northerly location. Despite its northerly location, the aver-                              gle layer of 58 cm. The annual average temperature from this
age yearly temperature from ERA-5 (elevation-corrected) is                                 site is −9.2 ◦ C, (ERA-5 1979–2017), with a maximum AWS
−2.9 ◦ C, with a maximum monthly temperature of −0.9 ◦ C.                                  temperature of 2.8 ◦ C (February 1997). Melt layers occur
The maximum value recorded by the AWS at 42 m a.s.l. was                                   throughout the profile but with the greatest density between
6.7 ◦ C (1997–2005, elevation-corrected). The average melt                                 5–5.5 m and below 11 m depth. Most melt layers consist of
layer thickness in the Bouvet core is 0.3 cm, observed at a                                bubbly ice, with a minority of thinner layers that are bubble-
frequency of five layers per metre, with the largest measured                              free or exhibit large crystals. We note that the visual method
melt layer just 3.95 cm (Table 2).                                                         of determining melt layers is not sufficient to determine if the
   The coldest site is Mertz Glacier, with an annual average                               large layers result from individual melt events or are formed
temperature (ERA-5 elevation-corrected) of −17.4 ◦ C. The                                  from a sequence of smaller events.
percentage of melt at this site is just 6 %, with a maximum
layer thickness of 8.1 cm. The melt layer thickness at the                                 3.3     Relationship between GPR horizons and firn core
Mertz fast-ice site appears to be lower; however, this only                                        melt layers
reflects visible melt layers in the top 2.2 m.
   Average melt layer thickness at Peter I Island is compa-
                                                                                           In order to explore the spatial extent of melt surrounding the
rable to that of Mount Siple, with melt percentage of 11 %
                                                                                           firn core sites, we compare the firn core melt records with the
and 10 %, respectively, reflecting the similar summer tem-
                                                                                           GPR horizons. However, the melt observations from the firn
peratures, −5.1 ◦ C at Peter I and −5.2 ◦ C at Mount Siple.
                                                                                           core have a resolution of 1 mm, while the 400 MHz antenna
   The site most affected by melt is Young Island, which has
                                                                                           provides a range of visibility of ∼ 35 cm for the dielectric-
frequent melt layers averaging 6.57 cm and the largest sin-
                                                                                           permittivity values at these firn conditions (Koppenjan, 2009;

https://doi.org/10.5194/tc-15-1173-2021                                                                          The Cryosphere, 15, 1173–1186, 2021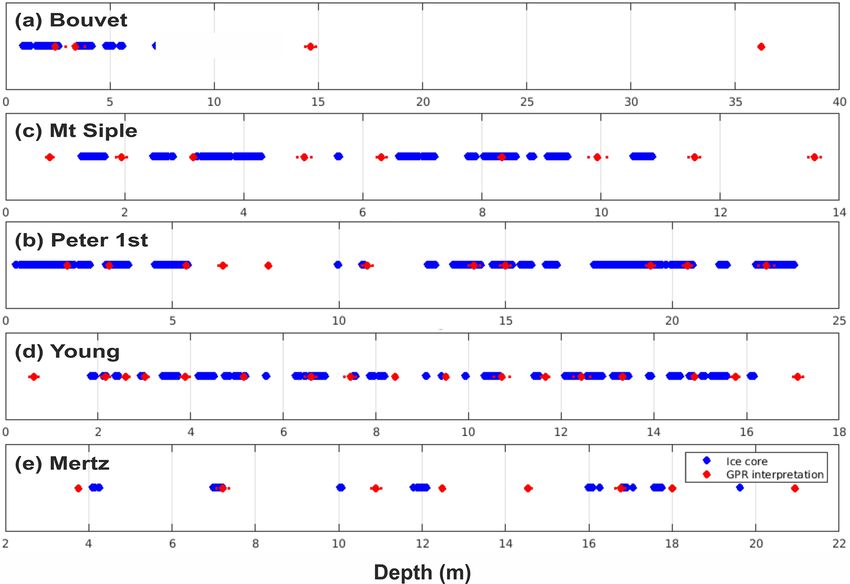
1180 E. R. Thomas et al.: Physical properties of shallow ice cores
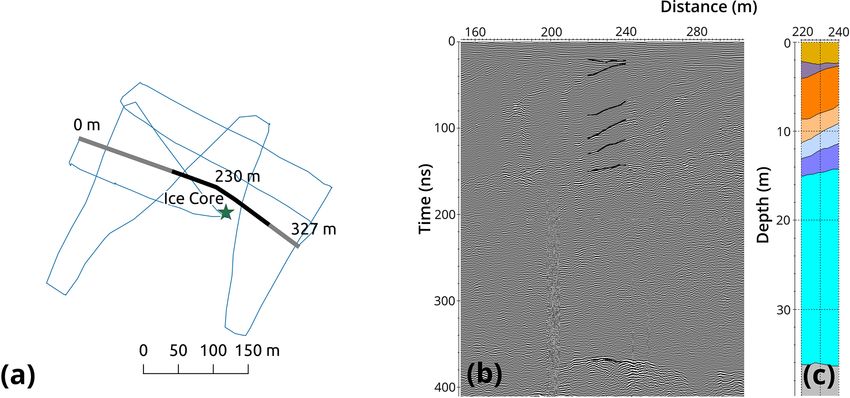
Figure 5. Young Island GPR. (a) Reference map depicts the full track of measurements (blue), the profile (grey), and the section shown in
the radargram (black). (b) Section of a radargram obtained walking in NW direction from the ice core, shown with layer interpretation and
(c) estimated depth of layers. A crevasse was detected at 70 m from the starting point (discontinuity in the reflections).
Figure 6. Mertz GPR. Reference maps of (a) Mertz 1 and (d) Mertz fast-ice sites depicting the full track of measurements (blue), the profile
(grey), and the section shown in the radargram (black). (b) Radargram representing a section of a transect crossing the ice core extraction
point at Mertz 1 with layer interpretation and (c) estimated depth of layers. (e) Radargram collected at the fast-ice site, shown with one
detected layer in red and (f) without layer interpretation.
Arcone, 2009). Thus, we first reduce the resolution of the from the firn core to the depth of the hand-picked layers in
firn core-derived melt profiles by summing the total melt in the radargrams (Fig. 7).
a running 35 cm window. Only sections that would produce
a strong enough (visible in the profiles at full resolution) re- 3.4 Density
flection to be detected by the GPR are included in the com-
parison. The continuity of the GPR data has been assessed in The change in firn density with depth is dependent on the
profile sections of 20 m length near the firn core extraction snow accumulation rate and temperature at the site. Higher
(plot c in Figs. 2–6), and their mean depth has been used. temperature and lower accumulation rates result in the great-
Subsequently, we compared the potentially visible patterns est change in density with depth. At our sites the depth–
density profile exhibits more variability at the island sites
(Bouvet, Peter I, Young) than the continental sites (Mertz and
The Cryosphere, 15, 1173–1186, 2021 https://doi.org/10.5194/tc-15-1173-2021E. R. Thomas et al.: Physical properties of shallow ice cores 1181
Figure 7. Comparison of detected layers (horizons) from GPR data (red dots; error bars: 1 standard deviation) and the potentially visible
patterns of melt derived from the reduced-resolution ice core melt record (blue diamonds) for each site.
Mount Siple), reflecting the warmer island locations and the with the aim of establishing a preliminary bottom age for
influence of surface melt (Fig. 8). each site.
A fitted density curve is applied based on the assumption In the Herron and Langway densification model, the
that firn densification is linearly related to the weight of over- dominant densification processes in the upper part (ρ ≤
lying snow (Herron and Langway, 1980). The density with 550 kg m−3 ) are grain settling and packing of snow grains
depth (ph) is calculated following Eq. (1): (Herron and Langway, 1980). Undoubtedly, refreezing of
meltwater and/or liquid precipitation also cause firn to den-
ph = pi − exp (ln a + b), (1)
sify. This is observed in Fig. 8 as jumps in the measured
where p is the density, pi is the density of ice (0.917 kg m−3 ), density corresponding to large melt events. However, if we
and h is the snow depth. The constants a and b are de- assume that heat is released upon refreezing, the local firn
rived from the linear relationship between ln [p/(pi − p)] temperature will also increase, further accelerating the den-
and depth, where ln(a) is the intercept, and b is the gradi- sification. At the same time, ice layers lead to a higher aver-
ent. The first stage of densification relates to grain settling age density, thereby reducing the potential densification rate.
and packing and occurs below the “critical density” of about Although not ideal, the measured density value used in the
0.55 kg m−3 (Herron and Langway, 1980). The second stage equation will reflect the presence of melt. As such, the values
of densification (0.55–0.83 kg m−3 ) occurs when the firn air of surface snow (or zero-intersection depth) are considerably
passages become closed off to form individual bubbles. The higher than those modelled or observed for coastal Antarc-
critical depth (zero intersection) and the close-off depth at tica (van den Broeke, 2008).
each site are presented in Table 3. We apply an error estimate to the bottom ages to account
for the potential influence of melt, changing snow accumula-
3.5 Estimating the firn core bottom ages tion with time, and uncertainties in the ERA-5 P − E value.
This is based on the difference between the age determined
The fitted density curve can provide a first approximation of using the mean annual P − E value and the age determined
the age scale (Table 3), based on the (water-equivalent) an- when using an upper (annual P − E plus 1 standard devi-
nual average P − E from ERA-5. We note that the resolution ation) or lower (annual P − E minus 1 standard deviation)
of ERA-5 may not be adequate to capture P − E at these P − E value. The error variability reflects the variability in
sites and that snow accumulation may vary through time. It precipitation at each site and increases with depth and age.
would have been preferable to use a densification model that For the sites where bedrock was not detected, we estimate
accounts for the influence of melt (e.g. Lightenberg et al., the bottom age of an ice core drilled to 100 m depth (Ta-
2011); however the current in situ observations at these sites ble 3). This suggests that the oldest ice would be reached
do not allow for this. Thus, our approach is very simplified
https://doi.org/10.5194/tc-15-1173-2021 The Cryosphere, 15, 1173–1186, 20211182 E. R. Thomas et al.: Physical properties of shallow ice cores
only site where the close-off depth is reached, which exceeds
this density threshold (0.83 kg m−3 ) at 16.6 m. This suggests
that pore close-off has been achieved, when air can no longer
be excluded, and further densification takes place by com-
pression of the bubbles. However, the presence of a large
melt layer at this depth suggests this may be the cause of the
density increase. Based on the fitted density profile, the ac-
tual close-off depth occurs at 21 m. The second-fastest close-
off depth occurs at Bouvet (28.65 m), considerably shallower
than the two coastal Antarctic sites (Mount Siple and Mertz
1).
Surface densities, critical depths, and close-off depths at
the continental sites (Mount Siple and Mertz 1) are consistent
with modelled values (van den Broeke, 2008). A compilation
of observed (and modelled) Antarctic snow densities suggest
a range of 6–26 m (modelled 4–29.5 m) for the critical depth
and 34–115 m (modelled 45–115 m) for pore close-off. The
values for Bouvet, Peter I, and Young Island are close to
the modelled values for coastal Antarctica; however, the pore
close-off depth at both Bouvet and Young Island is achieved
faster than the lowest reported depth for an Antarctic site
(34 m at Upstream B, West Antarctica) (van den Broeke,
2008). The presence of melt layers, with a greater density
than the surrounding firn, may bias our close-off estimates to
shallower depths. In addition to the influence of temperature,
the rapid densification on the SAIs may be caused by layer
stretching and compression related to ice flow that is not well
understood at these locations.
Figure 8. Melt layer thickness (blue; cm), measured snow density
(black), and fitted density curve (red) for each site: (a) Bouvet,
(b) Peter I Island, (c) Mount Siple, (d) Young Island, and (e) Mertz 4.1.2 GPR
1. Note the axis change for plot d (Young Island). The horizon-
tal lines represent the critical density (0.55 Kg m−3 ) and the pore The aim of the GPR data was to give a preliminary char-
close-off depth (0.83 Kg −3 ). acterization of each site, particularly the distribution, con-
tinuity, and clearness of the horizons observed in this data.
Bouvet was the only site where bedrock was detected, sug-
at Mertz 1 (1849 ± 64 years) and the youngest ice at Mount gesting that the maximum depth of an ice core from this site
Siple (1912 ± 35 years). is ∼ 40 m. Evidence of wind scouring in the reflections may
impact the proxy preservation at this site. The profiles at Pe-
ter I, Mount Siple, and Mertz indicate more uniform internal
4 Discussion structure, with traceable layers in the top 20 m. The largest
number of layers was identified at Young Island, but many
Based on the results we aim to establish which of the sites
were discontinuous or difficult to trace. The deepest layer
would be suitable for future deep-drilling expeditions based
detected was at Mertz, the coldest site, where layers were
on (1) the firn conditions and internal layering in the upper
traceable to a depth of 62 m.
ice column, (2) the extent of surface melt and the potential
impact on proxy preservation, and (3) potential bottom ages.
4.1.3 Case study: Mertz fast ice
4.1 Firn conditions and internal layering in the upper
ice column This Mertz fast-ice site is fundamentally different in charac-
ter from the others presented in this study. While we believe
4.1.1 Density the surface snow to be meteoric, it does not sit atop grounded
ice but rather a large wedge of multiyear sea ice, held fast be-
A linear relationship exists between the 2 m temperature tween the AAE and Mertz Glacier tongues (Fig. 1d). The top-
from ERA-5 and the critical depth (r 2 = 0.57, p > 0.05), most layers of snow and firn appeared to be typical of surface
which is reached first at Bouvet, the most northerly location snow. However, at a drill depth of 6.23 m the core was satu-
and the warmest site (Tables 1 and 3). Young Island is the rated with liquid seawater (a strong attenuator of the radar
The Cryosphere, 15, 1173–1186, 2021 https://doi.org/10.5194/tc-15-1173-2021E. R. Thomas et al.: Physical properties of shallow ice cores 1183
Table 3. Ice-core-derived zero-depth intersection and close-off depth. Estimated age (years CE) at the bottom of the core and at 100 m, based
on the measured ice core density.
Ice core density Age estimate
Site name Zero-depth Close-off Ice core bottom Age at 100 m
intersection (m) depth (m) age (CE) depth (CE)
Bouvet 0.5 28.7 2004 (± 3) n/a
Peter I 0.5 34.5 2004 (± 2) 1856 (± 23)
Mt Siple 0.5 51.9 1998 (± 6) 1912 (± 35)
Young 0.5 21.1 2002 (± 4) 1874 (± 37)
Mertz 1 0.4 50.5 1994 (± 8) 1849 (± 64)
Mertz fast ice 0.0 7.2 2008 (± 3) n/a
n/a: not applicable.
signal). Ice recovered below this depth was different in char- The influence of meltwater on ice-core-proxy preserva-
acter from the surface, being solid ice containing bubbles and tion has been explored for Arctic ice cores (Koerner, 1997).
interstitially saturated with salt water. There was a standing Here, meltwater percolation can allow insoluble microparti-
water table in the borehole at this same depth. These observa- cles to migrate to the melting surface, causing a spike in con-
tions, together with the clear radar reflector at just over 6.8 m centrations, and influence the stable-water-isotope record, a
(Fig. 6), the absence of reflectors below this, and the site’s commonly used proxy for past surface temperature. Seasonal
elevation of ∼ 6 m a.s.l., lead to the conclusion that the fast melting can cause run-off of near-surface snow and melt and
ice is saturated with seawater below sea level. refreezing at the base of the annual snowpack. This can redis-
If the fast ice is floating (i.e. supported buoyantly), our tribute the stable-water-isotope profile, resulting in a warm-
measurement of the dry freeboard thickness allows us to es- or cold-biased record. The influence on both stable water iso-
timate the total thickness of the fast-ice wedge. The aver- topes and chemistry can have a major impact on the ability
age density of the top 6 m is 0.55 ± 0.05 kg m−3 , increas- to date ice cores using annual layer counting. The site most
ing to 0.85 ± 0.05 kg m−3 below this. Assuming a seawa- affected by melt is Young Island, with 47 % of the firn core
ter density of 1.0275 ± 0.004 kg m−3 , freeboard thickness of characterized as melt. Given the island’s location south of
6.2 m, and a mean density of the ice below the water table the polar front and the seasonal sea ice zone (Fig. 1), the evi-
of 0.85 ± 0.05 kg m−3 , the total ice-equivalent thickness of dence of extensive surface melting is unexpected, especially
the ice at this site is ∼ 30 m. However, there are large un- when considering that the average temperature at Young Is-
certainties in this calculation. The radargram indicates that land is 6.4◦ colder than Bouvet, the site least affected by melt.
the fast ice increases in thickness away from the drill site by It is likely that the resolution of ERA-5 is not sufficient to
several metres. While this site is not likely to provide typical capture local surface temperature; however, the 3-hourly data
geochemical-proxy records, it may be of interest to future from the AWS (1993–1997) reveal considerable variability.
studies of multiyear sea ice. The maximum temperature recorded by the Young AWS
(elevation-corrected) is 2.8 ◦ C (February 1997), with temper-
4.2 Extent of surface melt and the potential impact on atures in 20 of the 67 months of AWS data exceeding 0 ◦ C.
proxy preservation The annual average temperature at Young Island is compara-
ble with Peter I, with a lower maximum AWS temperature.
4.2.1 Melt recorded in the firn core However, the largest melt layer at Young is almost twice that
of Peter I and the percentage melt over 4 times higher. Solar
Surface melting occurs in response to a positive energy bal- radiation is the dominant driver of surface melting, although
ance at the snow surface and is strongly correlated with sur- atmospheric thermodynamics and cloud radiative properties
face air temperature. The Antarctic ice sheet experiences lit- also play a role. Thus, our study demonstrates that, for the
tle melt due to consistently low temperature; however the SAIs, surface temperature alone is not a reliable indicator of
coastal margins and areas of the Antarctic Peninsula are sub- potential melt damage.
ject to surface melting (van Wessem et al., 2016). The rela- The average melt layer thickness at all sites (except Young
tionship between surface melt and surface temperature has Island) is considerably lower than the mean melt layer
been exploited to reconstruct past climate in Antarctic ice width of 3.2 cm observed at the James Ross Island ice core,
cores (Abram et al., 2013). However, the presence of too from the northern Antarctic Peninsula (Abram et al., 2013).
much surface melt can damage the climate proxies they con- The percentage of melt per year is dependent on the mea-
tain. sured snow accumulation. The estimated snow accumula-
https://doi.org/10.5194/tc-15-1173-2021 The Cryosphere, 15, 1173–1186, 20211184 E. R. Thomas et al.: Physical properties of shallow ice cores
tion at Bouvet is 0.59 m water equivalent, based on annual It is difficult to estimate a potential age limit for a core
layer counting of chemical and isotopic species (King et drilled to bedrock at the Young, Peter I, and Mertz 1 sites
al., 2019b). The annual layer counting of the other subICE since the ice thickness was beyond the penetration depth of
cores has not yet been completed; however based on our the GPR. For example, at Mertz 1 a bottom age of 1926 CE
estimates (Sect. 3.4), it is a reasonable assumption that the (± 34 years) is estimated based on a GPR bottom depth of
snow accumulation at these maritime islands will be equal 63 m (Table 2), although the ice could feasibly be much
to or more than the snow accumulation at James Ross Is- deeper than this. At the Bouvet site, where we interpret the
land (0.62 ± 0.14 m water equivalent). Thus, the potential for layer at ∼ 40 m as bedrock, the maximum potential age is
proxy preservation and climate reconstructions is promising 1971 CE (± 11 years). However, considerably deeper (and
at these sites. therefore older) ice may be present at higher elevations.
Given the degree of melt at Young Island, it seems likely These results suggest that the subICE firn core records will be
that the proxy preservation may be compromised. However, suitable for obtaining sub-annual-resolution climate records
an evaluation of the firn or ice microstructure may help de- with the potential to capture climate variability over multi-
termine the extent to which meltwater has percolated through decadal timescales.
the layers. The estimated firn core bottom age at Bouvet Island, to-
gether with the observed visible ash layers (Fig. S1), offers
4.2.2 Comparison of firn core melt with GPR layers a glimpse at the volcanic history of this remote island. The
last known eruption was 50 BCE; however, visible layers in
There appears to be little correlation between the melt ob- the upper ∼ 20 m suggest the island has been volcanically
served in the core and the layers traced in the GPR. The re- active as recently as ∼ 1998. The regularity of the layers in
lationship is particularly poor for Young Island, where the the ice cliffs, visible all around the island, indicate frequent
core shows a high number of thin melt layers, seen in the volcanic activity has occurred during the 20th century. This
radar data as very dense non-continuous layering. Although is consistent with the persistent volcanic activity observed on
it is not possible to determine the spatial extent of melting the nearby South Sandwich Islands, with visible ash clouds
based on the GPR profiles, the findings suggest that density identified in the satellite records and even visible from the
variations alone cannot explain the internal layering. ship during the ACE (March 2017). We note that the visible
The presented comparison method is subject to several ash layers at Bouvet (Fig. S1) may have been deposited from
sources of uncertainty: (1) the manual picking of the GPR the South Sandwich Islands, but further analysis will help es-
layer; (2) the distance between the firn-core-extraction point tablish the source.
and the section of the radar data; and (3) the use of average
depth in sections of 20 m distance, especially for the sites that
exhibit an incline (e.g. Bouvet and Mount Siple).
5 Conclusions
4.3 Potential bottom ages of deeper ice cores
Initial results from five shallow firn cores drilled in the sub-
One of the aims of this study was to establish the SAI’s suit- Antarctic islands and coastal Antarctica suggest that these
ability for future deep-ice-core-drilling projects. A useful in- locations may be suitable for short-term climate reconstruc-
dicator is the potential bottom age at each site. The estimated tions and up to centennial-scale reconstructions at some sites
firn core bottom ages range from 2004 CE (± 3 years), at if deeper cores could be retrieved. Evidence that these firn
both the Peter I and Bouvet firn cores, to 1994 CE (± 8 years) cores span the 20th century, a period of significant global cli-
at Mertz 1 (Table 3). mate change, is exciting. The GPR surveys suggest relatively
To date, only the Bouvet firn core has been independently uniform layering at most sites, at least to the depth of the firn
dated. Annual layer counting, using a suite of chemical and cores, suitable for firn-core-proxy reconstructions. However,
isotopic species, yielded a bottom age of 2001 CE (King et evidence of crevassing at some locations (Young and Peter I)
al., 2019). Although older than the bottom age estimate us- demonstrates the importance of a thorough geophysical sur-
ing the density profile, it is within error (2004 CE ± 3 years), vey before contemplating deeper drilling at these sites. At
adding confidence to this approach but suggesting our ages Bouvet Island, regular volcanic ash deposits during the 20th
may be too conservative. The offset may be explained by an century suggest the island is still volcanically active.
over-estimate in the P − E derived from ERA-5 or suggest The impact of melt is less severe than expected at some
the influence of post-depositional processes such as wind locations, especially Bouvet Island, but more severe at oth-
scouring or ablation. ers. Young Island, part of the Balleny island chain off the
coast of Adèlie Land, is the most susceptible to melt. How-
ever, the observed melt layer thickness at the other sites is
less than that observed from the James Ross Island ice core,
which yielded palaeoclimate reconstructions (Abram et al.,
2013). Proxy preservation was not a concern in this ice core,
The Cryosphere, 15, 1173–1186, 2021 https://doi.org/10.5194/tc-15-1173-2021E. R. Thomas et al.: Physical properties of shallow ice cores 1185
suggesting that melt will also not adversely influence the cli- ECMWF for providing ERA-5 reanalysis data. We thank Laura Ger-
mate record contained in the sub-Antarctic firn cores. The ob- ish (BAS) for producing the maps. Data used in this study are avail-
served increase in melt intensity at James Ross Island since able through the UK Polar Data Centre. The authors would like
the mid-20th century was linked to warming surface temper- to acknowledge the coordinators and participants of the Antarc-
ature. Thus, the comparable melt intensity observed at some tic Circumnavigation Expedition for facilitating collection of the
subICE cores, especially David Walton, Christian de Marliave, Ju-
of the SAIs may be evidence that the 20th-century warm-
lia Schmale, Robert Brett, Sergio Rodrigues, Francois Bernard,
ing at these locations was analogous to that on the Antarctic Roger Stilwell, and Frederick Paulsen. We thank Howard Conway,
Peninsula. an anonymous reviewer, and editor Adam Booth for their valuable
Based on the measured density profile and the P − E from suggestions.
ERA-5, the estimated bottom ages of the subICE cores range
from 2004 (Peter I and Bouvet) to 1994 (Mertz 1), suggest-
ing that these records should contain a multi-decadal record Financial support. This research has been supported by the École
of climate variability in this data-sparse region. We were un- Polytechnique Fédérale de Lausanne, the Swiss Polar Institute, and
able to obtain ice thickness estimates for all sites, with the Ferring Pharmaceuticals Inc. (grant no. subICE).
exception of Bouvet; however visible layers were identified
in the GPR records to depths of 60 m. Even with a conser-
vative estimate, it is possible that deeper ice cores drilled on Review statement. This paper was edited by Adam Booth and re-
these SAIs would have the potential to capture climate vari- viewed by Howard Conway and one anonymous referee.
ability during the 20th century but most likely considerably
longer.
References
Data availability. All data will be stored at the UK Polar Data Abram, N. J., Mulvaney, R., Wolff, E. W., Triest, J., Kipfstuhl, S.,
Centre and made available by directly contacting Liz Thomas Trusel, L. D., Vimeux, F., Fleet, L., and Arrowsmith, C.: Accel-
(lith@bas.ac.uk). eration of snow melt in an Antarctic Peninsula ice core during
the twentieth century, Nat. Geosci., 6, 404–411, 2013.
Arcone, S.: Glaciers and Ice Sheets, in: Ground Penetrating Radar
Supplement. The supplement related to this article is available on- Theory and Applications, edited by: Jol, H., Oxford, Elsevier,
line at: https://doi.org/10.5194/tc-15-1173-2021-supplement. 361–392, 2009.
Campagne, P., Crosta, X., Houssais, M. N., Swingedouw, D.,
Schmidt, S., Martin, A., Devred, E., Capo, S., Marieu, V., Clos-
Author contributions. ERT led the project; ERT, GG, JBP, ACFK, set, I., and Massé, G.: Glacial ice and atmospheric forcing on the
BM, and MP collected the data in the field; ERT, JBP, ACFK, and Mertz Glacier Polynya over the past 250 years, Nat. Commun.,
DEM processed the ice core data; GG and MP processed the GPR 6, 6642, https://doi.org/10.1038/ncomms7642, 2015.
data; all authors contributed to writing and editing the paper. Cook, A. J., Poncet, S., Cooper, A. P. R., Herbert, D. J., and Christie,
D.: Glacier retreat on South Georgia and implications for the
spread of rats, Antarc. Sci., 22, 255–263, 2010.
Copernicus Climate Change Service (C3S): ERA5: Fifth genera-
Competing interests. The authors declare that they have no conflict
tion of ECMWF atmospheric reanalyses of the global climate,
of interest.
Copernicus Climate Change Service Climate Data Store (CDS),
February 2020, available at: https://cds.climate.copernicus.eu/
cdsapp{#}!/home (last access: April 2020), 2017.
Acknowledgements. Funding was provided to subICE by École Emile-Geay, J., McKay, N. P., Kaufman, D. S., von Gunten, L.,
Polytechnique Fédérale de Lausanne, the Swiss Polar Institute, and Wang, J., Anchukaitis, K. J., Abram, N. J., Addison, J. A., Cur-
Ferring Pharmaceuticals Inc. Elizabeth Ruth Thomas received core ran, M. A. J., Evans, M. N., Henley, B. J., Hao, Z., Martrat, B.,
funding from the Natural Environment Research Council to the McGregor, H. V., Neukom, R., Pederson, G. T., Stenni, B., Thiru-
British Antarctic Survey’s Ice Dynamics and Palaeoclimate pro- malai, K., Werner, J. P., Xu, C., Divine, D. V., Dixon, B. C., Ger-
gramme. Amy Constance Faith King was jointly supported by Sel- gis, J., Mundo, I. A., Nakatsuka, T., Phipps, S. J., Routson, C. C.,
wyn College, Cambridge, and the NERC doctoral training pro- Steig, E. J., Tierney, J. E., Tyler, J. J., Allen, K. J., Bertler, N. A.
gramme (grant no. NE/L002507/1). Joel B. Pedro acknowledges N., Björklund, J., Chase, B. M., Chen, M.-T., Cook, E., de Jong,
support from the European Research Council under the European R., DeLong, K. L., Dixon, D. A., Ekaykin, A. A., Ersek, V., Fil-
Community’s Seventh Framework Programme (FP7/2007e2013) ipsson, H. L., Francus, P., Freund, M. B., Frezzotti, M., Gaire, N.
and ERC grant agreement 610055 as part of the ice2ice project. We P., Gajewski, K., Ge, Q., Goosse, H., Gornostaeva, A., Grosjean,
are grateful to the Norwegian Polar Institute for granting us permis- M., Horiuchi, K., Hormes, A., Husum, K., Isaksson, E., Kan-
sion to visit Bouvet (permit reference: 2016/115-25). The authors dasamy, S., Kawamura, K., Kilbourne, K. H., Koç, N., Leduc, G.,
appreciate the support of the University of Wisconsin-Madison Au- Linderholm, H. W., Lorrey, A. M., Mikhalenko, V., Mortyn, P.
tomatic Weather Station programme for the data set, data display, G., Motoyama, H., Moy, A. D., Mulvaney, R., Munz, P. M., Nash,
and information as well as the NSF (grant no. ANT-1543305) and D. J., Oerter, H., Opel, T., Orsi, A. J., Ovchinnikov, D. V., Porter,
https://doi.org/10.5194/tc-15-1173-2021 The Cryosphere, 15, 1173–1186, 20211186 E. R. Thomas et al.: Physical properties of shallow ice cores T. J., Roop, H. A., Saenger, C., Sano, M., Sauchyn, D., Saunders, McGlone, M. S.: The Late Quaternary peat, vegetation and climate K. M., Seidenkrantz, M.-S., Severi, M., Shao, X., Sicre, M.-A., history of the Southern Oceanic Islands of New Zealand, Quat. Sigl, M., Sinclair, K., St. George, S., St. Jacques, J.-M., Tham- Sci. Rev., 21, 683–707, 2002. ban, M., Kuwar Thapa, U., Thomas, E. R., Turney, C., Uemura, Medley, B. and Thomas, E. R.: Increased snowfall over the Antarc- R., Viau, A. E., Vladimirova, D. O., Wahl, E. R., White, J. W. tic Ice Sheet mitigated twentieth-century sea-level rise, Nat. C., Yu, Z., Zinke, J., and Consortium, P. A. K.: A global multi- Clim. Change, 9, 34–39, 2019. proxy database for temperature reconstructions of the Common Perren, B. B., Hodgson, D. A., Roberts, S. J., Sime, L., Van Era, Sci. Data, 4, 170088, https://doi.org/10.1038/sdata.2017.88, Nieuwenhuyze, W., Verleyen, E., and Vyverman, W.: Southward 2017. migration of the Southern Hemisphere westerly winds corre- Favier, L., Durand, G., Cornford, S. L., Gudmundsson, G. H., sponds with warming climate over centennial timescales, Com- Gagliardini, O., Gillet-Chaulet, F., Zwinger, T., Payne, A. J., and mun. Earth Environ., 1, 58, https://doi.org/10.1038/s43247-020- Le Brocq, A. M.: Retreat of Pine Island Glacier controlled by ma- 00059-6, 2020. rine ice-sheet instability, Nat. Clim. Change, 4, 117–121, 2014. Saunders, K. M., Hodgson, D. A., and McMinn, A.: Quantita- Hatherton, T., Dawson, E. W., and Kinsky, F. C.: Balleny Island’s tive relationships between benthic diatom assemblages and wa- Reconnaissance Expedition, 1964, New Zealand Journal of Ge- ter chemistry in Macquarie Island lakes and their potential for ology and Geophysics, 8, 164–179, 1965. reconstructing past environmental changes, Antarc. Sci., 21, 35– Herron, M. M. and Langway, C. C.: Firn Densification: An Empiri- 49, 2008. cal Model, J. Glaciol., 25, 373–385, 1980. Saunders, K. M., Roberts, S. J., Perren, B., Butz, C., Sime, L., Joughin, I., Smith, B. E., and Medley, B.: Marine Ice Davies, S., Van Nieuwenhuyze, W., Grosjean, M., and Hodgson, Sheet Collapse Potentially Under Way for the Thwaites D. A.: Holocene dynamics of the Southern Hemisphere westerly Glacier Basin, West Antarctica, Science, 344, 735, winds and possible links to CO2 outgassing, Nat. Geosci., 11, https://doi.org/10.1126/science.1249055, 2014. 650–655, 2018. King, A. C. F., Thomas, E. R., Pedro, J. B., Markle, B., Potocki, Spikes, V. B., Hamilton, G. S., Arcone, S. A., Kaspari, S., and M., Jackson, S. L., Wolff, E., and Kalberer, M.: Organic Com- Mayewski, P. A.: Variability in accumulation rates from GPR pounds in a Sub-Antarctic Ice Core: A Potential Suite of Sea Ice profiling on the West Antarctic plateau, Ann. Glaciol., 39, 238– Markers, Geophys. Res. Lett., 46, 9930–9939, 2019. 244, 2004. Koerner, R. M.: Some comments on climatic reconstructions from Tetzner, D., Thomas, E., and Allen, C.: A Validation of ERA5 Re- ice cores drilled in areas of high melt, J. Glaciol., 43, 90–97, analysis Data in the Southern Antarctic Peninsula – Ellsworth 2017. Land Region, and Its Implications for Ice Core Studies, Geo- Koppenjan, S.: Ground Penetrating Radar Systems and Design, in: sciences, 9, 289, https://doi.org/10.3390/geosciences9070289, Ground Penetrating Radar Theory and Applications, edited by: 2019. Jol, H., Oxford, Elsevier, 73–97, 2009. Thomas, E. R., Allen, C. S., Etourneau, J., King, A. C. F., Severi, Lacarra, M., Houssais, M.-N., Herbaut, C., Sultan, E., and Beau- M., Winton, V. H. L., Mueller, J., Crosta, X., and Peck, V. L.: verger, M.: Dense shelf water production in the Adélie Depres- Antarctic Sea Ice Proxies from Marine and Ice Core Archives sion, East Antarctica, 2004–2012: Impact of the Mertz Glacier Suitable for Reconstructing Sea Ice over the Past 2000 Years, calving, J. Geophys. Res.-Oceans, 119, 5203–5220, 2014. Geosci., 9, 506, https://doi.org/10.3390/geosciences9120506, Ligtenberg, S. R. M., Helsen, M. M., and van den Broeke, M. R.: An 2019. improved semi-empirical model for the densification of Antarctic van den Broeke, M.: Depth and Density of the Antarctic Firn Layer, firn, The Cryosphere, 5, 809–819, https://doi.org/10.5194/tc-5- Arc. Antarc. Alp. Res., 40, 432–438, 2008. 809-2011, 2011. Van der Putten, N., Mauquoy, D., Verbruggen, C., and Björck, S.: Looyenga, H.: Dielectric constants of heterogeneous mixtures, Subantarctic peatlands and their potential as palaeoenvironmen- Physica, 31, 401–406, 1965. tal and palaeoclimatic archives, Quat. Int., 268, 65–76, 2012. Martin, P. and Peel, D.: The Spatial Distribution of 10 m Tem- Walton, D. and Thomas, J.: Cruise Report – Antarc- peratures in the Antarctic Peninsula, J. Glaciol., 20, 311–317, tic Circumnavigation Expedition (ACE) 20th Decem- https://doi.org/10.3189/S0022143000013861, 1978. ber 2016 – 19th March 2017 (Version 1.0), Zenodo, Mayewski, P. A., Kuli, A., Casassa, G., Arėvalo, M., Dixon, D. A., https://doi.org/10.5281/zenodo.1443511, 2018. Grigholm, B., Handley, M. J., Hoffmann, H., Introne, D. S., Kuli, Whitehead, H., McGill, B., and Worm, B.: Diversity of deep- A. G., Potocki, M., and Sneed, S. B.: Initial reconnaissance for a water cetaceans in relation to temperature: implications for ocean South Georgia ice core, J. Glaciol., 62, 54–61, 2016. warming, Ecol. Lett., 11, 1198–1207, 2008. The Cryosphere, 15, 1173–1186, 2021 https://doi.org/10.5194/tc-15-1173-2021
You can also read