Wintertime grassland dynamics may influence belowground biomass under climate change: a model analysis - KIT
←
→
Page content transcription
If your browser does not render page correctly, please read the page content below
Biogeosciences, 17, 1071–1085, 2020
https://doi.org/10.5194/bg-17-1071-2020
© Author(s) 2020. This work is distributed under
the Creative Commons Attribution 4.0 License.

Wintertime grassland dynamics may influence belowground
biomass under climate change: a model analysis
Genki Katata1,2 , Rüdiger Grote2 , Matthias Mauder2 , Matthias J. Zeeman2 , and Masakazu Ota3
1 Institutefor Global Change Adaptation Science (ICAS), Ibaraki University, Ibaraki, 310-8512, Japan
2 Instituteof Meteorology and Climate Research, Atmospheric Environmental Research (IMK-IFU), Karlsruhe
Institute of Technology, Garmisch-Partenkirchen, 82467, Germany
3 Research Group for Environmental Science, Japan Atomic Energy Agency (JAEA), Ibaraki, 319-1195, Japan

Correspondence: Genki Katata (genki.katata.mirai@vc.ibaraki.ac.jp)

Received: 6 August 2019 – Discussion started: 4 September 2019
Revised: 15 January 2020 – Accepted: 23 January 2020 – Published: 28 February 2020

Abstract. Rising temperatures and changes in snow cover,         1   Introduction
as can be expected under a warmer global climate, may
have large impacts on mountain grassland productivity lim-
ited by cold and long winters. Here, we combined two ex-         Grasslands are important for food production as a means of
isting models, the multi-layer atmosphere-SOiL-VEGetation        fodder for livestock. There productivity strongly depends on
model (SOLVEG) and the BASic GRAssland model (BAS-               climatic conditions and is thus expected to be highly influ-
GRA), which accounts for snow, freeze–thaw events, grass         enced by climate change (Jing et al., 2014; Tubiello et al.,
growth, and soil carbon balance. The model was applied           2007). Particular large changes regarding temperature and
to simulate the responses of managed grasslands to anoma-        snow cover alterations are predicted to occur in high latitudes
lously warm winter conditions. The grass growth module           and mountainous regions (Pepin et al., 2015), leading to the
considered key ecological processes under a cold environ-        expectation that mountain grassland ecosystems will be par-
ment, such as leaf formation, elongation and death, tiller-      ticularly affected (Xie et al., 2017). Therefore, understand-
ing, carbon allocation, and cold acclimation, in terms of pho-   ing the response of mountain grassland ecosystems to snow
tosynthetic activity. Input parameters were derived for two      cover conditions is crucial for estimating grassland produc-
pre-Alpine grassland sites in Germany, for which the model       tivity and respective impacts on carbon and energy balances
was run using 3 years of data that included a winter with an     under climate change.
exceptionally small amount of snow. The model reproduced            Although forage production from grasslands is known to
the temporal variability of observed daily mean heat fluxes,     be limited by cold and long winters in mountainous regions,
soil temperatures, and snow depth throughout the study pe-       there are still uncertainties regarding the impacts of win-
riod. High physiological activity levels during the extremely    ter conditions on grassland ecology (i.e., grasses, clover,
warm winter led to a simulated CO2 uptake of 100 gC m−2 ,        other herbaceous species, flowers, and mosses; Rapacz et
which was mainly allocated into the belowground biomass          al., 2014). During winter seasons, low temperatures interact
and only to a minor extent used for additional plant growth      with the presence or absence of snow cover in controlling
during early spring. If these temporary dynamics are repre-      the acclimation status of grassland vegetation (Ergon et al.,
sentative of long-term changes, this process, which is so far    2018). For example, low temperature limits the productiv-
largely unaccounted for in scenario analysis using global ter-   ity of grassland vegetation either directly due to its effects
restrial biosphere models, may lead to carbon accumulation       on photosynthesis or cell growth, or indirectly by inducing
in the soil and/or carbon loss from the soil as a response to    senescence and dormancy. In addition, photosynthesis and
global warming.                                                  growth are prevented even under relatively mild tempera-
                                                                 tures as long as the vegetation is covered by snow. In turn,
                                                                 mild temperatures combined with only short snow periods

Published by Copernicus Publications on behalf of the European Geosciences Union.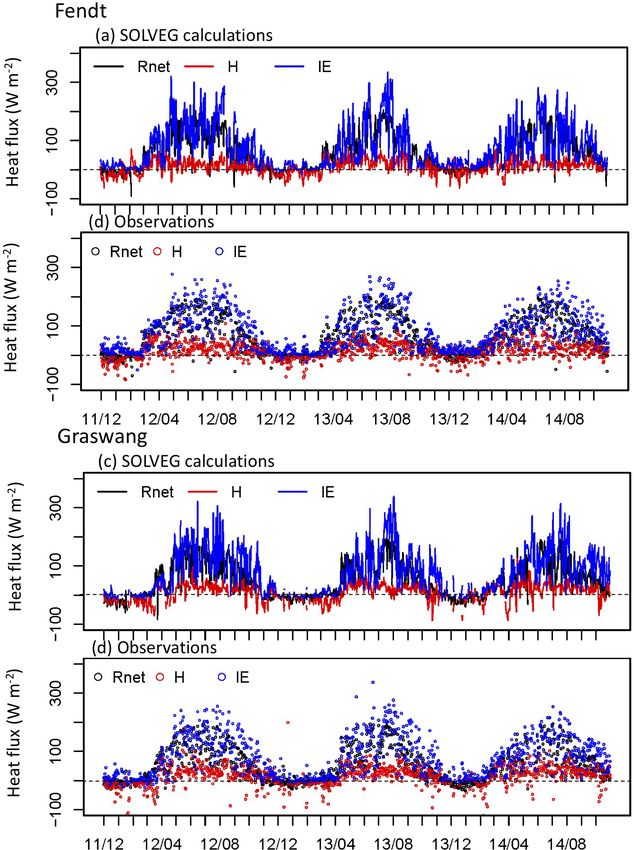
1072                                                               G. Katata et al.: Grassland C balance under warmer climate

enable photosynthetic activity throughout the whole winter            ers a number of years that include normal (2011–2012 and
leading to drastically increasing gross primary production            2012–2013) and extremely warm (2013–2014) winters. The
(GPP), which has been observed at low-elevation grasslands            results are evaluated with measurements and are discussed
(Zeeman et al., 2017). The resulting increase in carbon avail-        based on sensitivity analysis.
ability may be used for increased aboveground growth during
spring, be released or put into belowground organs for stor-
age or resource acquisition, with largely different impacts on        2     Materials and methods
the overall carbon cycle.
   In order to assess the impacts of a changing environment,          2.1    SOLVEG
the general responses of photosynthesis and phenology to
temperature and radiation have been explicitly described in           The one-dimensional multi-layer model SOLVEG consists
common process-based grassland models (e.g., Cannell and              of four sub-models: atmosphere, soil, vegetation, and radi-
Thornley, 1998; Soussana et al., 2012, as reviewed in Van             ation within the vegetation canopy as shown in Fig. S1 in the
Oijen et al., 2018), although the consideration of species-           Supplement. The general description is available in Katata
specific sensitivities may not always be adequate (Höglind            (2009), Katata and Ota (2017), Nagai (2004), and Ota et
et al., 2011; Tuba et al., 2008). Three major uncertainties can       al. (2013). Details of the processes of snow accumulation and
be depicted: the first is the representation of growth phases in      melting, freeze–thaw in soil, and grassland vegetation growth
phenological sub-models since photosynthesis gain and stor-           and development are described in the Supplement.
age activation is often restricted to empirically determined             In the atmosphere sub-model, one-dimensional diffusion
periods that may considerably shift under climate change              equations are solved between atmospheric layers for hori-
(e.g., Desai et al., 2015). The second uncertainty is related         zontal wind speeds, potential temperature, specific humid-
to the allocation process that distributes acquired carbon ac-        ity, liquid water content of fog, turbulent kinetic energy and
cording to certain rules that may depend on growth stages             length scale (Katata, 2009), and gas and aerosol concentra-
but generally do not consider an environmental change of              tions (Katata and Ota, 2017). In upper boundary conditions,
sink strength such as the limitation of cell expansion by low         the variables of horizontal wind speeds, potential tempera-
temperatures (Körner, 2008; Rabenhorst, 2005). Finally, ac-           ture, and specific humidity (and liquid water content of the
climation processes that may lead to a relatively high pho-           fog, gas and aerosol concentrations, if available) are typically
tosynthesis in colder environments (Sage and Kubien, 2007)            obtained from hourly or half-hourly observational data. For
are not accounted for. Carbon production in the cold might            further explanation, see Sect. 2.3. Bulk transfer equations are
thus lead to enhanced carbon storage rather than grass growth         applied at the lowest layer using the soil surface tempera-
(Hoch and Körner, 2003; Körner, 2008). In addition, models            ture and specific humidity calculated in the soil sub-model.
need to have a close link to soil processes in order to quan-         In the soil sub-model, the soil temperature, volumetric soil
tify carbon releases from soil respiration that might also be         water content, and specific humidity in the soil pores are pre-
enhanced by warmer winter temperatures (e.g., Scholz et al.,          dicted based on heat conduction, mass balance in liquid wa-
2018).                                                                ter, and water vapor diffusion equations, respectively (Katata,
   In order to improve the representation of wintertime grass-        2009). Root water uptake is calculated from the transpiration
land dynamics, this study focuses on the relationship of              rate in the vegetation sub-model. For CO2 concentration in
productivity responses under varying temperature and snow             soil, mass conservation equations for liquid and gas phases
cover duration in mountainous areas. In contrast to most ex-          are solved (Nagai, 2004). Organic matter dynamics are also
isting studies with grassland models for temperate climate            considered (Ota et al., 2013), such as microbial decompo-
conditions that focus on spring and summer seasons (Höglind           sition and dissolved organic carbon (DOC) leaching in the
et al., 2016), we investigate the effect of changing winter           aboveground litter layer, belowground input of carbon from
conditions. In particular, we differentiate between environ-          roots (root litter), and soil organic carbon (SOC) turnover and
mental limitations on photosynthesis and growth (e.g., tem-           DOC transport along water flows throughout the soil profile
perature, water, and nutrient controls; Boisvenue and Run-            for three SOC pools (active, slow, and passive) with different
ning, 2006) and also consider plant internal drivers (e.g., ac-       turnover times.
cumulation and depletion of accumulate nonstructural carbo-              In the vegetation sub-model, profiles of the leaf tempera-
hydrates; Kozlowski, 1992; Fatichi et al., 2014). Therefore,          ture, leaf surface water, and the vertical liquid water flux are
we apply a process-based land surface model that can sim-             predicted (Nagai, 2004). The heat budget equation at the leaf
ulate both physical (snow and freeze–thaw) and biological             surface is solved to predict the leaf temperature using key
processes (carbon allocation under cold stresses) and which           variables from the atmosphere sub-model combined with the
includes sink limitations. This integrated model is based on          radiation scheme. At the upper boundary of the sub-model,
a multi-layer atmosphere–soil–vegetation model (SOLVEG;               the given precipitation intensity is used for calculating verti-
Katata et al., 2014), and is run at two managed grassland sites       cal liquid water flux within the canopy based on the surface
in the German pre-Alpine region. The simulation period cov-           water budget equation. The CO2 assimilation rate due to pho-

Biogeosciences, 17, 1071–1085, 2020                                                        www.biogeosciences.net/17/1071/2020/
G. Katata et al.: Grassland C balance under warmer climate                                                                  1073

tosynthesis is predicted using Farquhar’s formulations (Far-      perature. The following five sinks are considered: the pro-
quhar et al., 1980) and stomatal resistance. In the radiation     cesses of cold hardening, replenishment of the reserve pool,
sub-model, direct and diffuse downward and upward fluxes          leaf growth, stem growth, and root growth. Sink strengths are
of solar and longwave radiation are calculated to obtain the      defined as the rate at which these processes would proceed
radiation energy input at the canopy layers. Fractions of sun-    with no source limitation. The hardening process has top pri-
lit and shaded leaves at each canopy layer are computed for       ority, so its demand is met in full if source strength is large
the stomatal resistance and energy budget calculations.           enough, irrespective of the four other sinks. Root growth has
    A multi-layer snow module is mainly developed based on        lowest priority and depends on carbon unused by other sinks.
the Community Land Model (CLM; Oleson et al., 2010) and           The strength priority between reserves on the one hand, and
SNTHERM (Jordan, 1991), while the model is unique in in-          leaves and stems on the other hand changes with day length.
cluding the gravitational and capillary liquid water flows in     When day lengths are shorter than a cultivar-specific thresh-
the unsaturated snow layer based on van Genuchten’s con-          old, reserves have higher priority than stems and leaves, with
cept of water flow in the unsaturated zone (see Hirashima et      the opposite during the rest of the year. Leaves and stems
al., 2010). In the soil module, freeze–thaw processes in soil     have equal priority so they receive carbon according to their
based on the freezing-point depression equation (Zhang et         sink strengths. The removal of tillers and leaves by cutting
al., 2007) are considered in heat conduction and liquid water     can be simulated during the growing season, with subse-
flow equations.                                                   quent regrowth of the sward. The regrowth rate after cutting
    To simulate the winter-related processes for grassland phe-   is calculated at each phenological stage. Natural turnover of
nology such as leaf development and senescence due to             leaves and roots is modeled using typical life spans in years
cold stresses, the relevant scheme in the grass growth model      (Arora and Boer, 2005), while BASGRA does not simulate
named BASic GRAssland model (BASGRA; Höglind et al.,              the senescence of elongating tillers or roots. The fraction of
2016) is coupled with the vegetation sub-model of SOLVEG          roots in soil layers and rooting depth are modeled as a func-
to simulate vegetation growth. The three main features that       tion of root biomass (Arora and Boer, 2003), which may be
characterize plant growth in BASGRA are (1) simulation            required to be tested at multiple biomes. Daily amounts of
of source–sink relations where the source consists of both        the dead root biomass (root litter) are used as inputs to SOC
current photosynthesis and remobilization of reserves; (2)        in the soil sub-model of SOLVEG.
simulation of leaf area dynamics and tillering for vegetative
and generative tillers; and (3) cold hardening and the effect     2.2   Empirical parameterizations for cold acclimation
of physical winter stress factors on tiller survival and plant
growth. BASGRA has been well validated by using several           Although the relation between the maximum catalytic capac-
experimental datasets of harvestable dry matter of perennial      ity of Rubisco (Vcmax ) and air temperature is quite well estab-
rye grass collected in Europe (Schapendonk et al., 1998) and      lished (e.g., Bernacchi et al., 2001; Leuning, 2002; Smith and
from five locations in Norway, covering a wide range of agro-     Dukes, 2013), parameters related to photosynthesis are still
climatic regions, day lengths, and soil conditions (Höglind       uncertain (Kattge and Knorr, 2007) also for low temperature
et al., 2016). BASGRA consists of the LINGRA grassland            (Höglind et al., 2011). Thus, in the vegetation sub-model, we
model (Van Oijen et al., 2005) with models for cold hard-         introduced the empirical factor for cold stress of grasslands,
ening and soil physical winter processes, while diurnal CO2       fcold , to empirically simulate the reduction of photosynthesis
assimilation is calculated as accumulation of the net assim-      under low air temperature as per the following equations (see
ilation for each time step within the vegetation sub-model        also Supplement):
(Nagai, 2004) instead of the original scheme of photosyn-         An = min(fcold wc , we , fcold ws ) − Rd ,
thetic processes in BASGRA. When snow covers grass, no
                                                                                             (Ta + 4)

photosynthesis is assumed to occur due to low light avail-        fcold = min 1, max 0,                   ,                   (1)
                                                                                            (Tph + 4)
ability and only soil respiration is considered. BASGRA uses
a so-called “big-leaf” approach (Monteith, 1981), thus pre-       where An (µmol m−2 s−1 ) is the net CO2 assimilation rate
dicting the total leaf area index (LAI) of the whole grassland    at each canopy layer, which is calculated by subtracting
vegetation canopies. Since SOLVEG uses a multi-layer struc-       the leaf respiration rate Rd (µmol m−2 s−1 ) from the as-
ture of canopies, the profile of leaf area density is obtained    similation rate, wc (µmol m−2 s−1 ) is the limitation by effi-
from simply dividing total LAI by canopy height (h) by as-        ciency of the photosynthetic enzyme system (Rubisco), we
suming vertically uniformity for all canopy layers. Canopy        (µmol m−2 s−1 ) is the limitation by the absorbed photosyn-
height, which is not simulated in BASGRA, is calculated by        thetically active radiation (PAR), ws (µmol m−2 s−1 ) is the
the function of LAI with fitting parameters.                      limitation by the capacity of leaves to export the products
    The carbon gain from photosynthesis and remobilized re-       of photosynthesis, Ta (◦ C) is the daily and vertical mean air
serves is allocated among sinks based on changing sink prior-     temperature for all canopy layers, and Tph (◦ C) is the thresh-
ities and strengths. Sink strengths are calculated based on the   old air temperature above which grasslands are photosyn-
dynamics of leaves and stems and the acclimation to low tem-      thetically active. Determination of the value of this threshold

www.biogeosciences.net/17/1071/2020/                                                      Biogeosciences, 17, 1071–1085, 2020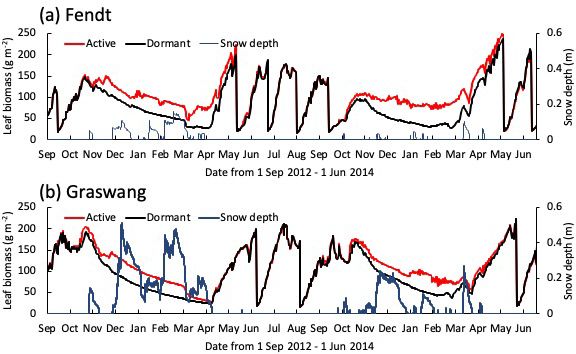
1074                                                              G. Katata et al.: Grassland C balance under warmer climate

temperature is important to avoid the overestimation (mainly         area are given to SOLVEG runs from the past model study
from fall to winter) of photosynthesis at a low temperature          (Hingerl et al., 2016). The set of parameters of BASGRA for
(Höglind et al., 2011). In the original BASGRA, Tph is set to        typical perennial grass species of timothy in the Nordic re-
1 ◦ C; that is, Vcmax starts decreasing linearly when Ta drops       gion (Höglind et al., 2016) is applied. Grass-cutting events
below 1 ◦ C until it becomes zero at −4 ◦ C. However, in the         are determined from clear reductions in the CO2 flux, sur-
SOLVEG simulation, since the values of Tph may change de-            face albedo, and phenology camera observations according
pending on environmental conditions, the value of Tph is cali-       to Zeeman et al. (2017). The threshold temperature for cold
brated for each site so that the model reproduces the observed       stresses (Tph in Eq. 2) is manually determined in the sim-
CO2 flux during the extremely warm winter period.                    ulation for each site to obtain the best agreement between
                                                                     simulated and measured CO2 flux over the canopy during
2.3    Study sites and observational data                            winter. By changing the Tph value from the range between 1
                                                                     and 11 ◦ C with an increment of 2 ◦ C (not shown in the fig-
The model is applied to two sites of managed grassland               ure), we obtained the best results as Tph = 1 ◦ C and 11 ◦ C for
named Graswang (47.5708◦ N, 11.0326◦ E, 864 m a.s.l.) and            Graswang and Fendt, respectively. The calibration results of
Fendt (47.8329◦ N, 11.0607◦ E, 595 m a.s.l.) belonging to the        daily mean surface fluxes (Rnet , H , λE, and FCO2 ) are statis-
TERestrial ENvironmental Observatories (TERENO) net-                 tically evaluated using the mean error (ME), the root-mean-
work in Germany. General information on the climate and              square error (RMSE), intercept and slope of linear regression
management of the sites is available in Table 1. Both sites          lines, and Pearson’s correlation coefficient (R).
are located in the Bavarian Alpine Foreland, in the south of
Germany and north of the Alps (Mauder et al., 2013; Zee-             2.5    Scenario determination for sensitivity analysis
man et al., 2017, 2019). The grasses are harvested several
times during the growing season defined as the period from           To investigate the impact of cold acclimation of grassland
April to October.                                                    vegetation on the CO2 balance and carbon allocation at
   Half-hourly data of precipitation, atmospheric pressure,          mountain grassland ecosystems, two scenarios using the
horizontal wind speed, air temperature, and humidity, and            SOLVEG model are defined based on the experimental re-
incoming long- and shortwave radiation were used at the top          sults of Höglind et al. (2011): “active scenario” (Tph = 1 ◦ C)
atmospheric layer as a height of 3.5 m. Data of friction veloc-      and “dormant scenario” (Tph = 11 ◦ C). The former indicates
ity (u∗), sensible (H ) and latent heat (λE), and CO2 fluxes         that photosynthesis is active during most of the wintertime
(FCO2 ) observed over the grassland based on the open-path           and photosynthesis takes place even at the low temperature
eddy covariance method using a three-dimensional sonic               of 1 ◦ C. In contrast, the latter represents a situation where
anemometer (CSAT3; Campbell Scientific, USA) and an                  grass physiology is more or less shut down and photosynthe-
open-path CO2 /H2 O gas analyzer (LI-7500; Li-Cor, USA)              sis ceases under the conditions of the relatively high temper-
were used for validation of the simulation results. The net ra-      ature of 11 ◦ C to protect from cold stresses. Both scenarios
diation (Rnet ) over the canopies, soil temperature at 0.05 m        are adopted for both Graswang and Fendt, covering the same
in depth, and snow depth were also used to evaluate the sim-         period.
ulated surface energy and water balances. Details of the site
characteristics and micrometeorological observations are de-         3     Results
scribed by Zeeman et al. (2017).
                                                                     3.1    Model calibration and validation
2.4    Calibration and validation procedure
                                                                     Figure 1 shows the temporal changes in simulated and ob-
Direct comparisons between the results using the original            served daily surface heat fluxes over the grassland at Fendt
(SOLVEG only) and integrated models (SOLVEG coupled                  and Graswang throughout the 3-year study period. The
with BASGRA) are difficult because the vegetation dynam-             model generally reproduced the typical seasonal changes
ics had been prescribed in the original model, requiring time        measured at both sites, for example, low values of the Bowen
series of total LAI or leaf biomass data, which is used for          ratio (H / λE) at Fendt during the growing season (from
evaluation in this study. Thus, we simply focus on the cali-         April to October) and negative sensible heat flux (H ) at Fendt
bration of the integrated model only to investigate the impact       in December 2013, as suggested by Zeeman et al. (2017).
of wintertime carbon uptake on grassland dynamics. Param-               Figure 2 illustrates the time series of modeled and ob-
eters used for SOLVEG simulations are summarized in Ta-              served daily soil temperature and snow depth at the two
ble 2. The study period was approximately 3 years long from          sites. Observed changes in soil temperature and snow depth
1 December 2011 to 1 November 2014, and included both                (Fig. 2a, c) were also generally reproduced by the model;
normal (2011–2012 and 2012–2013) and extremely warm                  for example, when the grassland was covered by the snow at
(2013–2014) winters. Typical values of soil hydrological pa-         Graswang from December 2012 to February 2013, soil tem-
rameters (e.g., saturated hydraulic conductivity) in the study       perature at a depth of 0.02 m remained at almost 0 ◦ C in both

Biogeosciences, 17, 1071–1085, 2020                                                       www.biogeosciences.net/17/1071/2020/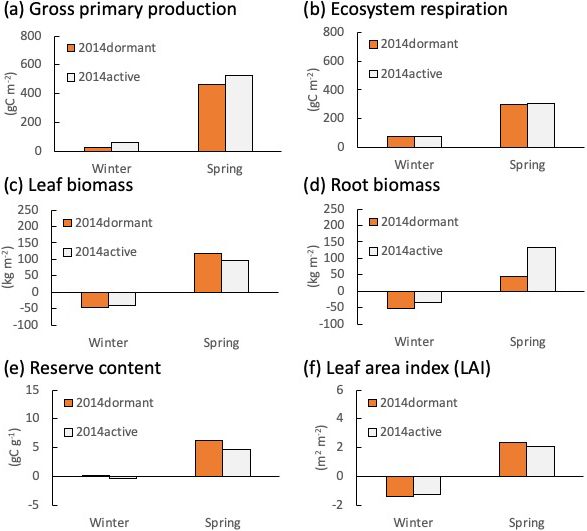
G. Katata et al.: Grassland C balance under warmer climate                                                                       1075

Table 1. Characteristics of past or ongoing CO2 flux observational sites over grassland ecosystems in European mountains. Snow-free CO2
uptake (bold font) represents the situation of high negative values of CO2 flux even during the wintertime (typically from December to
February).

         Site name           Elevation   MAT     MAP     Snow-free      Number of cuttings per year    Source
                                  (m)    (◦ C)   (mm)    CO2 uptake
         Chamau                   393      9.8   1184    Yes            6–7                            Zeeman et al. (2010)
         Oensingen                452      9.5   1100    Yes            3                              Ammann et al. (2009)
         Rotholz                  523      8.2   1151    No             3 + occasional grazing         Wohlfahrt et al. (2010)
         Fendt                    600      8.0   1100    Yes            4–6                            Zeeman et al. (2017)
         Rottenbuch               760      8.0   1000    Yes            5                              Zeeman et al. (2017)
         Graswang                 865      6.0   1000    No             2                              Zeeman et al. (2017)
         Neustift                 970      6.3    852    No             3                              Wohlfahrt et al. (2008)
         Früebüel                 982      7.5   1708    No             4                              Zeeman et al. (2010)
         Seebodenalp             1025      7.3   1327    No             2                              Rogiers et al. (2005)
         Dischma                 1250      2.8   1022    No             2 + occasional grazing         Merbold et al. (2013)
         Monte Bondone           1553      5.5   1189    No             1                              Marcolla et al. (2010)
         Torgnon                 2160      3.1    880    No             0                              Galvagno et al. (2013)

observations and calculations (Fig. 2c). Sudden increases in          tation period. In addition, some minor leaf growth also occurs
soil temperature during periodical snow-free conditions were          in the snow-free winter periods. Nevertheless, leaf biomasses
also reproduced by the model; this was particularly evident           converge during spring and are similar again at the first cut-
at Fendt during the extremely warm winter of 2013–2014                ting event in May/June (Fig. 4b).
(Fig. 2a).                                                               Figures 5 and 6 depict the cumulative GPP and ecosystem
   Simulated and observed daily CO2 fluxes (FCO2 ) over the           respiration (RE), mean leaf and root biomass, carbon reserve
canopies and simulated LAI at both sites are presented in             content (total stock of carbon that can be allocated to any of
Fig. 2b. The model simulation match the observed increase             the plant elements such as leaves, stems, and roots), and LAI,
of CO2 uptake due to regrowth of grassland vegetation as              simulated for Fendt and Graswang during winter and spring
well as the sudden decline after harvests (Fig. 2b and d).            in 2014, respectively. In the following, we focus on Fendt
No drought stress was apparent in the simulations at both             for illustration of the scenario differences (Fig. 5) but would
sites during the study period (not shown). During the ex-             like to emphasize that the responses are similar at both sites.
tremely warm winter from December 2013 to February 2014,              The differences in absolute values, especially a smaller LAI
a net release of CO2 at Fendt was also well reproduced by             and less biomass are due to the generally cooler conditions
the model (Fig. 2b) using the calibrated value of Tph = 1 ◦ C         at the Graswang site. It should be noted that such differences
(Table 2). At Graswang, both observed and simulated CO2               in environmental conditions between the sites required the
fluxes were very small and close to zero (Fig. 3d), which was         calibration of the value of Tph for each site (Sect. 2.2). Both
achieved in the model by setting a high threshold temperature         GPP and RE were higher in the active scenario than in the
for cold acclimation (calibrated as Tph = 11 ◦ C; Table 2).           dormant one as expected by the model construction (Fig. 5a
   Scatter diagrams and statistical comparisons of daily en-          and b); this was particularly apparent as cumulative GPP dif-
ergy and CO2 fluxes at the two sites throughout the study             fered by a factor of 3 or by approximately 100 gC m−2 yr−1
period are presented in Fig. 3. At both sites, the slopes of          (Fig. 5a). Changes in leaf biomass and LAI during the sub-
the regression lines were overall close to unity and values of        sequent spring in the active scenario were slightly lower than
the intercepts were sufficiently small for Rnet , H , and λE.         in the dormant scenario, indicating that a small part of the
High correlations were also observed between measured and             additional GPP has been used for foliage growth (Fig. 5c and
simulated CO2 fluxes at both sites.                                   f). In contrast, changes in root biomass (below ground) both
                                                                      during winter and spring in the active scenario were approxi-
3.2   Sensitivity analysis                                            mately 3 times higher than in the dormant scenario (Fig. 5d).
                                                                      Simulated carbon reserve contents in both winter and spring
                                                                      were similar in the two simulation scenarios (Fig. 5e), show-
Figure 4 illustrates temporal changes in simulated snow
                                                                      ing that the carbon fixed by photosynthesis was immediately
depth and leaf biomass obtained for the active and dormant
                                                                      allocated to the above- or belowground biomass.
scenarios at both sites for the normal winter (2012–2013)
and extremely warm winter (2013–2014). It is obvious that
leaf biomass during winter is higher in the active scenarios,
mostly because of a higher leaf growth at the end of the vege-

www.biogeosciences.net/17/1071/2020/                                                          Biogeosciences, 17, 1071–1085, 2020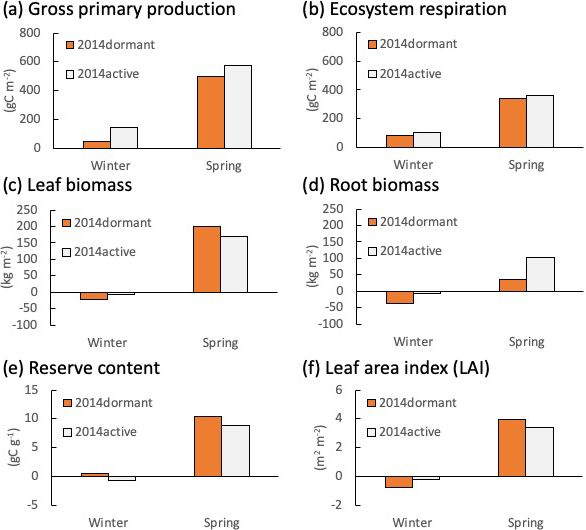
1076                                                                     G. Katata et al.: Grassland C balance under warmer climate

Table 2. Simulation settings for the modified SOLVEG at the Fendt and Graswang sites. Abbreviations: DM, dry matter; DW: dry weight.

              Items                                       Values                                 Key reference
              Time step                                   100 s                                  This study
              Numbers of layers                           15, 8, and 7 for atmosphere,           This study
                                                          vegetation, and soil, respectively
              Soil layer boundaries                       0.02, 0.05, 0.1, 0.2, 0.5, 1.0, and    This study
                                                          2.0 m depth
              Vegetation layer boundaries                 0.05–0.5 m height with an increment    This study
                                                          of 0.05 m
              Atmospheric layer boundaries                Vegetation layers and 0.6, 0.8, 1.2,   This study
                                                          1.6, 2.0, and 4.0 m height
              Soil texture                                Silt                                   This study
              Porosity                                    0.55 m3 m−3                            This study
              Initial and bottom soil temperature         0 ◦ C for all soil layers              This study
              Snow layer thickness                        5 mm                                   This study
              Empirical parameter, Ck                     8                                      Zhang et al. (2007)
              Irreducible liquid water content in snow    0.03 m3 m−3                            Hirashima et al. (2010)
              Other parameters for snow and soil                                                 Same as Jordan (1991)
              frozen sub-model
              Maximum catalytic capacity of Rubisco       45 µmol m−2 s−1                        This study and within range of
              at 25 ◦ C                                                                          Wohlfahrt et al. (2001)
              Dark respiration rate of leaves at 25 ◦ C   1.52 µmol m−2 s−1                      Wohlfahrt et al. (2001)
              Activation energy for dark respiration      48.9 kJ mol−1                          Wohlfahrt et al. (2001)
              Minimum stomatal conductance                0.08 mol m−2 s−1                       Wohlfahrt et al. (2001)
              Threshold air temperature when              1 and 11 ◦ C at Fendt and Graswang     This study
              photosynthesis starts, Tph
              Other parameters for vegetation sub-model                                          C3 grass (Nagai, 2004)
              Initial leaf area index (LAI)               1.5 m2 m−2                             This study
              Initial carbohydrate storage                100 kgDM ha−1                          This study
              Initial root biomass                        7000 kgDM ha−1                         This study
              Initial total tiller density                1000 number m−2                        This study
              Ratio of total generative tiller            0.1                                    Höglind et al. (2016)
              Ratio of fast generative tiller             1.0                                    Höglind et al. (2016)
              Initial total tiller density                1000 number m−2                        This study
              Initial stem biomass                        0 kgDM ha−1                            This study
              Initial stubble biomass                     0 kgDM ha−1                            This study
              Initial specific leaf area (SLA)            0.002 m2 kgDW−1                        This study
              Maximum SLA                                 0.003 m2 kgDW−1                        Zeeman et al. (2017)
              LAI after grass cutting                     0.5 m2 m−2                             This study
              Critical LAI for self-shading               4.5 m2 m−2                             Höglind et al. (2016)
              Root life span (residence time)             0.001 d−1                              Höglind et al. (2016)
              Other parameters related to BASGRA module                                          Same as Höglind et al. (2016)
              Parameters for soil microbiological processes                                      Same as Ota et al. (2013)

Biogeosciences, 17, 1071–1085, 2020                                                              www.biogeosciences.net/17/1071/2020/
G. Katata et al.: Grassland C balance under warmer climate 1077
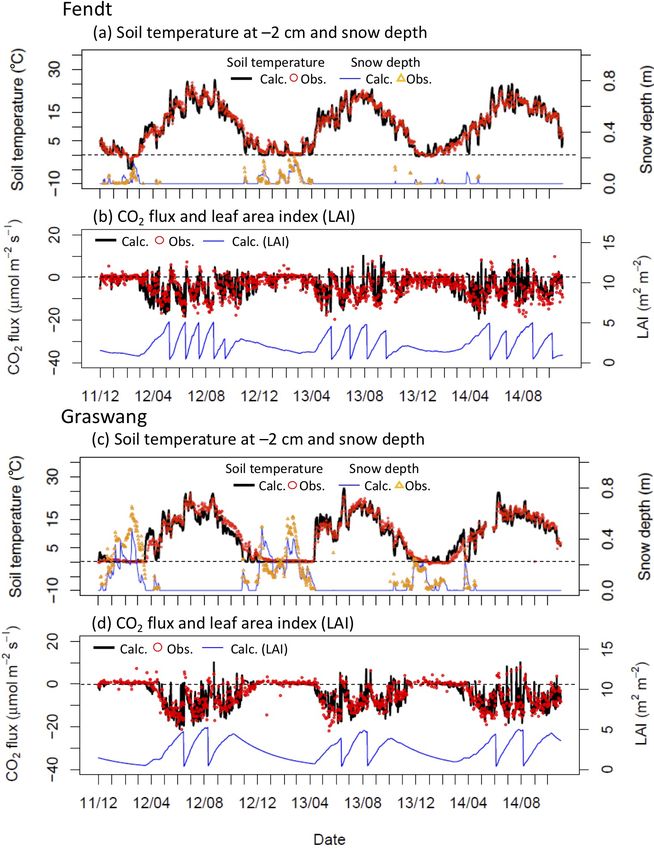
Figure 1. Time series for (a, c) calculated (lines) and (b, d) observed (open circles) daily mean net radiation (Rnet ), sensible heat flux (H ),
and latent heat flux (λE) at (a–b) Fendt and (c–d) Graswang throughout the study period.
4 Discussion was the threshold air temperature of Tph in Eq. (2) for the
photosynthetic activity level of grassland ecosystems. Tun-
The results demonstrate that the modified SOLVEG model ing of the above parameter is required for each site to simu-
that considers the major physical (snow and freeze–thaw) late carbon dynamics in the grassland ecosystems in cold cli-
and biological processes (carbon allocation under cold mate regions. In future applications, dependencies between
stresses) can reasonably simulate heat and carbon trans- this parameter and the environment or species composition
fer processes in managed grassland ecosystems (Figs. 1– could be evaluated so that it does not need to be fitted any-
3). In particular, the model with calibrated Tph values re- more. This will require more comprehensive datasets with
produced the low CO2 uptake during the normal winter pe- which also the importance of underlying processes can be
riod at Graswang as a response to low soil temperatures that revealed and model calibration can be carried out, possibly
limit photosynthesis even throughout the snow-free condi- using an optimization procedure such as Monte Carlo simu-
tions (Fig. 2d). On the other hand, it was also possible to lation (e.g., Van Oijen et al., 2005).
represent the observed high uptake of CO2 at Fendt in the Our approach uses the manually calibrated Tph values for
extremely warm winter with the model (Fig. 2b). The key each site, while only typical (average) values are taken for
parameter that determined the above CO2 uptake processes different plant functional types of grassland vegetation in
www.biogeosciences.net/17/1071/2020/ Biogeosciences, 17, 1071–1085, 20201078 G. Katata et al.: Grassland C balance under warmer climate Figure 2. Time series for calculated (solid lines) and observed (open symbols) (a, c) daily mean soil temperature at a depth of 0.02 m and snow depth and (b, d) CO2 flux (FCO2 ) and leaf area index (LAI) at (a–d) Fendt and (e–h) Graswang throughout the study period. Sudden decreases in calculated LAI in (b, d) represent grass-cutting events. global biogeochemical models. Numerical experiments us- sure to freezing temperatures (e.g., Huner et al., 1993; Ko- ing Tph = 1 ◦ C revealed that the high CO2 uptake rate at low lari et al., 2007). In fact, the Graswang site was exposed to altitude during winter was likely explained by high levels of frost even during the extremely warm winter in 2013–2014 physiological activity of grasslands (Fig. 4a). In this exper- (Zeeman et al., 2017). In our simulations, we treated these iment, the impact of cold acclimation on the CO2 balance acclimation responses as a parameter change, although in fu- for the two pre-Alpine temperate grassland sites was evalu- ture developments they might be described mechanistically ated by manually tuning the threshold temperature of pho- depending on temperature development (Kumarathunge et tosynthesis to lower (Tph = 1 ◦ C) and higher values (Tph = al., 2019; Mediavilla et al., 2016). Other mechanisms are 11 ◦ C) because the exact mechanism of model response to however, already implicitly considered in the photosynthe- Tph changes is unclear (Höglind et al., 2011). Such a down- sis model. For example, the limitation of photosynthesis regulation of photosynthesis is justified by numerous obser- and thus the optimum temperature shifts under low air tem- vations about acclimation responses particularly after expo- perature from electron-transport-limited to Rubisco-limited Biogeosciences, 17, 1071–1085, 2020 www.biogeosciences.net/17/1071/2020/
G. Katata et al.: Grassland C balance under warmer climate                                                                                1079

Figure 3. Scatter diagrams of calculated and observed (a, e) daily mean net radiation (Rnet ), (b, f) sensible (H ) and (c, g) latent (λE) heat,
and (d, h) CO2 fluxes (FCO2 ) at (a–d) Fendt and (e–h) Graswang for the study period. ME (mean error) = calculations − observations;
RMSE: root-mean-square error.

www.biogeosciences.net/17/1071/2020/                                                                Biogeosciences, 17, 1071–1085, 2020
1080                                                                 G. Katata et al.: Grassland C balance under warmer climate

Figure 4. Time series for calculated leaf biomass and snow depth (blue lines) at (a) Fendt and (b) Graswang from 1 September 2012 until
1 June 2014, in active (red lines) and dormant cases (black lines).

(Sage and Kubien, 2007). Further observational work is re-                 The comparison between scenarios shows that root
quired at various grassland ecosystems in order to evaluate             biomass clearly increased in the active simulation compared
this hypothesis.                                                        to the dormant simulation during winter and spring (Fig. 5c
   The high CO2 uptake rate during snow-free conditions                 and d), which can only be due to CO2 gain by photosyn-
was not limited to the Fendt site, but is likely a widespread           thesis during this time (Fig. 5a). Note that these somewhat
phenomenon in other mountain grasslands in Europe. This                 counter-intuitive results may be due to the inability of the
statement is supported by Table 1, which summarizes full-               model to grow specific storage organs that could later be
year observational studies that include wintertime CO2 flux             emptied to grow other tissues. Differentiation, however, is
at European mountains. Indeed, except for the Austrian site             not yet possible because relevant observational evidence is
of Rotholz, which has a long grazing period that may inten-             not available. Most studies of Alpine grassland ecosystems
sively reduce grass productivity (Wohlfahrt et al., 2010), high         in Europe have focused on the impact of climate changes on
CO2 uptake during snow-free periods was observed at all al-             grass yield (i.e., grassland-based food production); for exam-
titudes below 760 m, corresponding to annual mean air tem-              ple, in the Nordic region, future CO2 increase, warming, and
perature (MAT) of more than 8 ◦ C. If the altitude or MAT is            less snowfall are expected to increase grassland productivity
considered as a threshold of cold acclimation of grasses, the           (Ergon et al., 2018). According to this study, CO2 uptake at
snow-free wintertime CO2 uptake may have a large impact                 the Fendt site, estimated as an annual GPP of 100 gC m−2
on the carbon balance of grassland ecosystems over the Eu-              in 2013–2014, was mainly due to the higher wintertime pho-
ropean Alps. Since a rise in the snowline and wintertime air            tosynthetic rate in the active scenario. Thus, it could be as-
temperature of up to 300–600 m and 2–4 ◦ C, respectively, has           sumed that the increase in the aboveground biomass in spring
been predicted for the latter part of the 21st century, the effect      would be higher in the active scenario. However, the above-
is likely to even increase (Gobiet et al., 2014). It should be          ground biomass at the first cutting simulated in the active
noted, however, that other indicators of the level of cold ac-          scenario was similar that in the dormant scenario (Fig. 5c).
climation might be superior to the use of MAT because phys-             Still, the behavior is consistent with the simulated carbon re-
iological activities of grassland vegetation are often triggered        serve contents (a potential of carbon allocation to the above-
by temperatures during specific development stages. If, how-            ground biomass) in winter, which were similar in the two
ever, such activities are rather closely related to the MAT (as         simulation scenarios (Fig. 5e). The actual limitation might
indicated in Table 1), it is also possible that the differences         have internal (e.g., determined growth) or external causes.
in phenology and photosynthesis are caused by a different               For example, self-shading could result in the decreasing car-
species composition of grasslands. In this case, acclimation            bon gain efficiency of new leaves, which might induce a stop
speed and management options that facilitate a change to-               to growth or an increase in senescence when the canopy be-
wards better adapted ecosystems should be investigated.                 comes denser. Indeed, calculated LAI values were similar to
                                                                        critical values for self-shading shortly before the first cut-

Biogeosciences, 17, 1071–1085, 2020                                                         www.biogeosciences.net/17/1071/2020/
G. Katata et al.: Grassland C balance under warmer climate 1081 Figure 5. Changes in calculated (a) gross primary production (GPP), (b) ecosystem respiration, (c) live leaf and (d) root biomasses, (e) re- serve content, and (f) leaf area index (LAI) at Fendt during the winter (from December to February) and spring (from March to May) in 2014 in active (grey bars) and dormant cases (orange bars). Figure 6. Changes in calculated (a) gross primary production (GPP), (b) ecosystem respiration, (c) live leaf and (d) root biomasses, (e) re- serve content, and (f) leaf area index (LAI) at Graswang during the winter (from December to February) and spring (from March to May) in 2014 in active (grey bars) and dormant cases (orange bars). www.biogeosciences.net/17/1071/2020/ Biogeosciences, 17, 1071–1085, 2020
1082                                                              G. Katata et al.: Grassland C balance under warmer climate

ting event in 2014 (Fig. 4), which is however not a process          Data availability. The output data from this study are publicly ac-
considered in the model and is thus the result of a reason-          cessible via contacting the first author.
ably parametrized determined growth. This is corroborated
by a similar degree of leaf senescence in both scenarios (6.9
and −0.7 % at Fendt and Graswang, respectively). These re-           Supplement. The supplement related to this article is available on-
sults indicate that grass yield cannot be simply determined          line at: https://doi.org/10.5194/bg-17-1071-2020-supplement.
by the source-strength (CO2 assimilation due to photosynthe-
sis) and is controlled by the sink demand of the aboveground
biomass (foliar, tiller, and stem growth). Indeed, an open-          Author contributions. GK developed the model with support from
                                                                     RG and MO, and performed the simulations using the data collected
top-chamber warming experiment in the alpine steppe on the
                                                                     by MM and MJZ. GK prepared the manuscript with contributions
north Tibetan Plateau showed that warming significantly in-          from all co-authors.
creased total root biomass by 28 % at a soil depth of 0–0.01 m
in the growing season (Ma et al., 2016), supporting the pos-
sibility of larger belowground allocation of organic carbon,         Competing interests. The authors declare that they have no conflict
as suggested by this study. Therefore, the increased photo-          of interest.
synthesis in the warmer winter does not necessarily increase
grass yields and thus fodder in mountainous regions. In order
to quantify the impact on livestock supply, further research         Acknowledgements. We thank the staff of KIT/IMK-IFU in Ger-
needs to investigate to which degree additional biomass is           many and of ICAS in Japan for their support. We also express
directed into above- and belowground storages.                       our gratitude to Georg Wohlfahrt of the University of Innsbruck,
   Another important implication from our numerical exper-           Austria; Jun Koarashi of the JAEA, Japan; Kentaro Takagi of
iments is that carbon stock in/loss from the soil in moun-           Hokkaido University, Japan; and Ankur Desai of University of Wis-
tain grasslands may be greater in a warmer future climate.           consin for their helpful comments and suggestions on this study.
The root biomass simulated for the active scenario was 3             The German weather data were provided by DWD. Fortran code
                                                                     of BASGRA was provided from https://zenodo.org/record/27867#
times greater than that for the dormant scenario (Fig. 5d),
                                                                     .XjqoFWbTW70 (last access: 14 February 2020).
indicating that more carbon is accumulated in roots, stor-
age organs, or in the soil due to higher input by root litter
in warmer winters. Indeed, recent studies suggest that a rela-
                                                                     Financial support. This study was supported by the German Re-
tively high MAT accelerates the turnover of roots to produce         search Foundation (grant no. ZE1006/2-1) and the Postdoctoral Fel-
root litter input in managed mountain grassland ecosystems           lowship for Research Abroad and Leading Initiative for Excellent
(Leifeld et al., 2015). This change in the belowground in-           Young Researchers, (Japan Society for the Promotion of Science,
put of carbon in grassland ecosystems is particularly impor-         and the Ministry of Education, Culture, Sports, Science and Tech-
tant for the carbon cycle at managed grassland ecosystems            nology). The TERENO pre-Alpine infrastructure is funded by the
because plant-fixed carbon from the aboveground biomass              Helmholtz Association and the Federal Ministry of Education and
is substantially reduced following cutting. Furthermore, this        Research.
may enhance carbon loss from the soil due to heterotrophic
respiration and leaching of CO2 because grassland vegeta-
tion typically has a high density of fine roots that are poorly      Review statement. This paper was edited by Paul Stoy and re-
lignified and with high turnover rates, providing a relatively       viewed by two anonymous referees.
labile carbon substrate for microbial activity (Garcia-Pausas
et al., 2017). The altered SOC dynamics in grassland ecosys-
tems may be of considerable importance for the global car-
bon cycle since soils of temperate grassland ecosystems are          References
already estimated to hold a large stock of carbon, 7 % of total
global soil carbon (Jobbágy and Jackson, 2000). Therefore,           Ammann, C., Spirig, C., Leifeld, J., and Neftel, A.: Assessment
we suggest that global terrestrial biosphere models (as re-            of the nitrogen and carbon budget of two managed temper-
viewed by Fatichi et al., 2019) need to be elaborated with             ate grassland fields, Agric. Ecosyst. Environ., 133, 150–162,
phenological and acclimation processes such as interactions            https://doi.org/10.1016/j.agee.2009.05.006, 2009.
                                                                     Arora, V. K. and Boer, G. J.: A representation of vari-
with belowground processes (Gill et al., 2002; Riedo et al.,
                                                                       able root distribution in dynamic vegetation models,
1998; Soussana et al., 2012) in order to estimate the carbon           Earth Interact., 7, 1–19, https://doi.org/10.1175/1087-
balance response of managed grassland ecosystems to global             3562(2003)0072.0.co;2, 2003.
warming.                                                             Arora, V. K. and Boer, G. J.: A parameterization of leaf phenol-
                                                                       ogy for the terrestrial ecosystem component of climate models,
                                                                       Global Change Biol., 11, 39–59, https://doi.org/10.1111/j.1365-
                                                                       2486.2004.00890.x, 2005.

Biogeosciences, 17, 1071–1085, 2020                                                        www.biogeosciences.net/17/1071/2020/
G. Katata et al.: Grassland C balance under warmer climate 1083 Bernacchi, C. J., Singsaas, E. L., Pimentel, C., Portis Jr., A. R., and in pre-alpine environment, Hydrol. Process, 30, 3804–3823, Long, S. P.: Improved temperature response functions for models https://doi.org/10.1002/hyp.10893, 2016. of Rubisco-limited photosynthesis, Plant Cell Environ., 24, 253– Hirashima, H., Yamaguchi, S., Sati, A., and Lehning, M.: 259, https://doi.org/10.1111/j.1365-3040.2001.00668.x, 2001. Numerical modeling of liquid water movement through Boisvenue, C. and Running, S. W.: Impacts of climate change layered snow based on new measurements of the wa- on natural forest productivity – evidence since the mid- ter retention curve, Cold Reg. Sci. Technol., 64, 94–103, dle of the 20th century, Global Change Biol., 12, 862–882, https://doi.org/10.1016/j.coldregions.2010.09.003, 2010. https://doi.org/10.1111/j.1365-2486.2006.01134.x, 2006. Hoch, G. and Körner, C.: The carbon charging of pines at the Cannell, M. G. R., and Thornley, J. H. M.: N-poor ecosystems may climatic treeline: a global comparison, Oecologia, 135, 10–21, respond more to elevated CO2 than N-rich ones in the long term. https://doi.org/10.1007/s00442-002-1154-7, 2003. A model analysis of grassland, Global Change Biol., 4, 431–442, Höglind, M., Hanslin, H. M., and Mortensen, L. M.: https://doi.org/10.1046/j.1365-2486.1998.00167.x, 1998. Photosynthesis of Lolium perenne L. at low tempera- Desai, A. R., Wohlfahrt, G., Zeeman, M. J., Katata, G., Eugster, tures under low irradiances, J. Exp. Bot., 70, 297–304, W., Montagnani, L., Gianelle, D., Mauder, M., and Schmid, H. https://doi.org/10.1016/j.envexpbot.2010.10.007, 2011. P.: Montane ecosystem productivity responds more to global cir- Höglind, M., Van Oijen, M., Cameron, D., and Persson, T.: culation patterns than climatic trends, Environ. Res. Lett., 11, Process-based simulation of growth and overwintering of grass- 024013, https://doi.org/10.1088/1748-9326/11/2/024013, 2015. land using the BASGRA model, Ecol. Model., 335, 1–15, Ergon, Å., Seddaiu, G., Korhonen, P., Virkajärvi, P., Belloc- https://doi.org/10.1016/j.ecolmodel.2016.04.024, 2016. chi, G., Jørgensen, M., Østrem, L., Reheul, D., and Volaire, Huner, N. P. A., Öquist, G., Hurry, V. M., Krol, M., Falk, S., and F.: How can forage production in Nordic and Mediter- Griffith, M.: Photosynthesis, photoinhibition and low tempera- ranean Europe adapt to the challenges and opportunities ture acclimation in cold tolerant plants, Photosynthesis. Res., 37, arising from climate change?, Eur. J. Agron., 92, 97–106, 19–39, https://doi.org/10.1007/bf02185436, 1993. https://doi.org/10.1016/j.eja.2017.09.016, 2018. Jing, Q., Bélanger, G., Qian, B., and Baron, V.: Timothy yield Essery, R., Morin, S., Lejeune, Y., and Menard, C.: A and nutritive value with a three-harvest system under the pro- comparison of 1701 snow models using observations jected future climate in Canada, Can. J. Plant Sci., 94, 213–222, from an alpine site, Adv. Water Res., 55, 131–148, https://doi.org/10.4141/cjps2013-279, 2014. https://doi.org/10.1016/j.advwatres.2012.07.013, 2013. Jobbágy, E. G. and Jackson, R. B.: The vertical distribution of soil Fatichi, S., Leuzinger, S., and Körner, C.: Moving be- organic carbon and its relation to climate and vegetation, Ecol. yond photosynthesis: from carbon source to sink-driven Appl., 10, 423–436, https://doi.org/10.2307/2641104, 2000. vegetation modeling, New Phytol., 201, 1086–1095, Jordan, R.: A one-dimensional temperature model for a snow cover. https://doi.org/10.1111/nph.12614, 2014. Technical documentation for SNTHERM.89, CRREL Special Fatichi, S., Pappas, C., Zscheischler, J., and Leuzinger, S.: Mod- Report 91-16; US Army Core of Engineers Cold Regions Re- elling carbon sources and sinks in terrestrial vegetation, New search and Engineering Laboratory, Hanover, NH, 49 pp., 1991. Phytol., 221, 652–668, https://doi.org/10.1111/nph.15451, 2019. Katata, G.: Improvement of a land surface model for accurate pre- Galvagno, M., Wohlfahrt, G., Cremonese, E., Rossini, M., diction of surface energy and water balances, JAEA-Data/Code, Colombo, R., Filippa, G., Julitta, T., Manca, G., Siniscalco, C., 2008-033, 64, 2009. di Cella, U. M., and Migliavacca, M.: Phenology and carbon Katata, G. and Ota, M.: A terrestrial ecosystem model (SOLVEG) dioxide source/sink strength of a subalpine grassland in response coupled with atmospheric gas and aerosol exchange processes, to an exceptionally short snow season, Environ. Res. Lett., 8, JAEA-Data/Code, 2016-014, 35, 2017. 025008, https://doi.org/10.1088/1748-9326/8/2/025008, 2013. Katata, G., Kajino, M., Matsuda, K., Takahashi, A., and Nakaya, K.: Garcia-Pausas, J., Romanyà, J., Montanè, F., Rios, A. I., Taull, A numerical study of the effects of aerosol hygroscopic proper- M., Rovira, P., and Casals, P.: Are soil carbon stocks in moun- ties to dry deposition on a broad-leaved forest, Atmos. Environ., tain grasslands compromised by land-use changes? edited by: 97, 501–510, https://doi.org/10.1016/j.atmosenv.2013.11.028, Catalan, J., Ninot, J. M., Aniz, M., High Mountain Conserva- 2014. tion in a Changing World, Adv. Global Change Res., 207–230, Kattge, J. and Knorr, W.: The temperature dependence of photo- https://doi.org/10.1007/978-3-319-55982-7_9, 2017. synthetic capacity in a photosynthesis model acclimates to plant Gill, R. A., Kelly, R. H., Parton, W. J., Day, K. A., Jackson, R. growth temperature: a re-analysis of data from 36 species, Plant B., Morgan, J. A., Scurlock, J. M. O., Tieszen, L. L., Castle, J. Cell Environ., 30, 1176–1190, https://doi.org/10.1111/j.1365- V., Ojima, D. S., and Zhang, X. S.: Using simple environmen- 3040.2007.01690_x, 2007. tal variables to estimate belowground productivity in grasslands, Kolari, P., Lappalainen, H. K., Hänninen, H., and Hari, Glob. Ecol. Biogeogr., 11, 79–86, https://doi.org/10.1046/j.1466- P.: Relationship between temperature and the seasonal 822x.2001.00267.x, 2002. course of photosynthesis in Scots pine at northern timber- Gobiet, A., Kotlarski, S., Beniston, M., Heinrich, G., Rajczak, line and in southern boreal zone, Tellus B, 3, 542–552, J., and Stoffel, M.: 21st century climate change in the Euro- https://doi.org/10.3402/tellusb.v59i3.17033, 2007. pean Alps – a review, Sci. Total Environ., 493, 1138–1151, Körner, C.: Winter crop growth at low temperature may hold the https://doi.org/10.1016/j.scitotenv.2013.07.050, 2014. answer for alpine treeline formation, Plant Ecol. Divers., 1, 3– Hingerl, L., Kunstmann, H., Wagner, S., Mauder, M., Bliefer- 11, https://doi.org/10.1080/17550870802273411, 2008. nicht, J., and Rigon, R.: Spatio-temporal variability of water and energy fluxes? a case study for a mesoscale catchment www.biogeosciences.net/17/1071/2020/ Biogeosciences, 17, 1071–1085, 2020
1084                                                                   G. Katata et al.: Grassland C balance under warmer climate

Kozlowski, T. T.: Carbohydrate sources and sinks in woody plants,         Ota, M., Nagai, H., and Koarashi, J.: Root and dissolved or-
  Bot. Rev., 58, 107–122, https://doi.org/10.1007/BF02858600,               ganic carbon controls on subsurface soil carbon dynam-
  1992.                                                                     ics: A model approach, J. Geophys. Res., 118, 1646–1659,
Kumarathunge, D. P., Medlyn, B. E., Drake, J. E., Tjoelker, M. G.,          https://doi.org/10.1002/2013jg002379, 2013.
  Aspinwall, M. J., Battaglia, M., Cano, F. J., Carter, K. R., Cav-       Pepin, N., Bradley, R. S., Diaz, H. F., Baraer, M., Caceres, E. B.,
  aleri, M. A., Cernusak, L. A., Chambers, J. Q., Crous, K. Y.,             Forsythe, N., Fowler, H., Greenwood, G., Hashmi, M. .Z., Liu,
  De Kauwe, M. G., Dillaway, D. N., Dreyer, E., Ellsworth, D.               X. D., Miller, J. R., Ning, L., Ohmura, A., Palazzi, E., Rang-
  S., Ghannoum, O., Han, Q., Hikosaka, K., Jensen, A. M., Kelly,            wala, I., Schöner, W., Severskiy, I., Shahgedanova, M., Wang,
  J. W. G., Kruger, E. L., Mercado, L. M., Onoda, Y., Reich, P.             M. B., Williamson, S. N., and Yang, D. Q.: Elevation-dependent
  B., Rogers, A., Slot, M., Smith, N. G., Tarvainen, L., Tissue,            warming in mountain regions of the world, Nat. Clim. Chang., 5,
  D. T., Togashi, H. F., Tribuzy, E. S., Uddling, J., Vårhammar,            424–430, https://doi.org/10.1038/nclimate2563, 2015
  A., Wallin, G., Warren, J. M., and Way, D. A.: Acclimation and          Rabenhorst, M. C.: Biologic zero: a soil temperature con-
  adaptation components of the temperature dependence of plant              cept, Wetlands, 25, 616–621, https://doi.org/10.1672/0277-
  photosynthesis at the global scale, New Phytol., 222, 768–784,            5212(2005)025[0616:BZASTC]2.0.CO;2, 2005.
  https://doi.org/10.1111/nph.15668, 2019.                                Rapacz, M., Ergon, Å., Höglind, M., Jørgensen, M., Jur-
Leifeld, J., Meyer, S., Budge, K., Sebastia, M. T., Zimmermann,             czyk, B., Østrem, L., Rognli, O. A., and Tronsmo, A. M.:
  M., and Fuhrer, J. :Turnover of grassland roots in moun-                  Overwintering of herbaceous plants in a changing climate,
  tain ecosystems revealed by their radiocarbon signature: Role             Still more questions than answers, Plant Sci., 225, 34-44,
  of temperature and management, PLOS ONE, 10, e0119184,                    https://doi.org/10.1016/j.plantsci.2014.05.009, 2014.
  https://doi.org/10.1371/journal.pone.0119184, 2015.                     Riedo, M., Grub, A., Rosset, M., and Fuhrer, J.: A pasture sim-
Leuning, R.: Temperature dependence of two parameters in a                  ulation model for dry matter production, and fluxes of car-
  photosynthesis model, Plant Cell Environ., 25, 1205–1210,                 bon, nitrogen, water and energy, Ecol. Model., 105, 141–183,
  https://doi.org/10.1046/j.1365-3040.2002.00898.x, 2002.                   https://doi.org/10.1016/s0304-3800(97)00110-5, 1998.
Ma, X.-X., Yan, Y., Hong, J.-T., Lu, X.-Y., and Wang, X.-D.: Im-          Rogiers, N., Eugster, W., Furger, M., and Siegwolf, R.: Effect of
  pacts of warming on root biomass allocation in alpine steppe              land management on ecosystem carbon fluxes at a subalpine
  on the north Tibetan Plateau, J. Mt. Sci., 14, 25, 1615–1623,             grassland site in the Swiss Alps, Theor. Appl. Climatol., 80, 187–
  https://doi.org/10.1007/s11629-016-3966-7, 2017.                          203, https://doi.org/10.1007/s00704-004-0099-7, 2005.
Marcolla, B., Cescatti, A., Manca, G., Zorer, R., Cavagna, M.,            Sage, R. F. and Kubien, D. S.: The temperature response of C3
  Fiora, A., Gianelle, D., Rodeghiero, M., Sottocornola, M., and            and C4 photosynthesis, Plant Cell Environ., 30, 1086–1106,
  Zampedri, R.: Climatic controls and ecosystem responses drive             https://doi.org/10.1111/j.1365-3040.2007.01682.x, 2007.
  the inter-annual variability of the net ecosystem exchange of           Schapendonk, A. H. M. C., Stol, W., van Kraalingen, D. W. G.,
  an alpine meadow, Agr. Forest Meteorol., 151, 1233–1243,                  and Bouman, B. A. M.: LINGRA – a source/sink model to simu-
  https://doi.org/10.1016/j.agrformet.2011.04.015, 2011.                    late grassland productivity in Europe, Eur. J. Agron., 9, 87–100,
Mauder, M., Cuntz, M., Drüe, C., Graf, A., Rebmann, C.,                     https://doi.org/10.1016/s1161-0301(98)00027-6, 1998.
  Schmid, H. P., Schmidt, M., and Steinbrecher, R.: A strat-              Scholz, K., Hammerle, A., Hiltbrunner, E., and Wohlfahrt, G.: An-
  egy for quality and uncertainty assessment of long-term eddy-             alyzing the effects of growing season length on the net ecosys-
  covariance measurements, Agr. Forest Meteorol., 169, 122–135,             tem production of an Alpine grassland using model-data fusion,
  https://doi.org/10.1016/j.agrformet.2012.09.006, 2013.                    Ecosystems, 21, 982–999, https://doi.org/10.1007/s10021-017-
Mediavilla, S., González-Zurdo, P., Babiano, J., and Escudero,              0201-5, 2018.
  A.: Responses of photosynthetic parameters to differences in            Smith, N. G. and Dukes, J. S.: Plant respiration and pho-
  winter temperatures throughout a temperature gradient in two              tosynthesis in global-scale models: incorporating acclimation
  evergreen tree species, Eur. J. Forest Res., 135, 871–883,                to temperature and CO2 , Glob. Change Biol., 19, 45–63,
  https://doi.org/10.1007/s10342-016-0980-9, 2016.                          https://doi.org/10.1111/j.1365-2486.2012.02797.x, 2013.
Merbold, L., Steinlin, C., and Hagedorn, F.: Winter greenhouse            Soussana, J. F., Maire, V., Gross, N., Bachelet, B., Pages, L., Martin,
  gas fluxes (CO2 , CH4 and N2 O) from a subalpine grassland,               R., Hill, D., and Wirth, C.: Gemini: A grassland model simulat-
  Biogeosciences, 10, 3185–3203, https://doi.org/10.5194/bg-10-             ing the role of plant traits for community dynamics and ecosys-
  3185-2013, 2013.                                                          tem functioning. Parameterization and evaluation, Ecol. Model.,
Monteith,       J.     L.:      Evaporation      and        Surface-        231, 134–145, https://doi.org/10.1016/j.ecolmodel.2012.02.002,
  Temperature, Q. J. Roy. Meteor. Soc., 107, 1–27,                          2012.
  https://doi.org/10.1002/qj.49710745102, 1981.                           Tuba, Z., Csintalan, Z., Szente, K., Nagy, Z., Fekete, G.,
Nagai, H.: Atmosphere-soil-vegetation model including CO2 ex-               Larcher, W., and Lichtenthaler, H. K.: Winter photo-
  change processes: SOLVEG2, JAERI-Data/Code, 2004-014,                     synthetic activity of twenty temperate semi-desert sand
  2004.                                                                     grassland species, J. Plant Physiol., 165, 1438–1454,
Oleson, K. W., Lawrence, D. M., Bonan, G. B., Flanner, M. G.,               https://doi.org/10.1016/j.jplph.2007.10.017, 2008.
  Kluzek, E., Lawrence, P. J., Levis, S., Swenson, S. C., and Thorn-      Tubiello, F. N., Soussana, J.-F., and Howden, S. M.: Crop and pas-
  ton, P. E.: Technical description of version 4.0 of the Commu-            ture response to climate change, P. Natl. Acad. Sci. USA, 104,
  nity Land Model (CLM), NCAR Technical Note NCAR/TN-                       19686–19690, https://doi.org/10.1073/pnas.0701728104, 2007.
  461+STR, National Center for Atmospheric Research (NCAR),
  Boulder, CO, 257, https://doi.org/10.5065/D6FB50WZ, 2010.

Biogeosciences, 17, 1071–1085, 2020                                                              www.biogeosciences.net/17/1071/2020/
You can also read