The friagem event in the central Amazon and its influence on micrometeorological variables and atmospheric chemistry
←
→
Page content transcription
If your browser does not render page correctly, please read the page content below
Atmos. Chem. Phys., 21, 339–356, 2021
https://doi.org/10.5194/acp-21-339-2021
© Author(s) 2021. This work is distributed under
the Creative Commons Attribution 4.0 License.

The friagem event in the central Amazon and its influence on
micrometeorological variables and atmospheric chemistry
Guilherme F. Camarinha-Neto1 , Julia C. P. Cohen1,2 , Cléo Q. Dias-Júnior3 , Matthias Sörgel4,a ,
José Henrique Cattanio1,2 , Alessandro Araújo5 , Stefan Wolff4,b , Paulo A. F. Kuhn1 , Rodrigo A. F. Souza6 ,
Luciana V. Rizzo7 , and Paulo Artaxo8
1 Postgraduate   Program on Environmental Sciences – PPGCA, Federal University of Pará (UFPA), Belém, PA, Brazil
2 Faculty  of Meteorology, Federal University of Pará (UFPA), Belém, PA, Brazil
3 Department of Physics, Federal Institute of Pará (IFPA), Belém, PA, Brazil
4 Biogeochemistry Department, Max Planck Institute for Chemistry, P.O. Box 3060, 55020 Mainz, Germany
5 Empresa Brasileira de Pesquisa Agropecuária (EMBRAPA), Belém, PA, Brazil
6 Department of Meteorology, Amazonas State University (UEA), Manaus, Amazonas, Brazil
7 Department of Environmental Sciences, Institute of Environmental, Chemical and Pharmaceutics Sciences,

Universidade Federal de São Paulo (UNIFESP), São Paulo, São Paulo, Brazil
8 Institute of Physics, University of São Paulo (USP), São Paulo, São Paulo, Brazil
a currently at: Atmospheric Chemistry Department, Max Planck Institute for Chemistry,

P.O. Box 3060, 55020 Mainz, Germany
b currently at: Multiphase Chemistry Department, Max Planck Institute for Chemistry,

P.O. Box 3060, 55020 Mainz, Germany

Correspondence: Cléo Q. Dias-Júnior (cleo.quaresma@ifpa.edu.br)

Received: 7 June 2020 – Discussion started: 14 July 2020
Revised: 18 November 2020 – Accepted: 21 November 2020 – Published: 14 January 2021

Abstract. In the period between 9 and 11 July 2014, a          intensifies the local circulations, such as the breeze phenom-
friagem event reached the Amazon region. On 11 July, the       ena. In the Manaus region and at the ATTO site, the main
southwest flow related to the friagem converged with the       effects of the friagem event are a decrease in the incoming
easterly winds in the central Amazon. The interaction be-      solar radiation (due to intense cloud formation), a large tem-
tween these two distinct air masses formed a convection        perature drop and a distinct change in surface O3 and CO2
band, which intensified over the Manaus region and the Ama-    mixing ratios. As the cold air of the friagem was just in the
zon Tall Tower Observatory (ATTO) site. The satellite im-      lower 500 m the most probable cause of this change is that a
ages show the evolution of convective activity on 11 July,     cold pool above the forest prevented vertical mixing causing
which led to 21 mm of precipitation at the ATTO site. More-    accumulation of CO2 from respiration and very low O3 mix-
over, the arrival of the friagem caused a sudden drop in       ing ratio due to photochemistry reduction and limited mixing
temperature and a predominance of southerly winds, which       within the boundary layer.
could be seen in Porto Velho between 7 and 8 July and in
Manaus and the ATTO site from 9 to 11 July. The results of
ERA-Interim reanalysis and Brazilian developments on the
Regional Atmospheric Modeling System (BRAMS) simula-           1   Introduction
tions show that this friagem event coming from the south-
west, carries a mass of air with higher O3 and NO2 mixing      The Amazon region suffers from the incursion of cold waves
ratios and lower CO mixing ratio compared to the air masses    from the high latitudes of the Southern Hemisphere (SH),
present in the central Amazon. At Lake Balbina, the friagem    with a relatively common occurrence mainly in the less rainy
                                                               season, between June and September. These events are de-

Published by Copernicus Publications on behalf of the European Geosciences Union.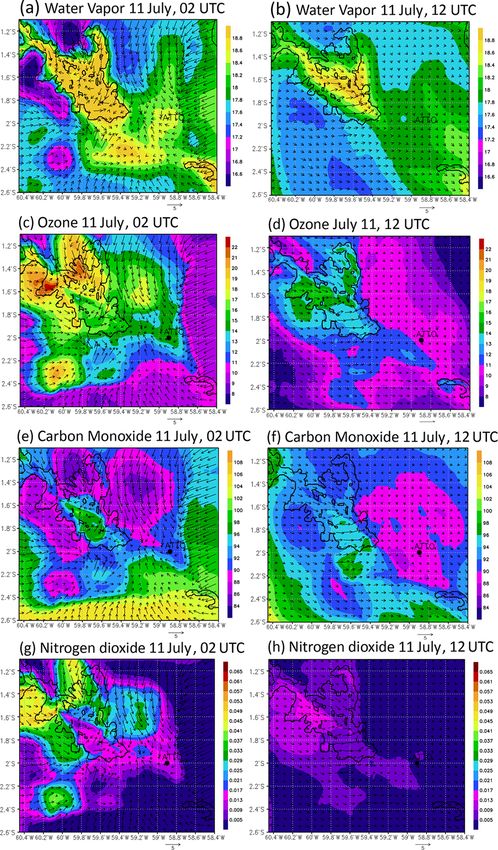
340                                G. F. Camarinha-Neto et al.: Friagem event and atmospheric chemistry in the Amazon

nominated locally and in literature as friagem, and about          nomenon on the local circulation dynamics and its role in the
70 % of the cases of friagem occur in this period of the year      dispersion of trace gases at the ATTO site and Lake Balbina.
(Brinkmann and Ribeiro, 1972; Marengo et al., 1997; Fisch
et al., 1998; de Oliveira et al., 2004; Caraballo et al., 2014;
Ricarte et al., 2015; Viana and Herdies, 2018). Brinkmann          2     Data and methodology
and Ribeiro (1972) observed two to three friagem events per
                                                                   2.1    Study area
year, predominantly in the less rainy season, in the central
Amazon. This was one of the first studies to explore frontal       The Sustainable Development Reserve (SDR) of Uatumã,
system (FS) interference in central Amazon.                        São Sebastião do Uatumã county, where the ATTO site is
   Silva Dias et al. (2004) showed that the arrival of a friagem   located (02◦ 080 3800 S, 59◦ 000 0700 W), is about 140 km north-
event in the west of the Amazon generates a pressure gradi-        east of Manaus in the state of Amazonas, Brazil. The village
ent force whose direction is opposite to the trade winds, thus     of Balbina, in Presidente Figueiredo county as well as the
causing a weakening of these winds. These authors observed         Balbina Dam lake (01◦ 520 S, 59◦ 300 W), are located to the
that the weakening of the trade winds enables the develop-         northwest of the ATTO site (Fig. 1). The ATTO site is struc-
ment of vigorous local circulations in the region of Santarém      tured in a dense terra firme forest, where plateaus prevail,
(PA).                                                              with a maximum elevation of 138 m (Andreae et al., 2015).
   Moura et al. (2004), who used data collected on the shores      The artificial lake of Balbina is a flooded area of approxi-
of Lake Balbina (central Amazon), concluded that without           mately 1700 km2 , with an average depth of 10 m (Kemenes
the influence of large-scale flow it is possible to observe the    et al., 2007).
dynamics of breeze circulations influencing the ozone (O3 )           Additionally, near-surface measurements of O3 made
mixing ratio with more clarity. According to these authors,        at the T2 (03◦ 080 2000 S, 60◦ 070 5300 W), T3 (03◦ 120 4900 S,
the O3 mixing ratio changes are larger when the flow occurs        60◦ 350 5500 W) and the forest site T0z (02◦ 360 3300 S,
in the direction from the lake to the forest, that is, during      60◦ 120 3300 W) experimental sites, at distances of 8, 70 and
the occurrence of the lake breeze. Trebs et al. (2012), using      60 km from Manaus, respectively, were used (Fig. 1). These
data from central Amazon region, concluded that the trans-         sites were deployed in the Observations and Modeling of
port and dispersion of O3 mixing ratio are strongly affected       the Green Ocean Amazon (GoAmazon2014/5) experiment
by local wind systems, such as the breeze.                         (Martin et al., 2016). Due to its location, site T2 is heavily
   Marengo et al. (1997) compared the effects of the friagem       impacted by the Manaus urban plume as well as emissions
at Manaus (central Amazon) and Ji-Paraná (south of the             from brick factories and to a minor extent by local pollution
Amazon River), which are around 1200 km apart. They ob-            sources such as shipping or burning of household waste and
served that the friagem was strongly modified during its pas-      wood near the site (Martin et al., 2016). Site T3 is typically
sage over the Amazon basin. For example, the lower tem-            downwind of Manaus city, influenced by urban air masses
peratures in Ji-Paraná could be associated with cold air ad-       38.5 % of the time (Trebs et al., 2012; Martin et al., 2016;
vection, whereas in Manaus they were mainly caused by re-          Thalman et al., 2017). Site T0z, typically upwind of Man-
duced solar radiation due to increased cloudiness (Viana and       aus (Rizzo et al., 2013), is situated in the Cuieiras Biological
Herdies, 2018).                                                    Reserve (ZF2) which has been a central part of Amazonian
   Several studies have already shown the effect of the            ecology and climate studies for over 20 years (Araújo et al.,
friagem on the surface meteorological components (Fisch,           2002). In contrast to T2 and T3, the T0z site is subject to min-
1996; Marengo et al., 1997; Fisch et al., 1998; Moura et al.,      imal anthropogenic interference. These five sites will enable
2004; Silva Dias et al., 2004). However, we are not aware          us to better understand the role of friagem at near-surface O3
of any study investigating the accompanied changes in trace        levels in different parts of the central Amazon, some of them
gas concentrations and atmospheric chemistry in the Ama-           in the Manaus pollution plume (Cirino et al., 2018).
zon basin. Besides that, it is known that the presence of
the friagem phenomenon can alter the conditions of the lo-         2.2    Data
cal microclimate, providing the opportunity to better under-
stand the dynamics of local circulations pattern and, conse-       A friagem event that occurred between 9 and 11 July 2014 in
quently, influence local measurements carried out in Amazo-        the region of the ATTO experimental site was identified and
nian ecosystems, since they also cause the weakening of the        used as a case study. The two main motivations for choos-
predominant large-scale (trade) winds blowing from the east        ing this period were that (i) July is one of the months with
in the study region (Silva Dias et al., 2004).                     the largest number of cold fronts that arrive in the south–
   Therefore, the objective of this study is to investigate the    southeastern region of Brazil, and consequently, July is also
effects of friagem on micrometeorological variables mea-           a month with a high number of friagem events in the Ama-
sured in the Manaus region and in the forest region of             zon region (Prince and Evans, 2018). (ii) Throughout 2014,
the Amazon Tall Tower Observatory (ATTO) site (Andreae             the intensive activities of the GoAmazon project took place
et al., 2015), as well as to evaluate the influence of this phe-   (Martin et al., 2016); that is, measurements of gases and ther-

Atmos. Chem. Phys., 21, 339–356, 2021                                                  https://doi.org/10.5194/acp-21-339-2021
G. F. Camarinha-Neto et al.: Friagem event and atmospheric chemistry in the Amazon 341
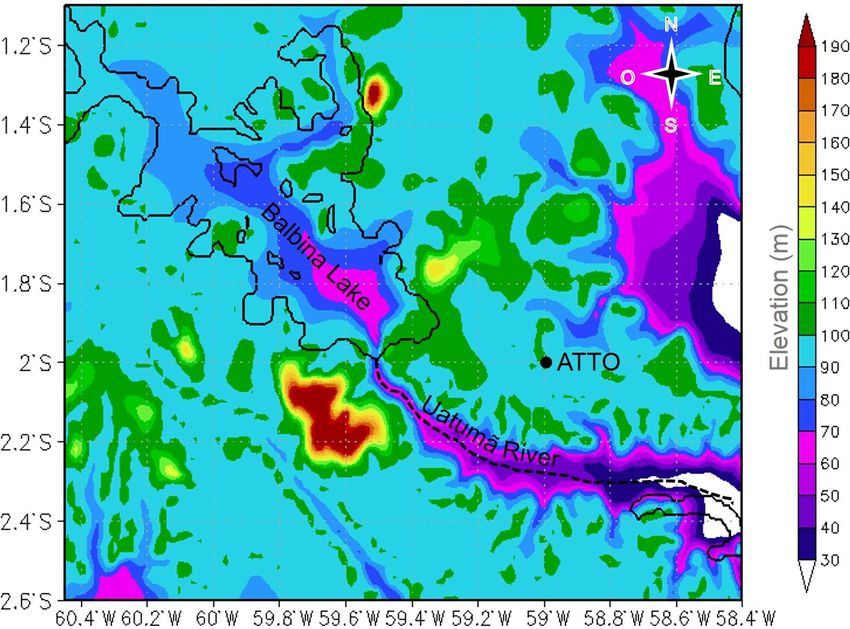
Figure 1. Google Earth map of the location of the ATTO site, Lake Balbina, T2, T3 and T0z (white circles). The dashed red line indicates
the distance from the ATTO site in relation to Lake Balbina and the city of Manaus (copyright: © Google Maps). The yellow lines represent
the roads and the blue lines represent the network of the rivers in this region.
modynamics of the atmosphere were carried out in various The data acquisition at the tower was performed by
sites investigated in this work (T2, T3 and T0z). We also CR1000 and CR3000 data loggers (Campbell Scientific Inc.,
emphasize that the month of July 2014 did not show sig- USA), with instantaneous measurements taken every minute
nificant changes in precipitation and air temperature in re- for meteorological variables and at high frequency for CO2
lation to other years’ July months. In addition, in 2014, there (10 Hz) and O3 (30 s) mixing ratios, and subsequently pro-
were no El Niño and La Niña phenomena (http://climanalise. cessed every 30 min. The variables used in this study and
cptec.inpe.br/~rclimanl/boletim/pdf/pdf14/jul14.pdf, last ac- their respective sensors are presented in more detail in Ta-
cess: 7 April 2020). ble 1.
The data were collected at the ATTO site and at the inter- The O3 data at the T3 site were obtained as part of the US
national airports of Manaus (03◦ 020 0800 S, 60◦ 020 4700 W) and Department of Energy Atmospheric Radiation Measurement
Porto Velho (08◦ 420 5000 S, 63◦ 530 5400 W) for July 2014. Air Program (ARM; http://www.arm.gov/measurements, last ac-
temperature data, as well as wind direction and wind speed, cess: 7 April 2020) during the GoAmazon 2014/5 project
in 30 min intervals were obtained from airport weather sta- (Martin et al., 2016). O3 mixing ratios were measured with
tions. The cities of Porto Velho (about 930 km southwest of an ultraviolet gas analyzer (TEI 49i model, Thermo Elec-
the ATTO site) and Manaus (about 150 km southwest of the tron Corp, USA). The instrument was installed at a height of
ATTO site) were chosen with the purpose of evaluating the 3.5 m above the ground (Dias-Júnior et al., 2017). At T2 and
impacts of the advance of the friagem towards the region of T0z, O3 mixing ratios were also measured with the same an-
the ATTO site. alyzer model (Thermo 49i) at a height of 12 and 39 m a.g.l.,
The ATTO site’s air temperature, wind speed, wind di- respectively.
rection, incident shortwave radiation and precipitation were The O3 measurements were performed at different heights
measured at the 81 m high walk-up tower (02◦ 080 3900 S, at the sites investigated here. These heights may affect the ob-
58◦ 590 5900 W) at different heights (see Table 1). CO2 and served O3 concentrations in some cases, due to the process of
O3 measurements were taken at 81 and 79 m above ground, dry deposition onto available surfaces and stomatal uptake by
respectively. The measurements of CO2 and O3 mixing ra- vegetation. In the case of the T2 and T3 sites, which are not
tios were conceived, respectively, by an infrared gas analyzer forest sites, the measurement height may not have a signifi-
(IRGA, LI-7500A model, LI-COR Inc., USA) and an ultra- cant influence on O3 concentrations during the day in a well-
violet gas analyzer (TEI 49i model, Thermo Electron Corp, mixed boundary layer. At forest sites, previous studies have
USA). shown a significant O3 vertical gradient inside the canopy,
especially in its lowest half part (Rummel et al., 2007; Freire
https://doi.org/10.5194/acp-21-339-2021 Atmos. Chem. Phys., 21, 339–356, 2021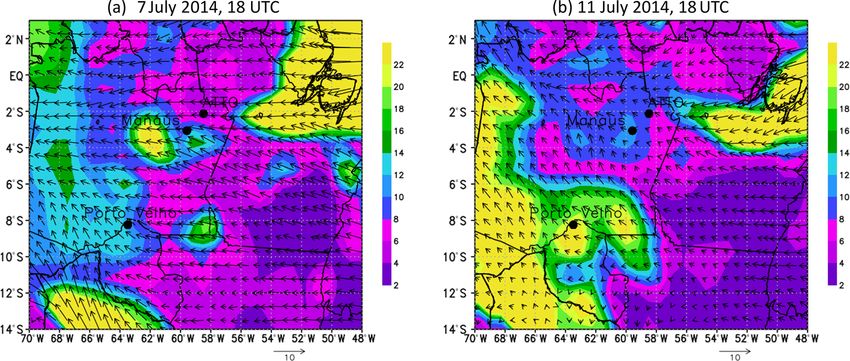
342                                  G. F. Camarinha-Neto et al.: Friagem event and atmospheric chemistry in the Amazon

Table 1. Variables used in this study, their respective measuring instruments and height in the micrometeorological tower at the ATTO site.

                             Variables            Instruments                                          Height
                             Air temperature      Thermo-hygrometer                                    81 m
                                                  (CS215, Campbell Scientific, USA)
                             Wind speed           2-D sonic anemometer                                 73 m
                             and direction        (Windsonic, Gill Instruments Ltd., UK)
                             Incident short-      Pyranometer                                          75 m
                             wave radiation       (CMP21, Kipp and Zonen, the Netherlands)
                             Rainfall             Pluviometer                                          81 m
                                                  (TB4, Hydrological Services Pty. Ltd., Australia)
                             CO2 mixing ratio     Infrared gas analyzer                                81 m
                                                  (IRGA, LI-7500/LI-7200, LI-COR Inc., USA)
                             O3 mixing ratio      Ultraviolet gas analyzer                             79 m
                                                  (TEI 49i, Thermo Electron Corp., USA)

et al., 2017). However, the reported O3 measurements at T0z
and ATTO were taken above the canopy, where vertical gra-
dients are expected to be close to zero if the boundary layer
is well mixed.
   The European Centre for Medium-Range Weather Fore-
casts (ECMWF) ERA-Interim reanalysis was used at inter-
vals of 6 h, with the objective of evaluating the evolution of
the friagem event investigated in this work. The ERA-Interim
model and the ECMWF reanalysis system present spatial res-
olution with 60 vertical levels, harmonic spherical represen-
tation for the basic dynamic fields and a reduced Gaussian
grid with uniform spacing of approximately 79 km for the
surface (Berrisford et al., 2011). Furthermore, enhanced im-
ages of the infrared channel of the GOES 13 satellite were
used, with the purpose of analyzing the formation and pas-
sage of convective systems in the study area.
                                                                        Figure 2. Domain of the grid used in JULES-CCATT-BRAMS sim-
2.3   Experimental design                                               ulation showing the distribution of the topography (m) and location
                                                                        of Lake Balbina (black line), the ATTO site (black point) and Ua-
The numerical simulations of the present study were made                tumã River (dashed line).
using the BRAMS (Brazilian developments on the Regional
Atmospheric Modeling System) mesoscale model version
5.3 (Freitas et al., 2017). BRAMS represents a Brazilian ver-           on z. The vertical grid resolution was variable with the ini-
sion of the Regional Atmospheric Modeling System (RAMS)                 tial vertical spacing of 50 m, increasing by a factor of 1.1 up
(Cotton et al., 2003) adapted to tropical conditions. This              to the 1.2 km level, and from that point forward this spacing
version of BRAMS contains the coupling of the JULES                     was constant to the top of the model (around 16 km). The do-
(Joint UK Land Environment Simulator) (Best et al., 2011;               main covered by this grid, the distribution of the main rivers
Clark et al., 2011) and CCATT (Coupled Chemistry-Aerosol-               and topography can be observed in Fig. 2.
Tracer Transport) models (Longo et al., 2010; Freitas et al.,              The initialization of the model was heterogeneous, us-
2009), making BRAMS a new and fully coupled numerical                   ing the ECMWF ERA-Interim reanalysis (https://www.
system of atmosphere–biosphere–chemical modeling, called                ecmwf.int/en/forecasts/dataset/ecmwf-reanalysis-v5, last ac-
JULES-CCATT-BRAMS (Moreira et al., 2013).                               cess: 7 April 2020) every 6 h in a 0.25◦ spatial resolution.
   The integration time of the model was 72 h, starting at              Seven soil layers were defined up to the depth of 12.25 m and
00:00 UTC on 9 July 2014. The numerical experiment was                  the assumed soil humidity was heterogeneous, as described
performed using only a grid whose horizontal resolution was             in Freitas and Freitas (2006). Soil texture data were originally
1.5 km, with 185 points on x, 140 points on y and 39 points             obtained from the Food and Agriculture Organization of the

Atmos. Chem. Phys., 21, 339–356, 2021                                                        https://doi.org/10.5194/acp-21-339-2021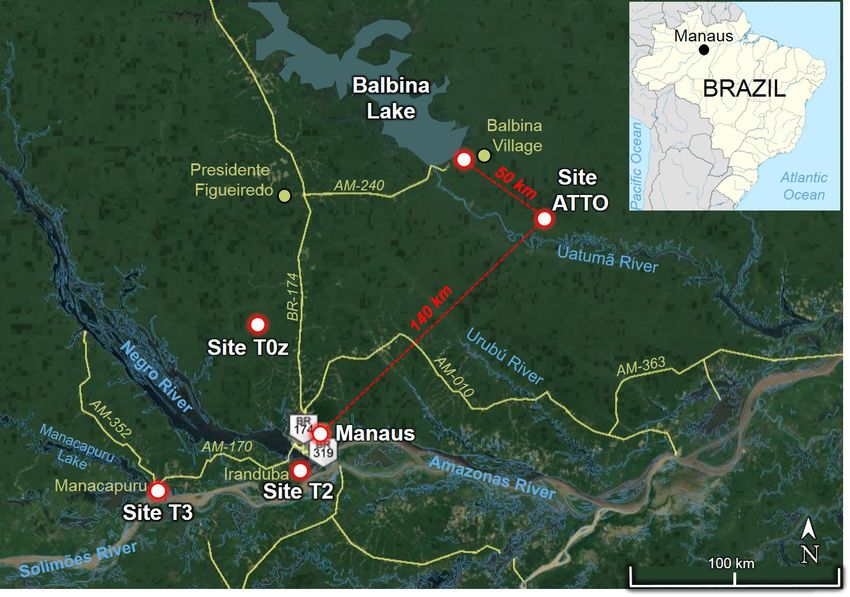
G. F. Camarinha-Neto et al.: Friagem event and atmospheric chemistry in the Amazon                                             343

United Nations (UN FAO) and were adapted for the Brazilian         just as the dominant wind direction changed to south in all
territory by Instituto Nacional de Pesquisas Espaciais (INPE)      western regions of the state of Amazonas, as well as to the
(Rossato et al., 2004).                                            southern regions of Manaus and the ATTO site (Fig. 3c, d).
   In this simulation, cloud microphysics uses the Thomp-          On 10 July, the southerly winds arrived in the Manaus re-
son cloud water single-moment formulation, which consists          gion and the ATTO site, characterizing the arrival of friagem
of the separate treatment of five classes of water that are then   in the area of interest of this work (Fig. 3e, f). For this pe-
mixed in a single treatment for each type of cloud (Thompson       riod, the Centro de Previsão do Tempo e Estudos Climáticos
et al., 2008; Thompson and Eidhammer, 2014). In addition,          (CPTEC) technical bulletin reported the penetration of a po-
it includes the activation of aerosols in the cloud condensa-      lar air mass in the subtropical and tropical Brazilian regions
tion nuclei (CCN) and ice nuclei (IN); thus, it predicts the       that advanced in the southeast–northwest of Brazil, giving
concentration of the number of water droplets in the clouds,       origin to the cold waves of the south, as well as causing
as well as the concentrations of two new aerosol variables,        the friagem phenomenon in the Amazon (http://tempo.cptec.
one for CCN and one for IN. These variables are grouped            inpe.br/boletimtecnico/pt, last access: 7 April 2020).
into hygroscopic aerosols called “water friendly” and non-            Therefore, the arrival of the friagem phenomenon in the
hygroscopic aerosols are “ice friendly” (Freitas et al., 2017).    Amazon region is characterized by the change in the wind
   The parameterization of the long- and shortwave radia-          direction in the southwest and central regions of the Ama-
tion used was CARMA (Community Aerosol and Radiation               zon and by abrupt drops in the values of temperature, espe-
Model for Atmospheres) (Toon et al., 1989). This scheme            cially in the southwest. Similar results were also found by
solves the radiative transfer using the two-flux method and        other authors (Fisch, 1996; Marengo et al., 1997; Fisch et al.,
includes the main molecular absorbers (water vapor, CO2 ,          1998; de Oliveira et al., 2004; Ricarte et al., 2015; Viana and
O3 and O2 ) and treats the gas absorption coefficients using       Herdies, 2018).
an exponential sum formula (Toon et al., 1989). The JULES-            The wind behavior throughout the Amazon basin before
CCATT-BRAMS radiation schemes are coupled online with              and during the friagem event is represented in Fig. 3a and
the cloud and aerosol microphysics models to provide simu-         f, respectively. Interestingly, at the time the friagem was
lations of aerosol–cloud–radiation interaction (Freitas et al.,    present in the Manaus and ATTO site regions, there was con-
2017). The physical and optical properties of the cloud in the     vergence of the easterly winds with the westerly flow as-
radiative scheme of CARMA were parameterized according             sociated with the friagem (Fig. 3f). The easterly flow car-
to Sun and Shine (1994), Savijärvi et al. (1997) and Savi-         ries humidity from the Atlantic coast to the central region
järvi and Räisänen (1998) using liquid and ice water content       of the Amazon, while the southerly flow, associated with the
profiles provided by the JULES-CCATT-BRAMS cloud mi-               friagem event, transports masses of dry and cold air from
crophysics scheme (Freitas et al., 2017).                          high latitudes to the Amazon region (Marengo et al., 1997).
                                                                      Figure 4 shows the satellite images before and during the
                                                                   friagem event in the central Amazon. Convection in the con-
3     Results and discussion                                       fluence between Amazonas and Tapajós rivers region was
                                                                   observed at dawn, on 11 July at 07:00 UTC (Fig. 4a). This
3.1    Environmental characteristics in the Amazon basin           convection propagated in the western direction, arriving in
       scale                                                       the ATTO site region at 13:00 UTC (Fig. 4c). Since this con-
                                                                   vective system is not associated with the squall lines that
From the ECMWF ERA-Interim reanalysis, the evolution of            form along the coast (Cohen et al., 1995; Alcântara et al.,
the horizontal wind and air temperature near the surface, in       2011; Melo et al., 2019), it is possible to state that this con-
the north region of Brazil, between 6 and 11 July 2014, at         vection has its formation associated with the convergence of
12:00 UTC (local time equal to 00:00 UTC − 4 h) (Fig. 3) can       these two air masses with different properties (Fig. 3f). It is
be obtained. On 6 July, it is observed that the mean temper-       noteworthy that during the propagation of this convection on
ature was of the order of 24 ◦ C in three places of interest of    11 July, it intensified and caused the highest rainfall (starting
this work: Porto Velho, Manaus and the ATTO site (Fig. 3a).        at 12:30 UTC) registered at the ATTO site during the month
The dominant wind direction was from the east in practically       of July 2014, with a record rainfall of 21 mm.
the entire Amazon region. The surface temperature and wind            The evolution of the horizontal wind and O3 mixing ratio
direction represent the standard normally found in this re-        near the surface (both from ECMWF ERA-Interim reanaly-
gion (Fisch et al., 1998; Pöhlker et al., 2019). However, on       sis), during 7 and 11 July 2014, at 18:00 UTC, can be seen in
7 July, the dominant wind direction becomes south–southeast        Fig. 5. From 7 July onward, the friagem event carried air rich
in the region of Porto Velho, as is evidenced by the presence      in O3 from southeastern Brazil (not shown here) northwards
of a mass of air with a lower temperature (around 18 ◦ C) ap-      (Fig. 5a). This air mass reached the state of the Amazonas on
proaching this city (Fig. 3b).                                     8 July (not shown here). On 11 July at 12:00 UTC (not shown
   Over the course of the days, between 8 and 9 July, the          here), the air mass influenced by the friagem had the short-
mass of cold air advanced even more towards Porto Velho,           est distance from the study region (ATTO site). On 11 July

https://doi.org/10.5194/acp-21-339-2021                                                Atmos. Chem. Phys., 21, 339–356, 2021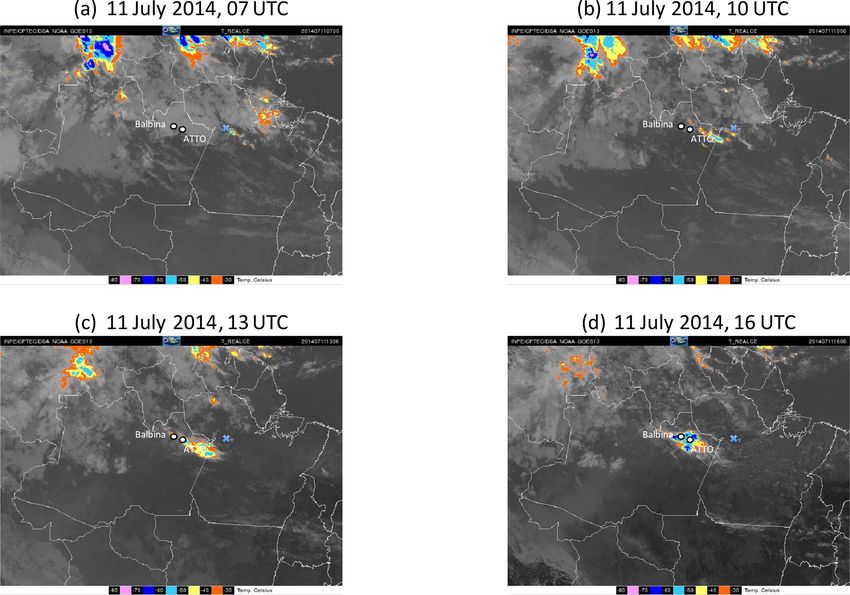
344                                   G. F. Camarinha-Neto et al.: Friagem event and atmospheric chemistry in the Amazon

Figure 3. Distribution of air temperature (◦ C, shaded) and wind (m s−1 , vector) at the surface, in the localities of Porto Velho, Manaus and
the ATTO site, at 12:00 UTC between 6 and 11 July 2014 obtained with the ERA-Interim reanalysis. Grey arrows indicate the predominant
wind flow and the dashed circle highlights the region of convergence of the winds in the Manaus and ATTO regions.

at 18:00 UTC, the friagem began to dissipate (Fig. 5b). How-             of limited photochemical production. The rainforest canopy
ever, it should be noted that this mass of air rich in O3 did            is a strong sink for ozone (Jacob and Wofsy, 1990; Fan et al.,
not reach the Manaus region and the ATTO site. It is believed            1990; Rummel et al., 2007). Therefore, the low O3 mixing
that the presence of the cloud cover in central Amazonia on              ratio in the Manaus region and the ATTO site during 11 July
11 July (Fig. 4), formed by the convergence of air (friagem              (Fig. 5f) would be associated with cloudiness and prolonged
and eastern winds), had an inhibitory effect on O3 forma-                transport over forested regions.
tion (Betts et al., 2002). As O3 deposition prevailed, a net                Marengo et al. (1997) investigated the two strongest
loss of ozone is expected during transport under conditions              friagem events that occurred during the year 1994, on 26 June

Atmos. Chem. Phys., 21, 339–356, 2021                                                         https://doi.org/10.5194/acp-21-339-2021
G. F. Camarinha-Neto et al.: Friagem event and atmospheric chemistry in the Amazon                                                     345

Figure 4. Enhanced images of the GOES 13 satellite in the infrared channel on 11 July 2014 at (a) 07:00 UTC, (b) 10:00 UTC, (c) 13:00 UTC
and (d) 16:00 UTC, which is openly accessible (http://satelite.cptec.inpe.br/acervo/goes.formulario.logic?i=br, last access: 7 April 2020),
including the approximate locations of the ATTO site and Lake Balbina (white circles) and the confluence region of the Amazon and Tapajós
rivers (blue X).

Figure 5. Surface wind (m s−1 , vectors) and ozone (ppbv, contour) on (a) 7 and (b) 11 July 2014 at 18:00 UTC, highlighting the Porto Velho,
Manaus and ATTO sites obtained with the ERA-Interim reanalysis.

https://doi.org/10.5194/acp-21-339-2021                                                      Atmos. Chem. Phys., 21, 339–356, 2021
346 G. F. Camarinha-Neto et al.: Friagem event and atmospheric chemistry in the Amazon
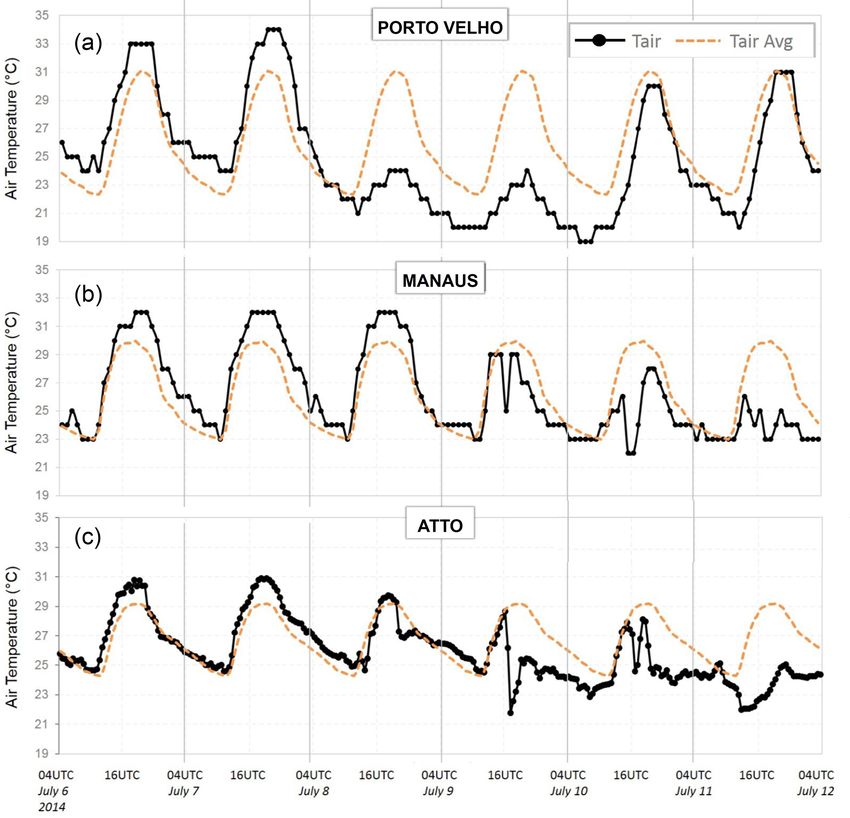
Figure 6. Daily cycle (black line) and monthly average (orange line) of the observational air temperature data from 6 to 11 July 2014, in
(a) Porto Velho, (b) the Manaus region and (c) the ATTO site.
and 10 July. They did not show the impact of friagem on O3 ATTO site around 1 d after the temperature drop observed in
levels but showed that for both events the main consequence Porto Velho.
of the friagem in the city of Manaus was greater cloud cover In Porto Velho, both the maximum and minimum values of
and consequently less solar radiation reaching the surface, air temperature were substantially reduced during the pres-
which was the main cause of the drop in air temperature, ence of the friagem. However, in the Manaus region and at
corroborating part of the results found here (Figs. 3, 4 and the ATTO site, the decrease was mainly observed in the max-
6). imum temperature values. Although the decrease was not so
evident at the time of the diurnal minimum (at least on 10 and
11 July), the whole diurnal cycle was disturbed with (much
3.2 Air temperature during the friagem event
lower) minima than the average at different times of the day.
Similar behavior was observed by Marengo et al. (1997)
Figure 6 shows the air temperature values near the surface in for the southwest and central Amazon regions during an
Porto Velho (Fig. 6a), the Manaus region (Fig. 6b) and above episode of the friagem. Therefore, it is noted that due to the
the forest canopy at the ATTO site (Fig. 6c), between 6 and occurrence of the friagem, the southernmost regions of the
11 July 2014 (black line), together with the air temperature Amazon present more intense reductions in temperature val-
hourly average for the month of July 2014 (orange line). In ues, compared to the regions located more in the center of
Porto Velho, the difference between the maximum mean air the Amazon basin.
temperature (maximum average daily cycle value) and the Additionally, the ATTO site is located in a forest region,
maximum air temperature during the friagem (8 July) was 58 km from the Balbina Dam lake, and the Manaus region
7 ◦ C (from 31 to 24 ◦ C), whilst in the Manaus region and is under the influence of intense urbanization (de Souza and
at the ATTO site the differences were of the order of 4 ◦ C Alvalá, 2014) and is located in the proximity of rivers. Thus,
(from 30 to 26 and 29 to 25 ◦ C, respectively) during 11 July. there is evidence that both the ATTO site and Manaus region
The temperature started to fall in the Manaus region and the
Atmos. Chem. Phys., 21, 339–356, 2021 https://doi.org/10.5194/acp-21-339-2021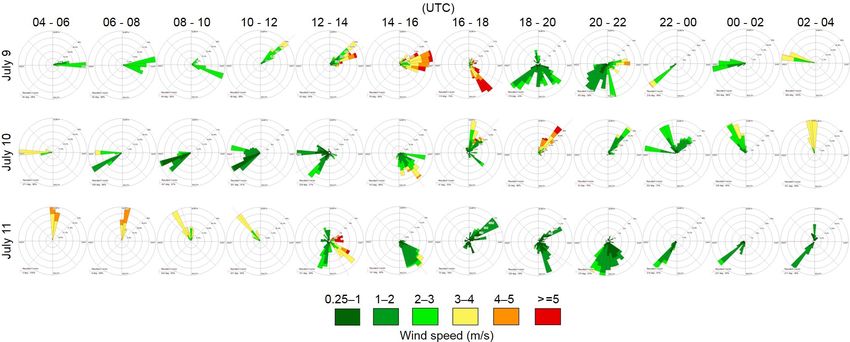
G. F. Camarinha-Neto et al.: Friagem event and atmospheric chemistry in the Amazon                                           347

may be under the influence of lake (Moura et al., 2004) and       respectively, does not correspond to the expected direction
river breezes (dos Santos et al., 2014), respectively, which      during the occurrence of the forest breeze towards Lake Bal-
could offer them greater thermal inertia.                         bina, which should be from east to southeast. Therefore, it
                                                                  is believed that the flow related to the friagem phenomenon
3.3   ATTO site wind direction                                    overlapped with that of the breeze circulation observed by
                                                                  Moura et al. (2004), or that the forest–lake breeze circulation
In addition to the changes observed in the daily air temper-      does not present the capacity to reach the micrometeorolog-
ature cycle at the ATTO site, changes were also observed in       ical tower of the ATTO site in 58 km distance (in line with
the local wind direction during the friagem period (Fig. 7).      results from Andreae et al., 2015). This aspect will be dis-
Before the arrival of this phenomenon, between 6 and 8 July,      cussed in the next section where the results of the simulation
it was observed that the directions of the horizontal wind        with JULES-CCATT-BRAMS model will be analyzed.
were predominantly southeast and northeast. On the other
hand, on 9 July, the wind direction was well distributed          3.4   Radiation, ozone and CO2 during the friagem event
among the four cardinal points, and on 10 and 11 July the
wind flow had higher frequencies in the west, north and           Figure 9 shows the values of incident shortwave radiation
southwest, when the friagem arrived at the ATTO site. The         (SWin ), O3 and CO2 measured at the ATTO site, between 6
general wind directions before and after the friagem are con-     and 11 July 2014, respectively (black line). The SWin values
sistent with long-term observations at the ATTO site (An-         decrease during the morning of 11 July when the friagem ar-
dreae et al., 2015). The low frequency of observed wind di-       rives at the ATTO site (Fig. 9a). Moreover, the maximum
rections from the westerly directions (based on 2.5 years of      value (≈ 450 W m−2 ) of SWin occurred at approximately
data) led to the conclusion that effects of local circulation     19:00 UTC (15:00 LT), whereas the average monthly daily
(due to Uatumã River ≈ 12 km and Lake Balbina ≈ 58 km)            maximum SWin (orange line) usually occurs at 16:00 UTC
are not important or could not be observed (Andreae et al.,       (≈ 800 W m−2 ).
2015), at least not on a regular basis.                              Before the arrival of the friagem in the region of the ATTO
   Silva Dias et al. (2004) showed that during the period from    site, between 6 and 8 July, it was observed that the values of
24 to 31 July 2001, there was an arrival of a cold air mass in    O3 (black line) were close to the monthly average (orange
the western region of the Amazon. The main consequences of        line), with minimum values occurring around 10:00 UTC
this friagem in the region were increased atmospheric pres-       (06:00 LT) and maximum around 17:00 UTC (Fig. 9b). This
sure to the sea level, a decrease in air temperature around       result is consistent with those observed in other studies con-
5 ◦ C, a reduction in wind speed and confluence of a cold         ducted in the Amazon (Betts et al., 2002; Gerken et al., 2016;
and dry air mass coming from the southern region with a hot       Dias-Júnior et al., 2017; Melo et al., 2019). However, dur-
and humid air mass coming eastern Amazon. We emphasize            ing the occurrence of the friagem, between 9 and 11 July,
that part of our results are corroborated by Silva Dias et al.    there was a sharp drop in O3 mixing ratio at the times when
(2004). The increased atmospheric pressure to sea level re-       the highest mixing ratios of this trace gas were expected
sulted in a pressure gradient force pointing in the opposite      (17:00 UTC).
direction from the trade winds, which would be consistent            Figure 10 shows the O3 mixing ratio data from four dif-
with a slowdown of the easterly winds. In this way, these au-     ferent stations around the city of Manaus. All stations show
thors were able to observe with greater clarity the occurrence    reduced O3 values during the passage of the friagem event
of river breeze circulations in this region. Following this hy-   (dotted black rectangle). Furthermore, stations affected di-
pothesis, the behavior of the wind at the ATTO site was ana-      rectly by the pollution of the city of Manaus (Iranduba – T2,
lyzed every 2 h, during the period in which the friagem was       Manacapuru – T3) show a clear influence of increased O3
active in this region (Fig. 8).                                   formation compared to ATTO and ZF2-T0z. These differ-
   On 9 July, it is observed that the direction of the wind       ences are much smaller during the friagem event, probably
was essentially from the east until the end of the morning        due to reduced photochemistry (Fig. 9a) in this region.
(14:00–16:00 UTC), when the wind changed to southeast                The reduction of the incident shortwave radiation values
and southwest directions until the late afternoon and early       observed on 11 July (Fig. 9a) was possibly associated with
evening (22:00–00:00 UTC), which corresponds to the flow          the presence of convective systems in this region, as shown
associated with the arrival of friagem in this region. From       in Fig. 4. It is known that cloudiness is a determinant meteo-
00:00 UTC to 14:00 UTC on 10 July, it is observed that the        rological factor in the daily O3 cycle (Gerken et al., 2016).
prevailing wind was from the west, indicating a deviation            It is interesting to note that the rain event during 11 July
from the general flow, which would normally be from the           did not result in an increase of near-surface O3 as observed
east. In the early afternoon (16:00 UTC), the wind changed        by others authors (Betts et al., 2002; Gerken et al., 2016;
to the north direction until the early morning (12:00 UTC)        Dias-Júnior et al., 2017). It is believed that the convective
of 11 July. This change in wind direction to the west and to      cloud formed during the friagem event was not as deep as the
the north observed during the mornings of 10 and 11 July,         clouds investigated by Betts et al. (2002) and Gerken et al.

https://doi.org/10.5194/acp-21-339-2021                                              Atmos. Chem. Phys., 21, 339–356, 2021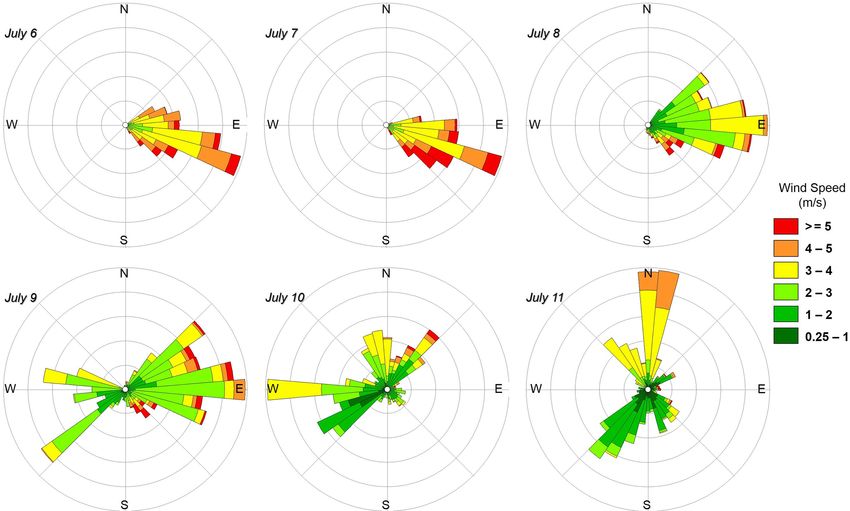
348                                  G. F. Camarinha-Neto et al.: Friagem event and atmospheric chemistry in the Amazon

Figure 7. Experimental horizontal wind speed and direction at 73 m above ground measured at the ATTO site between 6 and 11 July 2014.

Figure 8. Experimental wind speed and direction at the 73 m above ground measured at the ATTO site, in 2 h intervals, between 9 and 11 July
2014.

(2016), which, through their downdrafts, transport O3 from              average. This increase may be related to the incident radia-
the high troposphere to the surface.                                    tion attenuation due to increased cloudiness which reduces
   The values of CO2 mixing ratio between 6 and 11 July are             the efficiency of the forest in absorbing CO2 gas via photo-
shown in Fig. 9c. It is observed that between 6 and 10 July,            synthesis (Ruimy et al., 1995). Also limited vertical mixing
CO2 values for the daily cycle (black line) were very close to          as discussed below is a potential reason.
the monthly average values (orange line), with a maximum
molar fraction around 420 ppm approximately at 10:00 UTC
and minimum of less than 390 ppm (de Araújo et al., 2010).
However, on 11 July at 14:00 UTC, a significant increase of
CO2 (≈ 470 ppm) was observed in relation to the monthly

Atmos. Chem. Phys., 21, 339–356, 2021                                                       https://doi.org/10.5194/acp-21-339-2021
G. F. Camarinha-Neto et al.: Friagem event and atmospheric chemistry in the Amazon                                                    349

Figure 9. Daily behavior (black line) and monthly average (orange line) of the experimental data: (a) incident shortwave radiation (SWin ),
(b) ozone (O3 ) and (c) carbon dioxide (CO2 ) mixing ratio from 6 to 11 July 2014 at the ATTO site.

3.5   Simulation of local circulation and its effect at the             friagem event the maximum BLH values were greater than
      ATTO site                                                         1000 m. However, during the friagem event, the maximum
                                                                        BLH value was around 600 m.
In order to better understand the local circulation and its role           The large temperature drop (Fig. 6a), together with the in-
in the measurements made in the region of the ATTO site,                formation that the cold air of the friagem was just in the lower
this section presents the results of a numerical simulation             500 m (Fig. 11), points to the formation of a cold pool above
made with the JULES-CCATT-BRAMS coupled model. Fig-                     the forest that prevents vertical mixing. As incoming solar
ure 11a shows the vertical profile of the horizontal wind at a          radiation was low (Fig. 9a), the surface heating might not
grid point near the ATTO site (2◦ S, 59◦ W) during model                be sufficient to break the inversion or at least a very shal-
integration. At low levels (near 80 m), the easterly wind is            low boundary layer was formed as evidenced by the ERA5
observed until the first hours of 10 July. Then the wind has            data (Fig.11b). This would explain high CO2 (accumulation
a predominant west–northwest direction until the afternoon              of soil emissions) and very low O3 (limited transport from
of 11 July, and afterwards the wind comes from the south.               aloft) at the same time at the ATTO site in addition to the
Therefore, it is observed that the simulation captured the hor-         reduced radiation (see Sect. 3.3).
izontal wind behavior measured at a height of 73 m at the                  Figure 12 shows the evolution of the temperature at 76.8 m
ATTO site, as shown in Fig. 8. In addition, above 500 m,                (◦ C, shaded) and horizontal wind (m s−1 , vector) at 134.5 m
the flow is essentially from the east during the whole pe-              on 11 July. Between 03:00 and 11:00 UTC, the air temper-
riod of integration of the model. Apparently, the friagem only          ature is higher on Lake Balbina compared to that above the
changes the flow within a small layer adjunct to the ground.            forest area. This temperature gradient induces the formation
Figure 11b shows the values of the boundary layer height                of a forest breeze towards the lake with the wind converging
(BLH) obtained from ERA5 at a grid point near the ATTO                  towards the center of the lake (Fig. 12a–e). At 13:00 UTC,
site (2.10◦ S, 59.06◦ W). It is possible to note that before the        the temperature gradient reverses its direction and induces

https://doi.org/10.5194/acp-21-339-2021                                                      Atmos. Chem. Phys., 21, 339–356, 2021
350 G. F. Camarinha-Neto et al.: Friagem event and atmospheric chemistry in the Amazon Figure 10. O3 mixing ratio (ppbv) from four different stations around Manaus: the ATTO site (blue line), ZF2 forest – T0z (red line), Iranduba – T2 (grey line), Manacapuru – T3 (yellow line). The black rectangle indicates the occurrence of the friagem event. T2 is affected directly by the polluted air from the city of Manaus. Figure 11. (a) Vertical profile of the horizontal wind (m s−1 ) obtained by the JULES-CCATT-BRAMS simulation for the ATTO site from 00:00 UTC on 9 July to 00:00 UTC on 12 July 2014. (b) Boundary layer height (m) obtained from ERA5 for the ATTO site from 04:00 UTC on 6 July to 04:00 UTC on 12 July 2014. the formation of the lake breeze towards the forest that at by the horizontal resolution in this simulation. The gradual 15:00 UTC is more clearly defined along the southeastern drop in temperature and predominance of northwest winds shores of Lake Balbina (Fig. 12g). shown in this simulation at the grid points near the ATTO Another interesting aspect is the entry of cooler air through site agree with the observational data from this site (Figs. 6 the northwest quadrant starting at 03:00 UTC, which is trans- and 7). ported in the southeast direction. From 03:00 to 11:00 UTC, Although the Lake Balbina breeze was established, it did a corridor of warmer air is established from Lake Balbina not reach the ATTO site until 15:00 UTC (Fig. 12g). In ad- to the southeast quadrant of the domain along the Uatumã dition, precipitation in the simulation occurred in the fol- River, whose width is less than 1 km and cannot be captured lowing hours, similar to that observed in satellite images Atmos. Chem. Phys., 21, 339–356, 2021 https://doi.org/10.5194/acp-21-339-2021
G. F. Camarinha-Neto et al.: Friagem event and atmospheric chemistry in the Amazon                                                 351

Figure 12. Evolution of modeled air temperature (◦ C, shaded) at 76.8 m and horizontal wind (m s−1 , vector) at 134.5 m, on 11 July 2014
at (a) 03:00 UTC, (b) 05:00 UTC, (c) 07:00 UTC, (d) 09:00 UTC, (e) 11:00 UTC, (f) 13:00 UTC, (g) 15:00 UTC and (h) 17:00 UTC. Lake
Balbina (black contour) and the ATTO site (black dot) are indicated.

https://doi.org/10.5194/acp-21-339-2021                                                    Atmos. Chem. Phys., 21, 339–356, 2021
352                                   G. F. Camarinha-Neto et al.: Friagem event and atmospheric chemistry in the Amazon

Figure 13. Simulated horizontal wind at 134.5 m on 11 July 2014 for the (a, b) water vapor mixture ratio (g kg−1 , shaded), (c, d) ozone
mixing ratio (ppbv, shaded), (e, f) carbon monoxide mixing ratio (ppbv, shaded) and (g, h) nitrogen dioxide mixing ratio (ppbv, shaded) at
24.4 m, when the friagem arrived at the study area (a, c, e, g) and at the moment of its dissipation (b, d, f, g). Lake Balbina (black outline)
and the ATTO site (black dot) are indicated.

Atmos. Chem. Phys., 21, 339–356, 2021                                                          https://doi.org/10.5194/acp-21-339-2021
G. F. Camarinha-Neto et al.: Friagem event and atmospheric chemistry in the Amazon 353
(Fig. 4), which in turn disrupts the environment propitious to 4 Conclusion
vigorous breezes that could reach the ATTO site. Although
the friagem phenomenon causes the weakening of the trade In the period of 9 to 11 July 2014, a friagem phenomenon
winds, which in turn would allow the establishment of more reached the central region of the Amazon. Through the
intense breezes as proposed by Silva Dias et al. (2004), the ECMWF ERA-Interim reanalysis it was possible to verify
cooler and drier air mass flow of the friagem in the central that this phenomenon ventured into the Amazon region from
region of the Amazon was dominant over the lake and forest southwest to northeast, bringing a strong, cold, dry, ozone-
breeze circulation. Possibly, the establishment of more vig- rich air mass in the western quadrant, which dominated the
orous river breeze circulations observed by Silva Dias et al. wind field in the central region of the Amazon.
(2004) is possible due to the friagem phenomenon not reach- Through the observational data, it was possible to verify
ing that region and interfering with the signal of the breeze that the passage of the friagem in the central Amazon had its
and causing intense rainfall. most significant effects on 11 July, in the region of the city
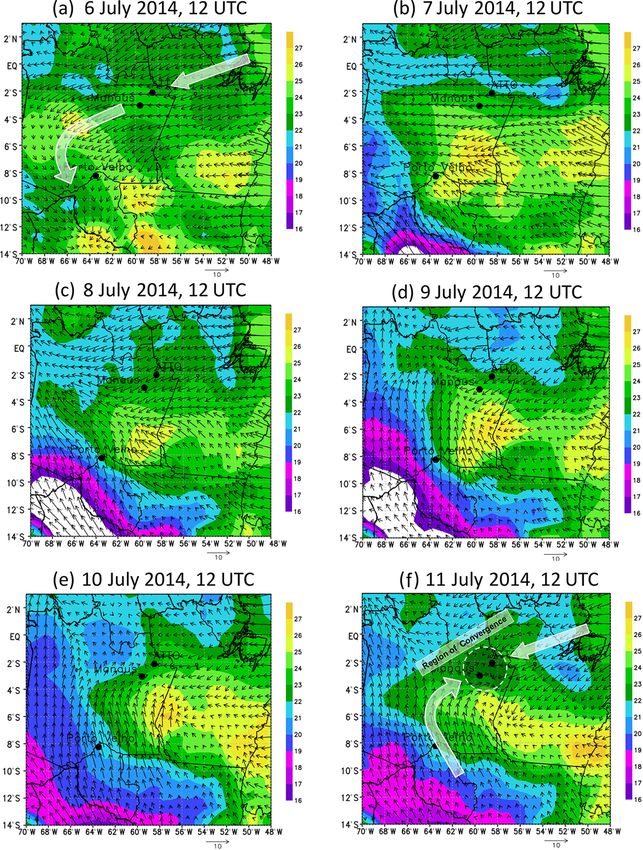
Figure 13 shows the behavior of modeled water vapor, O3 , of Manaus, such as Lake Balbina, the ATTO site and others
CO and NO2 on 11 July 2014 at the moment of incursion sites (T2, T3 and T0z).
(Fig. 13a, c, f, g) and dissipation (Fig. 13b, d, f, h) of the From the observational data collected at the ATTO site,
friagem in the study area. The mixing ratios of water vapor it was observed that 11 July was marked by a sudden drop
near the surface at 02:00 UTC (Fig. 13a) were lower in the in air temperature, a weakening of the typical eastern flow
regions where cooler air was observed entering this domain, and a predominance of south, west and north winds. In addi-
indicating that the friagem brought cold and dry air to the tion, on 11 July, the interaction between the friagem air mass
ATTO site and Lake Balbina. and the trade winds flow gave origin to convection bands,
O3 mixing ratios are higher above the lake and its sur- which in turn caused a significant reduction of the incident
roundings, for both times shown (Fig. 13c and d). The O3 shortwave radiation, besides a record rain of the month. With
mixing ratios within the limits of the simulation domain are the BRAMS simulations we found that the cold air of the
mostly below 11 ppbv, whereas above the lake these mix- friagem was just in the lower 500 m. This information leads
ing ratios exceed 20 ppbv at certain points, especially at us to the conclusion that there is a cold pool above the forest
02:00 UTC. The effect responsible for higher O3 mixing ra- that prevents vertical mixing and consequently contributes to
tios both during the day and at night may be associated with an increase in CO2 mixing ratio and abrupt drop in O3 mix-
the fact that deposition is very much reduced over the open ing ratio above the forest canopy.
water compared to the forest (Ganzeveld et al., 2009). It can Also, through the simulations of the JULES-CCATT-
also be seen that the friagem extended in the direction of the BRAMS it was possible to evaluate the main impacts that
ATTO site but probably due to the onset of rain (Fig. 4) was the friagem phenomenon caused both in the thermodynamic
not clearly detected at the ATTO site. characteristics and in the atmospheric chemistry of the cen-
In terms of CO gas, it can be observed that its concentra- tral region of the Amazon. In addition, the breeze circulations
tion at the center of the lake at 02:00 UTC (Fig. 13e) is higher between Lake Balbina and the forest were well represented in
than in the regions near the margins of the lake; however, this the simulations; however, it was not possible to verify the in-
calls attention at this time to the transport of CO arriving with fluence of this breeze in trace gas concentrations at the ATTO
the south and northeast winds, approaching the ATTO site. site.
However, it is noted that the entire region of the simulation With the observational results and the simulations, it can
domain presents low CO mixing ratios at the time the friagem be concluded that the friagem phenomenon can interfere
is dissipated (Fig. 13f). Apparently, the friagem event “ex- deeply in the microclimatic conditions and the chemical
pels” the polluted air mass in the south and southeast of the composition of the atmosphere, in a region of dense forest,
ATTO site (around Manaus city), “cleaning” the atmosphere in the center of the Amazon.
or preventing this pollution from reaching the ATTO site and
Lake Balbina.
NO2 gas is an important precursor of O3 and is mainly re- Data availability. The ATTO data used in these study are stored
lated to emissions from fires and vehicles. The emission of in the ATTO databases at the Max Planck Institute for Chem-
istry and the Instituto Nacional de Pesquisas da Amazônia. Data
precursor gases in the formation of O3 mixing ratio of this
access can be requested from Stefan Wolff, who maintains the
trace gas can increase to levels harmful to the forest, since
O3 mixing ratio dataset (stefan.wolff@mpic.de), and Alessandro
the ozone can damage the stomatal functions of the leaves Araújo, who maintains the micrometeorology dataset (alessan-
(Pacifico et al., 2015). In spite of this, it is observed that the dro.araujo@gmail.com). The GoAmazon data used in these study
higher NO2 mixing ratios at 02:00 UTC (Fig. 13g) seem to can be requested from Luciana Rizzo (luvarizzo@gmail.com).
have their origin in the region where higher O3 mixing ra-
tios are found and presented lower NO2 during the time of
dissipation of the friagem (Fig. 13h). Author contributions. GFCN, JCPC and CQDJ designed the study
and wrote the article with the assistance of MS and JHC. SW, RAFS
https://doi.org/10.5194/acp-21-339-2021 Atmos. Chem. Phys., 21, 339–356, 2021354 G. F. Camarinha-Neto et al.: Friagem event and atmospheric chemistry in the Amazon
and PA maintained the greenhouse gas measurement system at the A., de Oliveira Sá, M., Sales, C. B., dos Santos, R. M. N., Sat-
ATTO site and provided the CO2 and O3 data. AA and MS oper- urno, J., Schöngart, J., Sörgel, M., de Souza, C. M., de Souza,
ated and maintained the micrometeorology equipment at ATTO and R. A. F., Su, H., Targhetta, N., Tóta, J., Trebs, I., Trumbore,
provided the data which were fundamental for this study. LVR pro- S., van Eijck, A., Walter, D., Wang, Z., Weber, B., Williams,
vided the O3 data from GoAmazon sites. PAFK and JCPC assisted J., Winderlich, J., Wittmann, F., Wolff, S., and Yáñez-Serrano,
with BRAMS simulations. A. M.: The Amazon Tall Tower Observatory (ATTO): overview
of pilot measurements on ecosystem ecology, meteorology, trace
gases, and aerosols, Atmos. Chem. Phys., 15, 10723–10776,
Competing interests. The authors declare that they have no conflict https://doi.org/10.5194/acp-15-10723-2015, 2015.
of interest. Araújo, A. C., Nobre, A. D., Kruijt, B., Elbers, J. A., Dal-
larosa, R., Stefani, P., von Randow, C., Manzi, A. O., Culf,
A. D., Gash, J. H. C., Valentini, R., and Kabat, P.: Compara-
Special issue statement. This article is part of the special issue tive measurements of carbon dioxide fluxes from two nearby
“Amazon Tall Tower Observatory (ATTO) Special Issue”. It is not towers in a central Amazonian rainforest: The Manaus LBA
associated with a conference. site, J. Geophys. Res.-Atmos., 107, LBA 58–1–LBA 58–20,
https://doi.org/10.1029/2001JD000676, 8090, 2002.
Berrisford, P., Dee, D., Poli, P., Brugge, R., Fielding, K., Fuentes,
M., Kallberg, P., Kobayashi, S., Uppala, S., and Simmons, A.:
Acknowledgements. This work has been supported by the Max
The ERA-Interim archive, version 2.0, ERA Report Series, ERA
Planck Society as well as the Amazon State University (UEA),
Report, Reading, UK, 1, 2011.
FAPEAM, LBA/INPA and SDS/CEUC/RDS-Uatumã. We also
Best, M. J., Pryor, M., Clark, D. B., Rooney, G. G., Essery, R. L.
thank the European Centre for Medium-Range Weather Forecasts
H., Ménard, C. B., Edwards, J. M., Hendry, M. A., Porson, A.,
(ECMWF) for the reanalysis data and the Center for Weather
Gedney, N., Mercado, L. M., Sitch, S., Blyth, E., Boucher, O.,
Prediction and Climate Studies (Centro de Previsão do Tempo
Cox, P. M., Grimmond, C. S. B., and Harding, R. J.: The Joint
e Estudos Climáticos (CPTEC/INPE)) for providing the JULES-
UK Land Environment Simulator (JULES), model description –
CCATT-BRAMS model. Furthermore, the authors thank the Ama-
Part 1: Energy and water fluxes, Geosci. Model Dev., 4, 677–699,
zon Modeling Laboratory (Laboratório de Modelagem da Amazô-
https://doi.org/10.5194/gmd-4-677-2011, 2011.
nia, LAMAZ) for the technical help given and also the Brazilian
Betts, A. K., Gatti, L. V., Cordova, A. M., Dias, M. A. S., and
Research Council (CNPq, Conselho Nacional de Desenvolvimento
Fuentes, J. D.: Transport of ozone to the surface by convective
Científico e Tecnológico) for the Masters scholarship. ERA5 data
downdrafts at night, J. Geophys. Res.-Atmos., 107, LBA 13-1–
are courtesy of Benedikt Steil.
LBA 13-6, https://doi.org/10.1029/2000JD000158, 2002.
Brinkmann, W. and Ribeiro, M.: Air temperatures in Central Ama-
zonia. III.-Vertical Temperature Distribution on a Clearcut Area
Financial support. This research has been supported by the Ger- and in a Secondary Forest near Manaus (Cold Front Conditions
man Federal Ministry of Education and Research (BMBF con- July 10 th. 1969), Acta Amazon., 2, 25–29, 1972.
tract nos. 01LB1001A and 01LK1602B) and the Brazilian Min- Caraballo, P., Forsberg, B. R., Almeida, F. F. d., and Leite, R. G.:
istério da Ciência, Tecnologia e Inovação (MCTI/FINEP contract Diel patterns of temperature, conductivity and dissolved oxy-
no. 01.11.01248.00). gen in an Amazon floodplain lake: description of a friagem phe-
nomenon, Acta Limnologica Brasiliensia, 26, 318–331, 2014.
Cirino, G., Brito, J., Barbosa, H. M., Rizzo, L. V., Tunved, P.,
Review statement. This paper was edited by Gilberto Fisch and re- de Sá, S. S., Jimenez, J. L., Palm, B. B., Carbone, S., Lavric,
viewed by two anonymous referees. J. V., Souza, R. A., Wolff, S., Walter, D., Tota, J., Oliveira,
M. B., Martin, S. T., and Artaxo, P.: Observations of Man-
aus urban plume evolution and interaction with biogenic emis-
sions in GoAmazon 2014/5, Atmos. Environ., 191, 513–524,
References https://doi.org/10.1016/j.atmosenv.2018.08.031, 2018.
Clark, D. B., Mercado, L. M., Sitch, S., Jones, C. D., Gedney, N.,
Alcântara, C. R., Dias, M. A. S., Souza, E. P., and Co- Best, M. J., Pryor, M., Rooney, G. G., Essery, R. L. H., Blyth,
hen, J. C.: Verification of the role of the low level E., Boucher, O., Harding, R. J., Huntingford, C., and Cox, P.
jets in Amazon squall lines, Atmos. Res., 100, 36–44, M.: The Joint UK Land Environment Simulator (JULES), model
https://doi.org/10.1016/j.atmosres.2010.12.023, 2011. description – Part 2: Carbon fluxes and vegetation dynamics,
Andreae, M. O., Acevedo, O. C., Araùjo, A., Artaxo, P., Barbosa, C. Geosci. Model Dev., 4, 701–722, https://doi.org/10.5194/gmd-4-
G. G., Barbosa, H. M. J., Brito, J., Carbone, S., Chi, X., Cintra, 701-2011, 2011.
B. B. L., da Silva, N. F., Dias, N. L., Dias-Júnior, C. Q., Ditas, F., Cohen, J. C. P., Dias, M. A. F. S., and Nobre, C. A.:
Ditz, R., Godoi, A. F. L., Godoi, R. H. M., Heimann, M., Hoff- Environmental Conditions Associated with Amazo-
mann, T., Kesselmeier, J., Könemann, T., Krüger, M. L., Lavric, nian Squall Lines: A Case Study, Mon. Weather
J. V., Manzi, A. O., Lopes, A. P., Martins, D. L., Mikhailov, E. Rev., 123, 3163–3174, https://doi.org/10.1175/1520-
F., Moran-Zuloaga, D., Nelson, B. W., Nölscher, A. C., Santos 0493(1995)1232.0.CO;2, 1995.
Nogueira, D., Piedade, M. T. F., Pöhlker, C., Pöschl, U., Que-
sada, C. A., Rizzo, L. V., Ro, C.-U., Ruckteschler, N., Sá, L. D.
Atmos. Chem. Phys., 21, 339–356, 2021 https://doi.org/10.5194/acp-21-339-2021G. F. Camarinha-Neto et al.: Friagem event and atmospheric chemistry in the Amazon 355 Cotton, W. R., Pielke Sr., R. A., Walko, R. L., Liston, G. E., A. L., Santos e Silva, C. M., Pavani, C. A. B., Eiras, D., França, Tremback, C. J., Jiang, H., McAnelly, R. L., Harrington, J. Y., D. A., Massaru, D., Silva, F. B., Santos, F. C., Pereira, G., Cam- Nicholls, M. E. Carrio, G. G., and McFadden, J. P.: RAMS 2001: ponogara, G., Ferrada, G. A., Campos Velho, H. F., Menezes, I., Current status and future directions, Meteorol. Atmos. Phys., 82, Freire, J. L., Alonso, M. F., Gácita, M. S., Zarzur, M., Fonseca, R. 5–29, https://doi.org/10.1007/s00703-001-0584-9, 2003. M., Lima, R. S., Siqueira, R. A., Braz, R., Tomita, S., Oliveira, V., de Araújo, A. C., Dolman, A. J., Waterloo, M. J., Gash, J. H. C., and Martins, L. D.: The Brazilian developments on the Regional Kruijt, B., Zanchi, F. B., de Lange, J. M. E., Stoevelaar, R., Atmospheric Modeling System (BRAMS 5.2): an integrated en- Manzi, A. O., Nobre, A. D., Lootens, R. N., and Backer J.: The vironmental model tuned for tropical areas, Geosci. Model Dev., spatial variability of CO2 storage and the interpretation of eddy 10, 189–222, https://doi.org/10.5194/gmd-10-189-2017, 2017. covariance fluxes in central Amazonia, Agr. Forest Meteorol., Ganzeveld, L., Helmig, D., Fairall, C. W., Hare, J., and Pozzer, 150, 226–237, https://doi.org/10.1016/j.agrformet.2009.11.005, A.: Atmosphere-ocean ozone exchange: A global modeling 2010. study of biogeochemical, atmospheric, and waterside turbu- de Oliveira, P. J., da Rocha, E. J. P., Fisch, G., Kruijt, B., lence dependencies, Global Biogeochem. Cy., 23, GB4021, and Ribeiro, J. B. M.: Efeitos de um evento de friagem nas https://doi.org/10.1029/2008GB003301, 2009. condições meteorológicas na Amazônia: um estudo de caso, Gerken, T., Wei, D., Chase, R. J., Fuentes, J. D., Schumacher, Acta Amazon., 34, 613–619, https://doi.org/10.1590/S0044- C., Machado, L. A., Andreoli, R. V., Chamecki, M., de Souza, 59672004000400013, 2004. R. A. F., Freire, L. S., Jardine, A. B., Manzi, A. O., dos de Souza, D. O. and Alvalá, R. C. d. S.: Observational evidence of Santos, R. M. N., von Randow, C., dos Santos Costa, P., the urban heat island of Manaus City, Brazil, Meteorol. Appl., Stoy, P. C., Tóta, J., and Trowbridge, A. M.: Downward trans- 21, 186–193, https://doi.org/10.1002/met.1340, 2014. port of ozone rich air and implications for atmospheric chem- Dias-Júnior, C. Q., Dias, N. L., Fuentes, J. D., and Chamecki, istry in the Amazon rainforest, Atmos. Environ., 124, 64–76, M.: Convective storms and non-classical low-level jets dur- https://doi.org/10.1016/j.atmosenv.2015.11.014, 2016. ing high ozone level episodes in the Amazon region: An Jacob, D. J. and Wofsy, S. C.: Budgets of reactive nitro- ARM/GOAMAZON case study, Atmos. Environ., 155, 199–209, gen, hydrocarbons, and ozone over the Amazon forest during https://doi.org/10.1016/j.atmosenv.2017.02.006, 2017. the wet season, J. Geophys. Res.-Atmos., 95, 16737–16754, dos Santos, M. J., Silva Dias, M. A., and Freitas, E. D.: Influence https://doi.org/10.1029/JD095iD10p16737, 1990. of local circulations on wind, moisture, and precipitation close to Kemenes, A., Forsberg, B. R., and Melack, J. M.: Methane re- Manaus City, Amazon Region, Brazil, J. Geophys. Res.-Atmos., lease below a tropical hydroelectric dam, Geophys. Res. Lett., 119, 13–233, https://doi.org/10.1002/2014JD021969, 2014. 34, L12809, https://doi.org/10.1029/2007GL029479, 2007. Fan, S.-M., Wofsy, S. C., Bakwin, P. S., Jacob, D. J., and Fitzjar- Longo, K. M., Freitas, S. R., Andreae, M. O., Setzer, A., Prins, E., rald, D. R.: Atmosphere-biosphere exchange of CO2 and O3 in and Artaxo, P.: The Coupled Aerosol and Tracer Transport model the central Amazon forest, J. Geophys. Res.-Atmos., 95, 16851– to the Brazilian developments on the Regional Atmospheric 16864, https://doi.org/10.1029/JD095iD10p16851, 1990. Modeling System (CATT-BRAMS) – Part 2: Model sensitivity to Fisch, G.: Camada Limite Amazônica: Aspectos Observacionais the biomass burning inventories, Atmos. Chem. Phys., 10, 5785– e de Modelagem, 180 f. tese (doutorado em meteorologia), In- 5795, https://doi.org/10.5194/acp-10-5785-2010, 2010. stituto Nacional de Pesquisas Espaciais, São José dos Campos, Marengo, J. A., Nobre, C. A., and Culf, A. D.: Cli- Brazil, 1996. matic impacts of “friagens” in forested and defor- Fisch, G., Marengo, J. A., and Nobre, C. A.: Uma revisão geral ested areas of the Amazon basin, J. Appl. Mete- sobre o clima da Amazônia, Acta Amazon., 28, 101–126, orol., 36, 1553–1566, https://doi.org/10.1175/1520- https://doi.org/10.1590/1809-43921998282126, 1998. 0450(1997)0362.0.CO;2, 1997. Freire, L. S., Gerken, T., Ruiz-Plancarte, J., Wei, D., Fuentes, Martin, S. T., Artaxo, P., Machado, L. A. T., Manzi, A. O., Souza, R. J. D., Katul, G. G., Dias, N. L., Acevedo, O. C., and Chamecki, A. F., Schumacher, C., Wang, J., Andreae, M. O., Barbosa, H. M. M.: Turbulent mixing and removal of ozone within an Amazon J., Fan, J., Fisch, G., Goldstein, A. H., Guenther, A., Jimenez, J. rainforest canopy, J. Geophys. Res.-Atmos., 122, 2791–2811, L., Pöschl, U., Silva Dias, M. A., Smith, J. N., and Wendisch, M.: https://doi.org/10.1002/2016JD026009, 2017. Introduction: Observations and Modeling of the Green Ocean Freitas, R. G. and Freitas, S.: Estimativa operacional da umidade Amazon (GoAmazon2014/5), Atmos. Chem. Phys., 16, 4785– do solo para iniciação de modelos de previsão numérica da at- 4797, https://doi.org/10.5194/acp-16-4785-2016, 2016. mosfera parte I: descrição da metodologia e validação, Revista Melo, A. M., Dias-Junior, C. Q., Cohen, J. C., Sá, L. D., Brasileira de Meteorologia, 21, 1–15, 2006. Cattanio, J. H., and Kuhn, P. A.: Ozone transport Freitas, S. R., Longo, K. M., Silva Dias, M. A. F., Chatfield, R., and thermodynamics during the passage of squall line Silva Dias, P., Artaxo, P., Andreae, M. O., Grell, G., Rodrigues, in Central Amazon, Atmos. Environ., 206, 132–143, L. F., Fazenda, A., and Panetta, J.: The Coupled Aerosol and https://doi.org/10.1016/j.atmosenv.2019.02.018, 2019. Tracer Transport model to the Brazilian developments on the Re- Moreira, D. S., Freitas, S. R., Bonatti, J. P., Mercado, L. M., gional Atmospheric Modeling System (CATT-BRAMS) – Part 1: Rosário, N. M. É., Longo, K. M., Miller, J. B., Gloor, M., and Model description and evaluation, Atmos. Chem. Phys., 9, 2843– Gatti, L. V.: Coupling between the JULES land-surface scheme 2861, https://doi.org/10.5194/acp-9-2843-2009, 2009. and the CCATT-BRAMS atmospheric chemistry model (JULES- Freitas, S. R., Panetta, J., Longo, K. M., Rodrigues, L. F., Moreira, CCATT-BRAMS1.0): applications to numerical weather fore- D. S., Rosário, N. E., Silva Dias, P. L., Silva Dias, M. A. F., casting and the CO2 budget in South America, Geosci. Model Souza, E. P., Freitas, E. D., Longo, M., Frassoni, A., Fazenda, https://doi.org/10.5194/acp-21-339-2021 Atmos. Chem. Phys., 21, 339–356, 2021
You can also read