Modeling the response of soil moisture to climate variability in the Mediterranean region
←
→
Page content transcription
If your browser does not render page correctly, please read the page content below
Hydrol. Earth Syst. Sci., 25, 653–669, 2021
https://doi.org/10.5194/hess-25-653-2021
© Author(s) 2021. This work is distributed under
the Creative Commons Attribution 4.0 License.

Modeling the response of soil moisture to climate
variability in the Mediterranean region
Louise Mimeau1,2 , Yves Tramblay1 , Luca Brocca3 , Christian Massari3 , Stefania Camici3 , and Pascal Finaud-Guyot1,4
1 HSM  (Université de Montpellier, CNRS, IRD), Montpellier, France
2 INRAE,  UR RiverLy, centre de Lyon-Grenoble Auvergne-Rhône-Alpes, 69625 Villeurbanne CEDEX, France
3 Research Institute for Geo-Hydrological Protection, National Research Council, Perugia, Italy
4 INRIA Lemon, Montpellier, France

Correspondence: Yves Tramblay (yves.tramblay@ird.fr)

Received: 17 June 2020 – Discussion started: 25 June 2020
Revised: 30 November 2020 – Accepted: 11 January 2021 – Published: 11 February 2021

Abstract. Future climate scenarios for the Mediterranean re-       lengthening of the drought period from June to October with
gion indicate a possible decrease in annual precipitation asso-    an average of +28 d of soil moisture drought per year.
ciated with an intensification of extreme rainfall events in the
coming years. A major challenge in this region is to evalu-
ate the impacts of changing precipitation patterns on extreme
hydrological events such as droughts and floods. For this, it      1   Introduction
is important to understand the impact of climate change on
soil moisture since it is a proxy for agricultural droughts, and   The Mediterranean region is a transitional zone between dry
the antecedent soil moisture condition plays a key role on         and wet climates, and in these semiarid areas the direct evap-
runoff generation. This study focuses on 10 sites, located         oration from the soil plays an important role on the sur-
in southern France, with available soil moisture, tempera-         face energy balance, with evapotranspiration strongly depen-
ture, and precipitation observations for a 10-year time pe-        dent on available soil moisture (Koster et al., 2004; Senevi-
riod. Soil moisture is simulated at each site at the hourly        ratne et al., 2010; Taylor, 2015). Consequently, the Mediter-
time step using a model of soil water content. The sensi-          ranean has been identified as a region with a strong coupling
tivity of the simulated soil moisture to different changes in      between the atmosphere and the land surface, with feed-
precipitation and temperature is evaluated by simulating the       back effects of soil moisture on temperature and precipita-
soil moisture response to temperature and precipitation sce-       tion (Seneviratne et al., 2010; Knist et al., 2017; Hertig et al.,
narios generated using a delta change method for tempera-          2019). Indeed, soil moisture is a key variable in the hydrolog-
ture and a stochastic model (the Neyman–Scott rectangular          ical cycle for the partitioning of rainfall into infiltration and
pulse model) for precipitation. Results show that soil mois-       runoff and also for the mass and energy balance between land
ture is more impacted by changes in precipitation intermit-        surface and the atmosphere (Seneviratne et al., 2010; Brocca
tence than precipitation intensity and temperature. Overall,       et al., 2017). The water contained in the unsaturated, or va-
increased temperature and precipitation intensity associated       dose zone, is an important driver for floods with soils close
with more intermittent precipitation leads to decreased soil       to saturation having more probability to produce runoff when
moisture and an increase in the annual number of days with         subjected to precipitation inputs (Zehe et al., 2005; Ivancic
dry soil moisture conditions. In particular, a temperature in-     and Shaw, 2015; Woldemeskel and Sharma, 2016; Bennett
crease of +4 ◦ C combined with a decrease of annual rain-          et al., 2018; Wasko and Nathan, 2019). This is particularly
fall between 10 % and 20 %, corresponding to the current           true in the Mediterranean context where several studies have
available climate scenarios for the Mediterranean, lead to a       shown the strong influence of soil moisture on flood gen-
                                                                   eration processes (Brocca et al., 2008; Penna et al., 2011;
                                                                   Tramblay et al., 2010, 2019; Uber et al., 2018). Similarly,

Published by Copernicus Publications on behalf of the European Geosciences Union.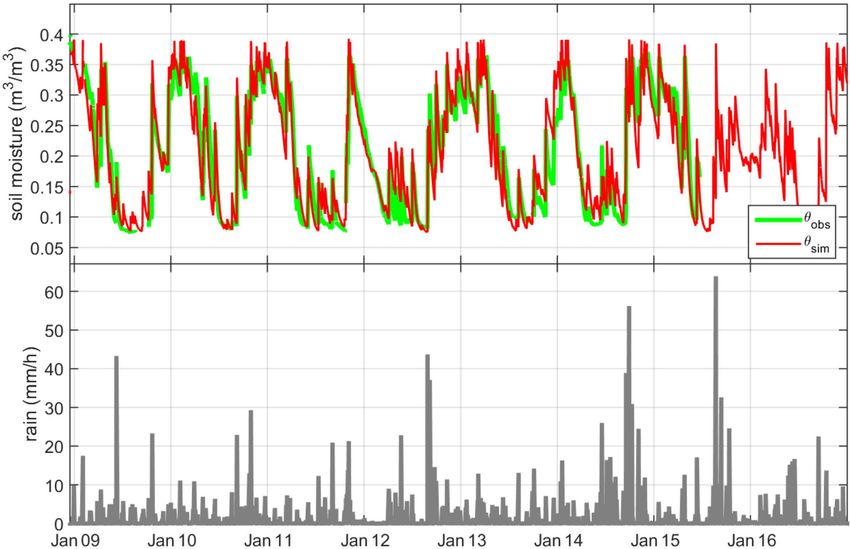
654          L. Mimeau et al.: Modeling the response of soil moisture to climate variability in the Mediterranean region

soil moisture is an important parameter for drought analysis,       the best option to assess small-scale soil moisture variability
since low soil moisture content is a good proxy for drought         in relation with climate conditions.
impacts on agriculture or wildfires occurrence (Vidal et al.,          Besides the use of climate models, scenario-neutral ap-
2010; Ruffault et al., 2013).                                       proaches are increasingly employed to assess the vulnera-
   There is a climatic trend towards a drying of the Mediter-       bility of water resources under different climate change sce-
ranean region, both during the historical period but also in        narios (Prudhomme et al., 2010; Guo et al., 2017; Stephens
future climate scenarios, showing a decrease in precipitation       et al., 2018; Keller et al., 2019). The approach is similar to
amounts and occurrence, associated with an increasing fre-          a sensitivity analysis aiming at quantifying the changes in a
quency of drought episodes (Hoerling et al., 2012; Polade           given hydrological variable for a plausible range of changes
et al., 2014, 2017; Hertig and Tramblay, 2017; Lionello and         in hydrometeorological conditions. Several studies have pre-
Scarascia, 2018; Tramblay et al., 2020). For a RCP8.5 emis-         viously used stochastic approaches to investigate the sen-
sion scenario, Giannakopoulos et al. (2009) and Polade et al.       sitivity of soil moisture to precipitation patterns with var-
(2014) both estimate a mean decrease up to −30 % of the             ious levels of complexity in the representation of precip-
annual precipitation in the Mediterranean region by the end         itation properties and soil moisture dynamics (Rodriguez-
of the century and an increase of dry days ranging between          Iturbe et al., 1999; Milly, 2001; Calanca, 2004; Laio et al.,
+1 to +3 weeks per year. The precipitation decrease asso-           2001; Teuling et al., 2007; Zhu et al., 2020). This type of
ciated with higher temperatures leading to stronger evapora-        approach can provide useful information to identify the hy-
tion rates is causing a decrease in soil moisture for large parts   drometeorological parameters that have the greatest impact
of the Mediterranean (Vidal et al., 2010; Vicente-Serrano           on a given response variable. Guo et al. (2018) provided
et al., 2014; Hanel et al., 2018). Samaniego et al. (2018) and      an example of such a scenario-neutral approach based on
Grillakis (2019) provided future projections of soil moisture       a stochastic weather generator to explore possible rates of
for Europe using different combinations of climate scenarios        changes in rainfall intermittence and extremes in southern
from general circulation models (GCMs), regional climate            Australia. Yoo et al. (2005) coupled a stochastic generator of
models (RCMs), and hydrological and land surface models,            rainfall to a soil moisture model in the Walnut Gulch exper-
showing a clear climate signal towards a future decrease in         imental watershed in southeastern Arizona to estimate soil
soil moisture content and consequently an increase in agri-         moisture changes due to rainfall variability. They found that
cultural droughts for Mediterranean regions.                        the rainfall arrival rate was the most sensitive parameter, with
   Only a few studies have attempted to validate the soil           decreasing soil moisture content and increasing rain intermit-
moisture simulated by the GCM or RCM land surface                   tence, even without a decrease of the total volume of rainfall.
schemes, probably due to the lack of sufficient networks with       Yet, this type of approach needs to be applied to other land
in situ soil moisture measurements, which show high spa-            regions and different sites in order to evaluate the possible
tial variability (Brocca et al., 2007; Crow et al., 2012; Hol-      spatial variability in addition to the temporal variability of
gate et al., 2016). Yuan and Quiring (2017) validated the en-       rainfall. These bottom-up approaches are complementary to
semble of Coupled Model Intercomparison Project Phase 5             the modeling chains linking climate and land surface models
(CMIP5) GCMs over North America with in situ and satel-             and document the most relevant process leading to soil mois-
lite soil moisture observations. Knist et al. (2017) evalu-         ture changes that in turn can be used to improve the land
ated the Coordinated Regional Climate Downscaling Experi-           surface schemes.
ment (CORDEX) RCMs over Europe using GLEAM (Global                     The objective of this study is to analyze the variability
Land Evaporation Amsterdam Model) and FLUXNET ref-                  of soil moisture for a set of Mediterranean sites according
erence data. Hertig et al. (2019) tested the ability of two         to changes in precipitation and temperature. The method re-
GCMs (CNRM-CM5 and MPI-ESM-MR) from CMIP5 to                        lies on the use of a stochastic precipitation generator cou-
reproduce soil moisture dynamics as modeled by the Global           pled with the soil moisture model proposed by Brocca et al.
Land Data Assimilation System (GLDAS) over Europe. If               (2008). The scientific questions addressed in the present
the main patterns of seasonal soil moisture were found to be        work are: which precipitation characteristics (intermittency,
adequately represented from climate models, these studies           intensity) influence soil moisture changes in conjunction
also pointed out the large multimodel variability in partic-        with changes in temperature as a proxy for evapotranspira-
ular in the transitional climate zones. Indeed, many studies        tion changes, and how does the response of soil moisture to
reported a high model dependence of soil moisture simula-           changes in climate drivers vary in space for a range of dif-
tions (Koster et al., 2009; Berg et al., 2017). This is partic-     ferent locations with different topographical and soil proper-
ularly true for the Mediterranean regions due to structural         ties?
uncertainty, different process representations, soil depths,           The paper is structured as follows: Sect. 2 describes the
and interactions with vegetation that are not currently ad-         study area and collected datasets; Sect. 3 provides a de-
equately reproduced by land surface models (Knist et al.,           scription of the soil moisture and stochastic rainfall mod-
2017; Quintana-Seguí et al., 2020). As a consequence, the           els (Sect. 3.1 to 3.3) and of the experimental design for the
direct use of soil moisture from climate models may not be          simulation of the soil moisture scenarios (Sect. 3.4); Sect. 4

Hydrol. Earth Syst. Sci., 25, 653–669, 2021                                           https://doi.org/10.5194/hess-25-653-2021
L. Mimeau et al.: Modeling the response of soil moisture to climate variability in the Mediterranean region                    655

Figure 1. Localization of the study sites in southern France.

presents the validation of stochastic rainfall model (Sect. 4.1)   ments at four different depths (5, 10, 20, and 30 cm) as the
and soil moisture model (Sect. 4.2) after calibration and the      weighted average as a function of soil layer depth. The inte-
sensitivity analysis of the median (Sect. 4.3) and extreme soil    gration of the measurements at various depths enables repre-
moisture (Sect. 4.4) to precipitation and temperature varia-       sentation of the average soil moisture in the root zone layer.
tions; and Sect. 5 discusses the results and summarizes the
main conclusions of the paper.
                                                                   3     Method

                                                                   3.1    Soil moisture model
2   Data
                                                                   The soil moisture model developed by Brocca et al. (2008)
This study uses soil moisture, precipitation, and temperature      is used to simulate present soil moisture and soil moisture
in situ data from 10 stations of the SMOSMANIA network             response under different climate scenarios. The soil mois-
(Calvet et al., 2007; Albergel et al., 2008) located in the        ture model (SMmodel) incorporates a Green–Ampt approach
French Mediterranean region (Fig. 1).                              for infiltration, a gravity-driven approximation for drainage,
   Stations all present a characteristic Mediterranean pre-        and a linear relationship between potential evapotranspira-
cipitation seasonal cycle with a hot and dry summer                tion and soil saturation to estimate actual evapotranspiration.
followed by heavy precipitation between September and              The SMmodel simulates the hourly temporal evolution of
November (Fig. 2). This precipitation cycle directly im-           soil moisture and actual evapotranspiration. Hourly precip-
pacts soil moisture with lower soil moisture values dur-           itation and air temperature are used as input into the SM-
ing summer and higher values during winter. Although all           model and potential evapotranspiration is computed from air
stations are located in the French Mediterranean region,           temperature through the Blaney and Criddle approach. De-
they differ in altitudes, ranging from 30 m a.s.l. (Pézenas)       tails on the model equations can be found in Brocca et al.
to 538 m a.s.l. (Mouthoumet), in mean annual precipita-            (2008) and Brocca et al. (2014). The model has been applied
tion, ranging from 500 mm (Lézignan Corbières, Pézenas)            at multiple sites in Italy and Europe (e.g., Brocca et al., 2014)
to 1734 mm (Barnas), and in soil characteristics (Table 1).        with satisfactory results.
The station altitude is correlated to mean annual precipitation
(r = 0.7), except for the station Mouthoumet with lower an-        3.2    Soil moisture model calibration
nual precipitation than stations with comparable altitude (if
this station is removed, r = 0.92 between altitude and mean        The SMmodel uses fixed and calibrated parameters. The
annual precipitation).                                             fixed parameter values (Table 2) were estimated based on
   In situ data are collected at hourly time steps and covers      the observed soil moisture and geographic location of the
the period 1 July 2007 to 31 December 2016. Soil moisture          stations. Four parameters were calibrated: hydraulic conduc-
data series used in this study are computed from measure-          tivity Ks , root zone depth Z, exponent of drainage m, and

https://doi.org/10.5194/hess-25-653-2021                                           Hydrol. Earth Syst. Sci., 25, 653–669, 2021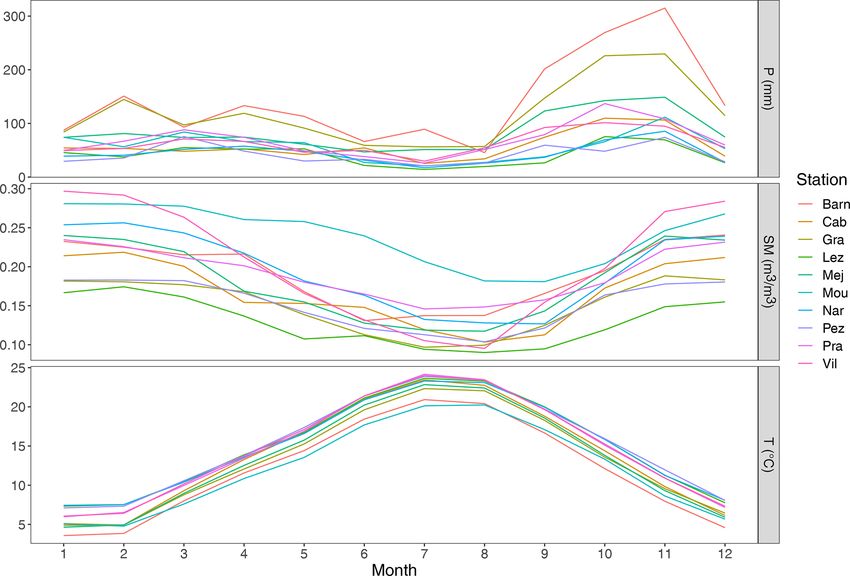
656           L. Mimeau et al.: Modeling the response of soil moisture to climate variability in the Mediterranean region

Table 1. Station characteristics.

                                                                                                   Soil properties
  Code     Name                        Lat    Long     Altitude    Precipitation     Clay   Sand      Silt    Soil class (ISSS)
                                       [◦ ]     [◦ ]        [m]      [mm yr−1 ]       [%]    [%]      [%]                         Land cover
  Barn     Barnas                   44.666     4.16        480             1734       9.5   77.3      13.2    Sandy loam          Tree cover
  Cab      Cabrieres d’Avignon      43.884    5.165        142              697      24.2   47.6      28.2    Clay loam           Cropland
  Gra      La Grand Combe           44.243     4.01        499             1412      12.9   73.2      13.9    Sandy loam          Urban areas
  Lez      Lezignan Corbieres       43.173    2.728         60              502      27.3     44      28.7    Light clay          Urban areas
  Mej      Mejannes-le-Clap         44.222    4.345        318              992      16.2   45.5      38.3    Clay loam           Grassland
  Mou      Mouthoumet                42.96     2.53        538              689      29.4    42       28.6    Light clay          Grassland
  Nar      Narbonne                  43.15    2.957        112              530      46.4   26.2      27.4    Heavy clay          Cropland
  Pez      Pézenas                  43.438    3.403         30              508      17.5   50.6      31.9    Clay loam           Cropland
  Pra      Prades-le-Lez            43.717    3.858         85              816      31.1    27       41.9    Light clay          Cropland
  Vil      Villevielle              43.795    4.091         41              756      13.6   65.7      20.7    Sandy loam          Cropland

Figure 2. Observed seasonal cycle of precipitation, soil moisture, and air temperature at the stations.

coefficient for evapotranspiration Kc (calibration ranges in              ficient used as the optimization criterion for the calibration
Table 2). These parameters are calibrated for each station us-            (Nash and Sutcliffe, 1970). Details on missing data at each
ing the total period of observed data, but two additional cali-           station are presented in Table S1 in the Supplement.
brations were performed on subperiods (first half and second
half of the total period) in order to analyze the stability of the        3.3      Generation of temperature and rainfall scenarios
calibration. For the calibration process, missing precipitation
and temperature data are reconstructed by replacing missing               For each station, a 20-year temperature data series is gen-
precipitation with an intensity of 0 mm h−1 and by linearly               erated by repeating the hourly climatic mean. Temperature
interpolating temperature data for gaps of less than 3 h or oth-          scenarios are generated by applying a delta ranging between
erwise using the climate mean. Time steps with reconstructed              +0 and +4 ◦ C.
precipitation and temperature are not taken into account in                  The stochastic weather generator, the standard version of
the calculation of the NSE (Nash–Sutcliffe efficiency) coef-              the Neyman–Scott rectangular pulse model (NSRP) (Cow-

Hydrol. Earth Syst. Sci., 25, 653–669, 2021                                                   https://doi.org/10.5194/hess-25-653-2021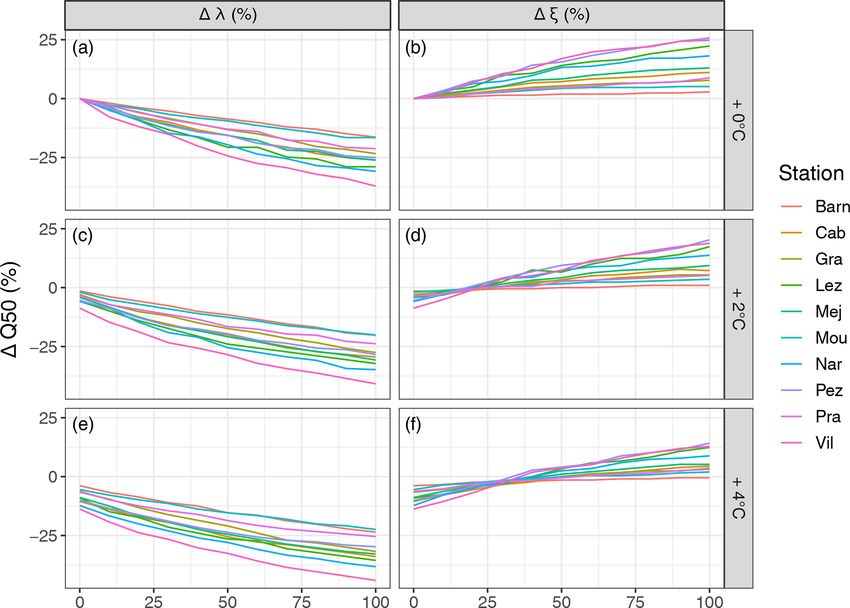
L. Mimeau et al.: Modeling the response of soil moisture to climate variability in the Mediterranean region                       657

Table 2. Fixed parameter values and ranges of calibrated parameters of the soil moisture model. Fixed parameter L is calculated as the
monthly percentage of the total daytime hours out of the total daytime hours of the year.

        Fixed parameter                               Value
        Wetting front soil suction head ψ             −155.0 mm
        Initial condition θ0                          0.2 m3 m−3
        Saturated soil moisture θsat                  max of observed soil moisture
        Residual soil moisture θres                   min of observed soil moisture
        Monthly potential evaporation coefficient L   0.208 0.234 0.266 0.300 0.329 0.345 0.339 0.314 0.282 0.248 0.218 0.201
        Soil layer depth Z                            300 mm
        Calibrated parameter                          Range
        Hydraulic conductivity Ks                     0.01 < Ks < 100 mm h−1
        Exponent of drainage m                        1 < m < 45
        Evaporation coefficient Kc                    0.5 < Kc < 2

pertwait et al., 1996), is used to generate 20 series of hourly         As studies on future precipitation patterns in the Mediter-
rainfall data time series. The peculiarity of the model lies in      ranean region predict an increase of the dry days frequency
its capability to preserve the statistical properties of rainfall    associated with an intensification of extreme precipitation
time series over a range of time scales. As the model has been       events (Paxian et al., 2015; Polade et al., 2017; Tramblay and
extensively described in previous papers (e.g., Cowpertwait          Somot, 2018; Chan et al., 2020; Pichelli et al., 2021), we gen-
et al., 1996; Camici et al., 2011) only a brief discussion is        erate precipitation scenarios with increasing precipitation in-
given here.                                                          termittence and increasing mean intensity by applying deltas
   The NSRP model has five parameters:                               from +0 % to +100 % on the λ and ξ parameters (see de-
                                                                     tails in Sect. 3.4). It should be noted that in some studies all
  – λ: mean waiting time between adjacent storm ori-                 the parameters of the rainfall generator are recalibrated after
    gins [h],                                                        the perturbation of rainfall statistics according to a climate
  – β: mean waiting time between rain cell origins after             change signal (Bordoy and Burlando, 2014). Other authors
    storm origins [h],                                               fixed some parameters while allowing others to change ac-
                                                                     cording to climate variability (Wasko et al., 2015). The latter
  – ν: mean number of rain cell per storm,                           approach is adopted herein, since preliminary experiments
                                                                     based on the recalibration of the NSRP generator were not
  – η: mean duration of rain cell [h],                               satisfactory due to the parameters’ instability when perform-
  – ξ : mean intensity of rain cell [mm h−1 ].                       ing multiple model calibration procedures. For each precip-
                                                                     itation scenario produced by the modification of the NSRP
   A Poisson process with parameter λ controls the genera-           model parameters λ and ξ , 20 precipitation data series are
tion of storm origins. For each storm origin, a random ν num-        generated with the NSRP model over a 20-year period and
ber of rain cell origins are generated displaced from the storm      used as input in the soil moisture model.
origin according to a β parameter exponentially distributed
process. The duration and intensity of each rain cell are ex-        3.4     Sensitivity analysis of the simulated soil moisture to
pressed by two other independent random variables assumed                    precipitation and temperature changes
exponentially distributed with parameter η and ξ , respec-
tively. These parameters are estimated, for each month of            3.4.1    Direct analysis
the year, by minimizing an objective function evaluated as
the weighted sum of the normalized residuals between the             We first analyze the sensitivity of the simulated soil mois-
statistical properties of the observed time series and their         ture for specific changes in temperature and precipitation.
theoretical expression derived from the model. The statisti-         We consider three temperature scenarios with 1T = +0, +2,
cal properties of rainfall included in the objective function to     +4 ◦ C, and 121 precipitation scenarios with 1ξ and 1λ reg-
calibrate the model are hourly mean, hourly variance, daily          ularly spaced between +0 % and +100 % with a 10 % incre-
variance, lag1 autocorrelation of daily data, hourly skewness,       ment. The soil moisture model is then run for each precipi-
daily skewness, and the percentage of dry days. Once the             tation and temperature scenario (i.e., 363 scenarios per sta-
model parameters are estimated for each month, the NSRP              tion) to analyze the sensitivity of the simulated soil moisture
model is run to produce continuous rainfall simulations.             to temperature and precipitation changes. Figure 3 presents
                                                                     the process for the simulation of the soil moisture scenar-

https://doi.org/10.5194/hess-25-653-2021                                              Hydrol. Earth Syst. Sci., 25, 653–669, 2021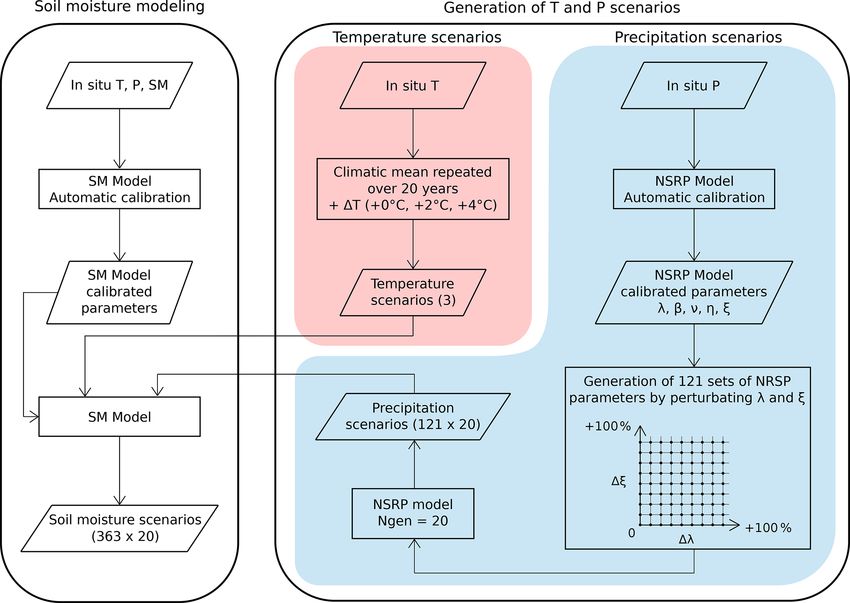
658          L. Mimeau et al.: Modeling the response of soil moisture to climate variability in the Mediterranean region

Figure 3. Flowchart of the experimental design for the simulation of the soil moisture scenarios.

ios. The simulation with no change in temperature or pre-                parameters X = (X1 , X2 , . . . , XN ). A functional ANOVA de-
cipitation intensity and intermittence is called the reference           composition is applied to Y (e.g., Sobol, 1993; Saltelli et al.,
scenario and is used to represent soil moisture conditions un-           2010):
der the present climate. The evolution of extreme soil mois-                        N              N
                                                                                                 N X
ture events is evaluated by estimating the mean number of
                                                                                    X            X
                                                                         V (Y ) =         Vi +              Vi,j + . . . + V1,2, ... ,N ,   (1)
days per year under either soil water excess or drought con-                        i=1          i=1 j >i
ditions. We consider episodes of soil water excess as consec-
utive days with a daily soil moisture above the reference sce-           where N represents the number of sampled parameters.
nario 95th percentile and drought episodes as days with soil             V (Y ) is the total variance of the model output, Vi is the
moisture below the 5th percentile. Considering the modeling              first-order variance of Y due to parameter Xi , Vij is the
chain as (i) the NSRP model (depending on the calibrated                 second-order variance (covariance) of Y due to Xi , and Xj
values of β, ν, η, λ, and ξ and the applied perturbations 1λ             is the higher-order variance due to more than two param-
and 1ξ ); (ii) the temperature scenario generation perturbed             eters. A first-order Sobol index Si corresponds to the ratio
of 1T , and (iii) the SM model, for a given set of parameters,           of the corresponding variance Vi to the total variance V (Y ):
a simulated ensemble of 20 stochastic replicates is generated.           Si = Vi /V (Y ) and is thus always between 0 and 1. The sum
Quantiles and annual numbers of days under drought or soil               of all the (first- and higher-order) Sobol indices is equal to
water excess are computed for each of the 20 corresponding               unity.
soil moisture results and then averaged to produce a unique                 Assuming that the changes in temperature and precipi-
scenario.                                                                tation are stochastic variables, the first-order Sobol indices
                                                                         are computed using the state-dependent parameter modeling
                                                                         proposed by (Ratto et al., 2007). For the GSA, a different set
3.4.2   Global sensitivity analysis                                      of 1000 sets of temperature and precipitation changes, gener-
                                                                         ated randomly in the range of values presented in Sect. 3.3, is
A global sensitivity analysis (GSA) (Saltelli et al., 2008; Pi-          used in order to cast continuously the range of values (1T =
anosi et al., 2016) assesses the model behavior (model out-              [+0; +4 ◦ C], 1λ = [0; +100 %]λ, and 1ξ = [0; +100 %]ξ ).
put sensitivity to the input parameters) in the whole param-             The objective of this sensitivity analysis is to estimate the rel-
eter space using a variance decomposition method. Consider               ative influences of changes in temperature and precipitation
Y = f (X) with Y being the output of the model f to a set of             characteristics on soil moisture.

Hydrol. Earth Syst. Sci., 25, 653–669, 2021                                                      https://doi.org/10.5194/hess-25-653-2021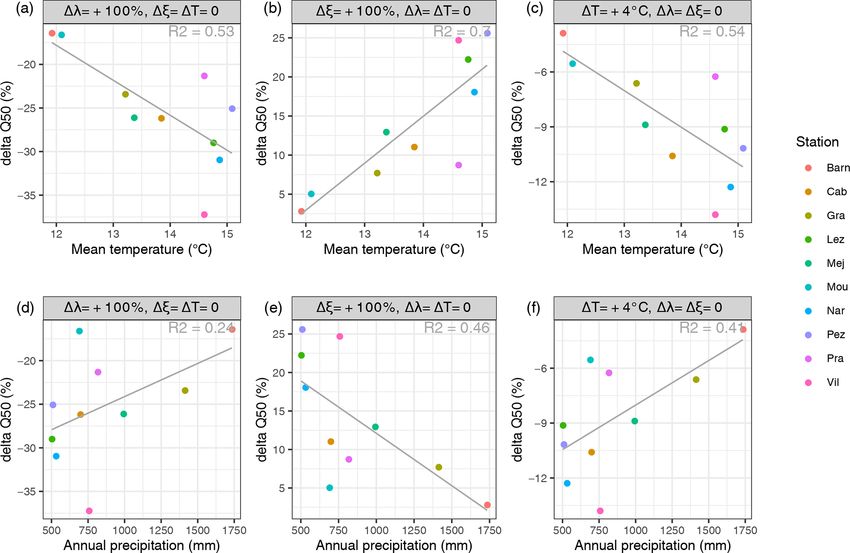
L. Mimeau et al.: Modeling the response of soil moisture to climate variability in the Mediterranean region                             659

Figure 4. Characteristics of simulated rainfall with the NSRP model for the reference scenario and observed rainfall. Comparison of simulated
and observed (a) annual rainfall and (b) annual number of dry days (dots represent mean values and bars represent the range from minimal
to maximal simulated or observed values). (c) Q–Q plot of daily rainfall intensities (dots represent deciles values).

4     Results                                                            with different patterns in annual rainfall, mean daily inten-
                                                                         sity, and annual number of dry days (Fig. 5). An equal per-
4.1    NSRP model calibration and generated rainfall                     turbation of ξ and λ leads to an unchanged annual rainfall
       scenarios                                                         with an increase in rainfall intensity and increased intermit-
                                                                         tence compared to the reference scenario. A perturbation of
Rainfall series generated with the NSRP model for the refer-             +100 % of the ξ parameter with no perturbation on the λ pa-
ence scenario show good agreement with the observed rain-                rameter leads to an increase of 100 % the annual rainfall
fall characteristics. Figure 4a shows that the mean annual               across all sites, associated with an increase of mean rain-
amount of rainfall is well reproduced by the model (r 2 =                fall intensity of wet days of +9.5 mm d−1 (+83 % of orig-
0.99) and that the range of values of annual amount of rainfall          inal rainfall intensity). Alternatively, an increase of +100 %
is also comparable to the range of observed values. The mean             of the lambda parameter with an unchanged value of ξ leads
annual number of dry days (i.e., days with precipitation be-             to a mean decrease of the annual rainfall of 50 % and an in-
low 1 mm) is similar to observations reproduced (r 2 = 0.71)             crease of +34 d yr−1 of dry days (+11 %). However, some
but with a bias going from −11 d (Cabrieres d’Avignon sta-               stations are more sensitive to the perturbation of parameters
tion) to +10 d (Mouthoumet station) (Fig. 4b). The NSRP                  than others. Figure 5d shows that the change in the annual
model tends to slightly overestimate lower values of the daily           number of dry days for 1λ = 100 % ranges between +8 %
intensities distribution (Fig. 4c), but overall, the simulated           and +16 %.
distributions are in good agreement with observed distribu-
tions (see Fig. S1 in the Supplement for the calibrated NSRP             4.2   SM model calibration
parameters).
   The perturbation of the NSRP parameters ξ and λ from                  Table 3 presents the calibrated parameters of the SM model
+0 % to +100 % enables one to produce rainfall scenarios                 and NSE values after calibration. The NSE values for the cal-

https://doi.org/10.5194/hess-25-653-2021                                                  Hydrol. Earth Syst. Sci., 25, 653–669, 2021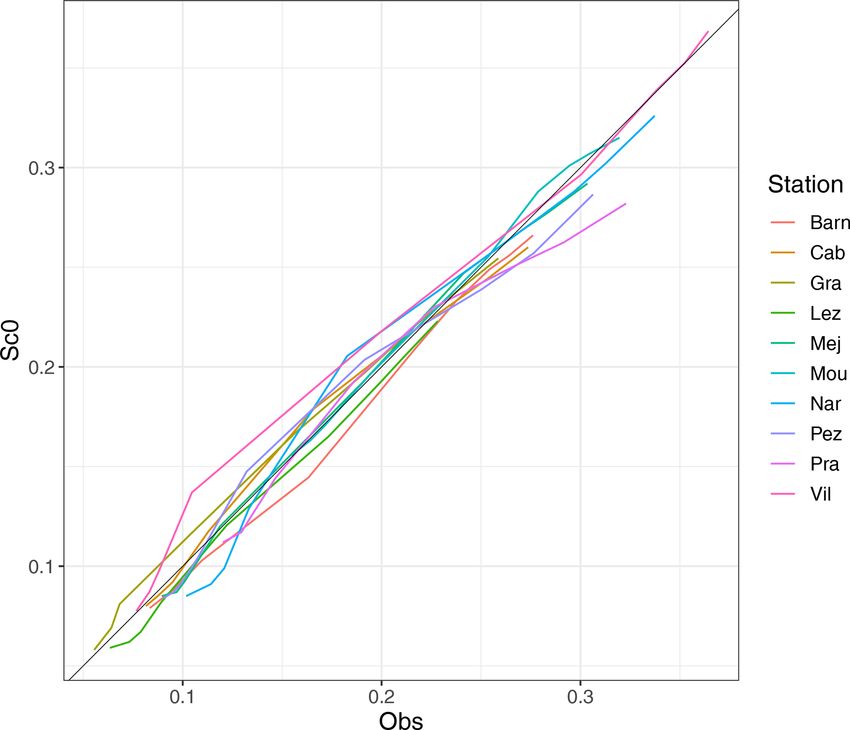
660 L. Mimeau et al.: Modeling the response of soil moisture to climate variability in the Mediterranean region
Figure 5. Impact of the perturbation of NSRP parameters λ and ξ on (a) the total annual precipitation, (b) the mean daily precipitation
intensity, and (c) the annual number of dry days. Panels (a–c) show averaged results for the 10 study sites and panel (d) shows the relation
between the perturbation of λ and the change in number of dry days for each station when ξ = 0.
Table 3. Calibrated parameters of the SM model and NSE validation values while calibrating on the total period.
Barn Cab Gra Lez Mej Mou Nar Pez Pra Vil
Ks (mm h−1 ) 38.1 34.3 35.9 23.1 28.8 36.2 51.1 14.6 59.6 6.9
m 17.6 15.6 10.9 14.1 16.4 23.0 15.9 12.8 11.89 38.2
Kc 1.17 1.43 1.74 1.22 1.81 0.94 1.26 1.99 1.32 1.63
NSE 0.76 0.77 0.93 0.85 0.9 0.63 0.91 0.789 0.65 0.9
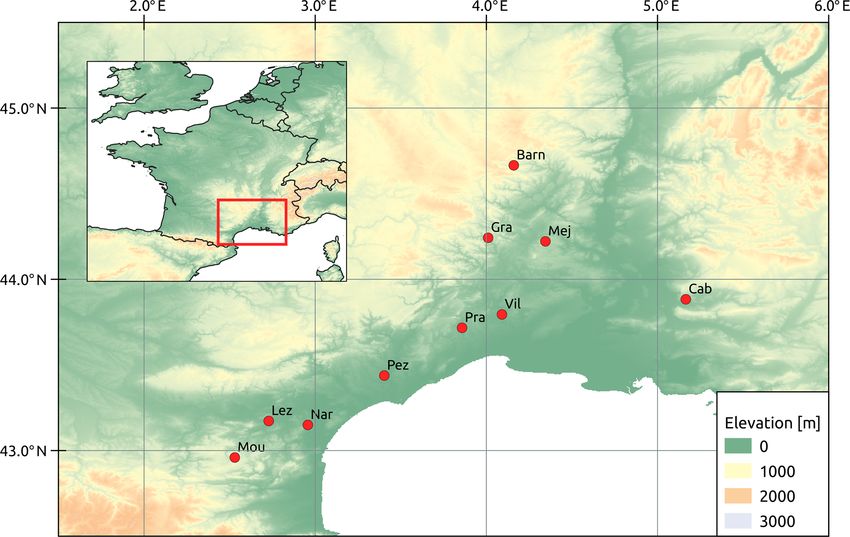
ibration on the total period are all above 0.6, and nine sta- Supplement). Figure 6 shows an example of soil moisture
tions out of 11 have an NSE value above 0.75. RMSE values simulation after calibration at the Villevielle station.
range from 0.015 to 0.032 m3 m−3 . Calibrations on the sub- The calibrated parameters are then used to simulate soil
periods (first and second halves of each station time series) moisture under different scenarios of temperature and precip-
lead to similar parameters (see Table S2 in the Supplement) itation. Figure 7 compares the distributions of observed daily
and NSE values on both subperiods, showing that the cali- soil moisture with simulated daily soil moisture forced with
bration is stable for the selected period. Lower NSE values the reference scenario. Results show that in the reference sce-
for the calibration on subperiods are due to missing observed nario the soil moisture distribution is in very good agreement
data unevenly distributed over the total period. These results with the distribution of observed soil moisture. The bias be-
show that the SMmodel is able to simulate soil moisture ac- tween the mean soil moisture from the reference scenario
curately in the present 2007–2016 period. Calibrated values and the mean observed soil moisture is low and ranges from
of Ks are consistent with the range of hydraulic conductivi- −0.006 to 0.01 m3 m−3 , all sites considered.
ties for natural soils (Angerer et al., 2014) (Table S3 in the
Hydrol. Earth Syst. Sci., 25, 653–669, 2021 https://doi.org/10.5194/hess-25-653-2021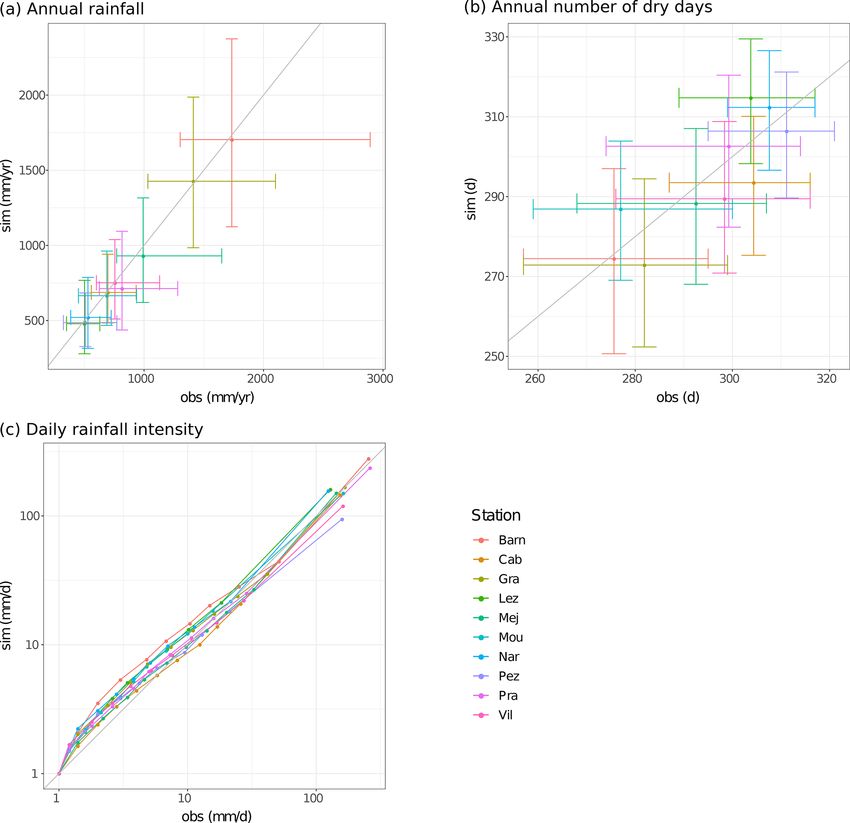
L. Mimeau et al.: Modeling the response of soil moisture to climate variability in the Mediterranean region                     661

Figure 6. Soil moisture simulation at the Villevielle station.

                                                                    temperature changes. Stations such as Villevielle, Narbonne,
                                                                    and Lézignan seem to be more sensitive to climate variabil-
                                                                    ity, whereas the Barnas, La Grand-Combe, Mouthoumet, and
                                                                    Prades-le-Lez stations show a lower impact of changing pre-
                                                                    cipitation patterns and temperature on the median soil mois-
                                                                    ture. The sensitivity of soil moisture response to changes in
                                                                    temperature and precipitation pattern seems to be correlated
                                                                    to the station local temperature and also to local precipita-
                                                                    tion to a lesser extent (Fig. 9). Southern stations presenting
                                                                    a warmer and dryer climate seem to be more impacted by
                                                                    changes in precipitation and temperature than northern sta-
                                                                    tions located in the Cevennes mountain range with a colder
                                                                    and wetter climate. No correlation was found between the
                                                                    soil moisture response and the NSRP model and SM model
                                                                    parameter values, meaning that the observed variability be-
Figure 7. Q–Q plot of simulated (reference scenario) and observed   tween stations is independent from the model calibrations.
daily soil moisture.                                                   Figure 10 presents the distribution for the 10 stations of
                                                                    the first-order Sobol indices of the median soil moisture
                                                                    (resp. number of days under drought or excess condition)
4.3   Sensitivity of soil moisture to precipitation and             to the parameter change (temperature, precipitation intensity,
      temperature changes                                           and precipitation intermittence). For instance, the Sobol in-
                                                                    dex of the soil moisture to a parameter is the percentage of
Figure 8 shows the sensitivity of the median simulated soil         the soil moisture variance explained by the considered pa-
moisture to changes in precipitation patterns. Results show         rameter. Over all the stations, the sum of the first-order Sobol
that the median soil moisture is more sensitive to changes in       indices are between 0.99 and 1.003, this indicates that the
precipitation intermittence (1λ) than to changes in precipita-      GSA is based on a sufficient number of simulations. The
tion mean intensity (1ξ ). For the +0 ◦ C scenario, an increase     Sobol sensitivity analysis shows that soil moisture variance is
of the precipitation intermittence of +100 % leads to a de-         more impacted by changes in precipitation intermittence than
crease between −16 % and −37 % on the median soil mois-             changes in precipitation intensity and temperature, especially
ture, whereas an increase of 100 % in the precipitation mean        for the median soil moisture and the number of days with
intensity only leads to an increase of the median soil mois-        drought (i.e., low soil moisture values). Changes in precipi-
ture ranging between +3 % and +26 %. Results also show              tation intensities have a larger impact on higher soil moisture
that stations have different sensitivity to precipitation and

https://doi.org/10.5194/hess-25-653-2021                                            Hydrol. Earth Syst. Sci., 25, 653–669, 2021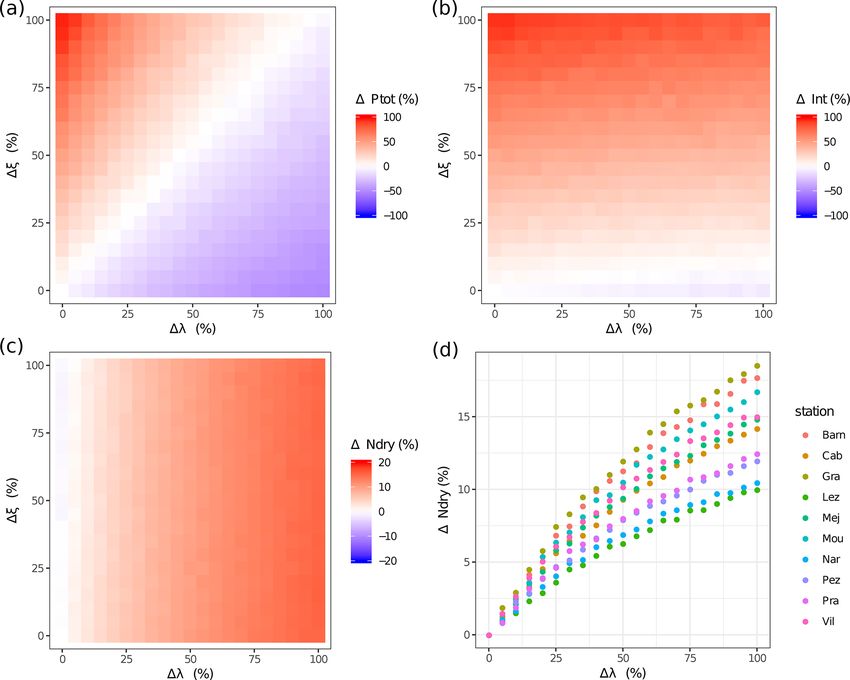
662           L. Mimeau et al.: Modeling the response of soil moisture to climate variability in the Mediterranean region

Figure 8. Sensitivity of the median of the simulated soil moisture to an increase of the precipitation intermittence (a, c, e) and to an increase
of mean precipitation intensity (b, d, f) under different temperature scenarios (+0, +2, +4 ◦ C).

Figure 9. Sensitivity of the median of the simulated soil moisture to precipitation and temperature scenarios (ξ : precipitation intensity
scenario, λ: precipitation intermittence scenario, T : temperature scenario) related to the observed mean annual (a) temperature and (b) pre-
cipitation.

Hydrol. Earth Syst. Sci., 25, 653–669, 2021                                                    https://doi.org/10.5194/hess-25-653-2021
L. Mimeau et al.: Modeling the response of soil moisture to climate variability in the Mediterranean region                                663

Figure 10. First-order Sobol sensitivity index of median soil moisture (a), the number of days under drought conditions (b), and the number of
days with water excess (c) to temperature, precipitation intensity, and precipitation intermittence changes. Boxplots represent the distribution
of the first-order Sobol indices for the 10 stations.

values and can be almost equivalent to the changes in precip-             regardless of the increase in precipitation intensity. Regard-
itation intermittence as, for example, in the Pézenas station.            ing the +4 ◦ C scenario, only 18 % of the scenarios result in
There is a link with the mean precipitation and Sobol indices             an increase of the number of days with wet soil moisture con-
related to changes in precipitation intermittence and inten-              ditions, and all scenarios with an increase of dry days above
sity. Indeed, the smaller the annual precipitation, the higher            +13 d yr−1 result in a decrease of the period under saturated
the Sobol index of the precipitation intermittence is for the             soil moisture conditions. Scenarios similar to those of Polade
median and 95th percentile of soil moisture (with correla-                et al. (2017) corresponding to RCP8.5 (i.e., scenarios corre-
tions equal to, respectively, r = −0.71, r = −0.56). It is the            sponding to a decrease of annual precipitation ranging be-
opposite relationship between annual precipitation and pre-               tween −10 % and −20 % and a +4 ◦ C temperature increase;
cipitation intensity (with correlations equal to r = 0.77 for             red triangles on Fig. 12) lead to an average of 10 d yr−1 with
median soil moisture, r = 0.33 for the 5th percentile, and                wet conditions, i.e., a decrease of 8 d yr−1 relative to the ref-
r = 0.74 for the 95th percentile). This indicates that changes            erence scenario (blue dots on Fig. 12).
in precipitation intermittence are more strongly impacting                    Concerning the impact of changing precipitation and tem-
soil moisture in locations with low annual precipitation.                 perature on dry soil moisture conditions, Fig. 11b shows that
                                                                          changes in precipitation and temperature have a strong im-
4.4   Impact of changing precipitation and temperature                    pact on droughts as almost all scenarios lead to an increase of
      on extreme soil moisture                                            dry soil moisture conditions. RCP8.5 scenarios show a mean
                                                                          number of days with dry soil moisture conditions ranging
In this section we analyze the response of extreme soil mois-             between 37 and 55 d yr−1 , corresponding to a mean increase
ture to the precipitation and temperature scenarios. Figure 11            of +28 d yr−1 compared to the reference scenario (Fig. 12).
shows the relative change of the mean annual number of days               This increase of dry days mainly impacts the summer and
under saturation or drought conditions with respect to the ref-           autumn seasons from June to October (Fig. 13). None of the
erence scenario for the Barnas and Pézenas stations (com-                 stations show an increase of extreme dry days during win-
plete results are presented in the Supplement). Days under                ter. These results show that agricultural drought events in
saturation (drought) conditions are defined as days with soil             the Mediterranean region are likely to be more intense with
moisture above the 95th (below the 5th) percentile of the ref-            longer episodes extending until the months of October and
erence scenario.                                                          November.
   There is a large variability in the evolution of the mean an-              Overall, the results show that changes in precipitation pat-
nual number of days with wet conditions, with results rang-               terns and temperature have a larger impact on the lowest
ing from −16 to +30 d yr−1 for the +2 ◦ C scenario and from               range of the soil moisture distribution than on the highest.
−17 to +22 d yr−1 for the +4 ◦ C scenario (Fig. 11a). For the             This means that climate change is very likely to have a major
+2 ◦ C scenario, only 24 % of the scenarios result in an in-              impact on agricultural droughts with dryer soil moisture and
crease of annual days with wet conditions on average for the              longer drought events. Regarding the impact on flood events,
10 stations. On average, an increase in dry days (i.e., days              it is difficult to make conclusions based on the results of this
with no precipitation) above +16 d yr−1 results in a decrease             study as we do not simulate runoff generation. Our results
of the number of days with saturated soil moisture condition

https://doi.org/10.5194/hess-25-653-2021                                                    Hydrol. Earth Syst. Sci., 25, 653–669, 2021
664 L. Mimeau et al.: Modeling the response of soil moisture to climate variability in the Mediterranean region
Figure 11. Sensitivity of the annual number of days (a) with saturated soil (i.e., with soil moisture above the observed 95th percentile)
and (b) under drought conditions (i.e., with soil moisture below the observed 5th percentile) according to changes in precipitation intensity
(y axis), precipitation intermittence (x axis), and temperature for the Barnas and Pézenas stations.
Figure 12. Variability of the annual number of days under saturated conditions (SM above the observed 95th percentile, a) and under drought
conditions (SM below the observed 5th percentile, b) at each station for a +4 ◦ C temperature scenario. Boxplots represent the results for all
precipitation scenarios with increasing precipitation intensity and intermittence. Blue dots represent the reference scenario, with no change
in temperature or precipitation pattern. Red triangles represent the mean of the scenarios with a decrease of annual precipitation between
−10 % and −20 % (corresponding to scenario RCP8.5; Polade et al., 2017).
show a decrease of the median soil moisture for most of the account in this study. To avoid this issue, it would be re-
considered scenarios as well as a decrease of days under sat- quired to consider land surface modeling schemes that are
urated conditions suggesting a higher infiltration capacity of able to take into account the feedback effects between veg-
the surface soil layer with a potential lower runoff genera- etation and land surface processes (Albergel et al., 2017).
tion. In addition, offline computation of potential evapotranspira-
tion with standard formulas such as the Blaney and Criddle
or Penman–Monteith equations can be problematic since it
5 Discussion neglects several factors, in particular the surface conditions
(Barella-Ortiz et al., 2013). The impact of different formula-
One of the main limitations to this study lies in the constant tions of potential evapotranspiration on soil moisture changes
soil moisture model parameters under different climate sce- needs also to be investigated, since simple temperature-based
narios. The use of constant parameters implies that processes formulas may overestimate the temperature effects on evap-
such as the adaptation of vegetation to soil water stress or the otranspiration (Sheffield et al., 2012; Vicente-Serrano et al.,
impact of rising CO2 on the vegetation physiology, which 2020).
may have a sensitive impact on evapotranspiration and thus Another source of uncertainty is related to the selection
soil moisture (Berg and Sheffield, 2018) are not taken into of temperature and precipitation scenarios. Currently the
Hydrol. Earth Syst. Sci., 25, 653–669, 2021 https://doi.org/10.5194/hess-25-653-2021L. Mimeau et al.: Modeling the response of soil moisture to climate variability in the Mediterranean region 665 Figure 13. Monthly anomaly of days under extreme drought for a +4 ◦ C temperature scenario. Gray lines represent the results for all precipitation scenarios with increasing precipitation intensity and intermittence. Black lines represent the median of the scenarios ensem- ble. Red lines represent the change of drought days for the scenarios with a decrease of annual precipitation between −10 % and −20 % (corresponding to scenario RCP8.5, Polade et al., 2017). majority of available climate simulations are at the daily with more arid climate conditions to investigate the possible time step. The projected changes on hourly climate char- relationships between soil moisture dynamics and soil types, acteristics remains largely unknown, and this is why we vegetation cover, and climate characteristics for different de- adopted a stochastic simulation approach to encompass the grees of aridity. Indeed, the Mediterranean region includes a plausible range of future scenarios. However, convection- great variety of types of vegetation, forming mosaic patterns permitting regional climate models (CPRCMs) have been in- created by variations in soil, topography, climate, fire history, creasingly implemented over Europe in recent years to repro- and human activity (Geri et al., 2010). Therefore, it would be duce hourly changes in precipitation (Coppola et al., 2018) very useful to produce a typology of the sensitivity of soil and these simulations should be considered in future experi- moisture changes for a variety of Mediterranean landscapes. ments. Similarly, the approach considered in the present pa- per is based on distributional changes, while the impact of possible changes in the seasonal to interannual variability of 6 Conclusions precipitations on soil moisture cannot be taken into account. This issue could be also resolved by using CPRCM simu- Soil moisture is an important variable to consider in a cli- lations instead of a stochastic rainfall generator to simulate mate change context since it strongly influences agricultural the soil moisture response to various changes in precipitation droughts and flood generation processes. Future climate sce- including seasonal and interannual variability. narios for the Mediterranean indicate an increase in temper- Finally, this study relies on a set of soil moisture observa- ature associated with an increased frequency of dry days but tions from different sites located in southern France and, de- also an intensification of extreme rainfall events. This study spite different annual precipitation and temperature patterns, considered soil moisture monitored at 10 plots located in the vegetation at the different locations belongs to the same southern France in a modeling framework aimed at estimat- biome. It would be interesting to perform this type of anal- ing its sensitivity to changes in precipitation and tempera- ysis on a larger set of sites located in various Mediterranean ture. For that purpose, a range of precipitation and tempera- environments, including North Africa and the Middle East, ture variations coherent with current climate scenarios avail- https://doi.org/10.5194/hess-25-653-2021 Hydrol. Earth Syst. Sci., 25, 653–669, 2021
666          L. Mimeau et al.: Modeling the response of soil moisture to climate variability in the Mediterranean region

able for the Mediterranean region have been generated with a          Montpellier. The authors wish to thank the three reviewers, Guil-
stochastic model to investigate the response of soil moisture         laume Evin, Ryan Teuling, and an anonymous reviewer.
to these climatic changes. The main result of this study shows
that the sensitivity of soil moisture to changes in precipitation
and temperature is similar at the different sites, with a higher      Financial support. This work is a contribution to the HYdrolog-
sensitivity of soil moisture to intermittent precipitation and        ical cycle in The Mediterranean EXperiment (HyMeX) program,
the number of dry days rather than rainfall intensity or the          through INSU-MISTRALS support.
temperature increase. However, these changes are modulated
by the climate characteristics of the different stations, with
                                                                      Review statement. This paper was edited by Markus Hrachowitz
a higher sensitivity of soil moisture to precipitation intermit-
                                                                      and reviewed by Guillaume Evin, Ryan Teuling, and one anony-
tence in locations with dryer and warmer climate characteris-         mous referee.
tics. Overall, it is observed that changes in precipitation and
temperature have a greater impact on low soil moisture val-
ues than on conditions close to soil saturation. This implies
that the current climate change scenarios may induce longer           References
periods of depleted soil moisture content, corresponding to
                                                                      Albergel, C., Rüdiger, C., Pellarin, T., Calvet, J.-C., Fritz, N., Frois-
agricultural drought conditions. About the potential impacts            sard, F., Suquia, D., Petitpa, A., Piguet, B., and Martin, E.: From
of soil moisture changes on flood generation, more research             near-surface to root-zone soil moisture using an exponential fil-
is needed to better understand the joint influence of lower             ter: an assessment of the method based on in-situ observations
antecedent soil moisture conditions associated with higher              and model simulations, Hydrol. Earth Syst. Sci., 12, 1323–1337,
rainfall intensity on flood magnitude and occurrence.                   https://doi.org/10.5194/hess-12-1323-2008, 2008.
                                                                      Albergel, C., Munier, S., Leroux, D. J., Dewaele, H., Fairbairn, D.,
                                                                        Barbu, A. L., Gelati, E., Dorigo, W., Faroux, S., Meurey, C.,
Data availability. The computed indices are available upon request      Le Moigne, P., Decharme, B., Mahfouf, J.-F., and Calvet, J.-C.:
to the corresponding author.                                            Sequential assimilation of satellite-derived vegetation and soil
                                                                        moisture products using SURFEX_v8.0: LDAS-Monde assess-
                                                                        ment over the Euro-Mediterranean area, Geosci. Model Dev., 10,
Supplement. The supplement related to this article is available on-     3889–3912, https://doi.org/10.5194/gmd-10-3889-2017, 2017.
line at: https://doi.org/10.5194/hess-25-653-2021-supplement.         Angerer, J. P., Bizimana, J.-C. B., and Alemayehu, S.: Reducing
                                                                        Risk in Pastoral Regions: The Role of Early Warning and Live-
                                                                        stock Information Systems, Revista Científica de Produção Ani-
                                                                        mal, 15, 9–21, 2014.
Author contributions. LM and YT designed the experiments, per-
                                                                      Barella-Ortiz, A., Polcher, J., Tuzet, A., and Laval, K.: Potential
formed the analyses, and wrote the paper. LB, CM, and SC con-
                                                                        evaporation estimation through an unstressed surface-energy bal-
tributed to the soil moisture modeling and climate scenarios.
                                                                        ance and its sensitivity to climate change, Hydrol. Earth Syst.
PFG contributed to the sensitivity analysis. All authors helped in-
                                                                        Sci., 17, 4625–4639, https://doi.org/10.5194/hess-17-4625-2013,
terpret the results and revised the paper.
                                                                        2013.
                                                                      Bennett, B., Leonard, M., Deng, Y., and Westra, S.: An empirical
                                                                        investigation into the effect of antecedent precipitation on flood
Competing interests. The authors declare that they have no conflict     volume, J. Hydrol., 567, 435–445, 2018.
of interest.                                                          Berg, A. and Sheffield, J.: Climate change and drought: the soil
                                                                        moisture perspective, Curr. Clim. Change Rep., 4, 180–191,
                                                                        2018.
Special issue statement. This article is part of the spe-             Berg, A., Sheffield, J., and Milly, P. C.: Divergent surface and total
cial issue “Hydrological cycle in the Mediterranean                     soil moisture projections under global warming, Geophys. Res.
(ACP/AMT/GMD/HESS/NHESS/OS inter-journal SI)”. It is                    Lett., 44, 236–244, 2017.
not associated with a conference.                                     Bordoy, R. and Burlando, P.: Stochastic downscaling of climate
                                                                        model precipitation outputs in orographically complex regions:
                                                                        2. Downscaling methodology, Water Resour. Res., 50, 562–579,
Acknowledgements. The authors would like to thank Météo-France          https://doi.org/10.1002/wrcr.20443, 2014.
for providing precipitation and temperature data; the soil moisture   Brocca, L., Morbidelli, R., Melone, F., and Moramarco, T.: Soil
data from the SMOSMANIA network were downloaded from the                moisture spatial variability in experimental areas of central Italy,
International Soil Moisture Network (https://ismn.geo.tuwien.ac.at/     J. Hydrol., 333, 356–373, 2007.
en/, last access: 9 February 2021). This work was made possible       Brocca, L., Melone, F., and Moramarco, T.: On the estimation of
through the support of the High Performance Computing Platform          antecedent wetness conditions in rainfall–runoff modelling, Hy-
MESO@LR (https://meso-lr.umontpellier.fr/, last access: 9 Febru-        drol. Process., 22, 629–642, 2008.
ary 2021), financed by the Occitanie/Pyrénées-Méditerranée Re-        Brocca, L., Camici, S., Melone, F., Moramarco, T., Martínez-
gion, Montpellier Mediterranean Metropole, and the University of        Fernández, J., Didon-Lescot, J.-F., and Morbidelli, R.: Improv-

Hydrol. Earth Syst. Sci., 25, 653–669, 2021                                                https://doi.org/10.5194/hess-25-653-2021
L. Mimeau et al.: Modeling the response of soil moisture to climate variability in the Mediterranean region 667 ing the representation of soil moisture by using a semi-analytical impact runoff from a natural catchment, J. Hydrol., 554, 317– infiltration model, Hydrol. Process., 28, 2103–2115, 2014. 330, 2017. Brocca, L., Ciabatta, L., Massari, C., Camici, S., and Tarpan- Guo, D., Westra, S., and Maier, H. R.: An inverse approach to per- elli, A.: Soil moisture for hydrological applications: turb historical rainfall data for scenario-neutral climate impact open questions and new opportunities, Water, 9, 140, studies, J. Hydrol., 556, 877–890, 2018. https://doi.org/10.3390/w9020140, 2017. Hanel, M., Rakovec, O., Markonis, Y., Máca, P., Samaniego, Calanca, P.: Interannual variability of summer mean soil moisture L., Kysel, J., and Kumar, R.: Revisiting the recent European conditions in Switzerland during the 20th century: A look using a droughts from a long-term perspective, Scient. Rep., 8, 9499, stochastic soil moisture model, Water Resour. Res., 40, W12502, https://doi.org/10.1038/s41598-018-27464-4, 2018. https://doi.org/10.1029/2004WR003254, 2004. Hertig, E. and Tramblay, Y.: Regional downscaling of Mediter- Calvet, J.-C., Fritz, N., Froissard, F., Suquia, D., Petitpa, A., and ranean droughts under past and future climatic conditions, Piguet, B.: In situ soil moisture observations for the CAL/VAL Global Planet. Change, 151, 36–48, 2017. of SMOS: The SMOSMANIA network, in: 2007 IEEE Interna- Hertig, E., Tramblay, Y., Romberg, K., Kaspar-Ott, I., and Merken- tional Geoscience and Remote Sensing Symposium, IEEE, 23– schlager, C.: The impact of soil moisture on precipitation down- 27 July 2007, Barcelona, Spain, 1196–1199, 2007. scaling in the Euro-Mediterranean area, Clim. Dynam., 52, Camici, S., Tarpanelli, A., Brocca, L., Melone, F., and Moramarco, 2869–2884, 2019. T.: Design soil moisture estimation by comparing continuous and Hoerling, M., Eischeid, J., Perlwitz, J., Quan, X., Zhang, T., and storm-based rainfall-runoff modeling, Water Resour. Res., 47, Pegion, P.: On the increased frequency of Mediterranean drought, W05527, https://doi.org/10.1029/2010WR009298, 2011. J. Climate, 25, 2146–2161, 2012. Chan, S. C., Kendon, E. J., Berthou, S., Fosser, G., Lewis, E., and Holgate, C., De Jeu, R., van Dijk, A., Liu, Y., Renzullo, L., Vinod- Fowler, H. J.: Europe-wide precipitation projections at convec- kumar, Dharssi, I., Parinussa, R., Van Der Schalie, R., Gevaert, tion permitting scale with the Unified Model, Clim. Dynam., 55, A., Walker, J., McJannet, D., Cleverly, J., Haverd, V., Trudinger, 409–428, https://doi.org/10.1007/s00382-020-05192-8, 2020. C., and Briggs, P.: Comparison of remotely sensed and modelled Coppola, E., Sobolowski, S., Pichelli, E., Raffaele, F., Ahrens, B., soil moisture data sets across Australia, Remote Sens. Environ., Anders, I., Ban, N., Bastin, S., Belda, M., Belusic, D., Caldas- 186, 479–500, https://doi.org/10.1016/j.rse.2016.09.015, 2016. Alvarez, A., Cardoso, R. M., Davolio, S., Dobler, A., Fernan- Ivancic, T. J. and Shaw, S. B.: Examining why trends in very heavy dez, J., Fita, L., Fumiere, Q., Giorgi, F., Goergen, K., Güt- precipitation should not be mistaken for trends in very high river tler, I., Halenka, T., Heinzeller, D., Hodnebrog, Ø., Jacob, D., discharge, Climatic Change, 133, 681–693, 2015. Kartsios, S., Katragkou, E., Kendon, E., Khodayar, S., Kunst- Keller, L., Rössler, O., Martius, O., and Weingartner, R.: Com- mann, H., Knist, S., Lavín-Gullón, A., Lind, P., Lorenz, T., Ma- parison of scenario-neutral approaches for estimation of climate raun, D., Marelle, L., van Meijgaard, E., Milovac, J., Myhre, change impacts on flood characteristics, Hydrol. Process., 33, G., Panitz, H.-J., Piazza, M., Raffa, M., Raub, T., Rockel, B., 535–550, https://doi.org/10.1002/hyp.13341, 2019. Schär, C., Sieck, K., Soares, P. M. M., Somot, S., Srnec, L., Knist, S., Goergen, K., Buonomo, E., Christensen, O. B., Colette, Stocchi, P., Tölle, M. H., Truhetz, H., Vautard, R., de Vries, H., A., Cardoso, R. M., Fealy, R., Fernández, J., García-Díez, M., and Warrach-Sagi, K.: A first-of-its-kind multi-model convec- Jacob, D., Kartsios, S., Katragkou, E., Keuler, K., Mayer, S., tion permitting ensemble for investigating convective phenom- van Meijgaard, E., Nikulin, G., Soares, P. M. M., Sobolowski, ena over Europe and the Mediterranean, Clim. Dynam., 55, 3–34, S., Szepszo, G., Teichmann, C., Vautard, R., Warrach-Sagi, https://doi.org/10.1007/s00382-018-4521-8, 2018. K., Wulfmeyer, V., and Simmer, C.: Land-atmosphere coupling Cowpertwait, P., O’Connell, P., Metcalfe, A., and Mawdsley, J.: in EURO-CORDEX evaluation experiments, J. Geophys. Res.- Stochastic point process modelling of rainfall. I. Single-site fit- Atmos., 122, 79–103, 2017. ting and validation, J. Hydrol., 175, 17–46, 1996. Koster, R. D., Dirmeyer, P. A., Guo, Z., Bonan, G., Chan, E., Cox, Crow, W. T., Berg, A. A., Cosh, M. H., Loew, A., Mohanty, B. P., P., Gordon, C., Kanae, S., Kowalczyk, E., Lawrence, D., Liu, P., Panciera, R., de Rosnay, P., Ryu, D., and Walker, J. P.: Upscal- Lu, C.-H., Malyshev, S., McAvaney, B., Mitchell, K., Mocko, ing sparse ground-based soil moisture observations for the vali- D., Oki, T., Oleson, K., Pitman, A., Sud, Y. C., Taylor, C. M., dation of coarse-resolution satellite soil moisture products, Rev. Verseghy, D., Vasic, R., Xue, Y., and Yamada, T.: Regions of Geophys., 50, RG2002, https://doi.org/10.1029/2011RG000372, strong coupling between soil moisture and precipitation, Science, 2012. 305, 1138–1140, 2004. Geri, F., Amici, V., and Rocchini, D.: Human activity impact on the Koster, R. D., Guo, Z., Yang, R., Dirmeyer, P. A., Mitchell, K., and heterogeneity of a Mediterranean landscape, Appl. Geogr., 30, Puma, M. J.: On the nature of soil moisture in land surface mod- 370–379, https://doi.org/10.1016/j.apgeog.2009.10.006, 2010. els, J. Climate, 22, 4322–4335, 2009. Giannakopoulos, C., Le Sager, P., Bindi, M., Moriondo, M., Laio, F., Porporato, A., Ridolfi, L., and Rodriguez-Iturbe, I.: Kostopoulou, E., and Goodess, C.: Climatic changes and asso- Plants in water-controlled ecosystems: active role in hydro- ciated impacts in the Mediterranean resulting from a 2 ◦ C global logic processes and response to water stress: II. Probabilis- warming, Global Planet. Change, 68, 209–224, 2009. tic soil moisture dynamics, Adv. Water Resour., 24, 707–723, Grillakis, M. G.: Increase in severe and extreme soil moisture https://doi.org/10.1016/S0309-1708(01)00005-7, 2001. droughts for Europe under climate change, Sci. Total Environ., Lionello, P. and Scarascia, L.: The relation between climate change 660, 1245–1255, 2019. in the Mediterranean region and global warming, Reg. Env- Guo, D., Westra, S., and Maier, H. R.: Use of a scenario-neutral iron. Change, 18, 1481–1493, https://doi.org/10.1007/s10113- approach to identify the key hydro-meteorological attributes that 018-1290-1, 2018. https://doi.org/10.5194/hess-25-653-2021 Hydrol. Earth Syst. Sci., 25, 653–669, 2021
You can also read