Comparison between precipitation estimates of ground-based weather radar composites and GPM's DPR rainfall product over Germany - Schweizerbart ...
←
→
Page content transcription
If your browser does not render page correctly, please read the page content below
B      Meteorol. Z. (Contrib. Atm. Sci.), Vol. 29, No. 6, 451–466 (published online July 17, 2020)
       © 2020 The authors
                                                                                                             Measurement Techniques

Comparison between precipitation estimates of ground-based
weather radar composites and GPM’s DPR rainfall product
over Germany
Velibor Pejcic1∗ , Pablo Saavedra Garfias2 , Kai Mühlbauer1, Silke Trömel1,3 and
Clemens Simmer1,3
1
  Institute for Geosciences, Section Meteorology, University of Bonn, Bonn, Germany
2
  Geophysical Institute, University of Bergen, Bergen, Norway
3
  Laboratory for Clouds and Precipitation Exploration, Geoverbund ABC/J, Bonn, Germany
(Manuscript received April 17, 2020; in revised form June 8, 2020; accepted June 8, 2020)

             Abstract
             We compare more than three years (between 2014 and 2018) of precipitation estimates over Germany from
             the Dual-frequency Precipitation Radar (DPR) operating on the core satellite of the Global Precipitation
             Mission (GPM) with the radar-derived precipitation product RADOLAN RY provided by the German national
             meteorological service (DWD, Deutscher Wetterdienst). Incomplete overlap between the observation volumes
             due to the different scan geometries and inconsistencies related to the mutually assumed hydrometeor phases
             lead to large differences, when directly comparing DPR’s near surface product (DPRns) with RADOLAN RY.
             We improve the correspondence between both data sets via two steps. First, we derive an adjusted DPR near
             surface product (DPRans) extracted from the DPR vertical profiles, that best fits to the scans height and
             beam width of the surface radar observations. Second, the data is classified into liquid, solid and mixed
             phases by adjusting hydrometeor phase classification (aHPC) to the RADOLAN scan geometry. With these
             steps the correlation between both data sets increases from r = 0.49 to r = 0.61 and the RMSD is reduced
             from 2.94 mm/h to 1.83 mm/h for the commonly observed precipitation, exceeding most of the results found
             in previous studies. The agreement is best in stratiform precipitation (r = 0.68, RMSD = 1.4 mm/h), for only
             stratiform and summer season (r = 0.7, RMSD = 1.59 mm/h), and for stratiform with only liquid precipitation
             (r = 0.67, RMSD = 1.58 mm/h). Unlike the the standard DPRns, the new DPRans product exhibits almost
             no seasonal differences in the capability of detection; for all seasons the CSI is 0.94 and the FAR/IFAR
             are 0.04/0.02.
             Keywords: GPM DPR, RADOLAN, satellite rain rate, surface precipitation

1 Introduction                                                                and Ku-band (13.5 GHz) Precipitation Radar (DPR).
                                                                              The satellite with a non-sun-synchronous low earth or-
The Global Precipitation Measurement (GPM) mission                            bit (LEO) of around 400 km allows for observations
is a constellation of satellites, that provide global ob-                     over a much wider latitude belt between 65° North and
servations of rain and snow. GPM’s central objective                          65° South compared to TRMM.
is to improve our understanding of the global water
cycle and its connection to climate change, mesoscale                             GMI and its DPR are especially suited for the
dynamics and storm structures, and to gain new in-                            detection of light precipitation and snow, which are
sights into microphysical processes (Hou et al., 2014).                       quite common at mid and high latitudes (Skofronick-
The GPM core satellite, a joint effort of the National                        Jackson et al., 2017). The wider coverage of the GPM
Aeronautics and Space Administration (NASA) and the                           core satellite fills the large observational gaps for precip-
Japan Aerospace Exploration Agency (JAXA) launched                            itation over oceans and areas with low-density or non-
into orbit on February 2014, is the successor for the                         existing surface networks, and thus has the potential to
Tropical Rainfall Measuring Mission (TRMM; Simpson                            improve climatological datasets and to provide valuable
et al., 1988) and the second satellite in space carrying                      observations for numerical weather forecasting (Con-
a precipitation radar. While TRMM observations were                           rick and Mass, 2019) and hydrological and global cli-
restricted to the tropical/subtropical belt, GPM allows                       mate modeling. GPM observations are also helpful for
for almost global observations. The GPM core satellite                        flood and extreme weather detection and very impor-
payload comprises two main instruments: the conical-                          tant for global-scale hazard frameworks (Kirschbaum
scanning multi-channel (10–183 GHz) microwave im-                             et al., 2012; Wu et al., 2012; Hou et al., 2014). War-
ager (GMI) and the dual-frequency Ka-band (35.5 GHz)                          ren et al. (2018) show that DPR observations have also
∗ Correspondingauthor: Velibor Pejcic, Institute for Geosciences, Section     some potential to serve as a calibration standard for dis-
Meteorology, University of Bonn, Auf dem Hügel 20, 53121 Bonn, e-mail:        tributed ground-based precipitation radars. Louf et al.
velibor@uni-bonn.de                                                           (2019) and Crisologo et al. (2018) enhanced the con-

                                                                                                                          © 2020 The authors
DOI 10.1127/metz/2020/1039                                    Gebrüder Borntraeger Science Publishers, Stuttgart, www.borntraeger-cramer.com
452 V. Pejcic et al.: Comparison between ground-based and space-borne rainfall product over Germany Meteorol. Z. (Contrib. Atm. Sci.)
                                                                                                                              29, 2020

Figure 1: C-band precipitation Doppler radar network of DWD. The circles are the maximum radar ranges. The grey circles represent
single-pol radars. The left image shows in color the range bin heights above ground in km. The right image shows in color the number of
vertical GPM-DPR range bins contained within a single RY bin.

sistency of this calibration and increased its accuracy.             the pre- and post-launch era, and have been specifically
Similarly, GMI’s brightness temperature measurements                 designed for individual ground-based weather radars
are used as an inter-satellite calibration standard for pas-         networks (Schwaller and Morris, 2011; Kim et al.,
sive microwave radiometers (PMR) on other satellites                 2014). Le et al. (2016) report about a DPR post-launch
(Neeck et al., 2014).                                                evaluation over the United States of America with
    A wide variety of precipitation products are obtained            weather radars from NEXRAD and TRMM products.
from the single/dual frequency radar observations, pas-              Field campaigns like the NASA Olympic Mountains
sive observations or combined active-passive observa-                Ground Validation Experiment (OLYMPEX; Houze
tions. Both single-frequency and dual-frequency rain re-             et al., 2015), Iowa Flood Studies (IFloodS, Chen et al.,
trievals (Liao et al., 2014; Iguchi et al., 2000) from the           2017; Nayak et al., 2016) and the Integrated Precipita-
core satellite are provided as standard products. Re-                tion and Hydrology Experiment (IPHEx, Barros et al.,
trievals with the Goddard Profiling Algorithm GPROF                  2014) contributed to these efforts with multi-sensor ob-
algorithm (Kummerow et al., 2015) and the GPM com-                   servations at the ground and from aircraft in order to as-
bined algorithm are based on both the core satellite’s               sess the performance of satellite estimates over different
GMI and DPR observations (Grecu et al., 2016). These                 terrain types and for various precipitation regimes.
multi-sensor precipitation retrieval methods are applied                 Over Europe only few studies are available. E.g. Pe-
to the whole GPM satellite constellation in order to gen-            tracca et al. (2018) evaluate the DPR liquid rain near-
erate the global Integrated Multi-satellitE Retrievals for           surface products over complex terrain in Italy and found
GPM (IMERG, Huffman et al., 2015; Tan et al., 2019).                 an overall correlation of r = 0.44 with uncertainties in-
    GPM-based precipitation retrievals are usually eval-             creasing with terrain elevation and a higher quality of
uated by comparison with ground-based measurements.                  rain estimates during warm compared to cold periods.
Since the launch of the TRMM satellite many such                     Investigations in complex terrain in Switzerland (Speirs
comparisons have been performed, although restricted                 et al., 2017) revealed that in addition to surface eleva-
to the tropics and subtropics e.g. over West Africa                  tion the terrain unevenness also contributes to inaccura-
(Nicholson et al., 2003), South America (Rozante                     cies of GPM products. Similar to Petracca et al. (2018)
et al., 2010), Korea (Park et al., 2015), Australia (Deo             they found higher correlations between ground-based
et al., 2018), and the United States (Wolff et al., 2005;            and satellite-based estimates for liquid phase precipi-
Liao and Meneghini, 2009). Comparisons with pre-                     tation (r = 0.796) and during summer (r = 0.658) com-
cipitation gauges and reanalysis data yield good agree-              pared to solid precipitation (r = 0.521) and during winter
ments, particularly for cases with observations below the            (r = 0.57). Watters et al. (2018) report similar findings,
melting layer, over oceans, over flat terrain, and for strat-        but noted that misinterpretations of the bright band as
iform precipitation (Cannon et al., 2017; Speirs et al.,             clutter could lead to an underestimation of the DPR de-
2017; Petracca et al., 2018).                                        rived rain rates, and that the accuracy of the estimated
    Products derived from observations of the GPM core               bright-band height from DPR profiles plays an impor-
satellite allow for extended ground evaluations com-                 tant role in the estimation of near-surface precipitation.
pared to TRMM because of GPM’s additional radar fre-                 For stratiform events its estimation error was found to
quency and higher inclination orbit leading to a wider               be on the order of 125 m compared to in-situ radar mea-
range of observed climate regions. Ground validation                 surements. Comparisons with freezing level heights de-
systems were established to support the development                  rived from re-analyses showed even better agreements
and evaluation of the GPM core satellite algorithms in               (Cannon et al., 2017).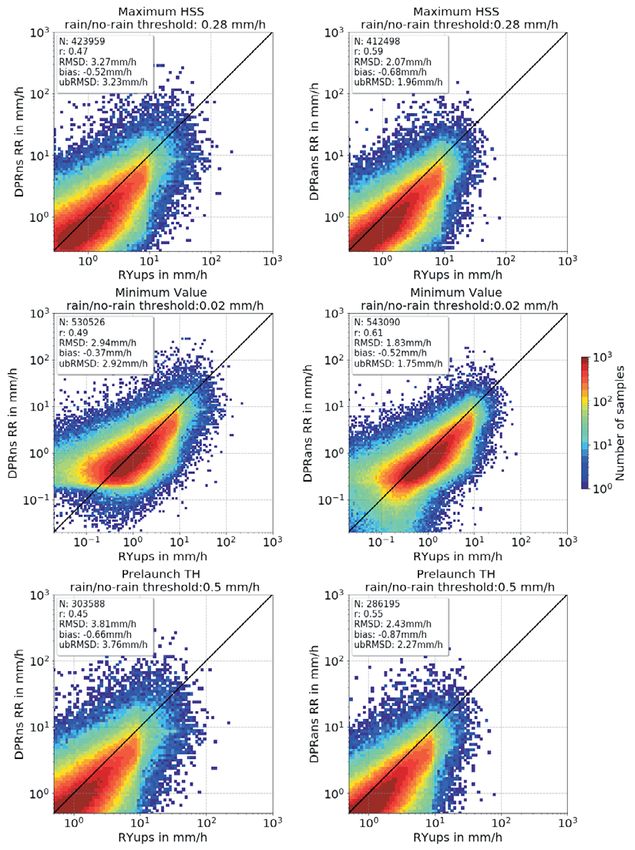
Meteorol. Z. (Contrib. Atm. Sci.) V. Pejcic et al.: Comparison between ground-based and space-borne rainfall product over Germany   453
29, 2020

    Despite extensive research on the different sources             and are designed for light rain and snow detection by
of uncertainties in previous studies, there is still a lack         operating in a high-sensitivity mode with a reduced ver-
of knowledge regarding the effects introduced by phase              tical resolution of 250 m (Furukawa et al., 2013).
miss-classification and spatial mismatches between the                  The different scans allow for both single- (SF) and
so-called DPR near surface product (DPRns) and the                  dual-frequency (DF) precipitation retrievals. For foot-
ground-based precipitation estimates due to the different           prints containing both frequencies bright-band detection
scanning geometries performed by both system types.                 (altitude and thickness), precipitation phase classifica-
Here, we compare the latest version (V05) of the DPR                tion (solid, mixed, liquid), and precipitation type (strati-
precipitation estimates with three years of the Germany-            form, convective) are derived following Le et al. (2016),
wide near-surface precipitation product RADOLAN of                  Le and Chandrasekar (2013) and Awaka et al. (2016).
the German national meteorological service (DWD,                    Parameters of the drop size distribution (DSD) and de-
Deutscher Wetterdienst). The DWD offers a wide va-                  rived precipitation rates are estimated from the dual-
riety of different radar products that are widely used              frequency ratio (DFR) following Seto et al. (2013). For
for research on hydrology (Winterrath et al., 2012;                 SF retrievals, especially for the outer swath footprints
Fischer et al., 2016; Auerswald et al., 2019), data as-             of the NS, precipitation type and bright band height are
similation (Milan et al., 2008) and climate (Winter-                estimated with the TRMM method (Awaka et al., 1997;
rath et al., 2018; Junghänel et al., 2016; Pscheidt                 Awaka et al., 2016), and DSD parameters are estimated
et al., 2019; Lengfeld et al., 2019). We focus on the RY            from the ratio of reflectivity to specific attenuation fol-
composite product derived from the so-called precipi-               lowing Seto et al. (2013). Classifications and retrievals
tation scans of the weather radar network. This prod-               are performed from the uppermost level of detected re-
uct is generated only from archived operational radar               flectivity (storm top height, STH) to the lowest level
data and is not the climatological data used in Auers-              not contaminated with ground clutter (clutter-free bot-
wald et al. (2019). RY allows a more detailed quan-                 tom, CFB). Reported precipitation rates below the CFB
tification on uncertainties between pure radar observa-             (typically around 0.9 km above ground) are extrapolated
tions. The precipitation scans follow the orography to              values above the CFB estimates (Awaka et al., 2016;
avoid terrain-caused beam blocking, hence the observa-              Iguchi et al., 2017).
tions used for RY originate from different heights and                  We evaluate in this study the dual-frequency nor-
have varying sampling volumes depending on the dis-                 mal scan (DF NS) product (file specification 2ADPR,
tance from a particular radar to its range bins used,               Iguchi and Meneghini, 2019), which consists of dual-
which should to be taken into account when compar-                  frequency rain retrievals in the inner swath and single-
ing with the commonly-used near-surface product pro-                frequency rain retrievals in the outer swath. 2ADPR data
vided by DPR V05 (Section 2). We first quantify the un-             files include the vertical profiles of the precipitation rate
certainties by directly comparing the DPR near-surface              estimates (variable name precipRate) and the hydrom-
product (DPRns) with the upscaled RY product, but sug-              eteor phase (variable name phase), and a near-surface
gest a better suited DPR product spatially adjusted to the          precipitation rate estimate (variable name precipRate-
upscaled RY (DPRans). We examine the quality of the                 NearSurface; in the following termed DPRns) which is
matching for different orographic, synoptic, and micro-             the precipitation rate estimated at the first bin above the
physical (hydrometeor types) influences, and for non-               clutter free bottom (CFB) height.
uniform hydrometeor-phase beam-filling effects (Sec-
tion 3). The results are summarized and discussed in                2.2 RADOLAN RY product
Section 4.
                                                                    RADOLAN-RY (Radar online adjustment, RADar On-
2 Data and Methods                                                  Line ANeichung, in the following abbreviated by RY)
                                                                    is the DWD procedure to derive radar-based composite
2.1 DPR products                                                    precipitation products from the 17 C-band radars cover-
                                                                    ing Germany (16 dual-pol and one single-pol radar lo-
The DPR measures vertical profiles of radar reflectiv-              cated in the northwestern area (Emden, Figure 1 grey
ity at Ku and at Ka band with footprints of about 5 km              circle) at a 1 km spatial resolution grid and five min-
in diameter. The Ku-band radar scans across orbit with              utes temporal resolution (Figure 1, left). An adjust-
a swath width of 245 km resolved in 49 footprints for               ment to rain gauges – as suggested in the acronym
the so-called Normal Scan (NS) with a vertical resolu-              RADOLAN – is only carried out for an hourly prod-
tion of 125 m. The Ka-band scans a smaller swath of                 uct and not for the RY product. All radars perform
120 km also with 49 footprints but separated into two               the so-called precipitation scan with an azimuthal res-
scan types: the Matched Scan (MS) contains 25 foot-                 olution of 1° and a range resolution of 250 m with an
prints exactly overlapping the footprints of the inner-             orography-following elevation angle (0.5°–1.8°). For the
most 25 footprints of the NS and has a vertical resolu-             RADOLAN RY procedure, however, 1 km range reso-
tion of 125 m; the 24 footprints of the High Sensitivity            lution is provided. RY rain rates are based on a radar
Scan (HS) are shifted along-scan by half a footprint rel-           reflectivity-dependent z-R relationships derived for liq-
ative to the MS (see Figure 2.2-2 in Iguchi et al., 2017)           uid hydrometeors, which are applied to the observed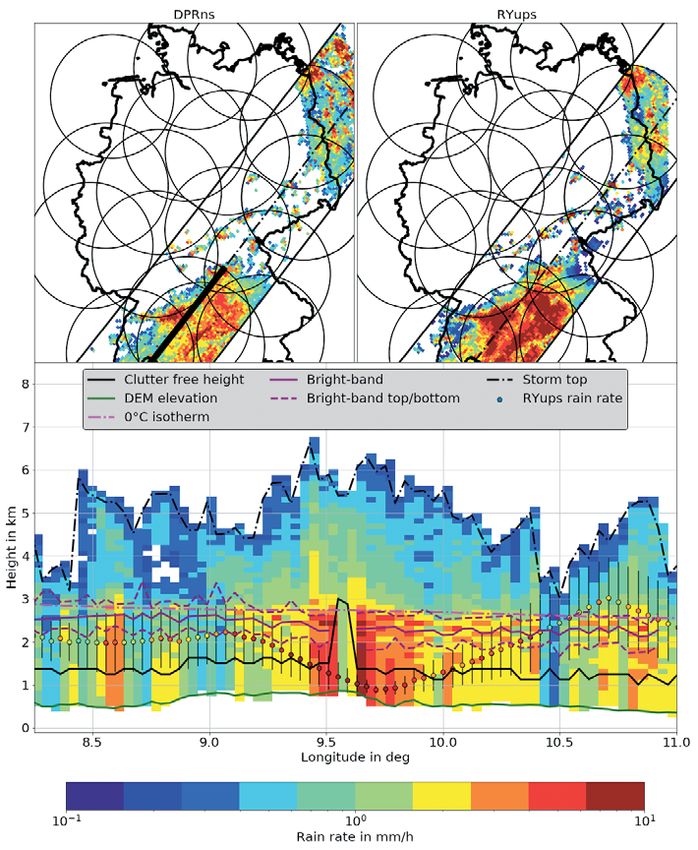
454 V. Pejcic et al.: Comparison between ground-based and space-borne rainfall product over Germany Meteorol. Z. (Contrib. Atm. Sci.)
                                                                                                                                29, 2020

Figure 2: Schematic representation depicting the averaging procedure for generating the DPR adjusted near surface product (DPRans) from
the DPR column-resolved rain rate estimates (DPR beams) encompassing the ground-based radar beam from which the RADOLAN RY
product is generated. In gray the pre-composite ground-based radar observation geometry is shown. The horizontal red line indicates its
spatial grid and thus the center points of the RY composite. The colored cylinders represent the quasi-horizontal DPR range bins with the
color indicating their precipitation phase. The bins used for the construction of the DPRans rain rate and the hydrometeor phase product
are indicated within the vertical red rectangle. The clutter free bottom (CFB) (estimated height of DPRns) is shown with a dashed green
horizontal line. GPM picture modified from Hou et al. (2014)

radar reflectivity after clutter- and beam blockage-                  as DPR, hereafter referred to as RYups. Since the RY
corrections (Bartels et al., 2004; https://www.dwd.de/                estimates are available every 5 minutes, the maximum
DE/leistungen/radolan/radolan.html). Over regions with                temporal difference to the closest (irregularly observed)
overlapping observations from different radars the deci-              DPRns observation is 2.5 minutes.
sive criteria for the choice of the bins in the overlapped                In order to further reduce sampling-based discrep-
area is the quality of the measurement, in cases where                ancies (will be discussed in detail in Section 2.4) be-
the quality is comparable then the maximum reflectiv-                 tween RYups and DPRns (Figure 2, green dashed line
ity is used. Since 31.08.2016, a weighted average in-                 versus black dots), we construct an adjusted dataset
stead of the maximum is used, which depends on the                    named DPRans (DPR adjusted near surface product,
distance to the involved radars (Deutscher Wetter-                    Figure 2, red box) from the DPR vertical profiles, which
dienst, 2020). The mean height and mean beam width                    is adapted to the RYups mean beam height and width
(Figure 1, right) of an observation entering the radar                (cone starting at the ground-based radar in Figure 2).
composite can be estimated from the elevation angle                   For each DPR footprint, DPRans rain rates are aver-
of the respective observing radar. Heights may vary                   aged (Biswas and Chandrasekar, 2018; D’Adderio
slightly when the respective measurement is contami-                  et al., 2018) over that DPR profile sector, which em-
nated by clutter (personal conversations with DWD and                 braces the RYups radar volume (red frame inside DPR
MeteoSolution, 2019).                                                 field of view in Figure 2). Heights and beam propaga-
                                                                      tion for the ground-based and space-borne radar are cal-
2.3 Generation of matching observations                               culated following Iguchi et al. (2017). Figure 2 illus-
                                                                      trates a case, when a single ground-based radar bin en-
For the statistical comparison of both observation types,             compasses a set of DPR vertical range bins with a va-
we average the horizontally higher-resolved ground-                   riety of hydrometeor phases. Every DPR bin has a pre-
based radar observations over the DPR footprints us-                  cipitation rate estimated according to its phase. RYups
ing weights defined by the DPR antenna gain following                 and DPRans pixels each comprises one rain rate value
Watters et al. (2018). The module Zonal Statistics con-               and a percentage of different precipitation phases inside
tained in the open source library wradlib (Heistermann                that pixel. Therefore, a simple subdivision into different
and Pfaff, 2013), which is used in this study, finds all              precipitation phases similar to DPRns’s standard phase
RY pixels corresponding to one DPR footprint and cal-                 product which only represents the hydrometeor phase of
culates the RY value upscaled to the same resolution                  the first DPR bin over the CFB, cannot be done.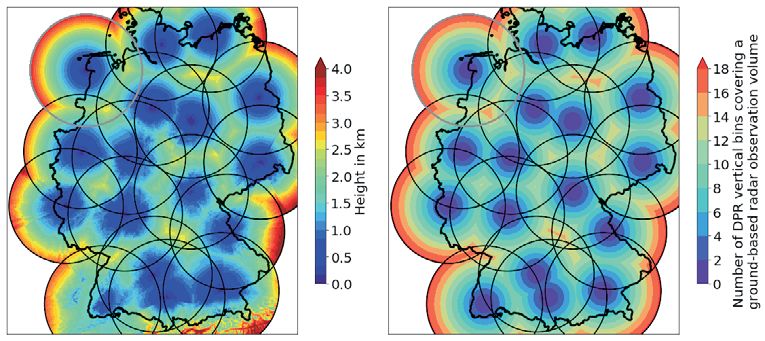
Meteorol. Z. (Contrib. Atm. Sci.) V. Pejcic et al.: Comparison between ground-based and space-borne rainfall product over Germany   455
29, 2020

    Figure 1 (right panel) indicates that a single ground-          of GPMs DPRns instantaneous rain rates (top left), the
based radar bin (and thus the corresponding RYups esti-             RY product (top right) upscaled to the DPR grid resolu-
mate) may encompass up to 18 DPR vertical bins with                 tion (RYups) as described in the previous section, and a
possibly different hydrometeor phases. To consider this             track-height cut (indicated with a thick black line in the
potential variability inherent to an RYups/DPRans esti-             upper left sub-figure) through the DPR rain rate product
mate, we define an adjusted hydrometeor phase classi-               including the RYups product with its mean beam height
fication product aHPC as the volume fraction of liquid              and width. This example suggests a systematic rain rate
precipitation contained within a RYups pixel as                     disagreement between both data sets with RYups higher
                                                                    by 0.86 mm/h (compare color-coded circles with back-
                  aHPC = L/(L + M + S )                     (2.1)   ground color). The following conditions may lead to
with L/S/M the number of DPR vertical bins, which con-              such differences (compare bottom part of Figure 3 and
tain only liquid/solid/mixed precipitation, respectively.           other Figs. noted):
Accordingly, with aHPC = 1 the RYups estimate con-                    • Spatial mismatch (position and extent) between the
tains only liquid precipitation (according to the DPR                   observed volumes contributing to the products; com-
phase profile), and with aHPC = 0 no liquid precipitation               pare the vertical black lines assigned to every RYups
is present in the DPR profile and thus also the RYups es-               circle with the height of the clutter-free bottom (con-
timate.                                                                 tinuous black line) for which the DPR product is rep-
    We compare observations between 19 March 2014                       resentative.
and 03 January 2018 comprising a total of 2661 GPM                    • Precipitation estimates pertain to different phases
overflights over the DWD radar composite area. The                      (e.g. at 10.7° longitude where RYups refers to a level
DWD radars have a minimum sensitivity of −32.5 dBZ                      above and DPRns to a level below the melting layer).
(Bartels et al., 2004), while the sensitivity of the DPR              • Impact of terrain; while the height of the DPRns
Ka-band radar is +12 dBZ (which corresponds to a min-                   estimate depends on local elevation, the height of the
imum detectable rain rate of about 0.2 mm/h) and of                     RYups estimate is given by the elevation-following
the Ku-band +18 dBZ (which corresponds to a mini-                       scanning strategy.
mum detectable rain rate of about 0.5 mm/h; Iguchi                    • Errors in the determination of the CFB (see also
et al., 2017). The rain/no-rain threshold chosen in ear-                Watters et al., 2018); e.g. at 9.5° longitude where
lier comparison studies differ considerably. E.g. Speirs                the CFB misplacement above the melting layer leads
et al. (2017) took the higher one of the minimum de-                    to an extrapolation of rain rates estimated in the ice
tection thresholds from both data sources as the com-                   region down to the surface. Thus, when the bright
parison threshold (Minimum Value). Petracca et al.                      band is below the CFB while RYups measuring be-
(2018) used the pre-launch determined DPR thresh-                       low it, the latter will usually be larger.
old of 0.5 mm/h (Iguchi et al., 2017) for their analy-                • Ground-based radar observing volumes contributing
sis (Prelaunch Nominal). Watters et al. (2018) deter-                   to RYups increase with distance from the radar and
mined the comparison threshold as the one, which max-                   might cover up to 18 (vertical) DPR layers (Fig-
imizes the Heidke Skill Score (Maximum HSS) between                     ure 1, right) containing a set of different hydrometeor
both data sets (for details see Watters et al., 2018 and                phases. This may lead to non-uniform phase beam-
Kirschbaum et al., 2012). In this study we apply all                    filling effects in the RYups product.
three methods, examine the differences, and select one                • RYups bins may be observed completely above the
threshold for the final comparison between DPRans and                   precipitating part of a cloud while its corresponding
RYups (Section 3.1).                                                    DPRns precipitation value is estimated in the liquid
    We exclude from our DPRans comparison data with                     part close to the ground (e.g. between 10.5° and 11°
DPR observations classified as Heavy Iced Precipita-                    longitude).
tion (HIP). This GPM classification indicates high re-                • DPRns observations are mostly below 1 km, but
flectivities (>35 GHz at Ku- and >30 GHz at Ka-band)                    strongly depend on the local observation zenith an-
caused by ice particles at heights around the −10°C                     gle (Figure 4, top-right) leading to differences of up
isotherm above storms (Iguchi et al., 2017). These re-                  to 3 km between the heights of the inner and outer
flectivities are often the results of non-Rayleigh scat-                parts of the swaths. This zenith dependency reduces
tering and are potentially affected by multi-scattering                 the detection quality of low bright bands in the outer
(Battaglia et al., 2007; Battaglia et al., 2010; Iguchi                 part of the swath, a problem also noted for TRMM
et al., 2018). These processes might adversely affect pre-              (AWAKA et al., 2009). The ground-based measure-
cipitation estimates (Battaglia et al., 2015).                          ments on the other hand vary between close to the
                                                                        ground to 5 km due to the terrain-following scanning
2.4 Sources for discrepancies between DPRns                             (Figure 4).
    and RYups
In this section, we highlight the potential problems,
                                                                    2.5 Comparison statistics
when comparing DPRns with RYups in order to motivate                We compare precipitation occurrences (yes/no) between
the new DPRans product. Figure 3 displays an example                DPRans and RYups, followed by a quantitative com-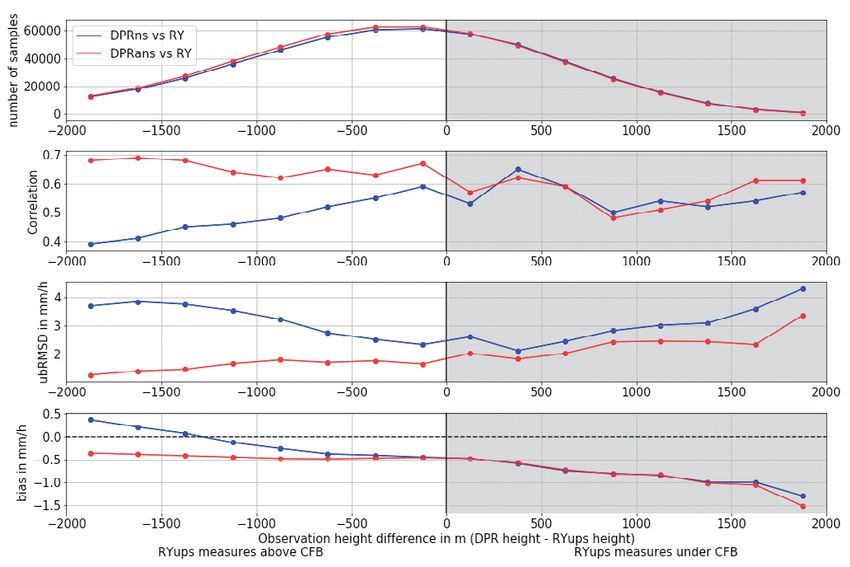
456 V. Pejcic et al.: Comparison between ground-based and space-borne rainfall product over Germany Meteorol. Z. (Contrib. Atm. Sci.)
                                                                                                                                  29, 2020

Figure 3: (Top left) DPRns from a GPM overpass on 2014–08-31 crossing Germany at 12:54 UTC and (top right) RYups observation
upscaled to the DPRns grid. The thick black line indicates the position of the height-longitude cut through the GPM 3D precipitation field
displayed at the bottom. The colors indicate the estimated precipitation rate in mm/h. (Bottom) The clutter-free height is shown as a black
line. Other DPR parameters are noted in the legend. The circles are RYups observation heights colored according to the precipitation rate.
The vertical bars represent the extent of the RYups beam widths for that particular profile.

parison for cases when both observation systems detect                 with CSI the Critical Success Index, FAR the false alarm
precipitation. The detection agreement is quantified via               ratio, and IFAR the inverse false alarm ratio. CSI quanti-
contingency tables with H (Hit) the number of cases                    fies the degree of agreement from 0 (no agreement) to 1
when both RYups and DPRns/ans indicate precipitation,                  (total agreement) following Chokngamwong and Chiu
FT (False DPR, True RY) the number of cases when                       (2008). FAR and IFAR quantify the detection discrep-
RYups detects precipitation but DPRns/ans not, and TF                  ancy, e.g. when FAR or IFAR is 0 there are no detec-
(True DPR, False RY) when DPRans detects precipita-                    tion discrepancies. When FAR approaches 1, DPRans
tion while RYups does not. From the contingency table                  detects precipitation much more often than RYups, and
we calculate                                                           vice versa when IFAR approaches 1.
                                                                           The correspondence between the detected precipi-
                                H                                      tation intensities of both observing systems is quan-
                      CSI =                                   (2.2)
                           FT + H + TF                                 tified via the mean difference (bias), the root mean
                             TF                                        square of the difference (RMSD), the unbiased RMSD
                     FAR =                                    (2.3)    (ubRMSD), and Pearson’s correlation coefficient (r) via:
                           H + TF
                                                                                                1
                                                                                                    n
                             FT                                                          bias =       (xi − yi ),           (2.5)
                    IFAR =                                    (2.4)                             n i=1
                           H + FT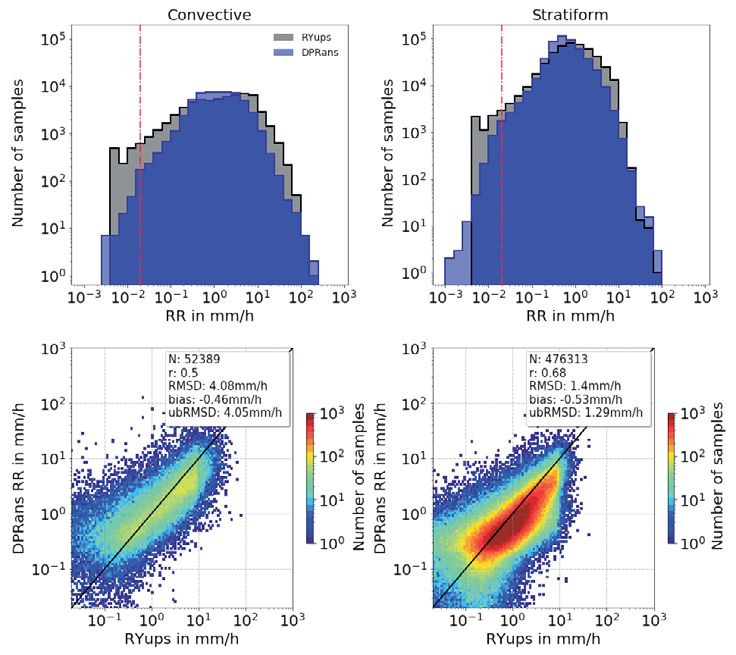
Meteorol. Z. (Contrib. Atm. Sci.) V. Pejcic et al.: Comparison between ground-based and space-borne rainfall product over Germany   457
29, 2020

Figure 4: (Bottom left) 2D-histogram of three years of RYups observation heights versus the corresponding standard DPR near surface
product (DPRns) observation heights with the marginal DPR (bottom right) and RYups observation height histograms (top left). The right
top sub-figure shows for the same period the distribution of the heights of the DPRns product versus the local zenith angle.


                            1
                                   n                                (2017) we find the lowest non-zero rain value for DPRns
               RMSD =              (xi − yi )2 ,            (2.6)   around 0.02 mm/h because of the high sensitivity of the
                            n i=1                                   Ka-band in the inner swath and the more accurate dual-
                                                                   frequency retrieval algorithm. DPRans even leads to a
              ubRMSD = RMSD2 − bias2 ,                      (2.7)   threshold below 0.001 mm/h due to the column aver-
                    n
                      i=1 (xi − x̄)(yi − ȳ)                        aging. The pre-launch threshold omits a considerable
             r=                                            (2.8)
                  n                                               amount of data in the analysis, a choice only recom-
                   i=1 (xi − x̄)
                                2 n (y − ȳ)2
                                    i=1 i                           mended when data below the threshold are analyzed
                                                                    as in Petracca et al. (2018). The lowest RMSD and
with xi the DPRns/ans estimates, x̄ their average, yi the           ubRMSD and the highest correlation are found when
RYups rain rates, and ȳ their average. A negative bias             the Minimum Value threshold method is used (Figure 5,
indicates that RYups estimates higher rain rates than               middle row). With the pre-launch threshold, RMSD and
DPRns/ans, and vice versa.                                          ubRMSD are highest and correlations are lowest (Fig-
                                                                    ure 5, bottom row). In general, compared to DPRns the
3 Results                                                           DPRans estimates are closer to the RYups estimates re-
                                                                    gardless of the threshold used, however at the expense
3.1 DPRns against DPRans                                            of a slightly larger bias. In the following, we use the
                                                                    threshold resulting from the Minimum Value method,
Figure 5 compares RYups and DPRns/DPRans after                      i.a. 0.02 mm/h.
applying the three rain/no-rain thresholds in Table 1                   In order to examine the effects of the mismatch of
(indicated in bold). While Watters et al. (2018) got                measurement height and beam width when comparing
a rain/no-rain threshold of 0.38 mm/h for the maxi-                 DPRns with RYups, we calculated and compared the
mum Heidke Skill Score (HSS) of 0.74, we find a                     correlation r, ubRMSD and bias (DPRns/ans–RYups)
threshold of 0.28/0.25 mm/h for a maximum HSS of                    as a function of the height difference between RYups
0.76/0.75 for DPRans/DPRns. Similar to Speirs et al.                and DPRns (Figure 6). As expected by matching the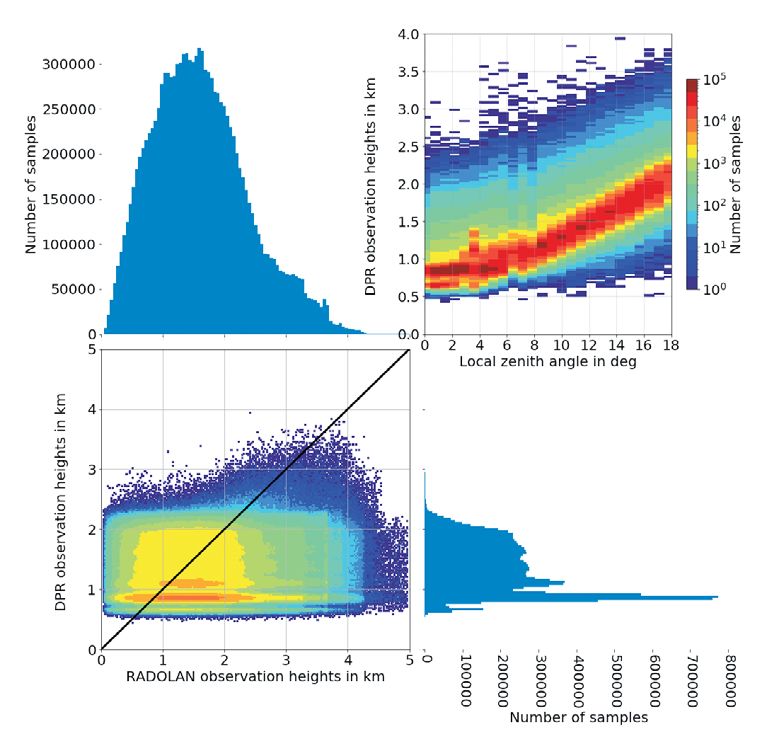
458 V. Pejcic et al.: Comparison between ground-based and space-borne rainfall product over Germany Meteorol. Z. (Contrib. Atm. Sci.)
                                                                                                                                  29, 2020

Figure 5: Scatterplots of RYups versus standard (DPRns, left) and adjusted near surface DPR rain rates (DPRans, right) after applying
thresholds derived via HSS (top row), Minimum Value (middle row), and Prelaunch nominal (bottom row). Colors indicate the number
of observations and the black line the 1:1 relationship. Total number of observations N, correlation coefficient r, root mean square of the
difference RMSD, unbiased root mean square of the difference ubRMSD, and bias are given in the legend box. The rain/no-rain threshold
value is indicated in the title.

Table 1: Rain/ no-rain thresholds calculated for the comparisons of RYups with standard (DPRns) and adjusted DPR rain rates (DPRans)
determined with three methods used in other studies (see Section 2.4). Bold values indicate the thresholds later used for the comparison in
Figure 5.

                      Method                Reference and their result [mm/h]     DPRns [mm/h]      DPRans [mm/h]
                      Maximum HSS           0.38 (Watters et al., 2018)                0.25                    0.28
                      Minimum Value         0.02 (Speirs et al., 2017)                 0.02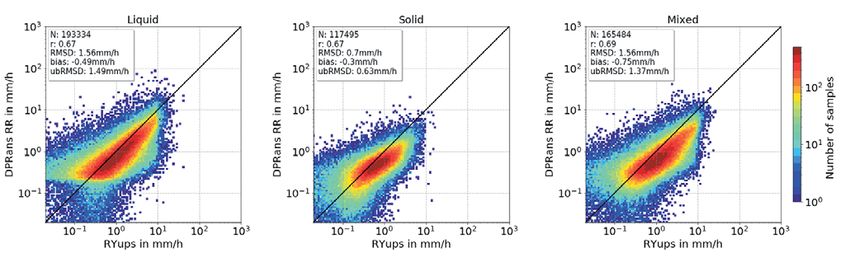
Meteorol. Z. (Contrib. Atm. Sci.) V. Pejcic et al.: Comparison between ground-based and space-borne rainfall product over Germany   459
29, 2020

Figure 6: Number of samples (top), correlation (second), unbiased RMSD (third) and bias (bottom) of RYups versus DPRns (blue) and
DPRans (red) as a function of the difference between the DPRns observation height and the RYups observation height. The shaded area
indicates the region where the measurements from the ground-based radars are below the CFB of the space borne radar.

observation heights in DPRans the statistics significantly          different phases (Figure 7). E.g. 27 % of the mixed phase
improve with increasing height differences for RYups                pixels in DPRans are liquid and 8 % solid in DPRns.
pixels above the CFB (left white area), but minor or
close to no improvements for RYups pixels observed                  3.2 Comparison between DPRans and RYups
below the CFB (right grey area). For the latter, DPR                    precipitation rates
provides measured rain rates from the top of the cloud to
CFB; below the CFB the data results from extrapolating              Due to the large differences in observations heights and
the rain rates from the CFB to the ground level which               accordingly also hydrometeor phases between DPRns
only leads to minor changes of rain rates below the CFB             and RYups, we confine the precipitation rate compar-
and in turn only minimal improvements through the                   isons to DPRans and RYups. We start with a separation
adjustments in DPRans below or near the CFB. Overall,               between stratiform and convective cases. The impact of
the ubRMSD, r and bias for DPRans (red lines on the                 orography, hydrometeor phases and season is analyzed
white left side of Figure 6) confirm, that we significantly         only for stratiform events, which allow for a robust iden-
reduced the effects of the observation height and beam              tification of the bright band and thus a sufficient distinc-
width mismatch with DPRans.                                         tion between hydrometeor phases.
    When RYups is observed at high altitudes (i.e. at far               According to the GPM DPR precipitation regime
range from the radar) while DPRns is observed close                 classification into convective, stratiform and other, strat-
to the surface, DPRns is on average larger than RYups               iform events are almost ten times more frequent than
(blue line in bottom left Figure 6) in spite of the over-           convective events (Figure 8). In stratiform conditions,
all negative bias of DPRns (Figure 5). This is expected,            DPRans (when compared to RYups) overestimates the
because RYups might have been observed in the upper                 occurrence of precipitation below 1 mm/h, underesti-
part of a cloud where cloud droplets or ice particles give          mates between 1 mm/h and 10 mm/h, and again overes-
rise to lower reflectivities as the rain below observed by          timates the occurrence of precipitation above 10 mm/h.
DPRns (see also Watters et al., 2018). When we com-                 Convective cases show similar differences, however at
pare pixel-by-pixel the hydrometeor phase classification            different spans of rain rates. In general, DPRans and
between DPRns and DPRans, 41 % of the pixels have                   RYups correlate stronger and have lower RMSD and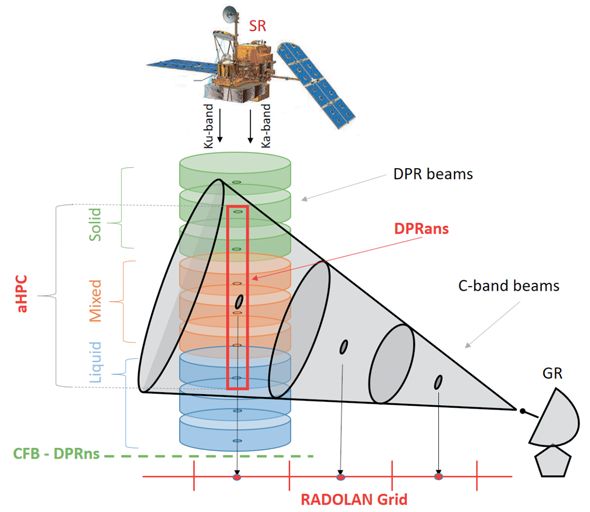
460 V. Pejcic et al.: Comparison between ground-based and space-borne rainfall product over Germany Meteorol. Z. (Contrib. Atm. Sci.)
                                                                                                                                 29, 2020

Figure 7: Bar plot showing the consistency of the hydrometeor phase classification between DPRns and DPRans. The blue bars show the
number of measurements where both phase classification matches, while the grey bars show the number of mismatches.

Figure 8: Distribution of precipitation rates for the RYups product and the DPRans product for convective (top left) and stratiform
cases (top right). The vertical dashed-dotted lines indicate the threshold rain intensity of 0.02 mm/h. Scatterplot of RYups versus DPRans
precipitation rates for the same cases (bottom). The black line is the 1:1 line.

ubRMSD for stratiform than for convective precipita-                  pared to RYups) most probably because the bright band
tion.                                                                 produces a more intense reflectivity signal at lower fre-
    In stratiform precipitation DPRans overall underes-               quency bands (C-band) as compared to DPR’s Ku and
timates precipitation compared to RYups for all pre-                  Ka-band. (Kollias and Albrecht, 2005). Thus RYups
cipitation phases (Figure 9). The lower bias for solid                overestimates precipitation rates because the applied
precipitation is most probably caused by the much                     z-R-relations are valid only for liquid precipitation. See
smaller precipitation range which only extends up to                  also the systematic deviations for solid precipitation.
10 mm/h. For the same reason RMSD and ubRMSD                             We made the comparisons separately for seasons,
are higher in pure liquid compared to solid and practi-               but present for simplicity only the results for summer
cally equal to mixed-phase precipitation. For the latter,             and winter as spatial distributions of the correspondence
DPRans precipitation generally underestimates (com-                   measures on a 20 km x 20 km grid (Figure 10). A reliable
Meteorol. Z. (Contrib. Atm. Sci.) V. Pejcic et al.: Comparison between ground-based and space-borne rainfall product over Germany 461 29, 2020 Figure 9: Scatterplot between RYups and DPRans separated by precipitation phase (aHPC) into pure liquid phase (left), pure solid phase (center), and mixed phase (right). The black line is the 1:1 relation and the color indicates the number of samples. Figure 10: Number of observations, correlation and RMSD of DPRans and RYups for summer (first column) and for winter (second column). Seasonal CSI, FAR and IFAR of DPRans and RY for summer (third column) and winter (fourth columns). All observations are binned on a 20 km × 20 km grid. Rain/no-rain threshold = 0.02 mm/h. detection of the bright band height (again we restrict the be more easily detected and allows for a more accurate analysis to stratiform precipitation) is key for a high- phase classification and thus better precipitation rate quality precipitation rate retrieval, since it is used to determination. assign precipitation types to the DPR. During winter the Accordingly, the correlations between both datasets height of the bright band is typically low and in some are high and quite homogeneous in summer. In win- cases below or near to the DPR’s CFB height, which ter, higher correlations occur mostly in areas of over- leads to a poor phase classification. In summer, the lapping ground-based radar scans where the observation bright band is usually much higher than the CFB and can altitude is quite high and mostly above the CFB. The
462 V. Pejcic et al.: Comparison between ground-based and space-borne rainfall product over Germany Meteorol. Z. (Contrib. Atm. Sci.)
                                                                                                                                         29, 2020

Figure 11: Elevation above sea level in km of the orography in the RADOLAN region (top left). The slope in degree calculated from the
DEM (GTOPO30, 1997) model elevations (top right). Histograms of the elevation standard deviation in m and slope standard deviation
in degree per DPR footprint with defined thresholds for the classification of terrain type (bottom right). The separation with slope
(orange)/elevation (blue) of flat/hilly is indicated with the dashed lines and for hilly/complex is indicated with the dotted lines. Classification
of flat, hilly and complex terrain (bottom left).

overall correlation/RMSD in summer is 0.7/1.59 mm/h                            Not only ground radars are influenced by terrain
and in winter 0.55/1.29 mm/h (not shown). In winter                        complexity via beam blockage or overshooting; also
the RMSD shows particularly high values together with                      satellite-based precipitation estimates suffer from oro-
low correlation in the vicinity of some radar locations                    graphic effects. Complex surface geometry leads to a
in flat terrain, i.e. in areas in which ground-radars usu-                 high spatial in-homogeneity of the surface cross sec-
ally measure below the CFB. In terms of skill scores, the                  tions that has an impact on DPRs attenuation correc-
CSI shows similar detection performance in summer and                      tion (D’Adderio et al., 2018; Meneghini et al., 2015)
winter; also the false alarm ratio (FAR) and the inverse                   and an increasing in the height of the CFB (Iguchi
false alarm (IFAR) are similar in both seasons. The over-                  et al., 2017; Kubota et al., 2016; Kulie and Bennartz,
all CSI for winter and summer is 0.94 and FAR/IFAR                         2009). Therefore, the effects of land types and surface
are for summer 0.03/0.02 and 0.04/0.02 (not shown). A                      complexities are examined. Over Germany only two
particularly high FAR (DPRans detects more often pre-                      lakes are identified in the DPR data as inland water,
cipitation occurrence than RYups) is found in the north-                   which we will not consider here. All other lakes, rivers,
western area mainly because is monitored by the Emden                      and coastal areas are classified as coastal. In order to
aged single-pol radar, hinting at large detection inaccu-                  quantify RYups and DPRans data comparisons accord-
racies in that area probably due to uncorrected clutter                    ing to topography we use the standard deviation of ter-
produced by offshore wind farms and marine traffic be-                     rain height (Figure 11, top left) and the standard devia-
sides a less than optimal radar.                                           tion of terrain slope (Figure 11, top right) within each
Meteorol. Z. (Contrib. Atm. Sci.) V. Pejcic et al.: Comparison between ground-based and space-borne rainfall product over Germany 463
29, 2020
Table 2: Definition for terrain classification into flat, hilly, complex and other with standard deviation of slope in degree per DPR footprint,
standard deviation of elevation in meter per DPR footprint and percentage of data.
Class 1: Flat Class 2: Hilly Class 3: Complex Undefined
STD(Slope) 3° –
STD(Elevation) 120 m –
Percentage of data 41 % 47 % 3% 9%
Table 3: Detection capability CSI, IFAR and FAR and estimation 4 Summary and discussion
agreement correlation, bias, and RMSD for different land surface
types (left) and different terrain classes (right). Note that RMSD and We compared composite precipitation estimates (RY)
bias in mm/h. computed from the DWDs C-band radar network with
retrievals from the DPR instrument on the GPM core
Land surface type Terrain classes
Coast Land Ocean Flat Hilly Complex
satellite and in particular. Direct comparisons of the
standard DPR near surface product (DPRns) with the
r 0.70 0.69 0.63 0.66 0.68 0.65 RY product upscaled to the DPR footprint (RYups) suf-
bias −0.46 −0.56 −0.31 −0.50 −0.53 −0.35 fer from spatial mismatches of the sampling volumes.
RMSD 1.34 1.41 1.35 1.39 1.40 1.27
Thus, we used the DPR columnar precipitation estimates
CSI 0.95 0.96 0.89 0.94 0.95 0.91
IFAR 0.02 0.02 0.02 0.02 0.02 0.02
to create a new near-surface DPR product (DPRans),
FAR 0.04 0.03 0.09 0.04 0.03 0.04 which optimizes the overlap in height and beam width
with the ground-based radar estimate. This adaptation
requires also an adjustment of the GPM hydrometeor
phase attribution (aHPC).
For a first comparison between RYups and DPRns
DPR footprint. Their distributions exhibit three main and the new DPRans product, we used three rain/no rain
regimes (Figure 11, bottom right), which we classify as threshold determination methods. The maximum HSS
class 1 (flat), class 2 (hilly) and class 3 (complex) re- (Watters et al., 2018) yielded a threshold of 0.38 mm/h,
gions (Figure 11, bottom left, and Table 2). Mixed sur- the Minimum Value (Speirs et al., 2017) 0.02 mm/h,
face types are not considered in the comparisons. and the prelaunch Nominal (Petracca et al., 2018) as-
signed to 0.5 mm/h. We use for our study the threshold
Note that we only compare the detection of the two of 0.02 mm/h. The adjustment of the DPR measurements
observing systems and if they detect the same without to the height and width of the ground-based radar com-
using one of these as a reference. The detection perfor- posite (DPRans) enhanced the correlation with RYups
mance (CSI) is mostly high along the coast and over land from 0.49 to 0.61, reduced the RMSD from 2.94 mm/h
but low over the ocean. The highest FAR is over ocean to 1.83 mm/h, but slightly increased the bias relative to
followed by coast and land. However, FAR is always RYups from −0.37 to −0.52 mm/h.
higher than the IFAR (Table 3, left), thus DPRans detects The lower rain rates from RYups compared to DPRns
more often precipitation than RYups. Especially over the in regions where the ground-based radar observes at
ocean ground-based radar observations suffer from clut- higher altitudes (outer radar region) are caused by the
ter by ships and offshore wind farms, which cannot be often solid precipitation seen by the latter (low reflectiv-
efficiently removed since polarimetric methods are not ity) while DPSns is observed near the surface mostly in
yet used by the RADOLAN composite processor. The the liquid or mixed phase (Figure 6, blue curve; Wat-
lowest absolute bias appears over the oceanic areas lo- ters et al. (2018), Figure 8). DPRans solves this mis-
cated at the northern borders of the composites where matching and does not show this bias. The hydrometeor
observations are taken at far ranges and thus more often phase classification product adjusted to DPRans (aHPC)
in the ice phase. takes non-uniform hydrometeor-phase beam filling into
The terrain following scans of the ground-based account and thus avoids incoherent phase attributions
radars have a higher elevation angle over class 3 (com- between both products.
plex) areas whereby mainly measurements from solid The correlation is higher and the RMSD lower
precipitation are compared. This causes, as shown in between RYups and DPRans in stratiform compared
figure 9, a lower absolute bias and low RMSD. In gen- to convective precipitation. The separation into solid,
eral, correlations are lower over class 3 (complex) where mixed and liquid rain estimates (only analyzed for strati-
the CFB increases because of the terrain complexity, but form precipitation) shows the best agreement between
also in class 1 (flat) areas where the ground radar mea- both data sets for liquid precipitation, which recom-
sures below CFB. Table 3 shows that CSI suggests there mends to a phase separated z-R relationship within the
are no major differences in detection capabilities. Over RADOLAN procedure. The highest correlation and low-
class 3 (complex) the CSI shows the lowest value. These est RMSD between RYups and DPRans are found in
can be a consequence of the fact that CFB is higher over summer. Larger deviations are found in winter near the
mountain regions. ground-based radar locations when the melting layer is464 V. Pejcic et al.: Comparison between ground-based and space-borne rainfall product over Germany Meteorol. Z. (Contrib. Atm. Sci.)
29, 2020
close to the ground and below the CFB of the DPR. Acknowledgments
There is no seasonal dependence in the mutual precipi-
tation detection agreement between RYups and DPRans The research of V. Pejcic was partly carried out in
unlike other studies using the standard DPRns, reported the framework of the priority programme SPP-2115
by Speirs et al. (2017) and Petracca et al. (2018). “Polarimetric Radar Observations meet Atmospheric
Our study concludes that those seasonal dependencies Modelling (PROM)” (https://www2.meteo.uni-bonn.de/
could have been caused by spatial mismatching. In- spp2115) in the project “An efficient volume scan po-
creased FAR values in the northwest of the RADOLAN larimetric radar forward OPERAtor to improve the rep-
composite and higher IFAR values near the radar sites resentaTION of HYDROMETEORS in the COSMO
probably arise from a non-polarimetric clutter filter in model (Operation Hydrometeors)" funded by the Ger-
RADOLAN procedure. man Research Foundation (DFG, grant TR 1023/16-1).
In terms of terrain effects the highest detection agree- P. Saavedra Garfias thanks to the Research Coun-
ment is over hilly and flat terrain where the effects of the cil of Norway (RCN; Project Code 227777). The
ground clutter do not have such a large impact on both authors would like to thank Deutscher Wetterdienst
space-borne and ground-based measurements. The cor- and MeteoSolution for providing information about
relations, absolute bias and RMSD between both data the RADOLAN composite and we also thank DWD
sets are lowest over class 3 (complex) and highest over and NASA/JAXA for providing the GPM DPR and
class 1 and class 2 (flat and hilly). Speirs et al. (2017) RADOLAN RY data.
reported lowest absolute bias and RMSD in flat terrain.
Apart from the fact that the terrain classification meth- References
ods are different, it can be assumed that our definition of
Auerswald, K., F.K. Fischer, T. Winterrath, R. Brand-
class 1 (flat) and class 3 (complex) mostly corresponds
huber, 2019: Rain erosivity map for Germany derived from
to the classification of flat and complex terrain by Speirs contiguous radar rain data. – Hydrol. Earth Sys. Sci. 23,
et al. (2017) which is only determined by standard devi- 1819–1832, DOI: 10.5194/hess-23-1819-2019.
ation of elevation. We suggest that the main source of Awaka, J., T. Iguchi, H. Kumagai, K. Okamoto, 1997: Rain
the difference is due to the adjusted DPRans that we are type classification algorithm for TRMM precipitation radar. –
using. In: IGARSS’97. 1997 IEEE International Geoscience and Re-
We propose, given the composite configuration of mote Sensing Symposium Proceedings. Remote Sensing –
A Scientific Vision for Sustainable Development, volume 4,
the DWD’s radars, that our new product DPRans pro- 1633–1635 vol. 4. DOI: 10.1109/IGARSS.1997.608993.
vides the best possible agreement between space-borne Awaka, J., T. Iguchi, K. Okamoto, 2009: TRMM PR Standard
and ground-based precipitation estimates. We suggest Algorithm 2A23 and its Performance on Bright Band Detec-
that a direct comparison using reflectivities instead of tion. – J. Meteor. Soc. of Japan. Ser. II 87A, 31–52, DOI:
rain retrievals is the next step, thus unknown effects in- 10.2151/jmsj.87A.31.
troduced by assuming certain z-R-relationship can be Awaka, J., M. Le, V. Chandrasekar, N. Yoshida, T. Higa-
discarded. The comparison can be extended to the at- shiuwatoko, T. Kubota, T. Iguchi, 2016: Rain Type Clas-
sification Algorithm Module for GPM Dual-Frequency Pre-
tenuation corrections and the validity of the different cipitation Radar. – J. Atmos. Ocean. Technol. 33, 1887–1898,
z-R-relationships used in RADOLAN and the DPR pro- DOI: 10.1175/JTECH-D-16-0016.1.
cessing. Furthermore, a temporally extended compari- Barros, A., W. Petersen, M. Schwaller, R. Cifelli, K. Ma-
son would allow an evaluation of derived precipitation honey, C. Peters-Liddard, M. Shepherd, S. Nesbitt,
estimates with polarimetric information (POLARA, ap- G. Wolff, D. Heymsfield, D. Starr, 2014: NASA GPM-
plied for RY from October 2017; Deutscher Wet- Ground Validation: Integrated Precipitation and Hydrology
terdienst, 2020). Comparisons with homogenized data Experiment 2014 Science Plan. – EPL/Duke University,
64 pp., DOI: 10.7924/G8CC0XMR.
like RADKLIM (Winterrath et al., 2017) could also Bartels, H., E. Weigl, T. Reich, P. Lang, A. Wagner,
be used to examine the uncertainties introduced by new O. Kohler, N. Gerlach, 2004: Projekt RADOLAN
reprocessing methods hence its rain rate estimates as Routineverfahren zur Online-Aneichung der Radarnieder-
shown in this contribution. All studies so far suggest, schlagsdaten mit Hilfe von automatischen Bodennieder-
that DPR yields significantly lower rain rates compared schlagsstationen (Ombrometer). – https://www.dwd.de/DE/
to ground-based radars (Speirs et al., 2017; Petracca leistungen/radolan/radolan_info/abschlussbericht_pdf.pdf?__
et al., 2018; Watters et al., 2018) while studies com- blob=publicationFile&v=2.
Battaglia, A., M.O. Ajewole, C. Simmer, 2007: Evaluation
paring reflectivities show lower reflectivities of ground- of radar multiple scattering effects in Cloudsat configura-
based radars (Crisologo et al., 2018; Keem et al., 2019; tion. – Atmos. Chem. Phys. 7, 1719–1730, DOI: 10.5194/
Biswasand Chandrasekar, 2018). The approach pre- acp-7-1719-2007.
sented by this study paves the way to solve this contra- Battaglia, A., S. Tanelli, S. Kobayashi, D. Zrnic,
diction, since circumventing the spatial mismatch leads R.J. Hogan, C. Simmer, 2010: Multiple-scattering in radar
to a dataset suitable for comparisons either for rain rates systems: A review. – J. Quantitative Spectroscopy Radiative
or reflectivity. This method has the potential to be ap- Transfer 111, 917–947, DOI: 10.1016/j.jqsrt.2009.11.024.
Battaglia, A., S. Tanelli, K. Mroz, F. Tridon, 2015: Mul-
plied to different composites outside the RADOLAN re- tiple scattering in observations of the GPM dual-frequency
gion. In this case, an adaptation to the specific geometry precipitation radar: Evidence and impact on retrievals. –
of the selected radar network, as described in this con- J. Geophs. Res. Atmos. 120, 4090–4101, DOI: 10.1002/
tribution, is required. 2014JD022866.Meteorol. Z. (Contrib. Atm. Sci.) V. Pejcic et al.: Comparison between ground-based and space-borne rainfall product over Germany 465 29, 2020 Biswas, S.K., V. Chandrasekar, 2018: Cross-Validation of sion. – Bull. Amer. Meteor. Soc. 95, 701–722, DOI: 10.1175/ Observations between the GPM Dual-Frequency Precipitation BAMS-D-13-00164.1. Radar and Ground Based Dual-Polarization Radars – Remote Houze, R., L. McMurdie, W. Petersen, M. Schallwer, Sens. 10, 1733, DOI: 10.3390/rs10111773. 2015: OLYMPEX ground validation experiment field opera- Cannon, F., F.M. Ralph, A.M. Wilson, D.P. Lettenmaier, tions plan (version 3). – Tech. Rep., University of Washington. 2017: GPM Satellite Radar Measurements of Precipitation Huffman, G., D.T. Bolvin, D. Braithwaite, K. Hsu, and Freezing Level in Atmospheric Rivers: Comparison With R. Joyce, C. Kidd, E.J. Nelkin, P. Xie, 2015: NASA Ground-Based Radars and Reanalyses. – J. Geophs. Res. At- Global Precipitation Mea-surement Integrated Multi-satellitE mos. 122, 12,747–12,764, DOI: 10.1002/2017JD027355. Retrievals for GPM (IMERG). – Algorithm Theoretical Basis Chen, H., V. Chandrasekar, R. Bechini, 2017: An Improved Doc., version 4.5. Dual-Polarization Radar Rainfall Algorithm (DROPS2.0): Iguchi, T., R. Meneghini, 2019: GPM DPR Precipitation Pro- Application in NASA IFloodS Field Campaign. – J. Hydrom- file L2A 1.5 hours 5 km V06. – Greenbelt, MD, Goddard Earth eteorol. 18, 917–937, DOI: 10.1175/JHM-D-16-0124.1. Sciences Data and Information Services Center (GES DISC) Chokngamwong, R., L.S. Chiu, 2008: Thailand Daily Rainfall (Accessed: 2019.10.), DOI: 10.5067/GPM/DPR/GPM/2A/05. and Comparison with TRMM Products. – J. Hydrometeorol. Iguchi, T., T. Kozu, R. Meneghini, J. Awaka, K. Okamoto, 9, 256–266, DOI: 10.1175/2007JHM876.1. 2000: Rain-Profiling Algorithm for the TRMM Precipitation Conrick, R., C.F. Mass, 2019: Evaluating Simulated Mi- Radar. – J. Appl. Meteor. 39, 2038–2052, DOI: 10.1175/ crophysics during OLYMPEX Using GPM Satellite Obser- 1520-0450(2001)0402.0.CO;2. vations. – J. Atmos. Sci. 76, 1093–1105, DOI: 10.1175/ Iguchi, T., S. Seto, R. Meneghini, N. Yoshida, J. Awaka, JAS-D-18-0271.1. M. Le, V. Chandrasekar, T. Kubota, 2017: GPM/DPR Crisologo, I., R.A. Warren, K. Mühlbauer, M. Heister- Level-2 Algorithm Theoretical Basis Document. – https:// mann, 2018: Enhancing the consistency of spaceborne www.eorc.jaxa.jp/GPM/doc/algorithm/ATBD_DPR_201811_ and ground-based radar comparisons by using beam block- with_Appendix3b.pdf. age fraction as a quality filter – Atmos. Meas. Tech. 11, Iguchi, T., N. Kawamoto, R. Oki, 2018: Detection of Intense 5223–5236, DOI: 10.5194/amt-11-5223-2018. Ice Precipitation with GPM/DPR. – J. Atmos. Ocean. Technol. Deo, A., S.J. Munchak, K.J.E. Walsh, 2018: Cross Validation 35, 491–502, DOI: 10.1175/JTECH-D-17-0120.1. of Rainfall Characteristics Estimated from the TRMM PR, a Junghänel, T., C. Brendel, T. Winterrath, A. Walter, Combined PR-TMI Algorithm, and a C-POL Ground Radar 2016: Towards a radar- and observation-based hail climatol- during the Passage of Tropical Cyclone and Nontropical Cy- ogy for Germany – Meteorol. Z. 25, 435–445, DOI: 10.1127/ clone Events over Darwin, Australia. – J. Atmos. Ocean. Tech- metz/2016/0734. nol.35, 2339–2358, DOI: 10.1175/JTECH-D-18-0065.1. Keem, M., B.C. Seo, W.F. Krajewski, K.R. Morris, 2019: Deutscher Wetterdienst, 2020: Informationen über Än- Inter-comparison of reflectivity measurements between GPM derungen des operationellen RADOLAN-Betriebs. – https:// DPR and NEXRAD radars – Atmos. Res. 226, 49–65, DOI: www.dwd.de/DE/leistungen/radolan/radolan_info/radolan_ 10.1016/j.atmosres.2019.04.010. informationen.html (Accessed: 2020.05.). Kim, J.H., M.L. Ou, J.D. Park, K.R. Morris, M.R. Schwaller, D’Adderio, L.P., G. Vulpiani, F. Porcù, A. Tokay, D.B. Wolff, 2014: Global Precipitation Measurement (GPM) R. Meneghini, 2018: Comparison of GPM Core Observatory Ground Validation (GV) Prototype in the Korean Peninsula. – and Ground-Based Radar Retrieval of Mass-Weighted Mean J. Atmos. Ocean. Technol.31, 1902–1921, DOI: 10.1175/ Raindrop Diameter at Midlatitude. – J. Hydrometeorol. 19, JTECH-D-13-00193.1. 1583–1598, DOI: 10.1175/JHM-D-18-0002.1. Kirschbaum, D., R. Adler, D. Adler, C. Peters-Lidard, Fischer, F., J. Hauck, R. Brandhuber, E. Weigl, H. Maier, G. Huffman, 2012: Global Distribution of Extreme Precip- K. Auerswald, 2016: Spatio-temporal variability of erosivity itation and High-Impact Landslides in 2010 Relative to Previ- estimated from highly resolved and adjusted radar rain data ous Years. – J. Hydrometeor. 13, 1536–1551, DOI: 10.1175/ (RADOLAN) – Agricult. Forest Meteor. 223, 72–80, DOI: JHM-D-12-02.1. 10.1016/j.agrformet.2016.03.024. Kollias, P., B. Albrecht, 2005: Why the melting layer radar Furukawa, K., M. Kojima, T. Miura, Y. Hyakusoku, H. Kai, reflectivity is not bright at 94 GHz. – Geophys. Res. Lett. 32, T. Ishikiri, T. Iguchi, H. Hanado, K. Nakagawa, M. Oku- published online, DOI: 10.1029/2005GL024074. mura, 2013: Satellite system test status of The Dual- Kubota, T., T. Iguchi, M. Kojima, L. Liao, T. Masaki, Frequency Precipitation Radar on the global precipitation H. Hanado, R. Meneghini, R. Oki, 2016: A Statistical measurement core spacecraft. – In: 2013 IEEE International Method for Reducing Sidelobe Clutter for the Ku-Band Pre- Geoscience and Remote Sensing Symposium – IGARSS, cipitation Radar on board the GPM Core Observatory. – 1143–1146. DOI: 10.1109/IGARSS.2013.6721367. J. Atmos. Ocean. Technol. 33, 1413–1428, DOI: 10.1175/ Grecu, M., W.S. Olson, S.J. Munchak, S. Ringerud, L. Liao, JTECH-D-15-0202.1. Z. Haddad, B.L. Kelley, S.F. McLaughlin, 2016: The Kulie, M.S., R. Bennartz, 2009: Utilizing Spaceborne Radars GPM Combined Algorithm. – J. Atmos. Ocean. Technol. 33, to Retrieve Dry Snowfall. – J. Appl. Meteor. Climatol. 48, 2225–2245, DOI: 10.1175/JTECH-D-16-0019.1. 2564–2580, DOI: 10.1175/2009JAMC2193.1. GTOPO30, 1997: Research Data Archive at the National Cen- Kummerow, C.D., D.L. Randel, M. Kulie, N.Y. Wang, ter for Atmospheric Research, Computational and Information R. Ferraro, S. Joseph Munchak, V. Petkovic, 2015: The Systems Laboratory, USGS 30. – ARC-second Global Eleva- Evolution of the Goddard Profiling Algorithm to a Fully Para- tion Data, GTOPO30, DOI: 10.5065/A1Z4-EE71. metric Scheme. – J. Atmos. Ocean. Technol. 32, 2265–2280, Heistermann, M., J.S.T. Pfaff, 2013: Technical Note: An DOI: 10.1175/JTECH-D-15-0039.1. open source library for processing weather radar data Le, M., V. Chandrasekar, 2013: Precipitation Type Clas- (wradlib). – Hydrol. Earth Syst. Sci. 17, 863–871, DOI: sification Method for Dual-Frequency Precipitation Radar 10.5194/hess-17-863-2013. (DPR) Onboard the GPM. – IEEE Transactions on Geo- Hou, A.Y., R.K. Kakar, S. Neeck, A.A. Azarbarzin, science and Remote Sensing 51, 1784–1790, DOI: 10.1109/ C.D. Kummerow, M. Kojima, R. Oki, K. Nakamura, TGRS.2012.2205698. T. Iguchi, 2014: The Global Precipitation Measurement Mis-
You can also read