Rainfall variability in southeast and west-central Africa during the Little Ice Age: do documentary and proxy records agree?
←
→
Page content transcription
If your browser does not render page correctly, please read the page content below

Climatic Change        (2021) 168:11
https://doi.org/10.1007/s10584-021-03217-7

Rainfall variability in southeast and west-central Africa
during the Little Ice Age: do documentary and proxy
records agree?

Matthew J. Hannaford 1            & Kristen K. Beck
                                                        1

Received: 16 April 2021 / Accepted: 3 September 2021/
# The Author(s) 2021

Abstract
Understanding of long-term climatic change prior to instrumental records necessitates recon-
structions from documentary and palaeoclimate archives. In southern Africa, documentary-
derived chronologies of nineteenth century rainfall variability and palaeoclimate records have
permitted new insights into rainfall variability over past centuries. Rarely considered, however, is
the climatic information within early colonial documentary records that emerge from the late
fifteenth century onwards. This paper examines evidence for (multi-)seasonal dry and wet events
within these earlier written records (c. 1550–1830 CE) from southeast Africa (Mozambique) and
west-central Africa (Angola) in conjunction with palaeoclimate records from multiple proxies.
Specifically, it aims to understand whether these sources agree in their signals of rainfall
variability over a 280-year period covering the ‘main phase’ Little Ice Age (LIA) in southern
Africa. The two source types generally, but do not always, show agreement within the two
regions. This appears to reflect both the nature of rainfall variability and the context behind
documentary recording. Both source types indicate that southeast and west-central Africa were
distinct regions of rainfall variability over seasonal and longer timescales during the LIA, with
southeast Africa being generally drier and west-central Africa generally wetter. However, the
documentary records reveal considerable variability within these mean state climatic conditions,
with multi-year droughts a recurrent feature in both regions. An analysis of long-term rainfall
links with the El Niño–Southern Oscillation (ENSO) in southeast Africa suggests a complex and
possibly non-stationary relationship. Overall, early colonial records provide valuable information
for constraining hydroclimate variability where palaeoclimate records remain sparse.

Keywords Southern Africa . Rainfall variability . Little Ice Age . Documentary reconstruction .
Palaeoclimate

* Matthew J. Hannaford
  mhannaford@lincoln.ac.uk

1
    School of Geography and Lincoln Centre for Water and Planetary Health, University of Lincoln,
    Brayford Pool, Lincoln LN6 7TS, UK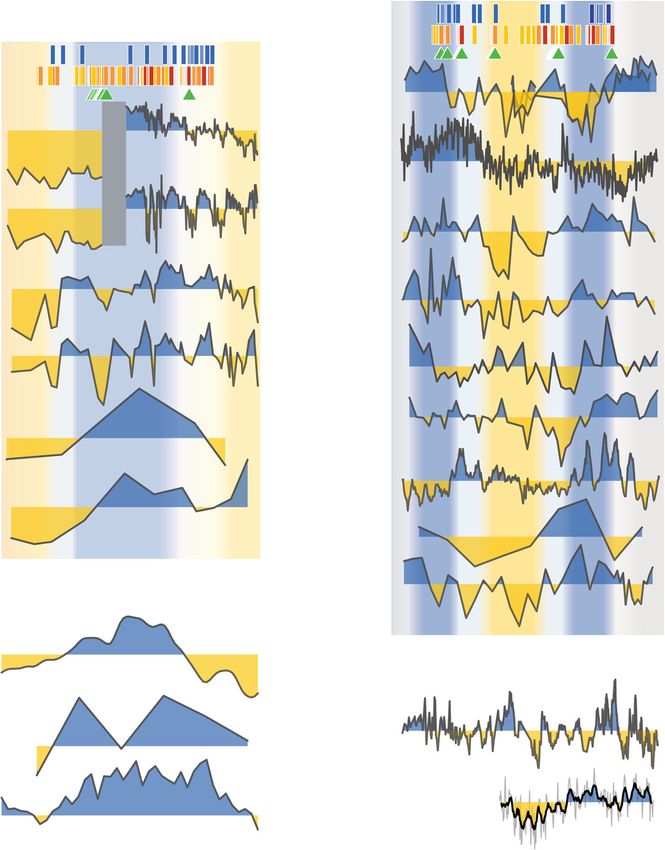
11    Page 2 of 22                                             Climatic Change      (2021) 168:11

1 Introduction

Analyses of long-term trends in rainfall variability are crucial for understanding changes in the
timing, distribution, and amount of precipitation. Recent years have seen the proliferation of
palaeoclimate proxy records in southern Africa and the African continent (Nash et al. 2016a).
Datasets covering the late Holocene have been developed from speleothems (Holmgren et al.
1999, 2003; Sletten et al. 2013; Scroxton et al. 2017; Voarintsoa et al. 2017; Braun et al.
2019), mammalian middens (Chase et al. 2009; Scott 1996), tree rings (Woodborne et al.
2016), pollen (Ekblom et al. 2012), and lake records (Stager et al. 2013), all of which can be
representative of precipitation variability. However, annually resolved palaeoclimate records
remain sparse in comparison to other regions and continents, including other southern
hemisphere landmasses such as South America and Australasia (Neukom and Gergis 2012).
With widespread instrumental recording not beginning until the late nineteenth century, this
presents challenges in understanding inter-annual to decadal climate variability over historical
timescales.
   In the absence of high numbers of annually resolved rainfall reconstructions, documentary-
based reconstructions have taken on particular importance in extending existing records of
seasonal rainfall variability and extreme events (Allan et al. 2016; Nash et al. 2016b; Neukom
et al. 2013; Nash and Hannaford 2020). Written records produced by missionaries, colonial
governments, and various diarists have provided sufficient qualitative material for systematic
reconstructions of ‘wetness’ across large parts of modern-day South Africa from the 1820s
(Vogel 1989; Nash and Endfield 2002; Kelso and Vogel 2007; Nash et al. 2016b), Namibia
from the 1840s (Grab and Zumthurm 2018), and Malawi from the 1860s (Nash et al. 2018).
Wind data recorded within ships’ logbooks have also been used to reconstruct precipitation in
South Africa from the 1790s onwards (Hannaford et al. 2015).
   At present, however, analysis of documentary sources for information on past climate
variability in the region has been largely confined to the nineteenth century. This is not wholly
surprising: the volume of written documentation produced in the region rose rapidly with each
passing decade of that century, geographical coverage expanded, and increases in missionary
correspondence—one of the richest sources for documentary-based climate reconstruction
(Nash et al. 2019)—played a key role in both of these trends. Yet first-hand observers,
including missionaries, had been writing about the climate of the region for large parts of
the preceding three centuries, especially southeast and west-central Africa, which fell under
Portuguese colonisation (Beach 1987; Jones 1987). Importantly, these narrative records extend
back into the coolest parts of the Little Ice Age (LIA) in southern Africa (c. 1690 to 1740;
Sundqvist et al. 2013).1 While LIA cooling appears to be a consistent feature in southern
African palaeoclimate records and geographical variability in LIA hydroclimates has been
observed between southeast Africa and west-central Africa (Nash et al. 2016a), few studies
have examined the occurrence, frequency, or duration of (multi-)seasonal rainfall variability
and extremes during this period, or their relationship to multi-decadal climatic change captured
by most regional palaeoclimate records. Additionally, relationships with the climate drivers
that modulated rainfall variability during the LIA, such as the El Niño–Southern Oscillation
(ENSO) and the Intertropical Convergence Zone (ITCZ), require further investigation due to
their complex and at times covarying nature.

1
    LIA in this paper refers to the ‘main phase’ LIA from c. 1550 to 1850 (Nash et al. 2016a).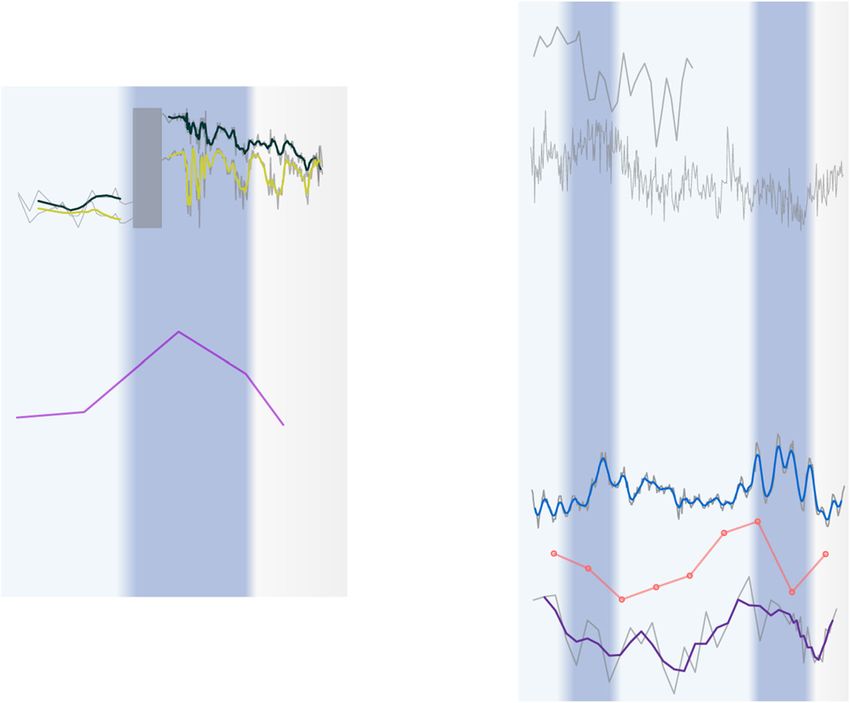
Climatic Change    (2021) 168:11                                                 Page 3 of 22   11

    Early colonial documentary sources are not without their problems. Coverage varies
between decades and across space, as did the interests of the observers. Equally, the annual
volume of material produced was generally far less than that of the nineteenth-century material
used for systematic reconstruction. These limitations notwithstanding, the deeper historical
record provides a valuable source of evidence for exploration of climate variability in the
centuries before instrumental records (Nicholson 1979, 2018; Hannaford 2020). Many ob-
servers resided in the region for years or even decades, and the topics covered within their
written accounts were relatively wide—even if dominated by topics considered important for
economic, political, and religious matters (Beach 1987). Weather and climate, as it happened,
were important for all three. Flooded rivers or storms could impede trade over land or sea,
while droughts could destroy the production of foodstuffs that helped sustain the colonial
foothold in the region (Hannaford 2018b). Climate was believed to be crucial in the spread of
infectious diseases or the more general health of different parts of a region. Missionaries also
recorded aspects of indigenous African religion that they sought to supplant, such as
mukwerera (asking for rain) (Chirikure et al. 2017), and its perceived relationship with
drought. All of these factors meant that rainfall variability, together with more generic climatic
and landscape observations, was recorded in various source types that characterise the early
colonial documentary record, but also that ‘silences’—periods where references to climatic
conditions are absent despite a continuity of written recording—can provide further clues into
long-term rainfall variability.
    In view of the advantages and limitations of the sources of past climatic information
presented above, this paper cross-compares documentary and proxy records in order to
investigate rainfall variability in the centuries prior to the start of the instrumental meteoro-
logical record. In particular, it revisits, revises, and adds to existing documentary-based rainfall
chronologies from the mid-sixteenth to early nineteenth centuries for Mozambique (Liesegang
1993; Ekblom and Stabell 2008; Hannaford 2018b; Pikirayi 2003) and Angola (Miller 1982).
It then compares these to evidence from multiple proxy-derived hydroclimate reconstructions
from these regions that span the same time period at variable resolutions (centennial-annual).
The aim of this work is therefore threefold: first, to examine and explain the comparability
between early colonial documentary records and palaeoclimate records; second, to better
understand hydroclimate variability within and between two regions of southern Africa over
the LIA; and third, to explore relationships with drivers of hydroclimate variability in these
regions, particularly long-term rainfall links with the ENSO.

2 Climatic context

The focus regions of the study are the areas that form modern-day Mozambique and Angola
(Fig. 1), which sit within the tropical and subtropical southern latitudes. These regions have
been selected because of the availability of documentary information on climate variability
dating back to the mid-sixteenthcentury—a relatively early date for Africa south of the Sahara
and outside of the West African coast and the Sahel (Nicholson 2018). The Electronic
Supplementary Material (ESM) provides additional background to the historical context of
the two regions across the study period (Section S1), with particular reference to how this
affected the geographical and chronological coverage of documentary evidence.
   Mozambique and Angola lie within the Summer Rainfall Zone (SRZ) of sub-equatorial
Africa, where most precipitation falls between November and April. For the purposes of this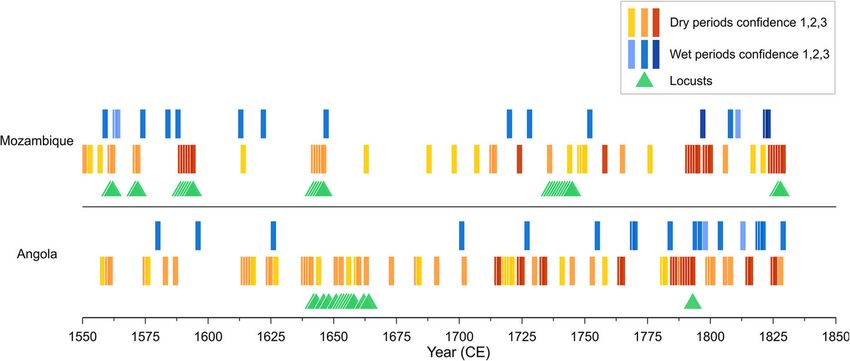
11     Page 4 of 22                                            Climatic Change       (2021) 168:11

Fig. 1 Aridity index map (Trabucco and Zomer 2018) of sub-equatorial Africa with sites mentioned in the text.
Panel A shows Angola (west-central Africa) and panel B Mozambique (southeast Africa) and adjacent areas.
Palaeoclimate record sites displayed by coloured symbols are detailed in Table 1. Prazos represent area of
Portuguese-held estates at c. 1800 CE
Climatic Change     (2021) 168:11                                                  Page 5 of 22   11

paper, these areas can be separated into two climatic regions: the Summer Rainfall Zone East
(SRZE) and Summer Rainfall Zone West (SRZW). A principal component analysis of inter-
annual rainfall variability during the nineteenth and twentieth centuries found variability within
these larger regions is generally in-phase(Nicholson 2014). However, important exceptions in
some principal components include an opposition between coastal Angola and northern
Namibia in the SRZW, and opposing rainfall anomalies north and south of around 25° S in
the SRZE. Additionally, rainfall variability displayed an east-west opposition between the
SRZE and SRZW. This opposition has also been observed over multi-decadal to centennial
timescales across the LIA, with LIA cooling associated with drying in the SRZE and wetting in
the SRZW (Nash et al. 2016a). These patterns are likely reflective of the mixture of related
atmosphere-ocean drivers of rainfall variability described below.
    Rainfall in the SRZE is derived from tropical-temperate troughs (Williams et al. 2007).
These form as the ITCZ and Congo Air Boundary (CAB)—which mark the boundary of zonal
wind convergence between Atlantic and Indian Ocean air streams—move southward during
the austral summer. Warm sea surface temperatures (SSTs) in the southwest Indian Ocean are
associated with increased rainfall in the SRZE on seasonal to interdecadal scales (Neukom
et al. 2013), while the positive phase of the Indian Ocean Dipole (IOD) is linked to dry
conditions in southeast Africa (Abram et al. 2020). Moisture conditions are also influenced by
ENSO, which influences the mean position of tropical-temperate troughs (Williams et al.
2007). During the El Niño phase, the SRZE experiences drier summers, and the La Niña phase
is associated with the opposing response. Wetter conditions over the SRZE are also associated
with positive phases of the Southern Annular Mode (SAM), whereas negative phases bring
drier conditions through a northward extension of the westerlies (Gillett et al. 2006). Rainfall is
generally higher along the coast and decreases further inland due to orographic effects. The
central Mozambican coastal settlements of Beira, near the historical settlement of Sofala, and
Quelimane, receive a mean annual precipitation of ~1400–1500 mm.2 This figure drops to
~900 mm around Mozambique Island (Ilha de Moçambique) and ~ 800 mm at Maputo.
Moving up the Zambezi, Chemba, proximate to the historical settlement of Sena, receives
~700 mm rainfall per annum; this falls to ~600 mm at Tete 400 km upstream.
    SRZW rainfall is similarly linked to the annual movement of the ITCZ and the CAB
(Nicholson 2000). Rainfall amount is also strongly associated with SSTs and upwelling in the
southeast Atlantic. Southwesterly flows of dry air are linked to the cold Benguela current and
restrict the influx of easterly moisture streams from the Indian Ocean (Jury and Engert 1999),
which results in greater aridity along the coast (Fig. 1). However, above normal SSTs linked to
a more southerly position of the Angola-Benguelafront—where the warm Angola ocean
current meets the Benguela current—deliver late summer rainfall along the coast and inland
(Rouault et al. 2003). Moisture conditions are also influenced by ENSO. During El Niño years,
circulation changes can lead to a weakening of the Angola Low (Crétat et al. 2019), which may
reduce rainfall over northern Namibia and southeast Angola. However, less consistent anom-
alies are observed in the Angolan coastal zone (Hoell et al. 2015). La Niña years tend to be
associated with drier conditions in the coastal zone and more varied conditions inland and in
northern Namibia (Hoell et al. 2015). The coastal settlements of Benguela and Luanda, from
2
 All figures are from Nicholson’s Africa monthly precipitation dataset, 1901–1984. Mozambique reference
periods are Beira 1913–1984, Quelimane 1908–1984, Mossuril (near Mozambique Island) 1913–1973, Maputo
1892–1984, Chemba 1931–1981, and Tete 1908–1984. Angola reference periods are Benguela 1944–1973,
Caconda 1949–1973, Luanda 1901–1984, and Mbanza Kongo 1917–1973 (gaps in 1930s/1940s) (Meteorology
Department/Florida State University 1980).
11 Page 6 of 22 Climatic Change (2021) 168:11
where most of the Angolan written records derive, receive a mean annual precipitation of
~250 mm and ~ 360 mm, respectively. These lowland coastal regions experience the highest
levels of inter-annual rainfall variability in the region (Dias 1981). Mean annual precipitation
rises to ~1250 mm 220 km inland at Caconda in the highlands and a similar total 175 km
inland at Mbanza Kongo.
3 Materials and methods
3.1 Documentary rainfall chronologies
This paper uses two documentary chronologies of seasonal rainfall conditions for July–June
‘rain-years’ over the period 1550–1830. The Mozambique chronology expands substantially
on previous identifications of droughts by Liesegang (1993), Nicholson (1996), Pikirayi
(2003), and Ekblom and Stabell (2008) through consultation of published and unpublished
European, primarily Portuguese, documentary materials (as outlined in Hannaford 2018a) and
secondary literature on the history of the region. The chronology for Angola was adapted from
the compilation of climatic extremes and epidemics published by Miller (1982), which was
based on consultation of Portuguese archival records at the Arquivo Histórico Ultramarino and
published secondary literature.
The methods underpinning the construction of the two documentary chronologies follow an
established tradition of historical climatology research in Africa (Nicholson 2018, 1979; Nash
et al. 2019; see ESM S2 for further background on climatic information within early colonial
documents and its resolution). All climate-related information was recorded verbatim and
assigned to July–June ‘rain-years’ unless otherwise stated. Where documents were consulted
as English translations, in most cases, the documents were consulted in their original language
to ensure accuracy. In years where rainfall classifications were possible, conditions were
simply classified as wet or dry, with no attempt to quantitatively distinguish the severity of
wet and dry conditions (as in Miller 1982; Nash et al. 2016b). While qualitative distinctions
were possible for some years with a high volume of observations, the more limited information
available in other years would enforce too high a degree of subjectivity on the classifications to
render them comparable. The occurrence of locust swarms or plagues was also categorised as
outbreaks are known to be responsive to seasonal climatic conditions (Steedman 1990; Bahana
and Ngazero 1999). Specifically, gregarious behaviour of the red locust (Nomadacris
septemfasciata) increases as rainfall deficits reduce available habitat and increase locust
density. This can cause migratory swarms to become displaced from outbreak areas in central
Mozambique and southern Malawi, including westwards towards Angola (Steedman 1990).
Confidence intervals were assigned to seasonal classifications in both chronologies to avoid
false equivalence of classifications based upon varying quality and quantity of evidence
(following Kelso and Vogel 2007). A 3-point scale was used. ‘1’ equals low confidence,
where reports may derive from single second-hand observer, contain imprecision over the
timeframe, or consist of an indirect reference to possible climate impacts such as a shortage of
food or water. ‘2’ represents medium confidence, where reports may still derive from a single
observer but are reported at first-hand, are more richly descriptive, or include direct references
to climatic phenomena. ‘3’ equals high confidence, which typically includes multiple first-
hand descriptions of the same phenomenon with specific dates and locations.Climatic Change (2021) 168:11 Page 7 of 22 11
Finally, the range of evidence used as indicators of drought in the original Angolan
chronology published by Miller (1982) was narrowed to ensure greater comparability with
the Mozambique chronology. For example, Miller’s (1982) dataset includes multiple instances
where warfare was taken as indirect evidence for drought due to the common coincidence
between the two. Here, however, unless there is an explicit link between drought and specific
conflicts, these indirect classifications were removed due to the complexities associated with
this assumption. Specifically, while drought could stimulate conflict via a decline in available
foodstuffs, conflict itself could also cause food shortages which precipitate further conflict,
causing the chain of causation to become reversed (van Bavel et al. 2019). This resulted in the
removal of three possible hydroclimate-related entries from the original Angola chronology.3
3.2 Palaeoclimate records
In order to enable comparison with documentary records, palaeoclimate records were selected
on the basis that they (i) represent past rainfall or moisture, (ii) cover the time period of interest
(1550–1830 CE), and (iii) fall within the SRZE or SRZW. For speleothem isotope records,
reconstructions for both δ13C and δ18O were included due the multi-factorial influences that
affect these proxies (Lachniet 2009; Fohlmeister et al. 2020). While annual data are preferable
and have permitted high-resolution comparison between documentary and proxy records in
other regions (Kiss 2017; White 2019), resolutions up to centennial timeframes were used in
some cases, particularly for areas with very few reconstructions (i.e. SRZW) (Table 1).
Based on our criteria, palaeoclimate reconstructions from annual to centennial resolution
were selected from 10 sites (Table 1): seven from the SRZE and three from SRZW. Proxy
types include isotopes, diatoms, tree ring widths, biogenic silica, and pollen. SRZE records are
primarily derived from northeast South Africa at around 23–24° S, including the two
speleothem isotope records from CAC and the annually resolved MAP/PAF carbon isotope
record derived from baobab trees, with further records from southeast South Africa at around
27–29° S and Lake Malawi (Fig. 1). SRZW records are scarce, with no records at centennial
resolution or above for modern-day Angola itself. Records are therefore drawn from north-
eastern or central Namibia, the highest resolution of which is the DC1 record from the
speleothem isotope record at 19.4° S (Voarintsoa et al. 2017). Lower resolution pollen and
isotopic proxies from hyrax middens supplement these records (Scott 1996; Chase et al. 2009).
In addition, hydroclimate reconstructions from Anjohibe cave in northwestern Madagascar
(Scroxton et al. 2017) and eastern African lakes (Tierney et al. 2013), as well as reconstruc-
tions of southwest Indian Ocean SSTs derived from coral records (Zinke et al. 2014) and
southeast Atlantic upwelling (Farmer et al. 2005), were examined for evidence of rainfall
variability in neighbouring regions and drivers of rainfall.
Palaeoclimate reconstructions were trimmed to show only the period between 1500 and
1900 CE. The data were first plotted by region (Section 4.2). To enable comparison with
documentary chronologies, hydroclimate residuals (z-scores) were calculated using the mean
of the records over the timeframe 1500–1900(Section 5.1). Given the limited quantity of
annually resolved proxy data and the possibility of temporal errors in the age models of these
series, the comparison examined the timing, frequency, and duration of dry and wet rain-years
in the documentary chronologies, as well as their absences, in relation to rainfall variability at
3
The years excluded are 1568 (famine likely a result of war), 1572 (war tentatively linked to drought), and 1601
(felling of palm groves for edible pulp, but ample foodstuffs otherwise reported).11
Table 1 Metadata for palaeoclimate records used in the study
Site(s) Code Type Proxy dataset Lat Lon Start End Resolution Reference(s)
Page 8 of 22
Mapungubwe/Pafuri MAP/PAF Tree ring δ13C −23.26 to 29.27 to 999 CE 2014 CE Annual Woodborne et al. (2016)
−22.38 31.55
Karkloof KK Tree ring Ring width −29.3 30.2 1142 CE 1912 CE 7-year running mean Hall (1976)
Cold Air Cave T7 CACT7 Speleothem δ18O, δ13C −24.02 29.11 4 50 BCE 1904 CE Multi-annual, annual Holmgren et al. (1999);
interpolations Sundqvist et al.
(2013)
Cold Air Cave T8 CACT8 Speleothem δ18O, δ13C −24.1 29.11 23,000 BCE 1948 CE Multi-annual Holmgren et al. (2003)
Anjohibe cave AC Speleothem δ18O −15.53 46.88 383 CE 1887 CE Annual to multi-annual Scroxton et al. (2017)
Dante Cave DC1 Speleothem δ18O, δ13C −19.4 17.8 1493 CE 1950 CE Multi-decadal to annual Voarintsoa et al. (2017)
Dante Cave DC2 Speleothem δ18O, δ13C −19.4 17.8 3000 BCE 1950 CE Multi-decadal to annual Sletten et al. (2013)
Kuiseb River KR Hyrax Pollen −23.41 15.25 150 BCE 1950 CE Centennial Scott (1996)
midden
Spitzkoppe SP Hyrax δ13C, δ15N −21.83 15.19 9750 BCE 1923 CE Centennial Chase et al. (2009)
midden
Lake Malawi LM Lake %BSi −10 to −9.81 34.1 to 34.28 1454 CE 1996 CE Multi-annual Johnson et al. (2001)
sediment
Lake Sibaya LSB Lake Diatom productivity −27.3 32.6 148 CE 1890 CE Multi-annual to multi-decadal Stager et al. (2013)
sediment and conductivity
Limpopo Valley LV Pollen Pollen −23.66 30.26 4157 BCE 1963 CE Centennial Ekblom et al. (2012)
Lakes Edward, Challa, EAL Lake record Modelled Hydroclimate −0.25 to −10 29.5 to 37.7 1275 CE 1950 CE Multi-decadal Tierney et al. (2013)
Victoria, Tanganyika, reconstruction
Naivasha, Masoko,
Malawi
Climatic Change
ODP Hole 1084B 1084B Foraminifera Neogloboquadrina −25.30 13.02 19,132 BCE 1950 CE Centennial Farmer et al. (2005)
pachyderma
(left coiling)
abundance
Global ITCZ-sensitive sites ITCZ Multi-proxy Multi-proxy −30 to 30 −180 to 180 50 BCE 2000 CE Decadal Lechleitner et al. (2017)
hydroclimate
reconstruction
Southwest Indian Ocean SWIO Coral 18
δ O −23.35 to 43.58 to 1660 CE 1994 CE Annual Zinke et al. (2014)
(2021) 168:11
−23.14 46.61Climatic Change (2021) 168:11 Page 9 of 22 11 longer (decadal-centennial) timescales within palaeoclimate records covering the LIA. Much of the focus of the comparison was given to the higher resolution palaeoclimate records, which capture rainfall variability across timescales (annual to decadal) more analogous to the documentary records. However, the lower resolution records provided important context on mean state variability. Observed patterns were also compared with reconstructions of possible drivers of rainfall variability, including SSTs from the Agulhas Current region (Zinke et al. 2014), global ITCZ sensitive sites (Lechleitner et al. 2017), and ENSO (Gergis and Fowler 2009)(Section 5.2). 4 Results 4.1 Documentary chronologies Figure 2 shows a comparative view on the occurrence of drier and wetter events in Mozam- bique and Angola, coloured by the confidence interval assigned to each classification (full details and references are presented in Table S1 for Mozambique and Table S2 for Angola). In total, 42 hydroclimate-related events, spanning 68 rain-years, are observed for Mozambique, in contrast to 65 hydroclimate-related events, spanning 87 rain-years, for Angola. High or medium confidence was ascribed to most seasonal classifications in both regions—51 in Mozambique and 69 in Angola. In both regions of interest, reports of drier rain-years (n = 51, 18% of total years in Mozambique; n = 69, 25% in Angola) exceed wetter rain-years (n = 17, 6% in Mozambique; n = 18, 6% in Angola). This pattern is present in each of the centuries (Fig. S1), including when classifications with low confidence are excluded. At this point, it should be noted that over-representation of drier seasons is common in documentary reconstructions in dryland areas (Nash et al. 2016b), although the opposite pattern has been observed in central Namibia (Grab and Zumthurm 2018). The discrepancy in the number of droughts between the two areas may be expected due to the overall quantity of written documentation produced for the two areas in the period of interest (see Section S1). However, this may also relate to the drier baseline climatic conditions of coastal Angola. The latter explanation is substantiated by the greater comparability in the number of wet events reported between the two regions. Fig. 2 Documentary-derived seasonal hydroclimate-related events in Mozambique and Angola, 1550–1830
11    Page 10 of 22                                     Climatic Change   (2021) 168:11

   In Mozambique, the early nineteenth century had the highest proportional total of rain-years
with classifications as either dry or wet, with 33% of its 30 years classified as dry. The late
sixteenth century had the second highest proportional total of dry years, followed by the
eighteenth century, while the seventeenth century had the lowest proportional total. In Angola,
the early nineteenth century and the eighteenth century both had the highest proportional totals
of dry years, each with 30%. A different trend is observed for wetter conditions, where in
Angola, the late sixteenth century witnessed more reports of wetter years than the seventeenth
century. The same broad pattern is observed for Mozambique, where the proportion of wetter
years was at its lowest in the seventeenth and eighteenth centuries.
   Geographically, references to hydroclimate-related events come from a spread of modern-
day Mozambique and neighbouring areas of the SRZE, with no dominant area (Table S1).
Several multi-year droughts also affected large parts of the region in tandem (Section 4.1.1).
Reports of hydroclimate-related events in Angola centre around Luanda, Benguela, and
adjacent parts of the coastal zone (Table S2). Reports of drought come from a wider range
of locations during the sixteenth, seventeenth, and early nineteenth centuries, while the
eighteenth-century reports mostly derive from Luanda and Benguela. Few references to
drought relate to the interior highlands beyond the middle Kwanza or the Kingdom of Kongo.
Coherence in the timing of drought between Mozambique and Angola is limited, with only 15
seasons simultaneously classified as dry in both regions, eight of which fall within the multi-
year drought periods from the 1790s onwards.
   The potential extent to which the patterns described above derive from the nature of
climatic conditions versus the production of documentary material and observer interest will
be discussed in Section 5.1.

4.1.1 Evidence for drier periods

In Mozambique, the 51 rain-years classified as dry (37 > low confidence) include nine multi-
year dry periods (1561–1563, 1571–1573, 1589–1595, 1642–1647, 1713–1715, 1748–1751,
1791–1796, 1798–1801, 1824–1830, eight > low confidence). In 1561–1563, drought was
reported to have affected the coast and inland, with resort to famine foods such as caterpillars
around Inhambane. Drought was also accompanied by an outbreak of locusts. Drought of
similar duration was said to have affected the Zambezi from Sena to Tete, Manyika, and
Mozambique Island in 1571–1573. The most detailed descriptions of this event come from
Francisco de Monclaro, whose descriptions of dry conditions may partly stem from his
encounter with an environment unfamiliar to a colonial observer. However, corroboration
comes from Manyika, while food was scarce and ‘very dear’ at Mozambique Island. A third,
more extended period of drought struck the SRZE from 1589 to 1995. Here, João dos Santos
described the severe effects of the ‘great sterility and famine’ that reigned along the Zambezi
and Mozambique coast, which combined with a plague of locusts and a severe outbreak of
smallpox. The shipwreck account from the Santo Alberto, wrecked off the South African coast
in 1593, corroborates the wide extent of this drought in its descriptions of scarce provisions
from present-day KwaZulu-Natal to Maputo Bay caused by want of rain.
   The only multi-year drought recorded during the seventeenth century was that of 1642–
1647, when a survivor of the shipwrecked Nossa Senhora da Atalaya reported that it had not
rained for 5 years throughout the whole region, causing great famine and a plague of locusts.
The latter half of the century seems to have been more remarkable for its epidemics than
Climatic Change    (2021) 168:11                                              Page 11 of 22   11

climatic extremes (Axelson 1960), with only three other possible dry rain-years found within
the documentary record, all of which were assigned low confidence.
    Reports making explicit reference to drought and its severity increase during the eighteenth
century. Drought in 1713–1715 was described as ‘remarkable’, and the resultant famine,
together with a smallpox epidemic, resulted in mass mortality. Later in the century, Lacerda
wrote of the ‘great droughts’ that struck Tete and the wider Zambezi area from 1792 to 1796.
This forced a reliance on banana tree roots and other famine foods, eventually resulting in a
large death toll amongst people and livestock alike. Drought returned across the SRZE in
1798–1801. Grain prices around Tete reached high levels in 1798, while in 1801, Diniz
described a drought that had been raging for several years in Butua. In southeast South Africa,
oral traditions refer to this period as the mahlatule famine (Hannaford 2020). In 1824–1830,
the most protracted drought reported since 1589–1595 hit the SRZE, which Newitt (1988)
refers to as the ‘Great Mozambique drought’. The highest concentration of reports comes from
the lower Zambezi, where drought, relieved only by short rains in 1827, but thereafter
accompanied by locusts, helped trigger mass mortality and the breakdown of social order.
Famine was also reported in southeast South Africa at this time (Hannaford and Nash 2016).
    In Angola, the 69 rain-years classified as dry (53 > low confidence) include 13 multi-year
dry periods (1560–1562, 1614–1618, 1624–1626, 1638–1642, 1715–1717, 1718–1722, 1724–
1726, 1733–1735, 1764–1766, 1785–1794, 1799–1802, 1815–1817, and 1825–1827, 12 >
low confidence). Evidence for multi-seasonal droughts during the sixteenth century is limited
to multiple reports of food shortages, social tensions with rainmakers, and slaughter of cattle in
the Ngola capital inland of Luanda in 1560–1562. Three multi-seasonal droughts affected
Luanda and the lower Kwanza valley during the seventeenth century. Between 1614 and 1618,
it was reported not to have rained at Luanda. A decade later, in 1624–1626, there was a back-
to-back failure of the rains at Luanda, with concurrent reports of food shortages in the Kwanza
valley. Drought returned to the lower Kwanza area in 1639–1642, corresponding with
shortages of food at Benguela. The mid-century period also witnessed very high numbers of
reported locust plagues. Dry rain-years were reported in the Kongo and Sonyo areas on a
number of occasions during the remainder of the seventeenth century, with a concentration of
poorly dated multi-year droughts at Benguela between 1656 and 1666 (Miller 1982). There
were relatively few reports of droughts around Luanda during the later seventeenth century.
    An increase in reports of multi-seasonal dry periods was observed during the eighteenth
century, especially in the coastal area. In 1715–1717, lack of rain prompted food shortages,
substantial rises in the price of grain and the establishment of a price ceiling at Luanda, and
famine mortality inland. In March 1726, it was reported that no rain had fell at Luanda and in
the adjacent interior for at least 2 years, leading to unprecedently high grain prices. Back-to-
back failures of the rains at Luanda returned once again in 1733–1735, leading to a ‘great
famine’ throughout the realm, including the interior by 1736 (Miller 1982). A similar situation
prevailed in these areas in 1764–1766. Severe drought struck Luanda for 3 years in 1785–1788,
with a complete failure of the rains causing food shortages and requests for imports. Drought
continued in 1788–1789, and the rainy seasons of 1789–1794 brought even less rainfall,
resulting in the ‘worst famine ever recorded at Luanda’, with food shortages also extending
inland (Miller 1982). Famine mortality reached Benguela by 1793, where after a failure of the
1793–1794 rainy season, it was reported that animals began to attack people. Protracted aridity
and food shortages returned to Luanda in 1799, with grain prices remaining high until 1802.
    Two further periods of multi-seasonal drought were reported during the early nineteenth
century. In 1815–1817, it was noted that no rain fell at Luanda for 2 years, while drought was
11 Page 12 of 22 Climatic Change (2021) 168:11 also reported from the central highlands in 1817. A later drought in 1825–1827 was more spatially extensive, with its impacts reported at Catumbela in 1825 and further reports in the central highlands and at Luanda over the following 2 years, with high mortality amongst people and livestock at the latter. 4.1.2 Evidence for wetter periods In contrast to drought phases, almost all of the 17 wet rain-years reported in Mozambique (14 > low confidence) lasted a single season. During the late sixteenth century, wet rain-years and floods were reported to follow or precede droughts during the early 1560s, the early 1570s, and the late 1580s. In most cases, wet conditions seem to have been a result of above-average seasonal precipitation rather than short-duration storms. Evidence of wetter seasons during the seventeenth century comes from shipwreck accounts, with numerous references to heavy rains and the ripening of crops in 1622–1623 and in late 1647. Several accounts written in this period also make generic references to the fertility and well-watered nature of the Zambezi. However, these do not allow classification of specific rain-years. The Dutch dagregister kept at Delagoa Bay (Maputo) in 1728–1829 describes relatively wet conditions for most of that rain-year, as did Pereira’s account of his journey from Quelimane to Angoche in 1752–1753. Lacerda also reported that the season of 1797–1798 had been ‘very rainy’ in the Zambezi area. Further references to wet conditions during the early nineteenth century accounts include direct reports of wet conditions throughout 1822–1823, with more indirect references to full water tanks and ‘sickly’ conditions at Mozambique Island in 1808–1809 and 1811–1812. Similar to Mozambique, most of the 18 wet rain-years reported in Angola (17 > low confidence) lasted for a single season. During the sixteenth century, reports of heavy rains came from the Kwanza valley (1580) and the lower Bengo (1596), the latter of which was linked with the cause of disease amongst Portuguese troops. Heavy rains and disease also blighted a Portuguese expedition to the Congo River in 1627. References to wet rain-years increase during the eighteenth century. In 1701, unusually intense rainfall was reported to have ruined streets in Luanda. In 1728, wetter conditions helped grain prices at Luanda return to normal levels following periods of drought, and deluges in that year brought down houses and washed away paths in Luanda. The rain-years of 1769–1771 were likely relatively wet, with abundant harvests recorded at Luanda. Ample rains were also reported at Luanda in 1784– 1785, 1795–1797, and 1798–1799, with those in 1796–1797 causing severe damage to houses and linked with disease at Benguela. Further references to wet rain-years occur during the nineteenth century. Unusually early and excess rains hit Luanda in 1805 and floods were reported along the Catumbela River near Benguela during the early part of the 1813–1814rain- year(Miller 1982). Heavy rains at Luanda during the 1818–1819rain-year caused damage to infrastructure, with rainfall plentiful at Luanda and Benguela in 1820–1822. Further torrential rains were reported at Benguela in 1829, causing buildings to collapse. 4.2 Palaeoclimate reconstructions Palaeoclimate reconstructions for the SRZE, SRZW, neighbouring regions, and proximate hydroclimate drivers are shown in Fig. 3, with patterns between the two regions broadly in antiphase. SRZE sites LSB, LV, KK, CAC T7/T8, and MAP/PAF show some consistency from the sixteenth to nineteenth centuries, but display more complex intra-regional variability on decadal-multi-decadal timescales than within the SRZW. Most sites show increased
Climatic Change (2021) 168:11 Page 13 of 22 11
SRZE
WET WET 8
LM- %BSi M98 2PG,
12
SRZW
1PG, & 10MC
16
20
WET -12
-27.2
24
18
C
-11 -26.4 28
O & 13Ccarb VPDB_adj
13
wet hiatus
DC1- DP1
-10 -25.6 32
MAP/PAF-
-9 36
-24.8
-8
-24
-12 -7 -3.2
O & 13Ccarb VPDB_ac
-11 -6 -23.2
-4
18
CAC T8-
O & 13Ccorr
DC2- DP1
-10
-4.8
-9
-5.6
KR- Euclea pollen %
-8 24 -2.4
20 -2.8 -6.4
O & 13CcarbPDB
-7
18
-3.2
16 -7.2
-6 -3.6
CAC T7
12
-4
8 -4.4
4 -4.8
18
0 -5.2
9.6
-5.6 3.2
KK- tree ring
10
width (mm)
-6 2.4
10.4
N
10.8 1.6
15
11.2 0.8
LV- AP/Poaceae
SP-
11.6 0.1
0
12 0.08
12.4
0.06 240
12.8
0.04
LSB- diatom
320
conductivity
1500 1550 1600 1650 1700 1750 1800 1850 1900
Age (CE) 400
5 480
amplitude of MCEOF
4
proxy synthesis
3 560
2
EAL-
1 1500 1550 1600 1650 1700 1750 1800 1850 1900
0 Age (CE)
-7
O (conv)
-1
-6.5
-2
-6
-3 10 -5.5
18
-5
1084B- %NSP
12
-4.5
14 -4
AC-
16 -3.5
-1.2
-1
-3 1.2
SST anomaly (°C)
18 0.8
stack zscores
-0.8 0.4
-0.6 20 0 SWIO-
ITCZ-
-0.4 -0.4
-0.2 -0.8
0 -1.2
0.2 -1.6
0.4 -2
0.6 -2.4
1500 1550 1600 1650 1700 1750 1800 1850 1900 1500 1550 1600 1650 1700 1750 1800 1850 1900
Age (CE) Age (CE)
Fig. 3 Palaeoclimate stack of the selected reconstructions from SRZW, SRZE, neighbouring regions, and
hydroclimate drivers (see Table 1 for references)
wetness from c. 1550 to 1600, apart from sites LV and LSB, followed by drying and higher
multi-decadal variability from c. 1600 to 1750. Wetter conditions are observed at KK and
CAC T7 at c. 1650 to 1675, as well as in the ITCZ-sensitive AC record from northwestern
Madagascar (Fig. 3; Scroxton et al. 2017). Generally wetter conditions prevail across the
SRZE from c. 1780 to 1850, punctuated by drought at c. 1800 at most sites, especially LM
(Fig. 3). Offsets in the timing of transitions between palaeoclimate records could be due to the
type of natural archive and the dating methods (i.e. lake records vs. tree rings). However, they
may be real artefacts of the climate transitions and regional to local climate variabil-
ity. Moisture patterns in this region are consistent with reconstructed southwest Indian
Ocean (SWIO) SSTs (Fig. 3), with cooler SST anomalies at c. 1680–1750 and a shift
towards warmer anomalies thereafter, corresponding to hydroclimate conditions in the
majority of the SRZE records.11 Page 14 of 22 Climatic Change (2021) 168:11
Records from the SRZW display consistent drier conditions from c. 1500 to 1600, followed
by increased wetness from c. 1650 to 1800. The more highly resolved DC records nevertheless
indicate relatively high variability in δ13C, which although subject to multi-factorial influences
has been interpreted as evidence for moisture availability (Voarintsoa et al. 2017). Higher δ13C
values (i.e. drier conditions) are observed around c. 1650, c. 1725, and c. 1780–1800(Fig. 3),
whereas lower δ13C values (i.e. wetter conditions) are observed at c. 1575–1600(DC2, Fig. 3)
and c. 1675–1700 in both DC records. There is a general decline in wetness from c. 1800 to
1900 at DC and KR; however, at SP, there is a decrease in wetness at c. 1775 followed by an
increase at c. 1850. Slower centennial-scale transitions in SRZW hydroclimate follow shifts in
the mean latitudinal position of the ITCZ (Fig. 3). Specifically, when the ITCZ is in a more
southerly position, as from c. 1650 to 1850, greater moisture is observed in the SRZW. SRZW
records also show correspondence with upwelling in the southeast Atlantic Ocean (Farmer
et al. 2005). Lower upwelling intensity is shown at c. 1625, c. 1750, and c. 1800, which
corresponds to increasing moisture over land, whereas increased upwelling at c. 1550 is
associated with drier conditions (Fig. 3). LIA moisture conditions in the SRZW also show
strong coherence with lake records from easternmost Africa (Fig. 3; Tierney et al. 2013).
5 Discussion
5.1 Do documentary and proxy records agree?
The two documentary chronologies were compared to the hydroclimate reconstruction z-scores
from the SRZE and SRZW (Fig. 4). General, but inconsistent, agreement is found between the
two source types within both regions, with strong correspondence in some parts of the LIA and
weaker coherence in others. These patterns can be explained by both the rainfall variability and
contextual factors behind the nature of documentary recording, as discussed below.
In Mozambique and the SRZE, palaeoclimate records show a wet-dry-wet pattern across
the LIA, with considerable temporal variability within, and spatial variability between, the
records at multi-decadal timescales. Drier periods show some consistency with the frequency
of (multi-)seasonal droughts reported by historical observers. Both sources show a predomi-
nance of dry conditions from c. 1600 to 1750 (Fig. 4). Correspondence is evident in the mid-
seventeenth century, when protracted drought and locust plagues parallel drier events at CAC,
MAP/PAF and in the lower-resolution LV record. Similarly, reports of drought and locust
plagues increase from c. 1700 to 1750, when almost all palaeoclimate records show very dry
conditions, consistent with the peak of LIA cooling in southern Africa (Sundqvist et al. 2013).
This period also saw the lowest SSTs in the SWIO coral record, with the lows at c. 1713–1715
corresponding with severe drought, famine, and a smallpox epidemic inland. The protracted
droughts of the 1790s appear to be captured at LM in particular, as well as at LSB and MAP/
PAF. Severe and protracted drought during the mid/late 1820s also corresponds to a decline in
southwest Indian Ocean SSTs and drier conditions at MAP/PAF, LV, and KK (Fig. 4).
Less consistent patterns are found during the early and late seventeenth century, when the
number of documentary references to drought reduces to a low, but palaeoclimate records
show generally drier or mixed signals. There is no immediately obvious historical reason for
the reduction in written reference to drought, especially as this period marked the highpoint of
Portuguese expansion in the region (Section S1). Rather than the quantity of available
evidence, other explanations may be that private traders, who dominated the southeast AfricanClimatic Change (2021) 168:11 Page 15 of 22 11
SRZE
SRZW Mozambique
LM-%BSi- M98 2PG,
-12
-8
1PG, & 10MC
Angola
-4
-2 0
4
-1
δ18Ocarb VPDB_adj
-1.6 8
DC1-DP1
0 12
MAP/PAF
-0.8
16
δ13C
1
wet hiatus
0
-2 2
0.8
δ13Ccarb VPDB_adj
-1 3 1.6
DC1-DP1
1.6
0 0.8
CAC T8-
δ18Ocorr.
1 0
2 1.6
-1.6 -0.8
1.2
δ18Ocarb VPDB_ac
-0.8 0.8 -1.6
CAC T8-
DC2-DP1
δ13Ccorr.
0 0.4
0
0.8
-0.4 1.6
-2 1.6
-0.8 1.2
δ13CcarbPDB
δ13Ccarb VPDB_ac
-1 2.4
CAC T7-
-1.2 0.8
DC2-DP1
0 0.4
0
1 16 -0.4
Euclea pollen %
2 12 -0.8
0.8
-1.2
δ18OcarbPDB
3 8
CAC T7-
0
KR
4
tree ring width (mm) diatom conductivity
0 -0.8
1.6
-4 -1.6
-1.6 0.8
-8
KK-
-2.4 0
SP-δ 15N
-0.8
0.04 -0.8
AP/Poaceae
0
0.02 -1.6
LV-
0.8
0
-160
1.6 -0.02
-80
LSB-
1500 1550 1600 1650 1700 1750 1800 1850 1900
0
Age (CE)
3 80
amplitude of MCEOF
proxy synthesis
2 160
1
EAL-
0 1500 1550 1600 1650 1700 1750 1800 1850 1900
-1 -2.4 Age (CE)
-2 -1.6
-4
δ18O (conv)
1084B- %NSP
-3
AC-AB2
-0.8
-2
0
-1 0 0.8
SST anomaly (°C)
-0.8 1.6
stack zscores
2 1.6
-0.6
0.8
ITCZ-
-0.4
SWIO-
-0.2 0
0 -0.8
0.2
0.4 -1.6
1500 1550 1600 1650 1700 1750 1800 1850 1900 1500 1550 1600 1650 1700 1750 1800 1850 1900
Age (CE) Age (CE)
Fig. 4 Palaeoclimate reconstruction z-scores from SRZW, SRZE, neighbouring regions, and hydroclimate
drivers (see Table 1 for references). Blue shading indicates wetter conditions than the mean over 1500–1900
CE, and yellow represents dry conditions. In the documentary chronologies, darker hues indicate high confidence
and lighter hues indicate low confidence (scales 1–3)
interior for parts of the seventeenth century (e.g. the 1650s to 1670s), were less inclined to
write about droughts and famines (Liesegang 1993). Equally, colonial adjustments to food
provision, such as the introduction of crops like winter wheat, may have reduced agricultural
sensitivity to drier conditions (Hannaford 2018b), or colonial observers became more accus-
tomed to the climate of the region and therefore found droughts less worthy of mention. That is
to say, the apparent reduction in recording was in agricultural drought (failures of crops
attributed to lack of water) or that recording of hydrometeorological drought (deficits in
moisture and rainfall, particularly over single seasons) was deemed to be less important once
a degree of (colonial) environmental knowledge had developed. However, if this was the11 Page 16 of 22 Climatic Change (2021) 168:11 predominant reason, then reports of drought would have been unlikely to increase again during the eighteenth century. Moreover, the colonial presence still depended on acquiring food from African and Swahili populations, where the crop mix remained largely consistent of sorghum, millet and rice (Hannaford 2018b). The limited recording of dry events in the early and late seventeenth century may therefore reflect the more mixed signals of palaeoclimate records over this period (Fig. 4). Wetter periods in SRZE palaeoclimate records show mixed correspondence with the documentary chronology. For example, in the periods c. 1550–1600 and c. 1800–1830, several (but not all) palaeoclimate records indicate wetter conditions, yet a relatively high number of droughts were recorded (Fig. S1). However, most wet seasons across the chronology were also recorded during these periods. Conversely, the late eighteenth century shows increased signs of wetness in the palaeoclimate records, and although several droughts were reported in this period, they were all single-season length until the droughts of the 1790s. These mixed patterns may instead indicate that transitions in moisture availability were associated with higher inter-annual variability and greater recording of extremes of both signs (Fig. 4). Alternatively, the mixed signals could be associated with the complexities of SRZE moisture patterns, for example, due to Indian Ocean SSTs and shifts in the variability and mean state of the IOD and ENSO (Abram et al. 2020). The modulation of SRZE rainfall by multiple atmosphere-ocean drivers complicates interpretation of rainfall patterns and warrants further research over historical timescales. Given the long timespan of the study, there is likely to be some relationship between the overall amount of documentary recording and reporting of climatic conditions. For example, there is probably some degree of randomness in the recording of individual rain-years based on the timing of richly descriptive accounts (e.g., shipwreck diaries). More fundamentally, there was a growth in the production of documentary evidence within Mozambique after its separation from the Viceroyalty of Goa after 1752, which could be expected to increase coverage of hydroclimate-related events. However, Table S1 suggests that this may simply have increased the number of references to the same event (thus providing higher confidence), or to individual dry rain-years, rather than severe, protracted and spatially extensive droughts. Fig. S1 reinforces the absence of a linear relationship over time, with a higher proportion of references to dry events in the late sixteenth century than the seventeenth or late eighteenth centuries, when documentary recording increased. Similarly, the early eighteenth century reduction in Portuguese documentation on Mozambique (Hannaford 2018a) does not corre- spond to a decrease in reported droughts. The SRZW palaeoclimate records show a dry-wet-dry pattern across the LIA, with a predominance of wetter conditions across much of the later LIA from c. 1650 to 1800. The documentary records, however, suggest considerable inter-annual variability and frequent drought across this period, with multi-season events clustered around the 1630s, 1650s, 1710s–1720s, and 1780s–1790s. Comparison of documentary records with the lower resolu- tion records from KR and SP is challenging. However, there is strong correspondence between the abovementioned drought clusters and the higher δ13C values in the DC records at c. 1650, c. 1725, and c. 1780–1800, while lower δ13C values at c. 1575–1600 and c. 1675–1700 correspond to a reduction in reported droughts of any duration. The correspondence with drought and recurrent locust outbreaks at c. 1650 is particularly noteworthy given that δ13C values at this time in the DC2 reconstruction were the highest across the study period. As in the SRZE, there is an increase in recording of rainfall extremes of both signs in the early nineteenth century, when the KR and SP records as well as the DC1 record show key
Climatic Change   (2021) 168:11                                              Page 17 of 22   11

hydroclimate transitions (Fig. 4). Documentary evidence from the turn of the nineteenth
century elucidates the high inter-annual variability at this time, with Vasconcelos noting that
‘we who live in this land are faced constantly with the choice between dying of hunger in the
dry years or of sickness in the rainy ones, and in such a place what could prosper and who
would want to live?’ (Miller 1982, p. 54). The abruptness of transitions during the earlier part
of the study period is obscured by the limited resolution of the records.
   Increased reports of droughts over time in the Angolan documentary chronology suggest
some role of growing production of documentary records as a whole. Yet this seems to relate
more to the lesser degree of recording in the sixteenth century—when the later important
Luanda was still a fledgling colonial settlement and Benguela had not yet been founded—than
a gradual longer-term effect. This probably reduced recording of agricultural drought in the
vicinity of Luanda during the earlier part of the study period, which thereafter become
dominant in subsequent centuries when arimos (agricultural properties) became established
along the Kwango and Bengo rivers (Thornton 2020).

5.2 Drivers of rainfall variability: ENSO and summer rainfall

Section 4.2 highlighted some of the key drivers modulating SRZE and SRZW hydroclimate
variability during the LIA. Cooler SST anomalies in the SWIO coral records at c. 1680–1750
are associated with reduced moisture availability over the SRZE (Fig. 3). Cooler anomalies
were also coeval with a transition to wetter moisture conditions in palaeoclimate records from
the Winter Rainfall Zone of South Africa (Stager et al. 2012), which infer equatorward shifts in
the westerly storm tracks (Woodborne et al. 2015). In the SRZW, a more southerly position of
the ITCZ and reduced southeast Atlantic upwelling were associated with greater moisture
availability during the LIA. Coherence between SRZW hydroclimate records and the eastern
African lakes (Fig. 3) has also been linked to a westward shift in the position of the CAB (Nash
et al. 2016a), resulting in drier conditions at northern SRZE sites such as LM (Fig. 3).
    A further driver that has played an important role in modulating southern African summer
rainfall in the twentieth century is ENSO, with the strongest SRZ moisture response in the rain-
year following El Niño and La Niña events (Richard et al. 2000; Rouault and Richard 2005).
However, longer duration studies of ENSO-rainfall relationships in the SRZE suggest that the
nature of these links has been non-stationary(Woodborne et al. 2015, 2016), or that ENSO is
not a simple determinant of rainfall anomalies (Nash et al. 2016b). The two documentary
chronologies permit further analysis of links between ENSO and seasonal rainfall variability
over long timescales.
    Following Nash et al. (2016b), Table S3 displays documentary-derived moisture conditions
in Mozambique and Angola across the study period during the austral summer immediately
following each El Niño, La Niña, and neutral year as identified in a 500-year multi-proxy
ENSO reconstruction (Gergis and Fowler 2009).
    In the SRZE, 22 of the dry rain-years reported by historical observers followed El Niño
years and 21 followed La Niña years, with a further 14 following neutral years. While this
shows no overall dominant pattern, the temporal distribution of these associations is worthy of
note. Ten of the 22 dry seasons that followed El Niño years occurred in just a 40-year period
between 1791 and 1830, whereas only three dry seasons followed La Niña years during the
same period. By contrast, in the period up to 1700, 11 dry seasons were preceded by La Niña
years compared to six El Niño years. The split was more even in the intervening period of c.
1700–1790, with seven dry events preceded by La Niña years and six by El Niño years.
11 Page 18 of 22 Climatic Change (2021) 168:11 These temporal differences may lend support to the non-static correlation between south- east African summer rainfall and ENSO identified by Woodborne et al. (2015, 2016). Specifically, Woodborne et al. (2015) find that over most of the second millennium, drier conditions reconstructed from baobab trees at Pafuri were associated with La Niña conditions, while wet conditions were associated with El Niño conditions, suggesting a relatively recent inversion in this relationship to the modern climatological norm. Woodborne et al. (2016) add that the correlation of rainfall with ENSO is weak prior to c. 1650, but strong after c. 1750. Further evidence for such a shift is found in the timing of associations with wetter rain-years, despite their lower overall frequency in the documentary record. All of the five El Niño years that preceded wet rain-years in Mozambique occurred before the mid-eighteenth century, whereas five of the six La Niña years that preceded wet rain-years occurred after the mid- eighteenth century, demonstrating greater similarity with modern relationships in the later study period. It should be noted, however, that many rain-years following El Niño and La Niña years remain unclassified; therefore, these associations should be treated with caution. In the SRZW, large-scale geographical coherence in late twentieth century ENSO-rainfall links was more variable than in the SRZE (Hoell et al. 2015; Section 2). Comparison of the Angola chronology with the 500-year ENSO reconstruction reveals that El Niño years preceded 24 dry rain-years (nine low confidence) and eight wet rain-years, La Niña years preceded 33 dry rain-years (five low confidence) and seven wet rain-years, and neutral events preceded 16 dry rain-years and two wet rain-years(Table S3). The temporal distribution of these links is broadly consistent across the study period. However, La Niña years correspond with a greater proportion of drier years during the eighteenth century, when most reports of extremes come from Luanda and Benguela. These relationships appear to correspond to the modern (negative) rainfall responses observed in coastal Angola following La Niña years (Hoell et al. 2015) in comparison to the more mixed rainfall responses in El Niño events. 6 Conclusions This study has extended and revised existing documentary-derived chronologies of seasonal rainfall variability in southeast and west-central Africa and has compared these to a range of palaeoclimate proxy records covering the LIA. The documentary and palaeoclimate records indicate that the SRZE and SRZW were distinct regions of hydroclimate variability—both on seasonal and longer timescales—over much of the study period, supporting earlier findings (Nicholson 2014; Nash et al. 2016a). Within these two regions, the source types generally, but do not always, agree in their signals of hydroclimate variability. Both regions do, however, suggest agreement between hydroclimate transitions and increased documentary recording of (multi-)seasonal extremes of both signs. These patterns reflect both the nature of regional-local rainfall variability and the social context behind the recording of hydroclimate extremes in early colonial documentary sources. Moreover, while the documentary records used in this study perform particularly well at capturing extremes at the inter-annual to decadal scale, they are less effective at capturing mean state rainfall variability. A further finding is that the Mozambique documentary chronology suggests that long-term hydroclimate links with ENSO are complex and possibly non-stationary, demonstrating the need for further research into the nature of these relationships over long time periods. Overall, despite the limitations of documentary and palaeoclimate sources in southern Africa prior to the early nineteenth century, this paper demonstrates that both source types
You can also read


