Canadian Continental-Scale Hydrology under a Changing Climate: A Review
←
→
Page content transcription
If your browser does not render page correctly, please read the page content below
water
Review
Canadian Continental-Scale Hydrology under a Changing
Climate: A Review
Tricia A. Stadnyk 1, *            and Stephen J. Déry 2

                                          1   Department of Geography, Faculty of Arts, University of Calgary, Calgary, AB T2N 1N4, Canada
                                          2   Department of Geography, Earth and Environmental Sciences, Faculty of Environment, University of
                                              Northern British Columbia, Prince George, BC V2N 4Z9, Canada; Stephen.Dery@unbc.ca
                                          *   Correspondence: tricia.stadnyk@ucalgary.ca; Tel.: +1-403-220-6586

                                          Abstract: Canada, like other high latitude cold regions on Earth, is experiencing some of the most
                                          accelerated and intense warming resulting from global climate change. In the northern regions,
                                          Arctic amplification has resulted in warming two to three times greater than global mean temper-
                                          ature trends. Unprecedented warming is matched by intensification of wet and dry regions and
                                          hydroclimatic cycles, which is altering the spatial and seasonal distribution of surface waters in
                                          Canada. Diagnosing and tracking hydrologic change across Canada requires the implementation of
                                          continental-scale prediction models owing the size of Canada’s drainage basins, their distribution
                                          across multiple eco- and climatic zones, and the scarcity and paucity of observational networks.
                                          This review examines the current state of continental-scale climate change across Canada and the
                                          anticipated impacts to freshwater availability, including the role of anthropogenic regulation. The
                                          review focuses on continental and regional-scale prediction that underpins operational design and
                                          long-term resource planning and management in Canada. While there are significant process-based
                                changes being experienced within Canadian catchments that are equally—if not more so—critical for

                                          community water availability, the focus of this review is on the cumulative effects of climate change
Citation: Stadnyk, T.A.; Déry, S.J.       and anthropogenic regulation for the Canadian freshwater supply.
Canadian Continental-Scale
Hydrology under a Changing                Keywords: Canada; freshwater discharge; water supply; runoff; streamflow; climate change; regula-
Climate: A Review. Water 2021, 13,        tion; arctic amplification
906. https://doi.org/10.3390/
w13070906

Academic Editor: Barrie R. Bonsal
                                          1. Canada’s Changing Climate
Received: 9 March 2021                         The recent release of the Canadian Climate Change Report in 2019 (CCCR2019) con-
Accepted: 25 March 2021                   firmed what many Canadian scientists have been warning of for decades: climate change
Published: 26 March 2021                  is here, it is very real, and it is hitting Canada harder than most other regions of the world.
                                          The Arctic region is warming at a rate 1.5 to 4.5 times faster than the global mean [1], which
Publisher’s Note: MDPI stays neutral      has significant implications for Canada as more than 35% of the global pan-Arctic basin
with regard to jurisdictional claims in   (contributing to the Arctic Ocean) being Canadian territory [2], and >40% of Canada being
published maps and institutional affil-   classified as Arctic.
iations.
                                          1.1. High Latitude Warming
                                                Most of Canada has already experienced an average of 1.7 ◦ C warming since the mid
                                          1900’s [3], with the most rapid warming occurring in the past two decades. Relative to the
Copyright: © 2021 by the authors.         1981–2010 baseline period, increases ranging from 1 to more than 5 ◦ C are likely to occur
Licensee MDPI, Basel, Switzerland.        by 2070 across the continental interior of Canada [4], which is at least twice as fast, and up
This article is an open access article    to three times that, of the global mean temperature rise [3]. Arctic amplification implies
distributed under the terms and           warming is increasing disproportionately at higher latitudes, with temperatures up to 6 ◦ C
conditions of the Creative Commons        warmer than pre-industrial levels already witnessed across parts of the Arctic region [5].
Attribution (CC BY) license (https://           Despite considerable uncertainty among future climate models and projections, there
creativecommons.org/licenses/by/          is a high degree of confidence that temperatures will continue to increase across Canada, and
4.0/).

Water 2021, 13, 906. https://doi.org/10.3390/w13070906                                                       https://www.mdpi.com/journal/water
Water 2021, 13, 906                                                                                                                       2 of 14

                                 at a rate faster than the global mean temperature. The CCCR2019 states it is virtually certain
                                 that Canada’s climate will continue to warm over the 21st century [3].

                                 1.2. Wet Gets Wetter, Dry Gets Drier
                                      Precipitation is generally expected to increase across most of Canada, but there is
                                 considerable uncertainty regarding the magnitude and seasonality of those increases,
                                 which vary widely by region. Canada’s continental interior is generally getting wetter
                                 along a west to east and south to north gradient, with increases of more than 35% above
                                 historic (1981–2010) annual means projected in the northern regions of the Hudson Bay
                                 basin, and a possible (but less certain) 5% decrease projected for some prairie basins of the
                                 Nelson River [4]. Based on the Intergovernmental Panel on Climate Change’s (IPCC’s) fifth
                                 assessment report, there is high confidence that precipitation at higher latitudes will increase,
                                 but less confidence in mean seasonal increases or decreases. The most significant seasonal
                                 changes are anticipated for winter [6]. Decreases in mean seasonal summer precipitation
                                 are projected by climate models for Canada, but with a relatively low degree of confidence
                                 (relative to projected increases) [3]. It is generally thought that, globally, wet regions are
                                 tending towards becoming wetter and dry regions are becoming drier [7]. Under such
                                 a scenario, it is possible the Canadian Prairies and Palliser’s triangle (a semi-arid region
                                 of the western Canadian Prairies) may become drier, particularly if evapotranspiration
                                 outpaces smaller increases in precipitation under much warmer climates [8].

                                 1.3. Hydro-Climatic Extremes
                                           Changes to extreme events are particularly concerning: the frequency of extreme pre-
                                     cipitation is projected to increase for much of Canada, with lower recurrence time between
                                     events [3]. The combined effect of more extreme precipitation scenarios (including drought)
                                     and higher temperatures is a projected increase in fire weather [3], with events such as
                                     the 2016 Fort McMurray, Alberta Wildfire being attributed with reasonable confidence to
                                     anthropogenic climate change [9,10]. The World Meteorological Organisation has reported
                                     an increase in the number and cost of extreme events world-wide [11], which is supported
                                     by the Insurance Bureau of Canada and a recent report by the Intact Centre on Climate
                                     Adaption [12]. The Canadian Natural Disaster Database (CDD) provides information on
                                     significant disaster events tracked by the Emergency Management Framework meeting
                                     a specific set of criteria, documenting when and where the event occurred, number of
                                     injuries, evacuations and fatalities, and the cost [13]. Data obtained from the CDD indicate
                                     that the majority of natural disasters in Canada are related to extreme precipitation (storms)
    Water 2021, 13, x FOR PEER REVIEW                                                                                3 of 14
                                     and flood events (Figure 1). Flooding is estimated to be Canada’s costliest natural     disaster,
                                     with Canada receiving an average grade of ‘C’ for flood preparedness [12].

                                                   Storms                                Flood
                                                    41%                                  40%

                                                                 Wildfire        Drought
                                                                  13%              6%

                                 Figure
                                 Figure1.1.Fraction
                                             FractionofofCanadian
                                                          Canadiannatural disasters
                                                                    natural         attributed
                                                                            disasters          to event
                                                                                       attributed       types
                                                                                                  to event    from
                                                                                                           types   the the
                                                                                                                 from  CDD  (1900–
                                                                                                                           CDD  (1900–2020) [13].
                                 2020) [13].

                                    Natural disaster occurrence has notably increased in recent decades according to the
                                 CDD (Figure 2). Though inexact and incomplete records are expected to result in a lower
                                 number of natural disasters in the early 1900s, the steady increase in occurrence is still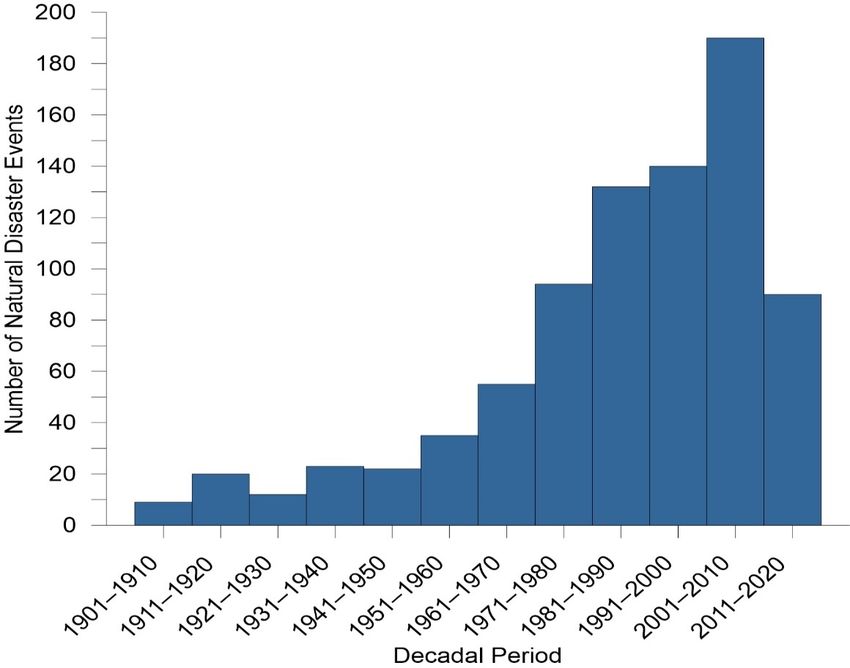
Water 2021, 13, 906 3 of 14
Figure 1. Fraction of Canadian natural disasters attributed to event types from the CDD (1900–
2020) [13].
Natural
Naturaldisaster
disasteroccurrence
occurrencehas hasnotably
notablyincreased
increasedin inrecent
recentdecades
decadesaccording
accordingtotothe
the
CDD
CDD (Figure 2). Though inexact and incomplete records are expected to resultininaalower
(Figure 2). Though inexact and incomplete records are expected to result lower
number
numberof ofnatural
naturaldisasters
disasters in
inthe
theearly
early1900s,
1900s,the
thesteady
steadyincrease
increaseininoccurrence
occurrenceisisstill
still
apparent
apparent and statistically significant. This leaves little doubt that increasedinvestment
and statistically significant. This leaves little doubt that increased investmentinin
climate
climatechange
changepreparedness,
preparedness,early
earlywarning
warningandandprediction
predictionsystems,
systems,and
andadaptation
adaptationand
and
mitigation measures are critically needed for Canada.
mitigation measures are critically needed for Canada.
Figure2.2. Frequency
Figure Frequency of
of occurrence
occurrence of
of natural
natural disasters
disasters across
across Canada
Canadaby
bydecade
decadesince
sincethe
thestart
startofof
CDDrecords
CDD records[13].
[13].The
Themost
mostrecent
recentdecadal
decadalperiod
periodisisincomplete,
incomplete,with
withCDD
CDDupupto
to2020
2020included
includedin in
this analysis.
this analysis.
2. Assessing Changes in Freshwater Availability
The Canadian landmass is divided into six continental drainage basins contribut-
ing to three oceans: Atlantic and Gulf of Mexico, Pacific, and Arctic (including Hud-
son Bay). Canada’s contribution to the global oceans is not insignificant at 4280 km3
per year (750 km3 yr−1 to the Atlantic Ocean, 2000 km3 yr−1 to the Arctic Ocean, and
1530 km3 yr−1 to Pacific Ocean), which relative to an estimated total global annual dis-
charge of 36,000 km3 /year means that Canada accounts for 11.9% of total continental
freshwater discharge [14]. Continental drainage regions in Canada include the eastern
Atlantic including the St. Lawrence and Great Lakes basins, the Hudson Bay interior,
the Mackenzie and Arctic basins, Pacific and Yukon basins, and a small portion of the
Missouri basin (Milk and St. Mary’s Rivers) along the Alberta–Saskatchewan–USA bor-
ders (Figure 3). Characteristics of these basins, including their hydrometric regions and a
summary of their gauging networks are presented in Table 1.
Continental-scale hydrologic and land surface models play a crucial role in discerning
the quantity of freshwater supply across Canada, and therefore in quantifying the impacts
of climate change. Models are specifically required due to the size of these major drainage
basins, spanning multiple provinces and territories and international boundaries, and
extending across multiple hydroclimatic ecozones (Table 1). Complicating even the most
basic assessment of contemporary hydrology is the relatively (based on World Meteoro-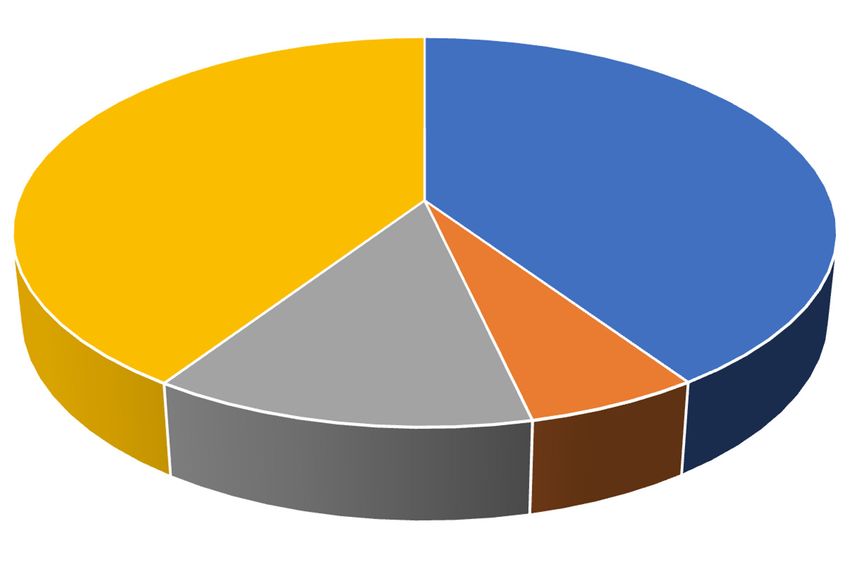
Water 2021, 13, 906 4 of 14
logical Organisation standards) poor spatial distribution and relatively short timeseries
of observations for both meteorological and hydrometric information (Table 1). Nearly
40% of Canada’s terrestrial landmass is currently ungauged and 50% is considered under-
gauged [16]. Fundamental to hydrologic assessment in Canada—historic or future—is the
Water 2021, 13, x FOR PEER REVIEW 4 of 14
establishment of continental-scale prediction systems forced by meteorological observa-
tions or reanalysis products, which must be rigorously evaluated against hydrologic and
hydrometric observations. Assessing hydrologic change across Canada therefore necessi-
2. Assessing
tates a relianceChanges in Freshwaterprediction
on continental-scale Availability systems, particularly to map the hydrology
of ungauged regions.
The Canadian It shouldisnot
landmass be understated
divided that such drainage
into six continental endeavours contain
basins significant
contributing
uncertainty when
to three oceans: input and Gulf
Atlantic evaluation
of Mexico,datasets are and
Pacific, bothArctic
spatially and temporally
(including Hudson Bay). scarce
or inconsistent,
Canada’s addingtotothe
contribution theglobal
complexity
oceansand is notuncertainty
insignificant of continental
at 4280 km3 prediction.
per year (750We
review
km3yr−1emerging data available
to the Atlantic Ocean, 2000 for km
model
3yr−1evaluation
to the Arctic atOcean,
the continental
and 1530scale,
km3yrand−1 to on-going
Pacific
research to produce
Ocean), which relativehydrologic predictions
to an estimated for Canada’s
total global annual major drainage
discharge regions.
of 36,000 km3/yearBased
on the Canadian
means that Canada Climate
accounts Change Report
for 11.9% 2019
of total (CCCR2019)
continental synthesis
freshwater [3], we [14].
discharge summarize
Con-
tinental drainage
projected changes regions
in snowin Canada
water include(SWE)
equivalent the eastern Atlantic including
and streamflow the to
in response St.changes
Law-
rence
in and Great Lakes
air temperature and basins, the Hudson
precipitation for theBaymid- interior, the Mackenzie
to late-21st and Arctic Figure
century (2020–2100; basins,4).
APacific and Yukon
qualitative basins,ofand
assessment a small portion
agreement among of the Missouri
various studiesbasin (Milk and St.
and projections Mary’s
(i.e., degree
Rivers)
of along the
confidence) Alberta–Saskatchewan–USA
and the amount of evidence available borders (Figure 3). Characteristics
(i.e., robustness of these is
of projections)
basins, including
provided using thetheir hydrometric
IPCC’s regions and
fifth assessment a summary
report of their gauging
(AR5) classifications networks
based on evidenceare
presented
and in Table
agreement [17].1.
Figure 3. Canada’s major continental drainage basins and waterways. Corresponding drainage areas and Water Survey
Figure 3. Canada’s major continental drainage basins and waterways. Corresponding drainage areas and Water Survey of
of Canada hydrometric region codes reported in Table 1.
Canada hydrometric region codes reported in Table 1.Water 2021, 13, 906 5 of 14
Table 1. Characteristics of Canada’s major drainage basins.
Water Survey of
Percent of Dominant No. Active
Drainage Drainage Area Canada Hydrometric
Terrestrial Ecozone Gauges (% % Regulation 3
Region (106 km2 ) Hydrometric Data from–to
Landmass (Others) 1 Continuous) 2
Regions
Atlantic/St.
Lawrence-Great 1.2 12.3 01, 02 Dfb/Dfc (Dfa) 948 (86%) 46% 1850–2021
Lakes
Hudson Dfc (BSk, Dwc,
4.1 41.4 03, 04, 05, 06 1106 (43%) 48% 1813–2021
Bay/Labrador Dfa, Dfb)
Missouri/Milk-
St. 0.027 0.3 11 Dfb (BSk, Bwk) 68 (14%) 74% 1908–2021
Mary’s
Mackenzie/Arctic 3.6 35.9 07, 10 Dfc (Dsb, Dfb) 390 (61%) 19% 1913–2021
Dfc (Cfb, Dsb,
Pacific/Yukon 1.0 10.1 08, 09 488 (55%) 33% 1894–2021
Dfb, Dwc)
TOTAL
Water 2021, 9.97
13, x FOR PEER REVIEW 100 6 of 14
1Based on Köppen Classification (Kpn) [15]. 2 as of February 2021. 3 Based on Water Survey of Canada (WSC) data by drainage region, of
entire hydrometric data record (active + discontinued), number of gauges with “R” code.
Figure
Figure 4.
4. Projected
Projected change
change in
in streamflow
streamflow for
for the
the mid-21st
mid-21st century
century in
in Canada’s
Canada’s major
major drainage
drainage basins,
basins, and
and synthesis
synthesis of
of
projected hydroclimatic changes reported by CCCR2019 [3]. Degree of confidence determined by agreement among
projected hydroclimatic changes reported by CCCR2019 [3]. Degree of confidence determined by agreement among various vari-
ous studies and projections, while robustness refers to the amount of evidence available [17].
studies and projections, while robustness refers to the amount of evidence available [17].
2.1.
2.1.Emerging
EmergingContinental
ContinentalDatasets
Datasets
Crucial
Crucialtotothe
theestablishment
establishmentof accurate continental-scale
of accurate prediction
continental-scale systems
prediction are con-
systems are
tinuous andand
continuous spatially congruent
spatially datasets
congruent forfor
datasets model forcing
model forcingand
andevaluation.
evaluation.Several
Severalnew
new
datasets have emerged recently that are important to highlight. The Canadian Precipita-
tion Analysis (CaPA) reanalysis continues to be important for Canadian hydrologic anal-
ysis [18]. In the past, one of its drawbacks was the limited timeseries of data available,
however, a Regional Deterministic Reanalysis Simulation (RDRS) is now available
through the Canadian Surface Prediction Archive (CaSPAr) from 2000 to 2018, along withWater 2021, 13, 906 6 of 14
datasets have emerged recently that are important to highlight. The Canadian Precipitation
Analysis (CaPA) reanalysis continues to be important for Canadian hydrologic analysis [18].
In the past, one of its drawbacks was the limited timeseries of data available, however,
a Regional Deterministic Reanalysis Simulation (RDRS) is now available through the
Canadian Surface Prediction Archive (CaSPAr) from 2000 to 2018, along with other versions
of CaPA including a fine resolution (2.5 km) product [19]. The CaPA RDRS will soon be
extended back to 1980 and made available through CaSPAr, making this highly suitable for
forcing continental-scale Canadian models.
Global Water Futures (GWF) has made a strategic investment in advancing high-
resolution forcing data for western Canada, to improve the spatial representation of precip-
itation over the Rocky Mountains. GWF-WRF (Weather Research and Forecasting model)
provides 4 km gridded climate data over the historical period (2000–2015) and into the
future (RCP 8.5) over western Canada [20]. There is also a 4 km implementation covering
most of the continental United States, up to 73◦ N latitude, available from 1995 to 2015.
A recent addition to the reanalysis landscape is the serially complete data for North
America (SCDNA) product that provides a 10 km reanalysis of precipitation and minimum
and maximum temperature from 1979 to 2018 across all of North America [21]. Through
the Canadian Centre for Climate Modelling and Analysis, there is improved dissemination
of 10 km regridded and downscaled climate data for Canadian watersheds to standardize
future analyses and improve intercomparison [22].
Emerging opportunities for more process-based model evaluation continue to be
developed through the integration of remote sensing products into models, and via aux-
iliary data such as hydrologic tracers. Recently, a Canada-wide isotopes in streamflow
dataset was released that provides stable isotopes of water in more than 300 rivers sur-
veyed by Environment and Climate Change Canada [23,24], facilitating regional analyses
of evapotranspiration partitioning and evaporation relative to inflow ratios.
2.2. Arctic and High-Latitude Drainage Regions
Greater than 60% of the water in Canada drains north, into and through high-latitude
regions that contribute to the Arctic basin. Continental hydrologic prediction plays a
particularly important role in high-latitude regions, not only because of the rapid changes
being experienced, but owing to the particularly high percentage of ungauged landmass.
Déry et al. (2016) noted statistically significant increases in northern river discharge across
Canada using a gap-filled, outlet-corrected observational discharge timeseries [25], which
corroborate findings reported by Durocher et al. [26]. This gap-filled timeseries has since
been extended to 2018 to form an important observational record for assessing model
predictions in Arctic-draining basins.
The role of freshwater discharge in determining ocean circulation and sea ice formation
and breakup has garnered increasing attention from the research community [27]. Both the
Mackenzie/Arctic and Hudson Bay systems provide freshwater input to the Arctic basin.
Stadnyk et al. (2021) recently utilized the Hydrological Predictions for the Environment
Arctic-HYPE model to map the impact of changing freshwater discharge across the entire
pan-Arctic region, including the “Canada basin” of the Arctic. A potential increase of
22%—more than twice previous estimates based only on historic periods [26,28–31]—was
projected when future periods were included in the analysis, generating a continuous
90-year timeseries of Arctic river discharge. Discharge from all Canadian basin rivers are
projected to increase (statistically significant), however regulated rivers at a slower rate than
non-regulated river regimes [2]. Among the 12 largest (by mean annual discharge volume)
pan-Arctic rivers exhibiting the most significant rate of increase were the Mackenzie and
Yukon Rivers in northern Canada.
2.3. Continental Interior and Hudson Bay
Several large, interdisciplinary projects across Canada in the past decade have con-
tributed to the mapping of continental-scale freshwater discharge within Canada’s interiorWater 2021, 13, 906 7 of 14
basins, including the BaySys project focused on Hudson Bay, Global Water Futures Inte-
grated Modelling Programme for Canada (IMPC) focused on the Nelson River basin, and
the recently started Nelson Multimodel Intercomparison Project comparing models on a
process level under both regulation and future climates. Work within the FloodNet project
has also targeted flow forecasting within the highly complex and poorly understood Prairie
Pothole region of the Nelson River basin.
Under the BaySys project, a custom implementation of the Hydrological Predictions
for the Environment (HYPE) model was established for the Hudson Bay basin that incorpo-
rated prairie potholes, frozen soils, lake parameterizations, and regulation including dams
and diversions [32]. To improve model evaluation, gap-filled, outlet-based observational
discharge data records were derived for all rivers entering Hudson Bay [25]. Future pro-
jections demonstrated greater sensitivity in the western tributaries to changes in future
climate (warmer temperatures and higher precipitation) than the eastern (Quebec basin)
tributaries resulting from the inflow-limited nature of the prairie drainage region and
sensitivity to changes in evapotranspiration [8]. Similar findings have been reported in the
literature for smaller, headwater basins of the Nelson River that are heavily influenced by
the dynamic connectivity of the Prairie Pothole region [33–35].
The differences between the eastern slopes of the Canadian Rocky Mountain range
(the headwaters of the Nelson River) and the Palliser Triangle region [36] of the prairies
are notable. Significant increases in winter discharge are reported, with declining summer
and late fall discharge by numerous studies [3]. The most significant declines in freshwater
discharge across Canada were notably in the tributaries draining the eastern Rockies
of western Canada, with many rivers across the Prairies indicating no significant trend
as a result of evapotranspiration outcompeting increasing precipitation under warmer
climates [3].
The eastern tributaries of Hudson Bay are projected to experience more significant
increases in precipitation and, as reported by extensive modelling performed by Hydro-
Québec, are expected to generate up to 15% more discharge into the future [37]. Similar
modelling by Manitoba Hydro on the western tributaries suggests more modest increases
in discharge for the Nelson River and its tributaries [38]. Overall projected increases in
Hudson Bay discharge are anticipated to be up to 20% in some regions primarily due
to increased winter flows, with significant uncertainty across the western portion of the
basin [4].
2.4. Atlantic and Great Lakes
The northern regions of the Atlantic drainage area include parts of Labrador, including
the Churchill River, which is of note because of its significance for hydropower production
in the Atlantic Provinces. Mean annual runoff change between historic and future periods
was assessed for Labrador by Roberts and Snelgrove (2015), who projected that runoff
was increasing in Labrador’s Churchill River under a series of regional climate model
simulations [39].
In the central Great Lakes region, though hydrologic studies have been numerous over
the past few decades, few have sought to examine freshwater availability across the entire
region. The dominance of the Great Lakes themselves within this region adds a significant
complicating factor, along with the extensive agriculture and irrigation practices, flow
regulation, and large urban centres. The Great Lakes Regional Intercomparison Project
(GRIP), under the IMPC project, is an initiative to develop and compare a variety of models
ranging in structural and parameter complexity and originating from different modelling
centres and groups. The project started by looking at the Lake Erie watershed for natural
and regulated basins [40] and has now moved to setups that include the entire Great Lakes
continental drainage region. In this region, spring peak discharge is generally anticipated
to occur earlier and decrease across much of the Great Lakes and Atlantic basins, with
some exceptions noted in Québec tributaries. Atlantic and Labrador drainage regions are
anticipated to see an increase in future discharge, with the entire continental drainage basinWater 2021, 13, 906 8 of 14
seeing increasing extreme summer rainfall events that are more severe and frequent [3],
which presents a risk for increased flood events.
2.5. Pacific and West Coast
The limited number of studies at a continental-scale along the tributaries of the western
Rocky mountain drainage, or Pacific drainage basins suggest both increases and decreases
in discharge, with little to no consensus across the region but highly variable from one
basin to the next [3,41–43]. This is not surprising given the complexity of mountain runoff
and reliance on snowpacks and glaciers that are highly variable and influenced heavily
by changing climatic conditions. While total annual runoff may remain relatively stable
in a future, warmer climate, its timing will shift considerably from the warm to cool sea-
sons [41,44]. Spring freshet is anticipated to occur earlier (up to one month) in the majority
of these basins as a result of increasing temperatures and earlier snowmelt under future
climates [45,46]. Continued glacier retreat in the 21st century will reduce their buffering
capacity on summer low flows, particularly during warm, dry years [47]. A regional study
of the western Canadian basins suggests increasing water surplus (precipitation minus
potential evapotranspiration) along the Pacific coastline in all seasons but summer, where
conditions are projected to be hotter and drier [48]. The loss of vast tracts of montane
forests from timber harvesting, wildfires and pest outbreaks in a warming climate may also
be altering surface hydrological processes including increased winter snow accumulations
and earlier, faster spring melts [49]. Hydrological extremes may also be exacerbated in
Pacific coastal watersheds such as the Fraser owing to projected increases in the frequency
and intensity of landfalling atmospheric rivers, or narrow bands of concentrated moisture
transport in the upper atmosphere [50].
3. The Role of Anthropogenic Regulation
Given the focus of our review is on freshwater availability, it is important to consider
anthropogenic interventions impacting runoff and river networks enroute to continental
outlets. Dams, reservoirs, river diversions, and irrigation withdrawals complicate fresh-
water prediction efforts due to the high degree of regulation within each drainage region
(Table 1), which impacts both the timing and magnitude of discharge on annual and sub-
annual timescales [25,51]. Studies have shown an increasing trend for river fragmentation
and regulation over recent decades [52]. Within the Hudson Bay drainage region, >70%
of the discharge entering Hudson Bay is considered regulated, with 47% considered to be
intensely regulated [51,52]. If the effects of regulation are not considered, then prediction
systems will ingest errors between observed and simulated flow into the model parameter-
ization, which can significantly impact model robustness over long-term simulation and in
future periods [53,54].
Hydroelectric regulation alters the timing and magnitude of ~50% of the freshwa-
ter discharge to Hudson Bay [25] and was therefore specifically targeted by the BaySys
project [55] using scenarios that contrasted regulated and re-naturalized (pre 1970) states
over both historic and future time periods. The findings demonstrate that while climate
change is dominant on long timescales controlling inter-annual variability, intra-annual
variability was predominately controlled by regulation and upstream storage availabil-
ity [56]. Yassin et al. (2019) similarly studied the effects of reservoir regulation on river
discharge across Prairie basins and developed a standalone model for incorporating reser-
voir regulation into continental-scale predictions [57]. Initiatives to incorporate river
regulation, dams, diversions and irrigation withdrawals into network-based routing prod-
ucts play an important role for improving our understanding of the simultaneous impact
of climate change and anthropogenic controls, and have the power to offer insights at the
global scale [58]. New insights and modelling tools are the focus of the water resource
management core modelling team under the GWF umbrella.
Observational data show that increasing river regulation in Canadian rivers over
time has resulted in a distinct flattening of the average annual hydrograph, reducingWater 2021, 13, 906 9 of 14
the seasonal cyclicity of river discharge signals [51]. Compounding this effect in some
Arctic-draining rivers is climate change, which is increasing winter discharge and reduc-
ing summer and fall discharge signals, also leading to a natural flattening trend [2]. In
other basins, however, climate change and regulation may offset each other resulting in
insignificant or undetectable trends over time. Understanding the relative contributions of
climate change and regulation on Canadian freshwater discharge is critical for future water
supply availability. Implicit in this is also the role of human decisions affecting regulation,
such as reservoir releases and the development of new infrastructure, and transbound-
ary water share agreements. The IMPC project seeks to better understand the impact of
decision-making and its integration with socio-economics and ecohydrologic needs [59]. A
new water resources management model for the Nelson River basin extending from the
Bow River headwaters downstream to the lower Nelson River outlet into Hudson Bay is
fundamental to sustainable decision-making and evaluation of water allocations across the
Canadian Prairies [60,61].
4. A Path Forward: Future Research and Modelling Needs
Given the importance of continental-scale prediction for climate change mitigation
and adaption planning across Canada, there are several areas of research that must be
advanced to support accurate prediction of Canada’s freshwater supply.
The process of synthesizing projected changes in freshwater availability for this review
proved to be difficult resulting from a lack of:
1. consistency in a historical baseline period from which to measure change,
2. consistency in (model) study design, and
3. observational data in some regions for model evaluation
It is for these reasons that instead a qualitative assessment was performed for freshwa-
ter availability, reporting only increasing or decreasing trends (rather than percent change).
Furthermore, it is important to contextualize the confidence in reported projections using
terminology established for the IPCC AR5 working groups given a lack of data-driven evi-
dence in some regions (e.g., Arctic region), or considerable disagreement among modelled
projections (e.g., western Hudson Bay region). A priority for the Government of Canada
must be the unification of existing knowledge through the development of national data
repositories, guidance on climate change impact assessment (including pre-determined
historical baseline periods), and standardized methods for model benchmarking to ensure
continuity across studies.
Owing to the expansive domain, diversity, and complexity of hydrological response to
changing climates within the Canadian continental domain, we must leverage all available
data resources for accurate evaluation of prediction systems. This includes meteorological
forcing data and streamflow but requires particular emphasis on products that can be
leveraged for process-based evaluation. There is an important distinction to be made
between model accuracy and fidelity [62] that becomes increasingly important for long time
scales and under climate change [54]. It is not only important to invest in data collection,
but also model development to facilitate multi-objective optimization and decision-making
utilizing these additional data.
To that end, what is needed at the continental scale are models that produce system-
wide integrated outputs (e.g., streamflow simultaneous with water temperature and water
quality). We must consider the non-stationarity imposed by climate change on all aspects
of the system, including landcover and vegetation changes, necessitating models that can
integrate dynamic vegetation change. This is critically important for the western Pacific
basin, mountainous headwaters of the Prairie basins, and the Arctic basins as tree lines
push northward and vegetation changes as permafrost thaws. We must move beyond
stand-alone simulations of streamflow or other variables and take a much broader view of
cumulative effects and propagation of change from upstream to downstream and across
different ecosystems. This includes integration of dynamic climate-driven changes in
freshwater discharge into ocean models, water quality models, and trophic structure mod-Water 2021, 13, 906 10 of 14
els. Modelling systems that integrate river fragmentation and regulation are valuable for
assessing the socio-economic and environmental impacts of anthropogenic alteration at
the continental scale, which is crucial for sustainable water resource planning and man-
agement under climate change. Initiatives to improve the computational efficiency and
capacity for integrated water resources management models are of paramount importance
for understanding critical pathways and tipping points for decision-making on water man-
agement, and the cumulative impact on ecohydrology. Accurate depictions of reservoir
operations, withdrawals, diversions, and water licensing are also critical to ensure deci-
sions and future water scenarios accurately reflect supply and operations. With advances
in computing sciences, fully dynamic and integrated models are increasingly possible
across larger domains, such as the pan-Arctic and globally. Such integrated prediction
systems offer significant potential to support operational decisions across Canada. For
example, a model that integrates water quantity (streamflow) with temperature and river
ice simulations could be used to provide operational information for ice road seasons in
Canada’s north, which are critical for northern transportation. Similarly, sea ice models
that account for dynamic freshwater discharge and temperature will be better equipped to
provide accurate information for northern shipping routes and ice breakup. Both the above
examples are also important from a policy perspective as Canada considers Arctic security
and sovereignty. Such endeavours require much better integration of academic science and
inter-governmental operations, however, as well as investment in truly transdisciplinary
science. For example, fish health and population density are intrinsically linked to the
physical properties of streamflow (quantity, quality, and temperature), but with an absence
of operational data to assess such linkages, biologists cannot establish environmental
indicators or thresholds for sustainably managing fish population and health.
Integrated modelling has a significant role to play in supporting Canada’s First Na-
tions with their independence and community health and well-being. Clean water supply
remains perilous for most communities [63–65], with a commitment from the Federal
government to address this as a priority issue under Canada’s commitment to Truth and
Reconciliation. The problem, however, is complex and requires water supply and quality
information for the planning and design of water treatment facilities in regions that are
critically under-gauged. Integrated knowledge is also key here—with many citizen science
and community-driven observation networks popping up across Canada there exists con-
siderable opportunity to leverage additional data for model evaluation and operational
planning. Owing to issues with quality control and assurance, a lack of standardization
and continuity, the scientific community has been slow to accept such data networks. With
some support from the proposed Canada Water Agency to invest in training, support,
quality control and data repositories, however, this could be a considerable opportunity for
Canadian hydrology. Similar and significant trust issues exist with the integration of tradi-
tional knowledge from Canada’s Indigenous Knowledge Keepers, as well as Indigenous
participation in ‘western science’ [66,67], with several studies highlighting the power and
value of integrating knowledge within the hydrologic context [68–70].
Investments in science communication of integrated model outcomes are equally,
if not more so, critical to the uptake and impact of model outputs. With the recent rise
of skepticism in science [71–73], we need to do better as a scientific community to re-
establish public trust. That begins with communicating our findings in non-technical,
highly visual and interactive ways. The Virtual Water Gallery project launched by GWF
is an interactive way to communicate the science of climate change to a much broader
audience, and the c3s initiative funded by the European Union paired web developers with
scientists to visualize climate change data and scenarios [74]. The BaySys project partnered
with Manitoba Tourism and Via Rail to produce an e-book and interactive train car that
would provide educational opportunities for passengers en route to Churchill, Manitoba
regarding the impacts of climate change in Canada’s North. As a community, it is important
to invest in such endeavours, and to celebrate scientific achievement by more than just peer-
reviewed publications, recognizing that the true impact of our science extends well beyondWater 2021, 13, 906 11 of 14
knowledge and that now—more than ever—knowledge translation and operational uptake
are essential for the future of Canada’s water, food and energy supply.
Author Contributions: Conceptualization, T.A.S., S.J.D.; methodology, T.A.S.; resources, T.A.S.,
S.J.D.; data curation, T.A.S.; writing—original draft preparation, T.A.S., S.J.D.; writing—review and
editing, T.A.S., S.J.D.; visualization, T.A.S., S.J.D.; funding acquisition, T.A.S., S.J.D. All authors have
read and agreed to the published version of the manuscript.
Funding: This research was funded by the Natural Sciences and Engineering Research Council of
Canada’s Canada Research Chairs (NSERC CRC) program and the University of Calgary and the
Industrial Research Chair program to UNBC.
Institutional Review Board Statement: Not applicable.
Informed Consent Statement: Not applicable.
Data Availability Statement: Not applicable.
Acknowledgments: The authors acknowledge the contributions of Andrew Tefs who assisted in
the preparation of figures and data tables summarizing Canada’s major drainage basins. We thank
Kerry Black for her editorial support and input on traditional knowledge. We also thank the two
anonymous reviewers who provided feedback that helped to improve this manuscript.
Conflicts of Interest: The authors declare no conflict of interest.
References
1. Bring, A.; Shiklomanov, A.; Lammers, R.B. Pan-Arctic river discharge: Prioritizing monitoring of future climate change hot spots.
Earth Future 2017, 5, 72–92. [CrossRef]
2. Stadnyk, T.A.; Tefs, A.A.G.; Broesky, M.; Déry, S.J.; Myers, P.G.; Ridenour, N.A.; Vonderbank, L.; Gustafsson, D. Changing
freshwater contributions to the Arctic: A 90-year trend analysis (1981–2070). Elem. Sci. Anthr. 2021, in press.
3. Bush, E.; Lemmen, D.S. Canada’s Changing Climate Report; Ottawa, ON, Canada. 2020. Available online: https://www.nrcan.gc.ca/
sites/www.nrcan.gc.ca/files/energy/Climate-change/pdf/CCCR_FULLREPORT-EN-FINAL.pdf (accessed on 25 March 2021).
4. Stadnyk, T.A.; Déry, S.J.; MacDonald, M.; Koenig, K. The Freshwater System. In Integrated Regional Impact Study: Hudson Bay;
Kuzyk, Z.Z., Candlish, L.M., Eds.; Arctic Net: Québec City, QC, Canada, 2019; pp. 113–154.
5. Overland, J.E.; Wang, M. The 2020 Siberian heat wave. Int. J. Climatol. 2021, 41, E2341–E2346. [CrossRef]
6. Field, C.B.; Barros, V.R.; Dokken, D.J.; Mach, K.J.; Mastrandrea, M.D.; Bilir, T.E.; Chatterjee, M.; Ebi, K.L.; Estrada, Y.O.;
Genova, R.C.; et al. IPCC. Climate Change 2014: Impacts, Adaptation, and Vulnerability. Part A: Global and Sectoral Aspects.
Contribution of Working Group II to the Fifth Assessment Report of the Intergovernmental Panel on Climate Change; Cambridge University
Press: Cambridge, UK, 2014.
7. Rodell, M.; Famiglietti, J.S.; Wiese, D.N.; Reager, J.T.; Beaudoing, H.K. Emerging trends in global freshwater availability. Nature
2018, 557, 651–659. [CrossRef] [PubMed]
8. MacDonald, M.K.; Stadnyk, T.A.; Déry, S.J.; Braun, M.; Gustafsson, D.; Isberg, K.; Arheimer, B. Impacts of 1.5 and 2.0 ◦ C Warming
on Pan-Arctic River Discharge into the Hudson Bay Complex Through 2070. Geophys. Res. Lett. 2018, 45, 7561–7570. [CrossRef]
9. Kirchmeier-Young, M.C.; Zwiers, F.W.; Gillett, N.P.; Cannon, A.J. Attributing extreme fire risk in Western Canada to human
emissions. Clim. Chang. 2017, 144, 365–379. [CrossRef]
10. Kirchmeier-Young, M.C.; Gillett, N.P.; Zwiers, F.W.; Cannon, A.J.; Anslow, F.S. Attribution of the Influence of Human-Induced
Climate Change on an Extreme Fire Season. Earth Future 2019, 7, 2–10. [CrossRef]
11. Cerveny, R.S.; Bessemoulin, P.; Burt, C.C.; Cooper, M.A.; Cunjie, Z.; Dewan, A.; Finch, J.; Holle, R.L.; Kalkstein, L.; Kruger, A.; et al.
WMO assessment of weather and climate mortality extremes: Lightning, tropical cyclones, tornadoes, and hail. Weather. Clim. Soc.
2017, 9, 487–497. [CrossRef]
12. Feltmate, B.; Moudrak, M.; Bakos, K. Climate Change and the Preparedness of Canadian Provinces and Territories to Limit Flood Risk;
University of Waterloo: Waterloo, ON, Canada, 2020.
13. Public Safety Canada Canadian Disaster Database. Available online: https://cdd.publicsafety.gc.ca/?pedisable=true
(accessed on 19 February 2021).
14. Milliman, J.D.; Farnsworth, K.L. River Discharge to the Coastal Ocean: A Global Synthesis; Cambridge University Press: New York,
NY, USA, 2011.
15. Peel, M.C.; Finlayson, B.L.; McMahon, T.A. Updated world map of the Köppen-Geiger climate classification. Hydrol. Earth
Syst. Sci. 2007, 11, 1633–1644. [CrossRef]
16. Coulibaly, P.; Samuel, J.; Pietroniro, A.; Harvey, D. Evaluation of Canadian national hydrometric network density based on WMO
2008 standards. Can. Water Resour. J. 2012, 38, 159–167. [CrossRef]Water 2021, 13, 906 12 of 14
17. Mastrandrea, M.D.; Mach, K.J.; Plattner, G.K.; Edenhofer, O.; Stocker, T.F.; Field, C.B.; Ebi, K.L.; Matschoss, P.R. The IPCC AR5
guidance note on consistent treatment of uncertainties: A common approach across the working groups. Clim. Chang. 2011,
108, 675–691. [CrossRef]
18. Fortin, V.; Roy, G.; Stadnyk, T.; Koenig, K.; Gasset, N.; Mahidjiba, A. Ten Years of Science Based on the Canadian Precipitation
Analysis: A CaPA System Overview and Literature Review† . Atmos. Ocean 2018, 56. [CrossRef]
19. Mai, J.; Kornelsen, K.C.; Tolson, B.A.; Fortin, V.; Gasset, N.; Bouhemhem, D.; Schäfer, D.; Leahy, M.; Anctil, F.; Coulibaly, P.
The Canadian Surface Prediction Archive (CaSPAr): A Platform to Enhance Environmental Modeling in Canada and Globally.
Bull. Am. Meteorol. Soc. 2020, 101, E341–E356. [CrossRef]
20. Li, Y.; Li, Z.; Zhang, Z.; Chen, L.; Kurkute, S.; Scaff, L.; Pan, X. High-resolution regional climate modeling and projection over
western Canada using a weather research forecasting model with a pseudo-global warming approach. Hydrol. Earth Syst. Sci.
2019, 23, 4635–4659. [CrossRef]
21. Tang, G.; Clark, M.P.; Newman, A.J.; Wood, A.W.; Papalexiou, S.M.; Vionnet, V.; Whitfield, P.H. SCDNA: A serially complete
precipitation and temperature dataset for North America from 1979 to 2018. Earth Syst. Sci. Data 2020, 12, 2381–2409. [CrossRef]
22. Canadian Climate Data and Scenarios. Available online: https://climate-scenarios.canada.ca/?page=main (accessed on 26 February 2021).
23. Gibson, J.J.; Holmes, T.; Stadnyk, T.A.; Birks, S.J.; Eby, P.; Pietroniro, A. 18O and 2H in streamflow across Canada. J. Hydrol.
Reg. Stud. 2020, 32, 100754. [CrossRef]
24. Gibson, J.J.; Eby, P.; Stadnyk, T.A.; Pietroniro, A. Surveys of 18O and 2H in streamflow across Canada: A national resource for
tracing water sources, water balance and predictive modelling. Data Br. 2021, 34, 106723. [CrossRef]
25. Déry, S.J.; Stadnyk, T.A.; Macdonald, M.K.; Gauli-Sharma, B. Recent trends and variability in river discharge across northern
Canada. Hydrol. Earth Syst. Sci. 2016, 20, 4801–4818. [CrossRef]
26. Durocher, M.; Requena, A.; Burn, D.H.; Pellerin, J. Analysis of trends in annual streamflow to the Arctic Ocean. Hydrol. Process.
2019, 33, 1143–1151. [CrossRef]
27. Haine, T.W.N.; Curry, B.; Gerdes, R.; Hansen, E.; Karcher, M.; Lee, C.; Rudels, B.; Spreen, G.; de Steur, L.; Stewart, K.D.; et al.
Arctic freshwater export: Status, mechanisms, and prospects. Glob. Planet. Chang. 2015, 125, 13–35. [CrossRef]
28. Gelfan, A.; Gustafsson, D.; Motovilov, Y.; Arheimer, B.; Kalugin, A.; Krylenko, I.; Lavrenov, A. Climate change impact on the
water regime of two great Arctic rivers: Modeling and uncertainty issues. Clim. Chang. 2017, 141, 499–515. [CrossRef]
29. Rood, S.B.; Kaluthota, S.; Philipsen, L.J.; Rood, N.J.; Zanewich, K.P. Increasing discharge from the Mackenzie River system to the
Arctic Ocean. Hydrol. Process. 2017, 31, 150–160. [CrossRef]
30. Vetter, T.; Reinhardt, J.; Flörke, M.; van Griensven, A.; Hattermann, F.; Huang, S.; Koch, H.; Pechlivanidis, I.G.; Plötner, S.;
Seidou, O.; et al. Evaluation of sources of uncertainty in projected hydrological changes under climate change in 12 large-scale
river basins. Clim. Chang. 2017, 141, 419–433. [CrossRef]
31. Krysanova, V.; Hattermann, F.; Wechsung, F. Implications of complexity and uncertainty for integrated modelling and impact
assessment in river basins. Environ. Model. Softw. 2007, 22, 701–709. [CrossRef]
32. Stadnyk, T.A.; MacDonald, M.K.; Tefs, A.; Déry, S.J.; Koenig, K.; Gustafsson, D.; Isberg, K.; Arheimer, B. Hydrological modeling of
freshwater discharge into Hudson Bay using HYPE. Elem. Sci. Anthr. 2020, 8, 43. [CrossRef]
33. Muhammad, A.; Evenson, G.R.; Stadnyk, T.A.; Boluwade, A.; Jha, S.K.; Coulibaly, P. Assessing the importance of potholes in the
Canadian Prairie Region under future climate change scenarios. Water 2018, 10, 1657. [CrossRef]
34. Dibike, Y.; Prowse, T.; Shrestha, R.; Ahmed, R. Observed trends and future projections of precipitation and air temperature in the
Lake Winnipeg watershed. J. Great Lakes Res. 2012, 38, 72–82. [CrossRef]
35. Dibike, Y.; Muhammad, A.; Shrestha, R.R.; Spence, C.; Bonsal, B.; de Rham, L.; Rowley, J.; Evenson, G.; Stadnyk, T. Application of
dynamic contributing area for modelling the hydrologic response of the Assiniboine River basin to a changing climate. J. Great
Lakes Res. 2020. [CrossRef]
36. Marchildon, G.P. A Dry Oasis: Institutional Adaptation to Climate on the Canadian Plains; CPRC Press University of Regina: Regina,
SK, Canada, 2009; ISBN 978-0-88977-217-5.
37. Guay, C.; Minville, M.; Braun, M. A global portrait of hydrological changes at the 2050 horizon for the province of Québec.
Can. Water Resour. J. 2015, 40, 285–302. [CrossRef]
38. Climate Change Report: Insight into the Strategies Making Manitoba Hydro an Industry Leader in Responding to Climate Change;
Winnipeg, MB, Canada. Available online: https://www.hydro.mb.ca/environment/pdf/climate_change_report_2020.pdf
(accessed on 5 March 2021).
39. Roberts, J.; Snelgrove, K. Uncertainty in Regional Climate Model Mean Runoff Projections under Climate Change: Case Study of
Labrador’s Churchill River Basin. Atmos. Ocean 2015, 53, 319–331. [CrossRef]
40. Mai, J.; Tolson, B.A.; Shen, H.; Gaborit, É.; Fortin, V.; Gasset, N.; Awoye, H.; Stadnyk, T.A.; Fry, L.M.; Bradley, E.A.; et al. The
Great Lakes Runoff Intercomparison Project Phase 3: Lake Erie (GRIP-E). J. Hydrol. Eng. 2021. [CrossRef]
41. Ul Islam, S.; Déry, S.J. Evaluating uncertainties in modelling the snow hydrology of the Fraser River Basin, British Columbia,
Canada. Hydrol. Earth Syst. Sci. 2017, 21, 1827–1847. [CrossRef]
42. Shrestha, R.R.; Cannon, A.J.; Schnorbus, M.A.; Zwiers, F.W. Projecting future nonstationary extreme streamflow for the Fraser
River, Canada. Clim. Chang. 2017, 145, 289–303. [CrossRef]
43. Schnorbus, M.; Werner, A.; Bennett, K. Impacts of climate change in three hydrologic regimes in British Columbia, Canada.
Hydrol. Process. 2014, 28, 1170–1189. [CrossRef]Water 2021, 13, 906 13 of 14
44. Kerkhoven, E.; Gan, T.Y. Differences and sensitivities in potential hydrologic impact of climate change to regional-scale Athabasca
and Fraser River basins of the leeward and windward sides of the Canadian Rocky Mountains respectively. Clim. Chang. 2011,
106, 583–607. [CrossRef]
45. Islam, S.U.; Curry, C.L.; Déry, S.J.; Zwiers, F.W. Quantifying projected changes in runoff variability and flow regimes of the Fraser
River Basin, British Columbia. Hydrol. Earth Syst. Sci. 2019, 23, 811–828. [CrossRef]
46. Elsner, M.M.; Cuo, L.; Voisin, N.; Deems, J.S.; Hamlet, A.F.; Vano, J.A.; Mickelson, K.E.B.; Lee, S.Y.; Lettenmaier, D.P. Implications
of 21st century climate change for the hydrology of Washington State. Clim. Chang. 2010, 102, 225–260. [CrossRef]
47. Clarke, G.K.C.; Jarosch, A.H.; Anslow, F.S.; Radić, V.; Menounos, B. Projected deglaciation of western Canada in the twenty-first
century. Nat. Geosci. 2015, 8, 372–377. [CrossRef]
48. Dibike, Y.; Prowse, T.; Bonsal, B.; O’Neil, H. Implications of future climate on water availability in the western Canadian river
basins. Int. J. Climatol. 2017, 37, 3247–3263. [CrossRef]
49. Vore, M.E.; Déry, S.J.; Hou, Y.; Wei, X. Climatic influences on forest fire and mountain pine beetle outbreaks and resulting runoff
effects in large watersheds in British Columbia, Canada. Hydrol. Process. 2020, 34, 4560–4575. [CrossRef]
50. Curry, C.L.; Islam, S.U.; Zwiers, F.W.; Déry, S.J. Atmospheric Rivers Increase Future Flood Risk in Western Canada’s Largest
Pacific River. Geophys. Res. Lett. 2019, 46, 1651–1661. [CrossRef]
51. Déry, S.J.; Stadnyk, T.A.; MacDonald, M.K.; Koenig, K.A.; Guay, C. Flow alteration impacts on Hudson Bay river discharge.
Hydrol. Process. 2018, 32, 3576–3587. [CrossRef]
52. Grill, G.; Lehner, B.; Lumsdon, A.E.; Macdonald, G.K.; Zarfl, C.; Reidy Liermann, C. An index-based framework for assessing
patterns and trends in river fragmentation and flow regulation by global dams at multiple scales. Environ. Res. Lett. 2015,
10, 015001. [CrossRef]
53. Clark, M.P.; Wilby, R.L.; Gutmann, E.D.; Vano, J.A.; Gangopadhyay, S.; Wood, A.W.; Brekke, L.D. Characterizing uncertainty of
the hydrologic impacts of climate change. Curr. Clim. Chang. Reports 2016, 2, 55–64. [CrossRef]
54. Stadnyk, T.A.; Holmes, T.L. On the value of isotope-enabled hydrological model calibration. Hydrol. Sci. J. 2020, 65, 1525–1538.
[CrossRef]
55. Tefs, A.A.G.; Stadnyk, T.A.; Koenig, K.A.; Déry, S.J.; Macdonald, M.K.; Hamilton, M.; Slota, P.; Crawford, J. Simulating river
regulation and reservoir performance in a continental-scale hydrologic model. Environ. Model. Softw. 2021, in press. [CrossRef]
56. Tefs, A.A.G. Simulating Hydroelectric Regulation and Climate Change in the Hudson Bay Drainage Basin by 2018.
Available online: https://mspace.lib.umanitoba.ca/handle/1993/33613 (accessed on 28 February 2021).
57. Yassin, F.; Razavi, S.; Elshamy, M.; Davison, B.; Sapriza-azuri, G.; Wheater, H. Representation and improved parameterization of
reservoir operation in hydrological and land-surface models. Hydrol. Earth Syst. Sci. 2019, 23, 3735–3764. [CrossRef]
58. Gharari, S.; Clark, M.P.; Mizukami, N.; Knoben, W.J.M.; Wong, J.S.; Pietroniro, A. Flexible vector-based spatial configurations in
land models. Hydrol. Earth Syst. Sci. 2020, 24, 5953–5971. [CrossRef]
59. Eamen, L.; Brouwer, R.; Razavi, S. The economic impacts of water supply restrictions due to climate and policy change: A
transboundary river basin supply-side input-output analysis. Ecol. Econ. 2020, 172, 106532. [CrossRef]
60. Hassanzadeh, E.; Elshorbagy, A.; Wheater, H.; Gober, P. Managing water in complex systems: An integrated water resources
model for Saskatchewan, Canada. Environ. Model. Softw. 2014, 58, 12–26. [CrossRef]
61. Kim, S.J.; Asadzadeh, M.; Stadnyk, T.A. Understanding the effects of climate change on hydropower in Manitoba, Canada.
Environ. Model. Softw.. submitted.
62. Computational Hydrology|University of Saskatchewan—Fidelious! An Age-Old Adjective That Has a Rightful Place in the
Hydrological Vernacular. Available online: https://uofs-comphyd.github.io/blog/fidelious (accessed on 26 February 2021).
63. Baijius, W.; Patrick, R.J. “We Don’t Drink the Water Here”: The Reproduction of Undrinkable Water for First Nations in Canada.
Water 2019, 11, 1079. [CrossRef]
64. Black, K.; McBean, E. Increased Indigenous Participation in Environmental Decision-Making: A Policy Analysis for the Improve-
ment of Indigenous Health. Int. Indig. Policy J. 2016, 7. [CrossRef]
65. Galway, L. Boiling over: A Descriptive Analysis of Drinking Water Advisories in First Nations Communities in Ontario, Canada.
Int. J. Environ. Res. Public Health 2016, 13, 505. [CrossRef]
66. Awume, O.; Patrick, R.; Baijius, W. Indigenous Perspectives on Water Security in Saskatchewan, Canada. Water 2020, 12, 810.
[CrossRef]
67. Basdeo, M.; Bharadwaj, L. Beyond physical: Social dimensions of the water crisis on Canada’s First Nations and considerations
for governance. Indig. Policy J. 2013, 23, 1–14.
68. Woo, M.-K.; Modeste, P.; Martz, L.; Blondin, J.; Kochtubajda, B.; Tutcho, D.; Gyakum, J.; Takazo, A.; Spence, C.; Tutcho, J.; et al.
Science Meets Traditional Knowledge: Water and Climate in the Sahtu (Great Bear Lake) Region, Northwest Territories, Canada.
Arctic 2007, 60, 37–46. [CrossRef]
69. Khalafzai, M.A.K.; McGee, T.K.; Parlee, B. Flooding in the James Bay region of Northern Ontario, Canada: Learning from
traditional knowledge of Kashechewan First Nation. Int. J. Disaster Risk Reduct. 2019, 36, 101100. [CrossRef]
70. Sanderson, D.; Picketts, I.M.; Déry, S.J.; Fell, B.; Baker, S.; Lee-Johnson, E.; Auger, M. Climate change and water at Stellat’en First
Nation, British Columbia, Canada: Insights from western science and traditional knowledge. Can. Geogr. Géographe Can. 2015,
59, 136–150. [CrossRef]
71. Rekker, R. The nature and origins of political polarization over science. Public Underst. Sci. 2021. [CrossRef]Water 2021, 13, 906 14 of 14
72. Haltinner, K.; Sarathchandra, D. The Nature and Nuance of Climate Change Skepticism in the United States. Rural Sociol. 2021.
[CrossRef]
73. Vulpe, S. Cooling down the future. A discourse analysis of climate change skepticism. Soc. Sci. J. 2020, 1–17. [CrossRef]
74. IMPC Researcher Featured as Canadian Showcase for Copernicus Climate Change Service—IMPC—Global Water Futures—
University of Saskatchewan. Available online: https://gwf.usask.ca/impc/articles/2019/impc-researcher-featured-as-canadian-
showcase-for-copernicus-climate-change-service.php (accessed on 26 February 2021).You can also read