Molecular composition and photochemical evolution of water-soluble organic carbon (WSOC) extracted from field biomass burning aerosols using ...
←
→
Page content transcription
If your browser does not render page correctly, please read the page content below
Atmos. Chem. Phys., 20, 6115–6128, 2020
https://doi.org/10.5194/acp-20-6115-2020
© Author(s) 2020. This work is distributed under
the Creative Commons Attribution 4.0 License.

Molecular composition and photochemical evolution of
water-soluble organic carbon (WSOC) extracted from field biomass
burning aerosols using high-resolution mass spectrometry
Jing Cai1,2 , Xiangying Zeng1 , Guorui Zhi3 , Sasho Gligorovski1 , Guoying Sheng1 , Zhiqiang Yu1 , Xinming Wang1 , and
Ping’an Peng1
1 State Key Laboratory of Organic Geochemistry, Guangdong Key Laboratory of Environment and Resources,
Guangzhou Institute of Geochemistry, Chinese Academy of Sciences, Guangzhou, 510640, China
2 University of Chinese Academy of Sciences, Beijing, 100049, China
3 State Key Laboratory of Environmental Criteria and Risk Assessment, Chinese Research Academy of

Environmental Sciences, Beijing, 100012, China

Correspondence: Zhiqiang Yu (zhiqiang@gig.ac.cn)

Received: 27 June 2019 – Discussion started: 14 October 2019
Revised: 14 April 2020 – Accepted: 17 April 2020 – Published: 26 May 2020

Abstract. Photochemistry plays an important role in the evo-    oxygenated species and the formation of highly oxygenated
lution of atmospheric water-soluble organic carbon (WSOC),      products. We also tentatively compared the mass spectra of
which dissolves into clouds, fogs, and aerosol liquid water.    photolytic time-profile WSBA extracts with each other for
In this study, we tentatively examined the molecular com-       a more comprehensive description of the photolytic evolu-
position and evolution of a WSOC mixture extracted from         tion. The calculated average oxygen-to-carbon ratio (O/C)
field-collected wheat straw burning aerosol (WSBA) sam-         of oxygenated compounds in bulk extract increases from
ples upon photolysis, using direct infusion electrospray ion-   0.38±0.02 to 0.44±0.02 (mean ± standard deviation), while
isation (ESI) coupled to high-resolution mass spectrome-        the intensity (S/N)-weighted average O/C (O/Cw ) increases
try (HRMS) and liquid chromatography (LC) coupled with          from 0.45 ± 0.03 to 0.53 ± 0.06 as the time of irradiation ex-
HRMS. For comparison, two typical phenolic compounds            tends from 0 to 12 h. These findings indicate that the water-
(i.e. phenol and guaiacol) emitted from lignin pyrolysis in     soluble organic fraction of combustion-derived aerosols has
combination with hydrogen peroxide (H2 O2 ) as a typical OH     the potential to form more oxidised organic matter, contribut-
radical precursor were simultaneously exposed to simulated      ing to the highly oxygenated nature of atmospheric organic
sunlight irradiation. Their photochemical products such as      aerosols.
phenolic dimers (e.g. m/z 185.0608 for phenol dimer and
m/z 245.0823 for guaiacol dimer) or their isomers, were also
observed in field-collected WSBA samples, suggesting that
the aqueous-phase reactions might contribute to the forma-      1   Introduction
tion of emitted biomass burning aerosols. The aqueous pho-
tochemistry of both the phenols (photooxidation) and WSBA       Water-soluble organic carbon (WSOC) comprises a signifi-
extracts (direct photolysis) could produce a series of highly   cant fraction of atmospheric aerosols, accounting for 20 %–
oxygenated compounds, which in turn increases the oxida-        80 % of total organic carbon (OC) (Krivacsy et al., 2001;
tion degree of organic composition and acidity of the bulk      Wozniak et al., 2008; Fu et al., 2015; Xie et al., 2016).
solution. In particular, the LC/ESI-HRMS technique revealed     WSOC is directly involved in the formation of cloud con-
significant photochemical evolution of the WSOC compo-          densation nuclei (CCN) by modifying the aqueous chemistry
sition in WSBA samples, e.g. the photodegradation of low        and surface tension of cloud droplets (Graham et al., 2002;
                                                                Nguyen et al., 2012; Zhao et al., 2013; McNeill, 2015). De-

Published by Copernicus Publications on behalf of the European Geosciences Union.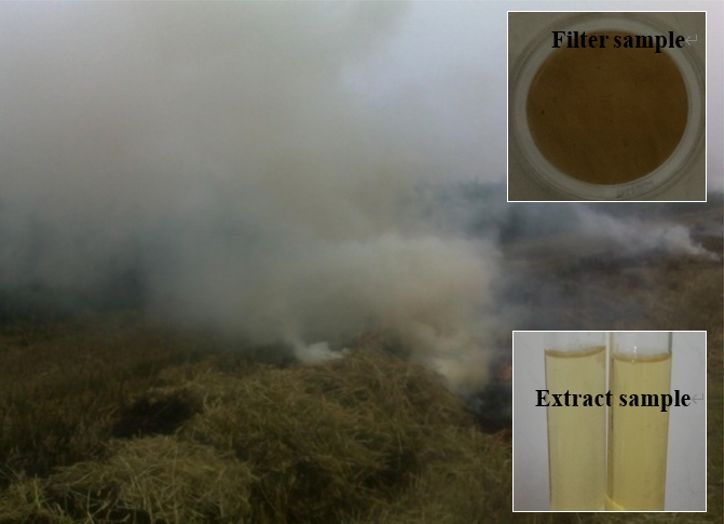
6116                                            J. Cai et al.: Molecular composition and photochemical evolution of WSOC

spite its significance, little is known about the chemical com-    2013) in aqueous solution can also lead to the formation of
position and sources of WSOC, with less than 10 %–20 %             oligomers, highly oxygenated, and multifunctional organic
of the organic mass being structurally identified (Cappiello       matter (McNeill, 2015).
et al., 2003; Fu et al., 2015). Biomass burning is a well-            In recent years, high-resolution mass spectrometry
known emission source of WSOC (Anastasio et al., 1997;             (HRMS) has been commonly applied to study the organic
Fine et al., 2001; Graham et al., 2002; Mayol-Bracero et           molecular composition in cloud water (Zhao et al., 2013;
al., 2002; Gilardoni et al., 2016). Although the composition       Boone et al., 2015), fog water (Cappiello et al., 2003), rain-
varies with fuel type and combustion conditions (Simoneit,         water (Altieri et al., 2009a, b), laboratory-generated SOA
2002; Smith et al., 2009), the WSOC mixture often covers a         (Bateman et al., 2011; Romonosky et al., 2015; Lavi et al.,
common range of polar and oxygenated aromatic compounds            2017), and field-collected aerosol samples (Laskin et al.,
(Graham et al., 2002; Mayol-Bracero et al., 2002; Duarte et        2009; Lin et al., 2012a, b; Kourtchev et al., 2013; Tong et
al., 2007; Chang and Thompson, 2010; Yee et al., 2013; Gi-         al., 2016; Wang et al., 2017). It has also been used in time-
lardoni et al., 2016) with molecules incorporating different       profile observations of the photochemical evolution of aque-
numbers of functional groups like hydroxyl, carboxyl, alde-        ous extracts from laboratory-generated SOAs (Bateman et
hyde, ketone, ester, amino, and/or other nitrogen-containing       al., 2011; Romonosky et al., 2015). However, direct infu-
groups (Graham et al., 2002). In particular, lignin pyroly-        sion mass spectrometry (MS) methods are prone to ion sup-
sis often yields a large amount of aromatic alcohols, car-         pression caused by other organic species, inorganic salts, and
bonyls, and acid compounds (Mayol-Bracero et al., 2002;            adduct formation (Kourtchev et al., 2013). Therefore, liquid
Chang and Thompson, 2010; Gilardoni et al., 2016). Once            chromatography (LC) coupled with HRMS might be another
dissolved into cloud, fog, and even aerosol liquid water, these    complementary powerful tool for relieving ion suppression
substances can undergo aqueous-phase reactions to generate         due to its abilities to separate and analyse different kind of
low-volatility species under sunlight irradiation, which have      compounds with differences in LC retention time (Kourtchev
the potential to form secondary organic aerosol (SOA) af-          et al., 2013; Wang et al., 2016). It could also provide more
ter water evaporation (Graham et al., 2002; Cappiello et al.,      information enabling the identification of possible isomers
2003; Duarte et al., 2007; Sun et al., 2010; Yu et al., 2014).     from the ions with same mass-to-charge ratio (m/z).
   Field and laboratory studies have demonstrated that aque-          To our knowledge, the aqueous photochemical evolution
ous photochemical processes contribute significantly to the        of WSOC extracted from real ambient aerosols has not been
aqueous SOA formation from biomass burning precursors              studied in detail at the molecular level. Our previous study
and the evolution of smoke particles (Sun et al., 2010; Lee        has revealed that the ultraviolet–visible (UV–vis) absorp-
et al., 2011; Kitanovski et al., 2014; Yu et al., 2014; McNeill,   tion spectra of aqueous extracts from field biomass burn-
2015; Gilardoni et al., 2016). Gilardoni et al. (2016) observed    ing aerosols were modified under simulated sunlight illu-
aqueous SOA formation in both fog water and wet aerosols,          mination (Cai et al., 2018). Based on the previously stud-
resulting in an enhancement in the oxidised organic aerosol,       ied field-collected samples, the present study is focused on
and following atmospheric ageing the overall oxidation de-         a further analysis to investigate the molecular characteris-
gree of aerosols has also increased. In laboratory studies,        tics of water-soluble organic molecules by the photochemi-
phenols and methoxyphenols (important biomass burning in-          cal evolution using electrospray ionisation (ESI)-HRMS and
termediates) are often used as SOA precursors to examine           LC/ESI-HRMS performed in negative ionisation mode. For
the photochemical evolution in aqueous environments and            comparison, we also evaluated the photochemistry of phe-
aerosol-forming potential under relevant atmospheric condi-        nol and guaiacol (representing the basic structures of phenols
tions (Chang and Thompson, 2010; Sun et al., 2010; Smith et        emitted from lignin pyrolysis) under laboratory conditions,
al., 2014; Yu et al., 2014; Vione et al., 2019). The correspond-   and tentatively traced some of their photochemical products
ing photochemical products formed through hydroxylation,           (e.g. dimers) in field-collected samples under study.
oligomerisation, and fragmentation typically cover a series of
low-volatility and highly oxygenated species. For instance,
the methoxyphenol-derived SOA are proposed as a proxy              2     Experimental section
for atmospheric humic-like substances (HULIS) (Ofner et
al., 2011; Yee et al., 2013). Other compounds emitted from         2.1    Particulate sample collection and preparation of
lignin pyrolysis, e.g. aromatic aldehydes, ketones, polycyclic            aqueous extracts
aromatic hydrocarbon (PAH), have also been found to pro-
duce coloured products via aqueous photooxidation, which           The wheat straw burning aerosol (WSBA) samples were col-
may become a part of HULIS (Anastasio et al., 1997; Chang          lected during the summer harvest season of 2013, at ru-
and Thompson, 2010; Haynes et al., 2019). In addition, pho-        ral fields in the plain of north China where the wheat was
tochemical processing of common water-soluble aliphatic            the main agricultural crop (Cai et al., 2018). To facilitate
compounds such as aldehydes (Lim and Turpin, 2015), poly-          subsequent planting and management, a large amount of
ols (Daumit et al., 2014), and organic acids (Griffith et al.,     fresh wheat straw was directly burned in the field during

Atmos. Chem. Phys., 20, 6115–6128, 2020                                             https://doi.org/10.5194/acp-20-6115-2020
J. Cai et al.: Molecular composition and photochemical evolution of WSOC 6117
2.2 Direct photolysis of WSOC extracts
A 12 h direct photolysis of WSOC extracts obtained from
WSBA samples was performed in a photo-reactor (BL-GHX-
V, Bilon Instruments Co. Ltd., China; see Fig. S1 in the Sup-
plement) that was equipped with a solar simulator (Xe lamp,
1000 W) placed in a double-deck quartz condenser (Cai et
al., 2018). Cooling water (18 ◦ C) was circulating in the outer
tube of the condenser to avoid heating of the samples. In
the wavelength range of 310–400 nm relevant to the bound-
ary layer of the atmosphere, the actinic flux of the lamp is
about 5 times stronger than the solar actinic flux, meaning
that the spectral evolution via the 12 h simulated solar irradi-
ation might be equal with the effect caused by actual sunlight
irradiation with a duration of at least 60 h (Cai et al., 2018).
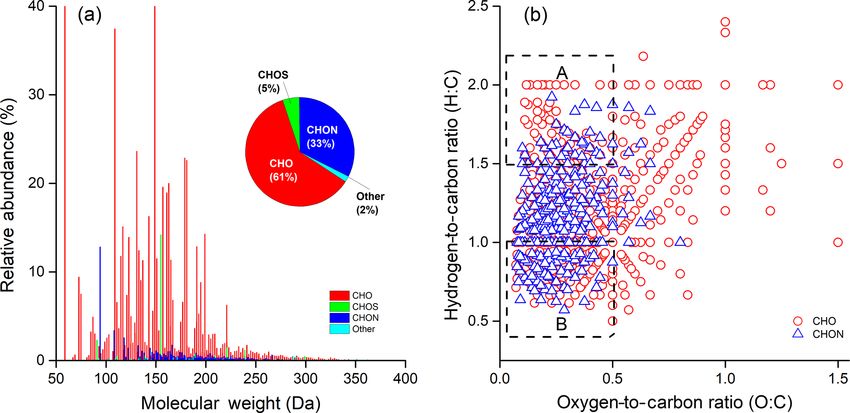
Figure 1. One field site at Daming, Hebei province, China, for sam- Airtight quartz tubes (1.5 cm in diameter, 3 mL solution per
pling the aerosols affected by biomass burning. tube) loading extracts were equidistantly arranged around the
lamp. Each extract was distributed into three tubes that cor-
responded to three different irradiation times, i.e. 0, 4, and
the harvest season, and the water emitted from burning plant 12 h, with no oxidants added externally throughout the whole
body could provide a suitable environment for aqueous pho- photolytic process. At each irradiation time point (e.g. 0 and
tochemistry of dissolved compounds. The selected WSBA 4 h), the related tubes were wrapped with aluminium foil and
samples used for HRMS analysis were collected from two placed in the initial location until the end of the 12 h photol-
sampling sites, located at rural fields in Wenxian in Henan ysis (Cai et al., 2018).
Province (denoted: HNWX) and Daming in Hebei Province As described in Cai et al. (2018), the water extraction re-
(HBDM). As described in Cai et al. (2018), the selected sam- sulted in a dilution of the collected organic compounds; how-
pling sites were mainly affected by heavy smog from wheat ever, the ratio of the water mass to PM2.5 mass for extract
straw burning (Fig. 1). The emitted fine particulate matter samples (ranging from 1.8 × 10³ to 3.4 × 10⁴ ) was compat-
with aerodynamic diameter ≤ 2.5 µm (PM2.5 ) was collected ible with the ratio of water mass to WSOC content in cloud
at a flow rate of 5 L min−1 by a portable particulate sampler water (in a wide range from 1.4 × 10² to 1.6 × 10⁴ ) (Li et al.,
(MiniVol TAS, AirMetrics, USA), with quartz fibre filters 2017), indicating that the present aqueous extracts are rele-
(47 mm in diameter, QMA, Whatman, UK) baked at 600 ◦ C vant to the atmospheric cloud water condition.
for 6 h before sampling. The sampling flow rate was cali-
brated with a standard flow meter (Bios Defender 520), and 2.3 Photooxidation of phenolic compounds under
the sampling time of each filter was restricted to 30–60 min laboratory conditions
depending on the ambient biomass burning aerosol concen-
tration and expected filter loading (Cai et al., 2018). After Initial solutions of 0.1 mM phenol (C6 H6 O) and 0.1 mM gua-
collection, the filter samples were stored in the dark and iacol (C7 H8 O2 ) in combination with an OH radical precur-
transported to the laboratory and then stored at −20 ◦ C under sor (0.1 mM H2 O2 ) were prepared in ultra-pure water (Milli-
light-proof conditions. Q, Milipore). The pH of the solution was adjusted to 5 with
The preparation of WSOC extracts and measurements for 0.1 M sulfuric acid (H2 SO4 ), which is usually relevant to the
carbon content including OC, elemental carbon (EC) (Zhi acidity in fog and cloud waters (Collet et al., 1998; Fahey et
et al., 2014) and WSOC were described in detail in Cai et al., 2005). The prepared solution and reference blank were
al. (2018). Briefly, a part of each quartz fibre filters (1.6– irradiated by simulated sunlight irradiation with a duration
3.2 cm2 ) was placed in a brown vial and extracted with ultra- of 4 h. Hereby, we mainly focus on acquiring the chemi-
pure water (Milli-Q, Milipore) twice; each time 5 mL ultra- cal characteristics of aqueous products of phenols and ten-
pure water with a 30 min ultrasonic agitation was applied. tatively identify whether certain tracer compounds (e.g. phe-
The two-time extracts were combined and filtered through nolic dimers) exist in the present biomass burning particulate
a PTFE syringe filter (0.2 µm pore size, Thermo Scientific), samples.
followed by a pH measurement with a pH meter (Mettler
Toledo SevenEasyTM S20) that had been regularly cali- 2.4 Sample analysis
brated at pH 4.00 and 6.86. Prior to analysis the extracts were
stored at −20 ◦ C in the dark. To reduce the WSOC mass loss, The direct infusion MS analysis was conducted using a
the desalting treatment (e.g. solid phase extraction, SPE) was Thermo Scientific Orbitrap Fusion Tribrid mass spectrom-
not performed on these samples. eter equipped with quadrupole, orbitrap, and linear ion trap
https://doi.org/10.5194/acp-20-6115-2020 Atmos. Chem. Phys., 20, 6115–6128, 20206118 J. Cai et al.: Molecular composition and photochemical evolution of WSOC
mass analysers, with a heated ESI source. To assist in ioni- CHONS, and others including CHN and CHS. In the present
sation and desolvation, the sample was diluted to a 1 : 1 mix- study, because the detected water-soluble ions almost were
ture of acetonitrile and sample by volume. The full scan mass below m/z 400, we focused our molecular analysis on
spectra were acquired in negative ionisation mode, with a m/z 50–400.
resolution of 120 000 at m/z 200 for the Orbitrap analyser
and a mass scan range of m/z 50–750. Before determina-
tion, the Orbitrap analyser was externally calibrated for mass 3 Results and discussion
accuracy using a Thermo Scientific Pierce LTQ Velos ESI
calibration solution. The direct infusion parameters were as 3.1 Mass spectral characteristics of WSOC extracts
follows: sample flow rate 5 µL min−1 ; capillary temperature from WSBA samples
300 ◦ C; S-lens RF 65 %; spray voltage −3.5 kV; sheath gas,
auxiliary gas, and sweep gas flows were 10, 3, and 0 arbitrary The preliminary analysis showed that the PM2.5 concentra-
units, respectively. Data collecting was performed when the tion in ambient air near the burning sites ranged from 6.46
intensity of the total ion current (TIC) maintained constant to 28.03 mg m−3 (Table S1 in the Supplement). OC was the
with a relative standard deviation (RSD) under 5 %. At least major component of the collected PM2.5 with a proportion of
100 data points (mass spectral scans) were collected for each 50.9 ± 7.6 % (mean ± standard deviation), whereas EC rep-
test sample, and each exported mass spectrum for analysis resented a negligible fraction (average 1.3 ± 0.4 %). Mean-
was derived from the average result of 100 spectra. while, WSOC accounted for 35.5±7.5 % of OC in the tested
The LC/ESI-HRMS analysis operated in negative ionisa- samples.
tion mode was performed using a U3000 system coupled Although this batch of aerosol samples were collected
with a T3 Atlantis C18 column (3 µm; 2.1×150 mm; Waters, from different sites, their water-extracted solutions showed
Milford, USA) and an Orbitrap Fusion MS. A 10 µL sample similar light-absorbing characteristics in UV–vis absorp-
was injected, with a flow rate of 0.2 mL min−1 for the mobile tion spectra (Cai et al., 2018). Here, four extract samples
phase, which consisted of H2 O (A) and acetonitrile (B). The (HNWX-1, HNWX-2, HBDM-1, and HBDM-2) (Table S1)
gradient applied was 0–5 min at 3 % B and 5–20 min from were chosen for further analysis using high-resolution mass
3 % to 95 % (linear); it was then kept for 25 min at 95 %; spectrometry. These samples also exhibited similar patterns
then 45–50 min from 95 % to 3 %, and it was then held for in mass distribution of water-soluble molecular species that
10 min at 3 % (total run time 60 min). mainly range from 50 to 400 Da, which indicated a simi-
lar burning source for these samples. A reconstructed mass
2.5 Data processing spectrum (subtracted blank) for one representative sample of
HNWX-1 is shown in Fig. 2a (others are shown in Fig. S2).
Mass spectral peaks 3 times larger than the signal-to-noise In the mass range of 50–400 Da, there were 827 ± 44 molec-
ratio (S/N) were extracted from the raw files. Peaks in ular formulas identified throughout the all samples, and most
both sample and blank spectra were retained if their inten- of the formulas (above 75 %) overlapped between these anal-
sity in the former was 5 times larger than in the latter. A ysed samples. The classification features of assigned com-
common molecular assignment based on the accurate mass pounds for analysed extracts are shown in Table S2. In the
was performed using Xcalibur software (V3.0 Thermo Sci- amount of assigned formulas, CHO composition was the
entific) with the following constraints: 12 C ≤ 50, 13 C ≤ 1, most abundant group, accounting for 59.2±2.2 % of the total
1 H ≤ 100, 16 O ≤ 50, 14 N ≤ 4, 32 S ≤ 1, and 34 S ≤ 1. All math- assignments, followed by CHON (35.0 ± 2.2 %). These re-
ematically possible elemental formulas, with a mass toler- sults are consistent with previous observations of laboratory-
ance of ±3 ppm were calculated. Elemental formulas con- generated biomass burning aerosol (Smith et al., 2009) and
taining 13 C or 34 S were checked for the presence of 12 C or field particulate samples influenced by biomass combustion
32 S counterparts, respectively. If they were not matched with (Kourtchev et al., 2016) in spite of the differences of biomass
the corresponding mono-isotopic formulas, then the assign- varieties, extracted solvents, and HRMS techniques between
ment to the next larger mass error was considered. Isotopic present and previous studies.
and unassigned peaks were excluded from further analysis. On the other hand, CHOS and CHONS compounds con-
Ions were also characterised by the number of rings plus tributed with less than 5 % to the total assignment. A num-
double bonds (i.e. double-bond equivalents, DBEs), which ber of studies have shown the wide presence of organosul-
were calculated as DBE = c − h/2 + n/2 + 1 for an elemen- fates and nitrooxy-organosulfates in urban (Lin et al., 2012b;
tal composition of Cc Hh Oo Nn Ss . The assigned formula was Wang et al., 2016), rural (Lin et al., 2012a), and forest
additionally checked with the nitrogen rule. For ambient aerosols (Kourtchev et al., 2013) and even in cloud water
samples, based on the presence of various elements in a (Boone et al., 2015); however, most of these compounds were
molecule, the identified elemental formulas were classified not observed in our negative mass spectra. This could be ac-
into several main compound classes: CHO (i.e. molecules counted for by the low extent of aerosol evolution, due to
containing only C, H, and O atoms), CHOS, CHON, and the limited oxidation conditions available for the formation
Atmos. Chem. Phys., 20, 6115–6128, 2020 https://doi.org/10.5194/acp-20-6115-2020J. Cai et al.: Molecular composition and photochemical evolution of WSOC 6119 Figure 2. (a) Reconstructed mass spectra for detected ions with assigned formulas and (b) Van Krevelen diagrams for CHO and CHON species in extract of HNWX-1 sample. The inset pie charts in (a) show the number fraction of each class in the total assigned compounds. Areas A and B in (b) are tentatively attributed to aliphatic and aromatic species, respectively. of organosulfates and nitrooxy-organosulfates in fresh smoke The interpretation of the complex organic mass spec- aerosols. For example, laboratory studies have observed the tra generated by high-resolution mass spectrometry can be significant formation of organosulfates via photooxidation in simplified by plotting the hydrogen-to-carbon ratio (H/C) the presence of acidic sulfate aerosol (with significant level against the oxygen-to-carbon ratio (O/C) for individual as- of SO2 concentration) (Surratt et al., 2007, 2008). All de- signed atomic formulas in form of the Van Krevelen (VK) tected ion species with enabled formula assignments in the diagram (e.g. Lin et al., 2012a; Kourtchev et al., 2013). Fig- present samples are listed in Table S3. In general, CHN and ure 2b indicates a representative VK diagram of CHO and CHS compounds are not ionised well in negative ESI mode, CHON compounds derived from HNWX-1 sample. It can which could be a reason why these species were not the most be clearly seen from Fig. 2b that the majority of CHO and prevalent compounds in this study. CHON molecules are located in the region of O/C ≤ 1.0 It should be also noted that the negative ionisation mode and H/C ≤ 2.0. In VK diagram, molecules with H/C ≤ selectively targets to detect those molecules containing po- 1.0 and O/C≤0.5 are typical for aromatic species, while lar functional groups (e.g. –OH and –COOH) that could be molecules with H/C ≥ 1.5 and O/C ≤ 0.5 would be asso- readily deprotonated. There are number of compounds that ciated with typical aliphatic compounds (Mazzoleni et al., are not easily deprotonated and might show up preferen- 2012; Kourtchev et al., 2013). The average DBE showed rel- tially in positive ionisation mode (e.g. amines). Furthermore, atively high values of 5.5 for CHO compounds and 6.1 for the formula numbers detected in the HRMS potentially con- CHON compounds (Table S2), suggesting that unsaturated tain multiple structural isomers; therefore, the actual num- organic species were abundant in the present samples, and ber of water-soluble organic species is expected to be un- their presence could partially account for the strong light- derestimated. The additional LC/ESI-HRMS analysis oper- absorbing feature in the near-UV region as observed in our ated in negative mode confirmed a substantial number of ion previous study (Cai et al., 2018). masses (e.g. assigned CHO and CHON compounds) con- Throughout the extract samples, the average H/C and taining more than one structural isomer, which could be ob- O/C values ranged from 1.26 ± 0.38 to 1.31 ± 0.40 and from served at different retention times (RTs) in chromatograms. 0.34 ± 0.24 to 0.42 ± 0.29 for CHO compounds and from Two representative groups of extracted chromatograms for 1.19±0.32 to 1.23±0.35 and from 0.28±0.17 to 0.29±0.15 CHO ([C7 H5 On ]− , (n = 2–4)) and CHON ([C7 H5 On N]− , for CHON compounds (Table S2), respectively. Although (n = 1–3)) compounds are shown in Figs. S3 and S4, re- the ESI analysis was performed in the negative ionisation spectively, where increasing the O or N atom number in mode, the measured O/C exhibits rather low values, which a molecule might lead to more isomer peaks. However, it fall in the range of O/C ratios typical for biomass burning or- should be noted that these LC-separated peaks might also in- ganic aerosol derived from positive ionisation mode (Aiken clude other unidentified compounds that were outside of the et al., 2008; Kourtchev et al., 2016). Due to fresh emission elemental assignment considered in this study. Additionally, and a smaller ageing effect, the present O/C was obviously low mass loading and potential decomposition under the ion- lower than the O/C of long-range transport biomass burning isation can also limit the detection of some high molecular- aerosols (Zhang et al., 2018). weight species. https://doi.org/10.5194/acp-20-6115-2020 Atmos. Chem. Phys., 20, 6115–6128, 2020
6120                                              J. Cai et al.: Molecular composition and photochemical evolution of WSOC

                                                                      guaiacol, respectively, and their comparison with WSBA
                                                                      samples will be discussed in Sect. 3.3.

                                                                      3.2   Mass spectral characteristics of the products from
                                                                            photooxidation of phenolic compounds in the
                                                                            aqueous phase

                                                                      Phenol and guaiacol were chosen as two representative
                                                                      model compounds derived from biomass combustion. Two
                                                                      high-resolution mass spectra of aqueous phenol and guaia-
                                                                      col exposed to OH radicals for 4 h are shown in Fig. S6,
                                                                      where 435 Cx Hy Oz molecular formulas (m/z 90–500) were
                                                                      assigned for product ions of phenol (with C3 –C24 ) and 624
                                                                      Cx Hy Oz formulas (m/z 90–600) were assigned for prod-
                                                                      uct ions of guaiacol (with C3 –C27 ). The average H/C and
                                                                      O/C values were 0.79 ± 0.28 and 0.52 ± 0.23 for phenol,
Figure 3. The distribution of carbon oxidation state (OSC ) for       and 0.88 ± 0.24 and 0.59 ± 0.24 for guaiacol, respectively.
CHO molecules in HBDM-1 and laboratory samples produced               Clearly, the photochemical processing induced by OH oxi-
from phenol and guaiacol photooxidation in the presence of H2 O2      dation resulted in an increase in the average O/C of product
(i.e. phenol + H2 O2 and guaiacol + H2 O2 ). The locations of ox-     molecules relative to their precursors (O/C = 0.17 for phe-
alic acid (identified in HBDM-1 and laboratory samples), levoglu-     nol and O/C = 0.29 for guaiacol).
cosan (identified in HBDM-1), phenol dimer (identified in phe-           The formation mechanisms of series of oxygenated prod-
nol + H2 O2 ), and guaiacol dimer (identified in guaiacol + H2 O2 )   ucts, e.g. phenolic oligomers, hydroxylated phenolic species,
are shown.                                                            and ring-opening and highly oxygenated compounds, are
                                                                      proposed in the literature (e.g. Sun et al., 2010; Chang and
                                                                      Thompson, 2010; Yu et al., 2014). The OH-initiated reactions
   The carbon oxidation state (OSC ) was observed to in-
                                                                      would result in enhanced hydroxylation of the aromatic ring
crease with oxidation for atmospheric organic aerosol and
                                                                      as well as in increased yields of carboxylic acids and toxic di-
was linked strongly to aerosol volatility (Kroll et al., 2011).
                                                                      carbonyl compounds (Sun et al., 2010; Yu et al., 2014; Prasse
OSC for each molecular formula can be calculated using the
                                                                      et al., 2018). For example, some highly oxygenated C2 –C5
following equation:
                                                                      aliphatic compounds (e.g. C2 H2 O4 , C3 H4 O4 , C4 H6 O4 , and
          X    ni                                                     C5 H6 O5 ) corresponding to carboxylic acids (Yu et al., 2014)
OSC = −     OSi ,                                              (1)
               nC                                                     were clearly observed in the mass spectra of present pho-
          i
                                                                      tochemical products. The occurrence of these oxygenated
where OSi is the oxidation state associated with the non-             products not only directly increased the degree of oxygena-
carbon element i and ni /nC is the molar ratio of element i           tion in the bulk solution composition but also contributed to
to carbon within the molecule (Kroll et al., 2011; Kourtchev          the variation in solution acidity. After the 4 h photochemical
et al., 2013).                                                        process, the pH values of the irradiated solution were signif-
   Considering that nitrogen and sulfur atoms can present             icantly lower than the pH values of the solution prior to irra-
multiple oxidation states, the OSC was calculated and anal-           diation (t test, p < 0.05), and the calculated acidities ([H+ ])
ysed only for CHO compounds in this study. A similar pat-             of the bulk solution increased by (2.96 ± 0.15) × 10−5 M and
tern of OSC values versus the number of carbon atoms (nC )            (4.26±0.16)×10−5 M for phenol and guaiacol, respectively.
was observed for CHO compounds detected in the present                   The oligomerisation induced by photochemical trans-
WSBA samples (Figs. 3 and S5). From Figs. 3 and S5, it can            formation of phenolic substances is an important forma-
be seen that OSC of each sample ranges mainly from −1.5               tion pathway for low-volatility, light-absorbing compounds
to +1 with the average ranging from −0.6 to −0.4. Consis-             (Smith et al., 2016). Here, phenolic dimmers (i.e. C12 H10 O2
tent with previous studies (Kroll et al., 2011; Kourtchev et al.,     for phenol dimer and C14 H14 O4 for guaiacol dimer) and
2016), the majority of molecules with OSC < 0 (low oxidised           higher oligomers (e.g. C18 H14 O3 and C24 H18 O4 for phenol
organics) and carbon atoms lower than 20 are suggested to be          trimer and tetramer, C21 H20 O6 for guaiacol trimer), as well
associated with the primary organic aerosols emitted from             as their hydroxylated species were observed. The formation
biomass burning. A minor fraction of molecular formulas               mechanism can be ascribed to C–O or C–C coupling of phe-
with OSC ≥ 0 values might be associated with semivolatile             noxy radicals that were formed via H abstraction of the phe-
and low-volatility oxidised organic aerosols (Kroll et al.,           nols or OH addition to the aromatic ring (Net et al., 2009; Sun
2011). Figure 3 also shows the plot of OSC versus nC for              et al., 2010). The reaction at the para position or para–para
products obtained from the photooxidation of phenol and               coupling was more likely to occur due to a higher probability

Atmos. Chem. Phys., 20, 6115–6128, 2020                                                 https://doi.org/10.5194/acp-20-6115-2020
J. Cai et al.: Molecular composition and photochemical evolution of WSOC 6121
of free electrons to occur in this position (Lavi et al., 2017)
or a weaker steric hindrance in the para position.
3.3 Comparison of the photochemical products of
phenolic compounds and the CHO composition in
WSOC extracts from WSBA samples
Compared to the CHO compounds detected in WSOC ex-
tracts, the photochemical products of the two phenols under
study showed a higher O/C and a lower H/C value. The av-
erage OSC of photochemical products from phenol (OSC =
−0.7) and guaiacol (OSC = −0.6) after a 4 h photooxida-
tion rose to +0.2 and +0.3, respectively, showing distinctly a
higher degree of oxidation than the present WSBA samples.
In Fig. 3, more species with OSC < 0 (especially OSC <
−0.5) are presented in the field sample (HBDM-1), while
the species with OSC ≥ 0 are prevalent in photochemical
products of phenol and guaiacol. The single-precursor sys-
tems in laboratory did not completely reflect the CHO com-
position features in water-soluble extracts from real straw-
burning samples that contained a myriad of precursors and
unknown substances from atmospheric background, soil, and
other sources. Considering that a large number of phenols
and methoxyphenols exist in the straw-burning smokes and
their potential to undergo photochemical ageing, the nature
of emitted primary organic aerosols is reasonably more com-
plicated than the nature of simulated products derived from
single-precursor systems.
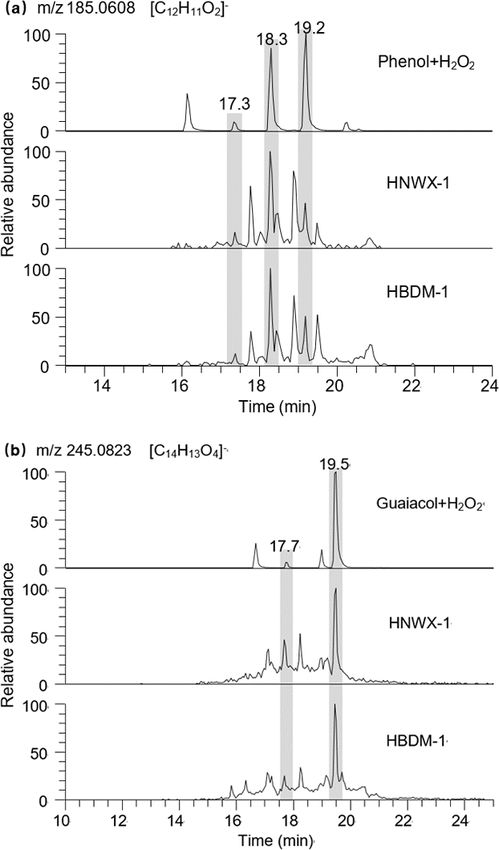
The extracted LC chromatograms of m/z 185.0608 and
245.0823 are shown in Fig. 4, respectively, where both ions
involve dimers of phenol and guaiacol with several structures
and/or other isomers. The presence of guaiacol dimer and
syringol dimer was previously observed in aerosol samples
largely affected by wood combustion. Based on the aerosol
Figure 4. Extracted LC chromatograms of (a) m/z 185.0608 and
mass spectrometer (AMS) analysis, these two dimers were
(b) m/z 245.0823 in photochemical samples of phenols, HNWX-1,
suggested as markers of biomass burning aerosols (Sun et al., and HBDM-1.
2010; Yu et al., 2014). In the composition of present biomass
burning aerosols, the phenolic dimers (m/z 185.0608 and
245.0823) were also observed in the present mass spectra, Typical hydroxylated species, such as C2 H2 O4 , C6 H6 O2 ,
but the extracted LC chromatograms shown in Fig. 4 indicate C7 H6 O3 , and C7 H8 O3 , were also found in the samples from
that these ions contain multiple RT peaks. The same peaks photooxidation of both phenols and the WSBA samples.
with RT 18.3 and 19.2 min which are assumed to be the phe- The comparison of the photochemical products from phe-
nol dimers were observed during the photochemical transfor- nols and the WSBA samples revealed their significant dif-
mation of phenol (Fig. 4a) and in the WSBA samples. Mean- ference, pointing to the importance of studying real aerosol
while, the present particle extracts may also involve guaiacol samples against the laboratory model compounds. However,
dimer, since its m/z 245.0823 has two LC peaks emerging at evaluating the model compounds as a proxy of real aerosol
RT 17.7 and 19.5 min (Fig. 4b), the same as the peaks iden- samples is always helpful as a reference. To this end, it is
tified during the photochemical transformation of guaiacol. worth noting that potentially other phenols and methoxyphe-
Considering that a substantial amount of moisture in the plant nols (e.g. acetosyringone, vanillin) that dissolve into cloud,
body (Bi et al., 2009) was discharged during the process of fog droplets, or aerosol liquid water can be photochemically
straw combustion, the occurrence of phenolic dimers might transformed and can contribute to SOA formation (Vione et
indicate that the aqueous-phase reactions played an impor- al., 2019; Zhou et al., 2019).
tant role in the formation and evolution of emitted aerosol
organic composition.
https://doi.org/10.5194/acp-20-6115-2020 Atmos. Chem. Phys., 20, 6115–6128, 20206122 J. Cai et al.: Molecular composition and photochemical evolution of WSOC
3.4 Photolysis of WSOC extracts from WSBA samples On the other hand, the solution acidity ([H+ ]) of the par-
ticle extracts increase after the 12 h photolysis, similar to
Although the direct photolysis was performed on present the observation on the photooxidation of phenols (Sect. 3.2)
WSOC extracts from WSBA samples in the presence of sim- that resulted in the formation of oxygenated species. The
ulated sunlight irradiation without adding any oxidants, the solution acidity ([H+ ]) normalised by WSOC concentration
photooxidation process still occurred since the particle ex- ([OCws ]) was increased with a variation in 1[H+ ]/[OCws ] =
tracts were very likely to include various oxidants, e.g. sin- (3.8 ± 0.8) × 10−7 mol mg C−1 , suggesting the formation of
glet molecular oxygen (1 O2 ), peroxides, hydroxyl radical new acidic substances.
(OH), or an excited triplet state of organics produced under The photochemical processing led to an increased forma-
light excitation (Anastasio et al., 1997; Vione et al., 2006; tion of low MW compounds (e.g. C2 –C5 species), with a rel-
Net et al., 2009, 2010a; Bateman et al., 2011; Rossignol et atively high O/C. For example, the C2 compounds, includ-
al., 2014; Smith et al., 2014; Gómez Alvarez et al., 2012). In ing [C2 H1 O3 ]− , [C2 H3 O3 ]− , [C2 H3 O2 ]− , and [C2 H1 O4 ]−
particular, the excited triplet state of aromatic carbonyls (e.g. (Fig. S8), which may correspond to glyoxylic acid, glycolic
3, 4-dimethoxybenzaldehyde) (Net et al., 2010b) was found acid, acetic acid, and oxalic acid, respectively, were likely to
to be more efficient than OH radicals to oxidise phenols and be formed via the oxidation pathway of several water-soluble
produce hydroxylated species (Smith et al., 2014; Yu et al., molecules with photochemical reactivity, e.g. glyoxal (Carl-
2014). This photosensitised reaction is likely to play an im- ton et al., 2007; Lim et al., 2010), methylglyoxal (Altieri et
portant role in the WSOC evolution, due to high quantities of al., 2008; Lim et al., 2010), pyruvic acid (e.g. Grgic et al.,
aromatic carbonyls present in the extracts of biomass burning 2010; Griffith et al., 2013; Reed Harris et al., 2014; Rapf et
aerosols. al., 2017; Eugene and Guzman, 2017; Mekic et al., 2018,
The variation in peak abundance at unique retention times 2019), and phenols (Sun et al., 2010). The presence of these
in the chromatogram could reflect the extent of the evolu- highly oxygenated compounds that possibly contain acidic
tion of WSOC molecules with accurate molecular weights, groups (e.g. –COOH and –OH) undoubtedly contributed to
although no available standards were utilised for absolute the increase in the solution acidity. Higher levels of other
quantification. The LC/ESI-HRMS monitors obvious change highly oxygenated species such as [C3 H5 O3 ]− , [C4 H7 O2 ]− ,
in the molecular features of partial CHO species, i.e. pho- [C5 H5 O5 ]− , and [C5 H7 O5 ]− were also observed (Fig. S9).
todegradation of low oxygenated compounds and formation To identify the impact of photolysis on the evolution of
of highly oxygenated compounds. Table 1 lists the CHO specific WSOC, the ions of [C7 H7 On ]− in the HBDM-1 sam-
compounds for which the LC peak intensities significantly ple with significant variation were chosen as representative
increased and decreased after the 12 h photolysis. cases for description. The relative intensity of [C7 H7 O2 ]−
and [C7 H7 O3 ]− decreased dramatically, while the intensi-
3.4.1 Photodegradation of low oxygenated compounds ties of [C7 H7 O4 ]− , [C7 H7 O5 ]− , and [C7 H7 O6 ]− increased
and formation of highly oxygenated compounds with the irradiation time (Fig. 5 shows only the variation in
[C7 H7 O2 ]− and [C7 H7 O4 ]− as an example). It seems rea-
As shown in Table 1, ion masses assigned to high unsat-
sonable that the possible hydroxylation of [C7 H7 O2 ]− and
urated and low oxygenated species (O/C < 0.5) are prone
[C7 H7 O3 ]− might contribute to the formation of [C7 H7 O5 ]−
to photodegradation, especially C7 –C9 compounds (possi-
and [C7 H7 O6 ]− . Although we could not verify this hypoth-
ble aromatic species), the intensity of which decreased by
esis, the oxidised species formed undoubtedly have a high
nearly 1 order of magnitude. For example, for m/z 123.0450
O/C, which highlights the possibility of this reaction path-
([C7 H7 O2 ]− ), as shown in Fig. 5a, the peaks at RT 16.2 and
way.
16.7 min in the LC chromatogram reduced in area by 95 %
after the 12 h irradiation. Using a standard it was verified that
3.4.2 Presentation of photochemically stable organic
both peaks did not belong to guaiacol (peak at RT 17.3 min),
species
but they were also found within the products of guaiacol pho-
tooxidation, suggesting that they might be isomers of guaia-
Some of the detected organic species seemed to exhibit a
col or aromatic dihydric alcohol.
good photochemical stability, as their relative intensities only
The phenolic dimers (C12 H10 O2 and C14 H14 O4 ) as de-
slightly decreased (< 10 %) after 12 h light irradiation. The
scribed above also exhibited a decreasing tendency, with an
m/z 161.0454 ([C6 H9 O5 ]− ) presented two prominent peaks
almost complete disappearance after 12 h direct photolysis.
at RT 1.9 and 2.4 min (Fig. S10). The peak at RT 2.4 min
Other species with relatively high molecular weight (MW)
was further confirmed with a standard compound to be lev-
(≥ 200 Da) were also observed to be decomposed, including
oglucosan, a typical tracer of biomass burning aerosols with
m/z 251.0564 ([C12 H11 O6 ]− ), 313.0724 ([C17 H13 O6 ]− ),
a high photochemical stability in atmospheric aerosols (Hu
and 329.0674 ([C17 H13 O7 ]− ) (Fig. S7), although their initial
et al., 2013). The relatively good photochemical stability
abundance was not very high.
was also observed for some C6 homologue compounds,
such as [C6 H7 O6 ]− , [C6 H9 O6 ]− , and [C6 H11 O6 ]− . Some
Atmos. Chem. Phys., 20, 6115–6128, 2020 https://doi.org/10.5194/acp-20-6115-2020J. Cai et al.: Molecular composition and photochemical evolution of WSOC 6123
Table 1. m/z with significant changes upon 12 h photolysis analysed by LC/ESI-HRMS.
Precursor (LC peak intensity decreases by > 50 %) Product (LC peak intensity increases by > 50 %)
Retention time, Measured m/z Molecular Retention time, Measured m/z Molecular
minutes formula minutes formula
16.2, 16.7 123.04497 C7 H8 O2 1.9 59.01362 C 2 H4 O2
13.9, 14.5 129.05555 C6 H10 O3 1.8 72.99291 C 2 H2 O3
14.6 131.07121 C6 H12 O3 2.1 73.02928 C 3 H6 O2
14.6 133.02934 C8 H6 O2 1.8 75.00856 C 2 H4 O3
15.9 135.04498 C8 H8 O2 2.4 85.02930 C 4 H6 O2
13.7 137.02426 C7 H6 O3 1.9, 4.4 87.04496 C 4 H8 O2
17.7 137.06063 C8 H10 O2 1.9 88.98785 C 2 H2 O4
15.8 147.04504 C9 H8 O2 1.9 89.02427 C 3 H6 O3
17.2 149.06062 C9 H10 O2 2.2 99.00857 C 4 H4 O3
19.0 151.07634 C9 H12 O2 2.5 129.01917 C 5 H6 O4
16.8 161.06068 C10 H10 O2 2.0 145.01407 C 5 H6 O5
16.2 165.05559 C9 H10 O3 1.9 147.02971 C 5 H8 O5
14.9 167.07129 C9 H12 O3 14.9 155.03482 C 7 H8 O4
15.1 181.05048 C9 H10 O4 15.1 169.01411 C 7 H6 O5
17.3 191.03498 C10 H8 O4 16.4 183.02980 C 8 H8 O5
16.2 195.06622 C10 H12 O4
18.6 207.06635 C11 H12 O4
18.6 329.06742 C17 H14 O7
Figure 5. Extracted LC chromatograms from HBDM-1 of (a) [C7 H7 O2 ]− and (b) [C7 H7 O4 ]− at different photolytic stages of 0, 4, and
12 h.
other oxygenated species, such as [C3 H3 O3 ]− , [C4 H5 O4 ]− , ([C7 H6 ON]− , RT 12.2 min). Some compounds seem pho-
[C3 H3 O4 ]− , and [C4 H5 O5 ]− , remained relatively stable as tochemically very stable as the variation in their peak
well. intensities was less than 10 % upon light irradiation of
Regarding the CHON compounds, only a small varia- the samples, e.g. m/z 118.0297 ([C7 H4 ON]− , RT 16.6
tion in the chromatogram peaks was observed for most and 17.1 min), 146.0246 ([C8 H4 O2 N]− , RT 14.4 min), and
of the detected species. In particular, several species 190.0510 ([C10 H8 O3 N]− , RT 17.8 min). However, the in-
with a low O/C decreased by less than 30 %, e.g. tensities of the ion masses with a relatively higher de-
m/z 94.0297 ([C5 H4 ON]− , RT 7.1 min) and 120.0453 gree of oxygenation were found to increase substantially
https://doi.org/10.5194/acp-20-6115-2020 Atmos. Chem. Phys., 20, 6115–6128, 20206124 J. Cai et al.: Molecular composition and photochemical evolution of WSOC
(> 50 %), e.g. m/z 162.0195 ([C8 H4 O3 N]− , RT 17.2 min), ion abundance (S/N). Since the photolysis induced changes
198.0408 ([C8 H8 O5 N]− , RT 18.0 min), and 242.1763 in abundance for most of the CHO compounds, we also cal-
([C13 H24 O3 N]− , RT 17.9 min). The photochemical stability culated the intensity (S/N)-weighted average O/C (O/Cw )
of some compounds may be ascribed to their low concentra- and H/C (H/Cw ) (Bateman et al., 2011; Romonosky et al.,
tions, or the light-shielding effect from other light-absorbing 2015) with values ranging from 0.45 ± 0.03 to 0.53 ± 0.06
species. and from 1.32 ± 0.09 to 1.40 ± 0.11, respectively. After the
Another intriguing finding was that different structural 12 h photolysis, both average H/C and H/Cw values slightly
isomers with the same molecular mass might have ex- increased, compared to the samples prior to irradiation; how-
hibited different fates upon prolonged light irradiation ever, both average O/C and O/Cw values have increased
of the samples. For example, the intensity of the peak at more distinctly, indicating an elevation in oxidation degree of
m/z 165.0405 ([C5 H9 O6 ]− ) decreased when it was eluted bulk extract composition. This phenomenon could be partly
at 4.9 min, but increased at RT 1.8 min, with the irradiation reflected in the LC-HRMS observation, i.e. the formation of
time (Fig. S11). A simultaneous degradation and formation highly oxygenated species and the consumption of low oxy-
among isomers of some CHON ion masses upon prolonged genated compounds. In our previous study, the UV–vis mea-
light irradiation was also observed, as was the case for surements revealed that the 12 h photochemical evolution
the CHO compounds. For example, the m/z 108.0453 leads to a modification of absorptive properties for WSBA
assigned to [C6 H6 ON]− , might include hydroxy and extracts (e.g. photo-bleaching at wavelengths below 380 nm
amino groups on the phenyl ring to present three possible and photo-enhancement above 380 nm) (Cai et al., 2018),
isomers (Fig. S12). During photolytic processing, the which might be partially linked to the present findings about
intensity of the peak at RT 3.2 min increased dramatically, molecular functionalisation, e.g. hydroxylation facilitating a
while there was a clear decreasing tendency of the peak red shift for light-absorbing wavelengths.
intensity at RT 5.5 and 12.5 min, which was suggestive
of possible isomerisation among these isomers. Other
ion masses that exhibited possible isomerisation included 4 Conclusions
m/z 122.0610 ([C7 H8 ON]− ), 132.0454 ([C8 H6 ON]− ),
134.0245 ([C7 H4 O2 N]− ), 136.0403 ([C7 H6 O2 N]− ), This study was focused on the effect of direct photol-
138.0559 ([C7 H8 O2 N]− ), 144.0453 ([C9 H6 ON]− ), and ysis on the molecular composition of actual WSOC ex-
152.0352 ([C7 H6 O3 N]− ). tracted from field straw-burning aerosol. The phenol dimer
(m/z 185.0608) and guaiacol dimer (m/z 245.0823), or their
3.4.3 Comparison of time-profile mass spectra of CHO isomers generated from laboratory aqueous-phase photoox-
composition in WSOC extracts from WSBA idation of phenol and guaiacol, were also observed in the
samples present field WSBA samples, suggesting that the aqueous-
phase reaction might contribute to the formation of emit-
Since the LC method just separated a fraction of polar com- ted biomass burning aerosols. The laboratory observation on
pounds, we tentatively utilised the change in HRMS to gain the aqueous photochemistry of phenols indicated that those
more comprehensive information about the WSOC evolu- phenolic compounds in real biomass burning aerosols would
tion. We compared the time-profile (0, 4, and 12 h) mass likely have the potential to experience a similar evolution
spectra with each other, based on the assumption of the to form various oxygenated compounds under the relevant
same interference from inorganic species, and the good re- atmospheric water conditions. The direct photolysis of the
producibility and stability for Orbitrap MS operated under molecular composition of WSOC extracts from WSBA sam-
the same instrumental parameters (the RSD of TIC inten- ples was performed to gain more insight into the evolu-
sity within 5 %). It is well known that ESI mass spectral tion of aerosol composition. Because the extract composition
abundances are influenced by the solution composition, con- was very complex, the techniques (ESI-HRMS and LC/ESI-
centration of analytes, and instrumental factors (Bateman et HRMS) used in this study, although advanced, still had lim-
al., 2011); hence, it is quite challenging to directly quan- itations in monitoring the modification of molecular compo-
tify the absolute concentration levels of the complex mix- sition, especially for determining the potential formation of
tures. Despite this, the photochemical degradation of WSOC compounds present at low concentrations or compounds that
compounds and corresponding formation of organic com- were poorly ionised. However, a series of polar molecules
pounds can be well described by the variation in signal in- were identified that changed their molecular composition
tensity from mass spectrometry. The average O/C and H/C via photochemical ageing. In particular, the degradation of
for CHO compounds ranged from 0.38 ± 0.02 to 0.44 ± 0.02 low oxygenated compounds with strong photochemical re-
and 1.24 ± 0.03 to 1.26 ± 0.01, respectively, as the irradia- activity and the formation of highly oxygenated compounds
tion time extended from 0 to 12 h. The comparison of these might directly result in an increasing O/C in WSOC compo-
time-profile mass spectra indicates that the 12 h photolysis sition, which was likely linked to the modification of light-
resulted in a significant reduction in 28 ± 11 % in the total absorbing characteristics for extracts in previous study. This
Atmos. Chem. Phys., 20, 6115–6128, 2020 https://doi.org/10.5194/acp-20-6115-2020J. Cai et al.: Molecular composition and photochemical evolution of WSOC 6125
finding indicates that the water-soluble organic fraction of Northway, M., Ziemann, P. J., Canagaratna, M. R., Onasch,
field combustion-derived aerosols has the potential to form T. B., Rami Alfarra, M., Prevot, A. S. H., Dommen, J., Du-
more oxidised organic matter, which might contribute to the plissy, J., Metzger, A., Baltensperger, U., and Jimenez, J. L.:
highly oxygenated nature of atmospheric organic aerosols. O/C and OM/OC Ratios of primary, secondary, and ambi-
Further studies focused on the photochemical evolution of ent organic aerosols with high-resolution time-of-flight aerosol
mass spectrometry, Environ. Sci. Technol., 42, 4478–4485,
WSOC composition will be performed in the future, in-
https://doi.org/10.1021/es703009q, 2008.
cluding enlarging measurements on compound species (e.g. Altieri, K. E., Seitzinger, S. P., Carlton, A. G., Turpin, B. J., Klein,
applying positive ESI-HRMS), identifying biomarkers, and G. C., and Marshall, A. G.: Oligomers formed through in-cloud
evaluating their role in photochemical processes. methylglyoxal reactions: Chemical composition, properties, and
mechanisms investigated by ultra-high resolution FT-ICR mass
spectrometry, Atmos. Environ., 42, 1476–1490, 2008.
Data availability. The data used in this study are available from the Altieri, K. E., Turpin, B. J., and Seitzinger, S. P.: Oligomers,
corresponding author on request. organosulfates, and nitrooxy organosulfates in rainwater iden-
tified by ultra-high resolution electrospray ionization FT-
ICR mass spectrometry, Atmos. Chem. Phys., 9, 2533–2542,
Supplement. The supplement related to this article is available on- https://doi.org/10.5194/acp-9-2533-2009, 2009a.
line at: https://doi.org/10.5194/acp-20-6115-2020-supplement. Altieri, K. E., Turpin, B. J., and Seitzinger, S. P.: Compo-
sition of Dissolved Organic Nitrogen in Continental Pre-
cipitation Investigated by Ultra-High Resolution FT-ICR
Author contributions. JC and ZY designed the experiments, and JC Mass Spectrometry, Environ. Sci. Technol., 43, 6950–6955,
and XZ carried them out. GZ provided the straw-burning aerosol https://doi.org/10.1021/es9007849, 2009b.
samples; ZY and SG helped to perform the analysis of light irradia- Anastasio, C., Faust, B. C., and Rao, C. J.: Aromatic carbonyl
tion and to edit the paper. GS, XW, and PP provided some technical compounds as aqueous-phase photochemical sources of hy-
consultations about organic chemistry. JC prepared the paper with drogen peroxide in acidic sulfate aerosols, fogs, and clouds.
contributions from all co-authors. 1. Non-phenolic methoxybenzaldehydes and methoxyacetophe-
nones with reductants (phenols), Environ. Sci. Technol., 31, 218–
232, 1997.
Bateman, A. P., Nizkorodov, S. A., Laskin, J., and Laskin, A.:
Competing interests. The authors declare that they have no conflict
Photolytic processing of secondary organic aerosols dissolved
of interest.
in cloud droplets, Phys. Chem. Chem. Phys., 13, 12199–12212,
https://doi.org/10.1039/c1cp20526a, 2011.
Bi, Y., Gao, C., Wang, Y., and Li, B.: Estimation of straw resources
Acknowledgements. The authors acknowledge support provided by in China, Transactions of the Chinese Society of Agricultural En-
the State Key Laboratory of Organic Geochemistry in Guangzhou gineering, 25, 211–217, 2009.
Institute of Geochemistry, the Chinese Academy of Sciences (GIG- Boone, E. J., Laskin, A., Laskin, J., Wirth, C., Shepson, P. B.,
CAS), and the Guangdong Key Laboratory of Environment and Re- Stirm, B. H., and Pratt, K. A.: Aqueous Processing of At-
sources. This is contribution no. IS-2560 from GIGCAS. mospheric Organic Particles in Cloud Water Collected via
Aircraft Sampling, Environ. Sci. Technol., 49, 8523–8530,
https://doi.org/10.1021/acs.est.5b01639, 2015.
Financial support. This research has been financially supported by Cai, J., Zhi, G., Yu, Z., Nie, P., Gligorovski, S., Zhang, Y., Zhu, L.,
the National Key Technology Research and Development Program Guo, X., Li, P., He, T., He, Y., Sun, J., and Zhang, Y.: Spec-
of the Ministry of Science and Technology of China (grant no. tral changes induced by pH variation of aqueous extracts de-
2014BAC22B04), and the National Natural Science Foundations rived from biomass burning aerosols: Under dark and in pres-
of China (grant nos. 41225013, 41530641, 41373131, 41773131, ence of simulated sunlight irradiation, Atmos. Environ., 185, 1–
and 41977187). We are also supported by the Guangdong Founda- 6, https://doi.org/10.1016/j.atmosenv.2018.04.037, 2018.
tion for the Program of Science and Technology Research (grant no. Cappiello, A., De Simoni, E., Fiorucci, C., Mangani, F., Palma, P.,
2017B030314057). Trufelli, H., Decesari, S., Facchini, M. C., and Fuzzi, S.: Molec-
ular characterization of the water-soluble organic compounds in
fogwater by ESIMS/MS, Environ. Sci. Technol., 37, 1229–1240,
Review statement. This paper was edited by Neil M. Donahue and https://doi.org/10.1021/es0259990, 2003.
reviewed by three anonymous referees. Carlton, A. G., Turpin, B. J., Altieri, K. E., Seitzinger, S., Reff, A.,
Lim, H.-J., and Ervens, B.: Atmospheric oxalic acid and SOA
production from glyoxal: Results of aqueous photooxidation ex-
periments, Atmos. Environ., 41, 7588–7602, 2007.
References Chang, J. L. and Thompson, J. E.: Characterization of colored prod-
ucts formed during irradiation of aqueous solutions containing
Aiken, A. C., Decarlo, P. F., Kroll, J. H., Worsnop, D. R., Alex H2 O2 and phenolic compounds, Atmos. Environ., 44, 541–551,
Huffman, J., Docherty, K. S., Ulbrich, I. M., Mohr, C., Kim- https://doi.org/10.1016/j.atmosenv.2009.10.042, 2010.
mel, J. R., Sueper, D., Sun, Y., Zhang, Q., Trimborn, A.,
https://doi.org/10.5194/acp-20-6115-2020 Atmos. Chem. Phys., 20, 6115–6128, 20206126 J. Cai et al.: Molecular composition and photochemical evolution of WSOC Collett, J. L., Hoag, K. J., Sherman, D. E., Bator, A., and Richards, oceans from the Arctic to Antarctic, Sci. Rep.-UK, 3, 3119, W. L.: Spatial and temporal variations in San Joaquin Valley fog https://doi.org/10.1038/srep03119, 2013. chemistry, Atmos. Environ., 33, 129–140, 1998. Kitanovski, Z., Čusak, A., Grgić, I., and Claeys, M.: Chemical char- Daumit, K. E., Carrasquillo, A. J., Hunter, J. F., and Kroll, J. H.: acterization of the main products formed through aqueous-phase Laboratory studies of the aqueous-phase oxidation of polyols: photonitration of guaiacol, Atmos. Meas. Tech., 7, 2457–2470, submicron particles vs. bulk aqueous solution, Atmos. Chem. https://doi.org/10.5194/amt-7-2457-2014, 2014. Phys., 14, 10773–10784, https://doi.org/10.5194/acp-14-10773- Kourtchev, I., Fuller, S., Aalto, J., Ruuskanen, T. M., McLeod, M. 2014, 2014. W., Maenhaut, W., Jones, R., Kulmala, M., and Kalberer, Duarte, R. M. B. O., Santos, E. B. H., Pio, C. A., and M.: Molecular Composition of Boreal Forest Aerosol Duarte, A. C.: Comparison of structural features of water- from Hyytiala, Finland, Using Ultrahigh Resolution Mass soluble organic matter from atmospheric aerosols with those Spectrometry, Environ. Sci. Technol., 47, 4069–4079, of aquatic humic substances, Atmos. Environ., 41, 8100–8113, https://doi.org/10.1021/es3051636, 2013. https://doi.org/10.1016/j.atmosenv.2007.06.034, 2007. Kourtchev, I., Godoi, R. H. M., Connors, S., Levine, J. G., Eugene, A. J. and Guzman, M. I.: Reactivity of Ketyl and Acetyl Archibald, A. T., Godoi, A. F. L., Paralovo, S. L., Barbosa, C. G. Radicals from Direct Solar Actinic Photolysis of Aqueous Pyru- G., Souza, R. A. F., Manzi, A. O., Seco, R., Sjostedt, S., Park, J.- vic Acid, J. Phys. Chem. A, 121, 2924–2935, 2017. H., Guenther, A., Kim, S., Smith, J., Martin, S. T., and Kalberer, Fahey, K. M., Pandis, S. N., Collett, J. L., and Herckes, P.: The in- M.: Molecular composition of organic aerosols in central Ama- fluence of size-dependent droplet composition on pollutant pro- zonia: an ultra-high-resolution mass spectrometry study, Atmos. cessing by fogs, Atmos. Environ., 39, 4561–4574, 2005. Chem. Phys., 16, 11899–11913, https://doi.org/10.5194/acp-16- Fine, P. M., Cass, G. R., and Simoneit, B. R. T.: Chemical char- 11899-2016, 2016. acterization of fine particle emissions from fireplace combustion Krivacsy, Z., Hoffer, A., Sarvari, Z., Temesi, D., Baltensperger, U., of woods grown in the northeastern United States, Environ. Sci. Nyeki, S., Weingartner, E., Kleefeld, S., and Jennings, S. G.: Technol., 35, 2665–2675, 2001. Role of organic and black carbon in the chemical composition of Fu, P. Q., Kawamura, K., Chen, J., Qin, M. Y., Ren, L. J., atmospheric aerosol at European background sites, Atmos. Env- Sun, Y. L., Wang, Z. F., Barrie, L. A., Tachibana, E., Ding, iron., 35, 6231–6244, 2001. A. J., and Yamashita, Y.: Fluorescent water-soluble organic Kroll, J. H., Donahue, N. M., Jimenez, J. L., Kessler, S. H., Cana- aerosols in the High Arctic atmosphere, Sci. Rep.-UK, 5, 9845, garatna, M. R., Wilson, K. R., Altieri, K. E., Mazzoleni, L. R., https://doi.org/10.1038/srep09845, 2015. Wozniak, A. S., Bluhm, H., Mysak, E. R., Smith, J. D., Kolb,C. Gilardoni, S., Massoli, P., Paglione, M., Giulianelli, L., Carbone, E., and Worsnop, D. R.: Carbon oxidation state as a metricfor C., Rinaldi, M., Decesari, S., Sandrini, S., Costabile, F., Gobbi, describing the chemistry of atmospheric organic aerosol, Nat. G. P., Pietrogrande, M. C., Visentin, M., Scotto, F., Fuzzi, S., Chem. Biol., 3, 133–139, 2011. and Facchini, M. C.: Direct observation of aqueous secondary Laskin, A., Smith, J. S., and Laskin, J.: Molecular Charac- organic aerosol from biomass-burning emissions, P. Natl. Acad. terization of Nitrogen-Containing Organic Compounds in Sci. USA, 113, 10013–10018, 2016. Biomass Burning Aerosols Using High-Resolution Mass Gómez Alvarez, E., Wortham, H., Strekowski, R., Zetzsch, C., and Spectrometry, Environ. Sci. Technol., 43, 3764–3771, Gligorovski, S.: Atmospheric photo-sensitized heterogeneous https://doi.org/10.1021/es803456n, 2009. and multiphase reactions: From outdoors to indoors, Environ. Lavi, A., Lin, P., Bhaduri, B., Carmieli, R., Laskin, A., and Rudich, Sci. Technol., 46, 1955–1963, 2012. Y.: Characterization of light-absorbing oligomers from reactions Graham, B., Mayol-Bracero, O. L., Guyon, P., Roberts, G. C., Dece- of phenolic compounds and Fe(III), Earth Space Chem., 1, 637– sari, S., Facchini, M. C., Artaxo, P., Maenhaut, W., Koll, P., and 646, 2017. Andreae, M. O.: Water-soluble organic compounds in biomass Lee, A. K. Y., Herckes, P., Leaitch, W. R., Macdonald, A. burning aerosols over Amazonia-1. Characterization by NMR M., and Abbatt, J. P. D.: Aqueous OH oxidation of ambi- and GC-MS, J. Geophys. Res.-Atmos., 107, LBA 14-1–LBA 14- ent organic aerosol and cloud water organics: Formation of 16, https://doi.org/10.1029/2001jd000336, 2002. highly oxidized products, Geophys. Res. Lett., 38, L11805, Grgic, I., Nieto-Gligorovski, L. I., Net, S., Temime-Roussel, B., https://doi.org/10.1029/2011GL047439, 2011. Gligorovski, S., and Wortham, H.: Light induced multiphase Li, J., Wang, X., Chen, J., Zhu, C., Li, W., Li, C., Liu, L., Xu, C., chemistry of gas-phase ozone on aqueous pyruvic and oxalic Wen, L., Xue, L., Wang, W., Ding, A., and Herrmann, H.: Chemi- acids, Phys. Chem. Chem. Phys., 12, 698–707, 2010. cal composition and droplet size distribution of cloud at the sum- Griffith, E. C., Carpenter, B. K., Shoemaker, R. K., mit of Mount Tai, China, Atmos. Chem. Phys., 17, 9885–9896, and Vaida, V.: Photochemistry of aqueous pyruvic https://doi.org/10.5194/acp-17-9885-2017, 2017. acid, P. Natl. Acad. Sci. USA, 110, 11714–11719, Lim, Y. B. and Turpin, B. J.: Laboratory evidence of organic per- https://doi.org/10.1073/pnas.1303206110, 2013. oxide and peroxyhemiacetal formation in the aqueous phase and Haynes, J. P., Miller, K. E., and Majestic, B. J.: Investigation into implications for aqueous OH, Atmos. Chem. Phys., 15, 12867– Photoinduced Auto-Oxidation of Polycyclic Aromatic Hydro- 12877, https://doi.org/10.5194/acp-15-12867-2015, 2015. carbons Resulting in Brown Carbon Production, Environ. Sci. Lim, Y. B., Tan, Y., Perri, M. J., Seitzinger, S. P., and Turpin, Technol., 53, 682–691, https://doi.org/10.1021/acs.est.8b05704, B. J.: Aqueous chemistry and its role in secondary organic 2019. aerosol (SOA) formation, Atmos. Chem. Phys., 10, 10521– Hu, Q., Xie, Z., Wang, X., Hui Kang, H., and Zhang, P.: Levoglu- 10539, https://doi.org/10.5194/acp-10-10521-2010, 2010. cosan indicates high levels of biomass burning aerosols over Atmos. Chem. Phys., 20, 6115–6128, 2020 https://doi.org/10.5194/acp-20-6115-2020
You can also read