Genomic scans for selective sweeps through haplotype homozygosity and allelic fixation in 14 indigenous sheep breeds from Middle East and South Asia
←
→
Page content transcription
If your browser does not render page correctly, please read the page content below
www.nature.com/scientificreports
OPEN Genomic scans for selective sweeps
through haplotype homozygosity
and allelic fixation in 14 indigenous
sheep breeds from Middle East
and South Asia
Sirous Eydivandi1,2*, Mahmoud Amiri Roudbar3, Mohammad Osman Karimi4 &
Goutam Sahana2
The performance and productivity of livestock have consistently improved by natural and artificial
selection over the centuries. Both these selections are expected to leave patterns on the genome
and lead to changes in allele frequencies, but natural selection has played the major role among
indigenous populations. Detecting selective sweeps in livestock may assist in understanding the
processes involved in domestication, genome evolution and discovery of genomic regions associated
with economically important traits. We investigated population genetic diversity and selection signals
in this study using SNP genotype data of 14 indigenous sheep breeds from Middle East and South
Asia, including six breeds from Iran, namely Iranian Balochi, Afshari, Moghani, Qezel, Zel, and Lori-
Bakhtiari, three breeds from Afghanistan, namely Afghan Balochi, Arabi, and Gadik, three breeds
from India, namely Indian Garole, Changthangi, and Deccani, and two breeds from Bangladesh,
namely Bangladeshi Garole and Bangladesh East. The SNP genotype data were generated by
the Illumina OvineSNP50 Genotyping BeadChip array. To detect genetic diversity and population
structure, we used principal component analysis (PCA), admixture, phylogenetic analyses, and Runs
of homozygosity. We applied four complementary statistical tests, FST (fixation index), xp-EHH
(cross-population extended haplotype homozygosity), Rsb (extended haplotype homozygosity
between-populations), and FLK (the extension of the Lewontin and Krakauer) to detect selective
sweeps. Our results not only confirm the previous studies but also provide a suite of novel candidate
genes involved in different traits in sheep. On average, FST, xp-EHH, Rsb, and FLK detected 128, 207,
222, and 252 genomic regions as candidates for selective sweeps, respectively. Furthermore, nine
overlapping candidate genes were detected by these four tests, especially TNIK, DOCK1, USH2A, and
TYW1B which associate with resistance to diseases and climate adaptation. Knowledge of candidate
genomic regions in sheep populations may facilitate the identification and potential exploitation of
the underlying genes in sheep breeding.
Genetic diversity in livestock is important for improving productivity and addressing future challenges, includ-
ing food security and mitigating climate c hange1. Sheep were probably first domesticated in the Fertile Crescent
region approximately 10,000 years a go2. Asia has about 40 percent of the world’s sheep breeds and diverse agro-
ecological conditions have led to the development of more than 80 native sheep breeds in different geographical
districts of Iran, Afghanistan, India, and Bangladesh3,4. Sheep play an important role in the livelihood of many
rural and nomadic families in these countries4. The number of sheep average from 2010 to 2018 were in India
64 million, Iran 42.7 million, Afghanistan 13.6 million, and Bangladesh 2 million.
1
Department of Animal Science, Behbahan Branch, Islamic Azad University, Behbahan,
Iran. 2Center for Quantitative Genetics and Genomics, Faculty of Technical Sciences, Aarhus University,
8830 Tjele, Denmark. 3Department of Animal Science, Safiabad-Dezful Agricultural and Natural Resources
Research and Education Center, Agricultural Research, Education and Extension Organization (AREEO), Dezful,
Iran. 4Department of Animal Science, Faculty of Agriculture, Herat University, Herat, Afghanistan. *email:
sirous.eidivandi@qgg.au.dk
Scientific Reports | (2021) 11:2834 | https://doi.org/10.1038/s41598-021-82625-2 1
Vol.:(0123456789)
www.nature.com/scientificreports/
Breed Acronym Geographic origin Category Sample size Data source Dominant color Tail status Product Climate adaptation
Afshari AFS Northwest of Iran IRa 37 HapMap Dark brown Fat-tailed Meat-wool Cold and dry climate
Moghani MOG Northwest of Iran IR 34 HapMap White Fat-tailed Meat-wool Cold and dry climate
Qezel QEZ Northwest of Iran IR 35 HapMap Red Fat-tailed Meat-wool Cold and dry climate
Zel ZEL North of Iran IR 44 Unpublished data White Thin-tailed Meat-milk Mild and forest
Mild and cold moun-
Lori-Bakhtiari LOR West of Iran IR 46 Unpublished data White Fat-tailed Meat
tainous
Iranian Balochi IBL Southeast of Iran AFb 87 Unpublished data White Fat-tailed Wool-meat Arid subtropical areas
Arabi ARB West of Afghanistan AF 14 Unpublished data Brown Fat-tailed Meat-milk Arid areas
Southwest of
Afghan Balochi BLO AF 15 Unpublished data White Fat-tailed Wool-meat Arid subtropical areas
Afghanistan
Mild and cold moun-
Gadik GDK North of Afghanistan AF 14 Unpublished data White Fat-tailed Wool-meat
tainous
Bangladeshi Garole BGA West of Bangladesh INc 24 HapMap Light brown Thin-tailed Meat Hot and humid
Bangladesh East BGE East of Bangladesh IN 24 HapMap Light brown Thin-tailed Meat Hot and humid
Indian Garole GAR Northeast of India IN 26 HapMap Light brown Thin-tailed Meat Hot and humid
Mild and cold the
Changthangi CHA Northwest of India IN 29 HapMap White Thin-tailed Meat-wool
mountainous
Deccani IDC South of India IN 24 HapMap Black Thin-tailed Meat Semi-arid
Table 1. Breed names and the corresponding code used throughout the manuscript, the country of origin,
sample size, and data source. a Contain Iranian sheep breeds exception Iranian Balouchi. b Contain Afghan
sheep breeds and Iranian Balouchi. c Contain Indian and Bengal sheep breeds.
Study of population structure gives information on anthropogenic activities and historical processes that have
influenced recent gene pools and the genetic relationships among breeds (Ju et al. 2019). Population structure
among breeds can be studied using principal component analysis (PCA), admixture and phylogenetic analyses.
A range of demographic forces and evolutionary trends affects linkage disequilibrium (LD) patterns on the
genome5. The LD patterns provide good historical information on the population demography.
Natural and artificial selections leave patterns on the genome that result in differences in allele frequencies
among populations6. If the selection pressure is high at the level of an individual locus, the frequency of the
selected variant increases. In addition, selection will change the diversity pattern around the selected variant
through genetic hitchhiking, known as a selective s weep7. As a result, different genetic variations and various
haplotype structures are fixed over time within separated subpopulations, leading to a wide range of farm animal
breeds and distinct genetic populations8. Selective sweeps detected in livestock breeds can add to new informa-
tion about their population history.
Several methods have been developed to scan genome-wide selective s weeps9. Most of the methods are based
on: (1) increases in derived allele frequency and decreases in genetic variation near a selective sweep (hitchhiking)
within a population, (2) haplotype length and structure measured by extended haplotype homozygosity (EHH) or
EHH-derived statistics, and (3) the differentiation of genetic populations measured by FST or related s tatistics10.
To capture any signal in the genome, depending on the number of populations, temporal context scale, and
type of selection signatures more than one method is often needed6. Therefore, we implemented four comple-
mentary statistical tests, F ST, FLK (the extension of the Lewontin and Krakauer), xp-EHH (cross-population
extended haplotype homozygosity), and Rsb (extended haplotype homozygosity between-populations). We
studied selection signature in 14 indigenous sheep breeds from Iran, Afghanistan, India and Bangladesh, the
four neighboring countries located in the Middle East and South Asia having more than 80 indigenous sheep
breeds adapted to diverse ecological conditions. The selection signatures can illuminate selection patterns at the
genome level of these indigenous sheep breeds, from adaptation to local environment and selection by breeders
to improve production.
Materials and methods
Populations and genotypic data. We employed 50 K SNP genotype data on 453 individuals from 14
indigenous sheep breeds located in Iran, Afghanistan, India, and Bangladesh. Unpublished genotype data from
three indigenous Iranian sheep breed, Iranian Balochi (IBL), Lori-Bakhtiari (LOR), Zel (ZEL) were used along
with publicly available genotype data on another three Iranian sheep breeds, namely Afshari (AFS), Moghani
(MOG), and Qezel (QEZ). We included data on three unpublished genotype data of Afghan sheep breeds, Arabi
(ARB), Afghan Balochi (BLO), and Gadik (GDK). From South Asia, we included three Indian sheep breeds,
Changthangi (CHA), Indian Garole (GAR), Deccani (IDC), and two Bengal sheep breeds, Bangladeshi Garole
(BGA) and Bangladesh East (BGE)11. Information on these 14 breeds is summarized in Table 1.
Genotype quality control. OvineSNP50 BeadChip (Illumina, San Diego, CA, USA) was used to gen-
otype animals. The SNP location information was taken from the Illumina Oar_v4 assembly, retrieved from
SNPChiMp v.312.
The genotype data from different breeds were merged using PLINK13. We excluded the SNPs located on
sex chromosomes and those with unknown chromosomal position. The quality control was performed using
Scientific Reports | (2021) 11:2834 | https://doi.org/10.1038/s41598-021-82625-2 2
Vol:.(1234567890)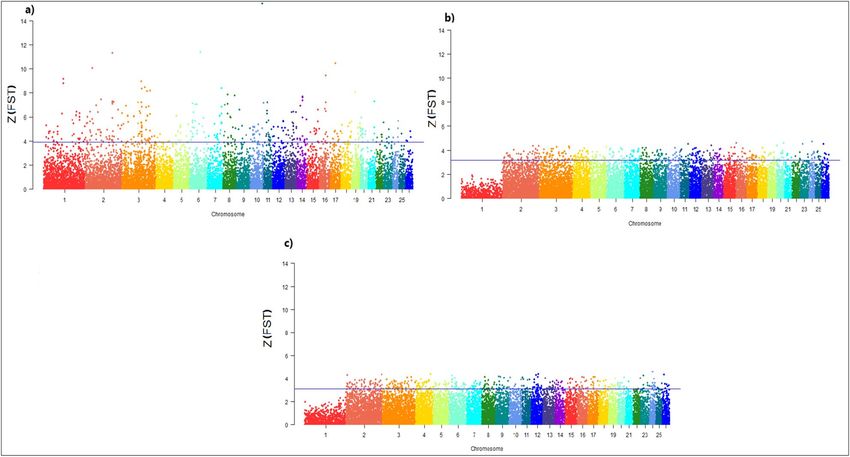
www.nature.com/scientificreports/
PLINK13. SNPs that were genotyped in less than 90% of the animals, had a minor allele frequency (MAF) lower
than 1%, or departed from Hardy–Weinberg proportions at a P-value < 10–3 were discarded. Furthermore, indi-
viduals with more than 10% missing genotypes were removed from the data set. After quality control, we used
Beagle V5.0 software to impute sporadic missing genotypes14. The fcGENE v1.7 software was used to convert
the PLINK formatted files to Beagle format and vice versa15.
Genetic diversity and population structure. Individual genetic distances for the 14 sheep breeds were
represented by a neighbor-joining tree and displayed using VCF-kit v0.1.616 and FigTree.v1.4.417.
We performed a PCA to investigate the population structure and to check whether samples for a breed came
from a homogeneous population. PCA was done for the 14 sheep breeds using the smartpca program, which is
part of EIGENSOFT 7.2.118.
Linkage disequilibrium (mean of r 2) among SNPs was estimated for the breeds using PopLDdecay v1.01
software, and a Perl script was applied to visualize the r esults19.
Admixture analysis. For admixture analysis, quality filtered genotype data were pruned using PLINK
based on LD. In a sliding window of 50 SNPs, LD pruning was carried out, moving the window in steps of 5
SNPs at a time, and removing all SNPs within each window exceeding the 1.7 variance inflation factor (VIF)
threshold (–indep 50 5 1.7). VIF is known as 1/(1 − r2), with r2 being the correlation of the squared inter-variant
allele count20.
We analyzed ancestry using ADMIXTURE v1.3.0 to infer breed origins and quantify the populations’
admixture21. For a priori defined ancestry component (K), individual ancestry proportions were calculated
with ADMIXTURE v1.3.0, which was an assumption of the number of ancestral p opulations20. Using 14-fold
cross-validation for K values ranging from 2 to 14, admixture analysis was performed. To identify the most likely
number of ancestral populations, the lowest 14-fold cross-validation error was applied. Finally, the admixture
graphs were visualized using the R package B ITE22.
Runs of homozygosity. Runs of homozygosity (ROHs) were studied for all 14 breeds. Using the R package
“detectRUNS”23, ROHs were calculated. The sliding window method was applied to calculate ROH s egments24.
Conditions used to detect segments of ROH were: sliding window size (windowSize = 15 SNPs), minimum num-
ber of homozygous SNPs in a run (minSNP) = 20, threshold of windows overlapping, homozygous (thresh-
old) = 0.05, minimum number of SNP per kbps (minDensity) = 1/103, maximum distance between two SNPs
(maxGap) = 106 bps, and the minimum length of a homozygous run (minLengthBps) = 250,000 bps. By default
settings defined in the detectRUNS package, the ROHs detected were divided into five categories. (0 to < 2 Mb, 2
to < 4 Mb, 4 to < 8 Mb, 8 to < 16 Mb and ≥ 16 Mb). For each of the ROH length categories, the mean ROH sum
per breed was determined by summing up all the ROHs per animal in that category and by averaging them per
breed. The individual genomic inbreeding coefficient (FROH) was also determined as follows:
LROH
FROH=
Lgenome
where LROH is the total length of all ROHs observed in an individual’s genome and Lgenome is the sum of the
length of the a utosomes23.
Selection sweep, gene annotation, and functional analysis. Neighbor-joining tree and PCA analy-
sis divided the sheep populations in three distinct categories, IR (contains AFS, MOG, QEZ, ZEL, LOR breeds),
IN (contains BGA, BGE, GAR, CHA, IDC breeds), and AF (contains IBL, ARB, BLO, GDK breeds) Table 1.
Therefore, we compared pairwise these three categories for selective sweeps analysis.
Selection sweep methods. We performed pairwise comparison for (a) IR vs. IN, (b) IR vs. AF, and (c) IN
vs. AF to identify genomic regions under increasing differentiation using Fixation index ( FST), FLK (the exten-
sion of the Lewontin and Krakauer), xp-EHH (cross-population extended haplotype homozygosity), and Rsb
(extended haplotype homozygosity between-populations).
The FST analysis is a widely used approach to identify genetic differentiations between populations compared
to the within-population polymorphic frequency25. We performed the FST to identify genomic regions under
increasing differentiation using VCFtools v0.1.1526. For each comparison, the mean of F ST value was computed
in all 39,348 SNPs. Z transformation of the mean of F ST values (Z(FST)) was performed using the “scale” com-
mand in R software.
The FLK test is an extension of the original Lewontin and Krakauer (LK) s tatistic27.
It calculates a population differentiation statistic, which includes a kinship matrix representing the relation-
ship between p opulations28. This test accounts for population structure and differences in the effective popula-
tion size by modeling the genetic divergence between populations as a result of drift and population d ivision29.
30
For FLK analyses, p-values were computed as explained in the hapFLK software documentation . For each
comparison, the negative log p-value was calculated using the hapFLK R s cript30, and the candidate genomic
regions under selection were plotted.
Extended haplotype homozygosity (EHH) detects selection signatures by comparing a high frequency and
extended homozygosity based haplotype with other haplotypes at the selected l ocus31. Complete selective sweeps
can be approached by using the cross-population EHH (xp-EHH) test, which compares each population regard-
ing corresponding haplotypes to the other populations. The xp-EHH test compares the integrated EHH profiles
Scientific Reports | (2021) 11:2834 | https://doi.org/10.1038/s41598-021-82625-2 3
Vol.:(0123456789)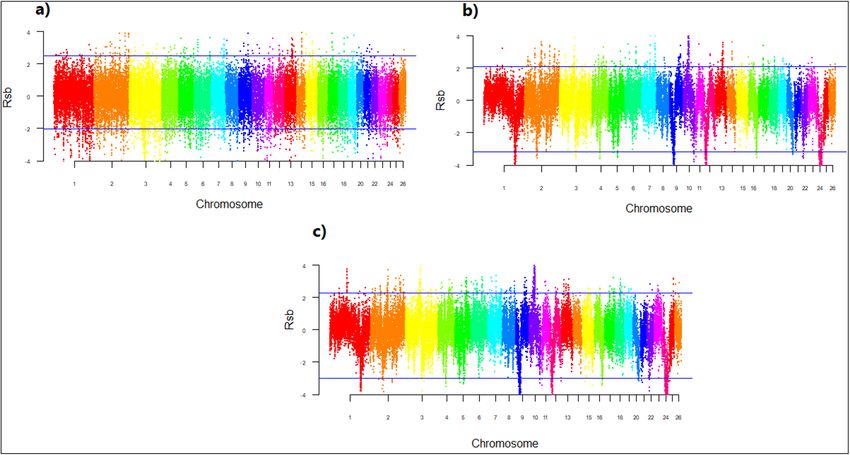
www.nature.com/scientificreports/
Figure 1. Neighbor-joining phylogenetic tree for 14 sheep breeds based on autosomal SNPs. For breed
abbreviations, see Table 1.
between two populations at the same SNP31. The xp-EHH test has a high power to detect selection signatures in
small sample sizes, and therefore grouping of genetically similar breeds may help in gaining power32,31.
Rsb test to identify selective sweeps is based on the same idea of estimation of EHH as xp-EHH test. However
in contrast to xp-EHH test, it does not require phasing information28. Rsb compares the EHH patterns of the
same allele between populations instead of comparing the EHH between alleles within one population, analogous
to other statistics that are often focused on contrasting genetic variation between populations33.We used the xp-
EHH and Rsb a pproaches33,34 to determine selected alleles with higher frequency than expected according to their
haplotype length to obtain recent and generally segregating selective sweeps. The haplotypes were phased with
Beagle14, and then xp-EHH and Rsb scores were calculated for each haplotype within a population. Haplotype
frequencies were computed for 39,348 SNPs. For each locus, the xp-EHH and Rsb score were calculated using
the rehh package35 in R and the candidate genomic regions under selection were obtained.
For each test, the genes that were considered as candidates were found within the intervals spanning the
candidate genome regions and also overlapping candidate genes among the tests were captured using the Ovis
Oar_v4 reference genome assembly in the Ensembl36. The candidate genes visualized using Venpainter tool (Lin
et al. 2016).
Absolute correlation among four methods used to detect selection sweeps on: (a) IR vs. IN, (b) IR vs. AF, and
(c) IN vs. AF sheep breeds were determined using R codes.
The biological enrichment and functional annotation of the genes under selective pressure were defined using
Gene Ontology Consortium (http://geneontology.org).
Results
Populations and genotype data. After quality control and imputation of missing genotypes from 463
individuals genotype data for 39,531 SNPs from 14 sheep breeds Table 1, 453 individuals and 39,348 SNPs
remained for analysis. In details 10 individuals removed due to missing genotype data (–mind), 180 SNPs
removed due to missing genotype data (–geno), and 3 SNPs were removed due to minor allele frequency (–maf).
Population genetic structure and linkage disequilibrium. The Neighbor-joining phylogenetic tree
analysis divided the 14 breeds into three main branches, IR, IN, and AF. The IR group included AFS, MOG,
QEZ, ZEL, and LOR, in a main branch Fig. 1, blue color), which illustrated close relationships in the blue branch.
These five breeds are from mountainous and forest areas with cold and temperate climates of Iran. The AF group
has two distinct sub-branches, one for the three Afghan breeds (ARB, BLO, GDK), and the other own for the
Iranian IBL breed Fig. 1, red color). The IBL sheep is from a hot dry climate in the south-eastern deserts of Iran,
bordering Afghanistan and Pakistan and therefore IBL is geographically closer to Afghan breeds than the other
Iranian breeds in this study. The ARB, BLO, and GDK breeds formed a dense sub-branch that indicates their
Scientific Reports | (2021) 11:2834 | https://doi.org/10.1038/s41598-021-82625-2 4
Vol:.(1234567890)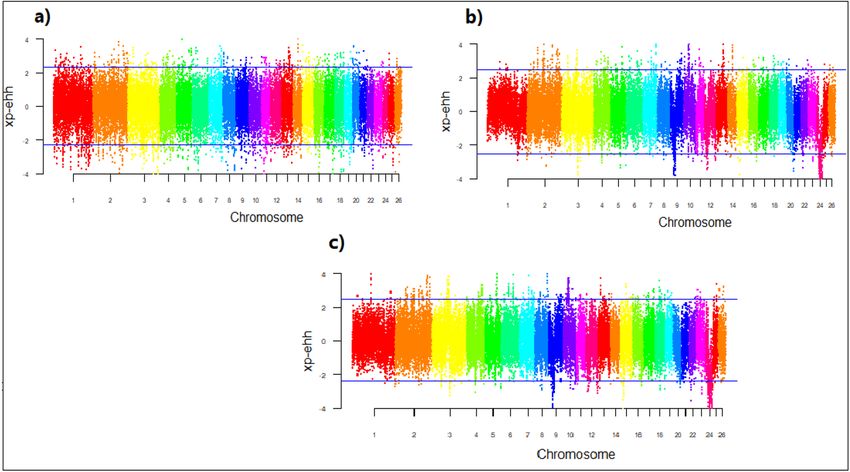
www.nature.com/scientificreports/
Figure 2. Principal components analysis (PC 1 and PC 3) of among 14 sheep breeds based on autosomal SNP
markers. For breed abbreviations, see Table 1.
close genetic relationship. The IN branch included BGA, BGE, GAR, IDC, and CHA Fig. 1, green color). In this
branch, two Bengal breeds (BGA and BGE) and GAR formed a distinct cluster, and two other Indian sheep
breeds were placed in two separate clusters. The GAR and BGA which are both named Garole breed live in West
Bengal state of India and Bangladesh, respectively however, some breeding isolation between them occurred.
Therefore, a close genetic relationship between these two breeds is expected.
The LD patterns among the IR and IN groups indicated that the mean of correlation coefficient values (r2) in
both groups dropped rapidly at approximately 10 Kb while the AF group showed a slower drop and its r2 values
at 50 Kb was higher than the other groups (Supplementary Figure S3). The average r 2 at 250 Kb for the IR, IN
and AF breeds were 0.0351, 0.0230 and 0.0693, respectively. There was a big difference in r 2 values more than
100 Kb between (IR and IN) and AF.
PCA results Fig. 2 also indicated close relationships within the IR, IN, and AF groups and supported separa-
tion into the three broad geographic groups that were identified by the neighbor-joining tree Fig. 1. Although the
breeds clustered according to geographic origin, a gradient based on the geographic distance was less pronounced
Fig. 2. In addition, the first principal component (PC1), explaining 13.3% of the total genetic variation among
breeds, clearly separated the IR and IN breeds from the AF breeds, thus forming two clusters. Along with the
PC1 projection spectra, both IBL and Afghan breeds formed the AF group but a large genetic variation are shown
between them. Among the AF breeds, IBL is clearly distant from the other breeds and supported the phylogenetic
results. The subclusters of MOG, GEZ, and AFS breeds overlapped, indicating a close relationship and possible
admixture of these breeds from the same region in north-western Iran. The LOR breed clearly distant from the
other IR breeds which show geographic distance between the LOR from the west and south-western of Iran and
the other IR breeds from the north and north- western of Iran. The patterns of genetic variation observed for the
AFS, MOG, and GEZ breeds suggested a recent admixture between these three Iranian breeds.
PC2, explaining 6.8% of the total genetic variation, separated the Afghan breeds from the other breeds, but
it did not clearly show geographic distance between the IR and IN breeds (Supplementary Figure S1). PC3,
explaining 3% of the total genetic variation, separated the IR from the IN and also showed close genetic relation-
ship among two Bengal breeds and GAR, while genetic distances among IDC, CHA, and the other IN breeds
Fig. 2. For a more clear assessment, we did PCA between the IR and IN breeds which were separated by PC1
(Supplementary Figure S2).
The occurrence and extent of breed admixture were examined by estimating individual ancestry proportions
from quality filtered and LD pruned genotype data. During pruning the dataset 13,257 of 39,348 SNPs removed
and 26,091 SNPs were remained. Admixture analyses were carried out with up to 14 ancestral components (K)
Fig. 3. Cross-validation (CV) errors were calculated to identify the most likely number of ancestral populations.
The lowest CV error was detected for K = 12 Fig. 3a. Although at K = 10, CV errors had stagnated after a decline,
ancestry components up to K = 10 separate breeds, and so it was recognized as the optimal value of K Fig. 3b.The
results of Admixture were in general agreement as PCA. Although the AF breeds, especially the IBL from the
IR and IN breeds, were separated at the first ancestry components (K = 2) and also at K = 4, the IR breeds were
separated from the IN breeds but a substantial IR ancestry is observed in the CHA breed at K = 4. In addition,
based on geographic origin the breeds were divided as follows: K = 2: the AF breeds,K = 4: the IN breeds,K = 7: the
IR breeds. At K = 10. The breed-specific ancestry components were clearly defined by all breeds except MOG and
QEZ and the Afghan breeds (ARB, BLO, and GDK). However, our finding showed that increasing the number of
Scientific Reports | (2021) 11:2834 | https://doi.org/10.1038/s41598-021-82625-2 5
Vol.:(0123456789)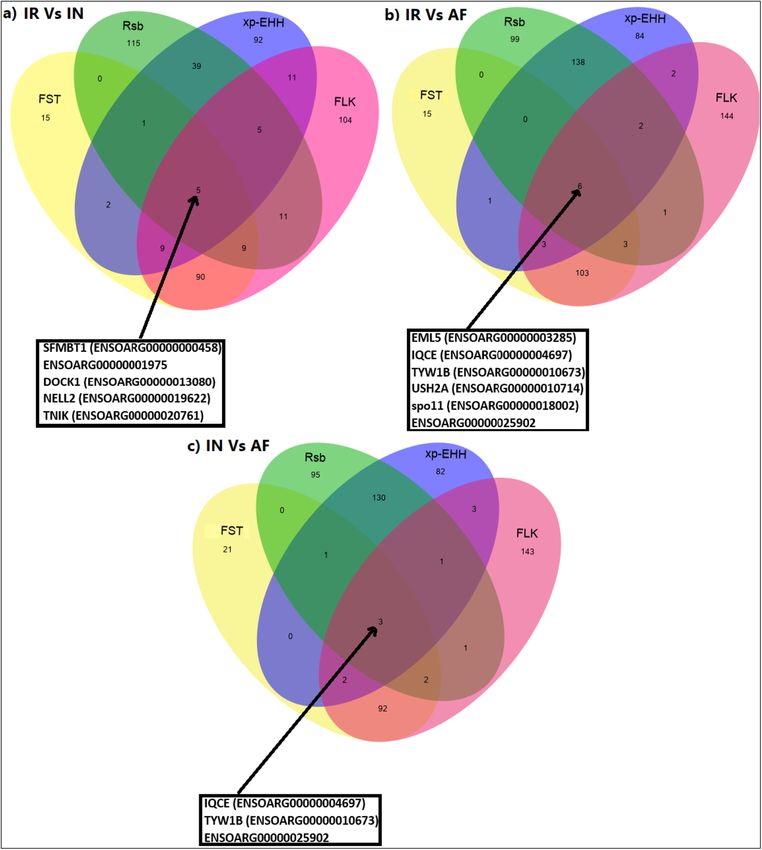
www.nature.com/scientificreports/

                                            Figure 3.  Prediction error (a) and circle admixture from K2 to K14 (b) plotted, respectively. For breed
                                            abbreviations, see Table 1.

                                            K above 10 did not yield a consistent MOG and QEZ separation. Therefore, four ancestral components distin-
                                            guished the five IR breeds where AFS, ZEL, and LOR were unambiguously recognized. Similar to PCA findings,
                                            the fourth component was shared between MOG and QEZ, confirming a close genetic relationship. There were
                                            no differences among the ARB, BLO, and GDK Afghan breeds from K = 2 to K = 14 which indicated close genetic
                                            relation sheep of them, confirming results from PCA and the neighbor-joining tree. The Bengal breeds (BGA and
                                            BGE) separated from K = 9, but despite expectation, BGA and GAR with the common name and root separated
                                            from K = 5. In general, compared with the other IN breeds, closer genetic relationships were seen between BGA,
                                            BGE, and GAR confirming PCA and the neighbor-joining tree analyses.

          Scientific Reports |   (2021) 11:2834 |               https://doi.org/10.1038/s41598-021-82625-2                                              6

Vol:.(1234567890)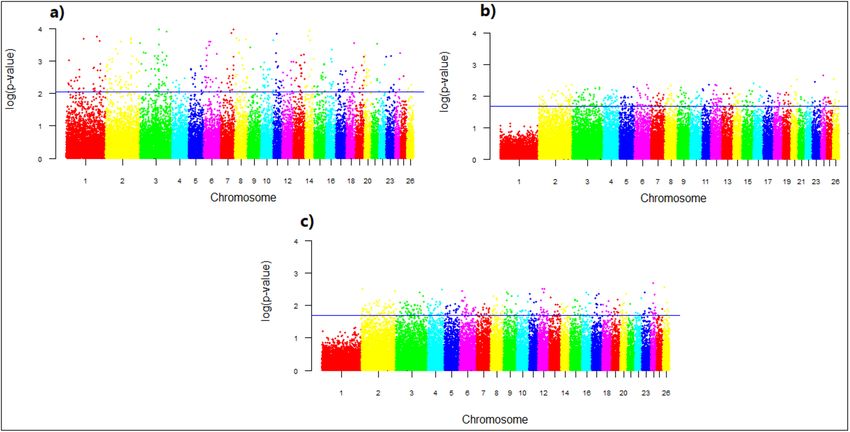
www.nature.com/scientificreports/
Figure 4. The distribution of absolute Z(FST) values on 26 sheep autosomes: (a) IR vs. IN breeds (the horizontal
blue line, Z(FST) ≥ 3.93), (b) IR vs. AF breeds (the horizontal blue line, Z(FST) ≥ 3.18), (c) IN vs. AF breeds (the
horizontal blue line, Z(FST) ≥ 3.08). The data points above the horizontal line (blue line) are top 1% Z(FST)
values. FST fixation index. For breed abbreviations, see Table 1.
ROHs. A total of 34,587 ROH segments were identified in the 14 studied breeds. The results are summarized
in Supplementary Table S5. The number of ROH segments was highest in IBL (5,407) and GAR (4,605) breeds,
and lowest in ARB (1,000) and GDK (1,018). The majority of ROH segments were shorter than 8 Mb (32,260),
followed by intermediate ROH segments ranging from 8 to 16 Mb (1,520) and large ROH segments exceeding
16 Mb (807). Based on ROH, levels of FROH for each breed were estimated separately (Supplementary Figure S4).
Genomic inbreeding ranged from 0.008 (in the AFS breed) to 0.5 (in the GAR breed).
Selective sweeps detection. Selective sweeps detection was performed using F ST37, FLK27, Rsb33, and
xp-EHH34. Based on the PCA and the neighbor-joining tree results, these four different tests were conducted for
selective sweeps detection on the three pairwise comparisons: (a) IR and IN breeds, (b) IR and AF breeds, (c)
IN and AF breeds. The Z-transformation of FST, Z(FST), values of 39,348 SNPs were estimated Fig. 4. For these
three pairwise comparison, the maximum of Z(FST) values were 14.524 on chromosome 11 (IR vs. IN breeds),
4.744 on chromosome 24 (IR vs. AF breeds) and 4.556 located on chromosomes 24 (IN vs. AF breeds) Fig. 4.
Based on the Z(FST), a total of 131 genes as top 1% candidates for selective sweeps were detected in (a) IR and
IN breeds, 131 genes in (b) IR and AF breeds, and 121 genes in (c) IN and AF breeds (Supplementary Table S1).
Among these candidate genes, several of them are known for association with economic traits, for example,
SLC27A6, ANXA13, ADCY2, HDAC9, TTC8, and WDR70 association with milk traits. HERC2, FTO, TP73,
GRM3, KCNIP4, GRM7, and UBR2 are related to body weight and growth traits. TMEM132B, TMEM232,
and SLC8A3 affect fertility traits. ADAMTS6, ADAMTS20, GALNT6, ATP2C1, TMPRSS3, PCDH15, MAGI2,
TRPC4, DOCK1, DOCK4, DOCK10, MAPK10, ADAM7, PPA2, CHD3, ITGA4, NBEAL1, NFATC1, and
ZNF609 involve in the immune system and environment adaptation.
The xp-EHH scores were calculated for haplotype frequencies Fig. 5. The top 1% of xp-EHH, considered as
selective sweeps, identified 164 genes for (a) IR and IN breeds,236 genes for (b) IR and AF breeds; and 221 genes
for (c) IR and AF breeds (Supplementary Table S2). Many candidate genes found by the xp-EHH method are
related to economic traits, such as, OXT, HSPB1, TBX6, GNA12, BMP7, MYH10, TRHDE, IL27, IL4R, and IL21R
involved in heat stress; ATP2A1, ATP2B1, LRP12, CD19, MAPK3, PLCE1, VPS16, PTPRA, ADAM2, MYO18A,
PCDH17, BBS9, NFATC2IP, RNF26, RNF139, ZNF572, ZNF655, and ZNF789 associated with immune system
and environment adaptation; and MEF2C, TRHDE, FAM222B, FAM177A1, and SSC4D influenced body weight
and growth traits.
The Rsb scores were calculated for haplotype frequencies Fig. 6. The top 1% of Rsb, considered as selective
sweeps, identified 185 genes for (a) IR and IN breeds, 249 genes for (b) IR and AF breeds, and 233 genes for c) IR
and AF breeds (Supplementary Table S3). Many candidate genes specially associated with immune response and
heat stress were identified by Rsb test, such as, ATP2B1, ATP2C1, ATP6V1H, BMPR1B, PLCE1, LRP1B, CXCL1,
CD19, DOCK1, DOCK4, PTPRA, MAPK3, UNC5C, ANKRD2, BBS9, NAFTC2IP, RNF139, and ZNF695 in
immune system and environment adaptation, and IFT22, EIF2A, HSPB1, TBX6, TBX21, GNA12, BMP7, IL16,
IL27, IL4R, and IL21R in heat stress. Furthermore, HOXD1, HEXD2, and MTX2 affect the horn traits,and PRLP,
Scientific Reports | (2021) 11:2834 | https://doi.org/10.1038/s41598-021-82625-2 7
Vol.:(0123456789)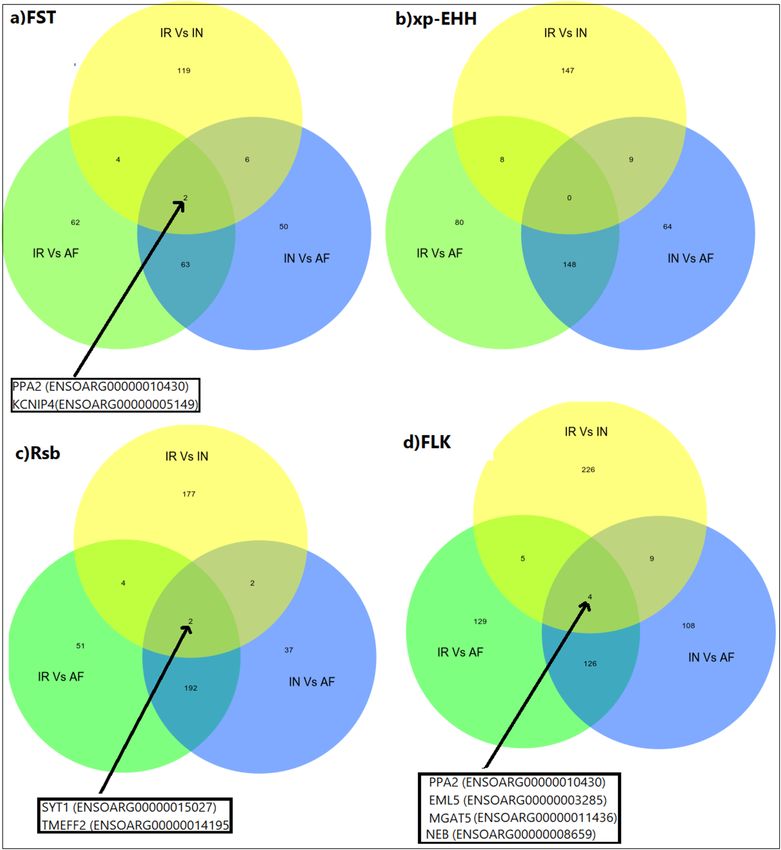
www.nature.com/scientificreports/

                                            Figure 5.  Genomic distribution of standardized cross-population extended haplotype homozygosity (xp-EHH)
                                            scores on 26 sheep autosomes pairwise: (a) IR and IN breeds, (b) IR and AF breeds, (c) IN and AF breeds. For
                                            breed abbreviations, see Table 1.

                                            Figure 6.  Genomic distribution of standardized haplotype differentiation (Rsb) scores on 26 sheep autosomes
                                            pairwise: (a) IR and IN breeds, (b) IR and AF breeds, (c) IN and AF breeds. For breed abbreviations, see Table 1.

                                            TBC1D10B, TMEM151A, TMEM65, TMEM225B, BMPRIB, and BMP7 genes associated with fertility traits were
                                            detected as candidate genes using Rsb.
                                                The -log(p-value) values of 39,348 SNPs for the FLK test are presented in Fig. 7. Based on the -log(p-value),
                                            a total of 244 genes as top 1% candidates for selective signals were detected in (a) IR and IN breeds,265 genes
                                            in (b) IR and AF breeds; and 247genes in (c) IN and AF breeds (Supplementary Table S1). Several candidate
                                            genes identified using FLK test are related to economic traits, for example, FABP3, SLC27A6, ACP7, ANXA13,

          Scientific Reports |   (2021) 11:2834 |               https://doi.org/10.1038/s41598-021-82625-2                                                  8

Vol:.(1234567890)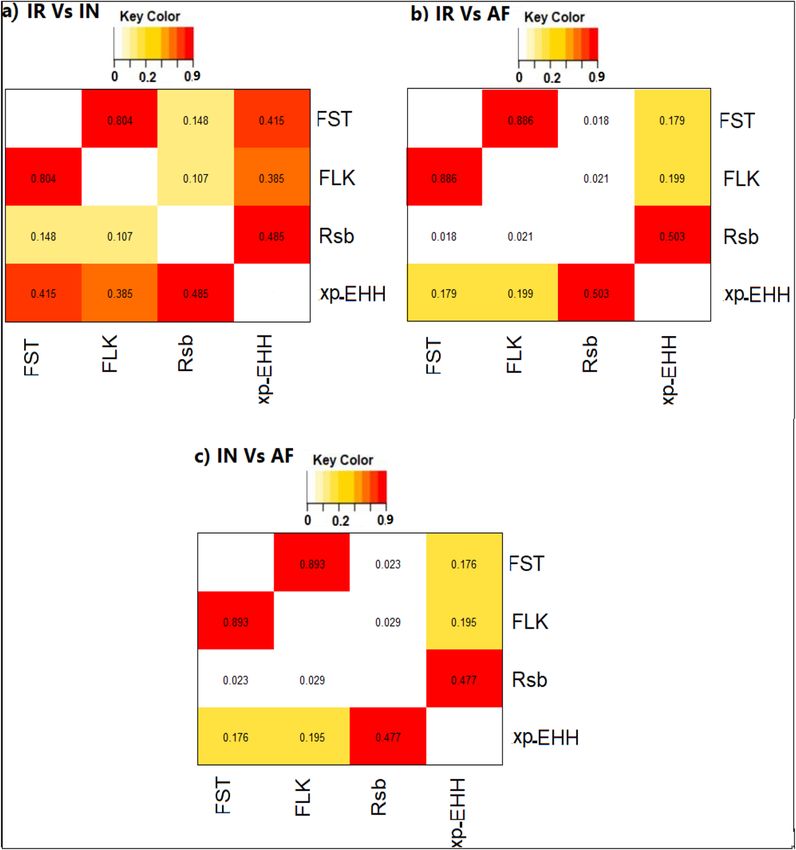
www.nature.com/scientificreports/
Figure 7. Genomic distribution of single marker statistic (FLK) scores on 26 sheep autosomes pairwise: (a) IR
and IN breeds, (b) IR and AF breeds, (c) IN and AF breeds. For breed abbreviations, see Table 1.
HEATR5B, ADCY2, BRD4, BRD8, HDAC9, TTC8, TTC23, WDR7, WDR31, WDR70, and POU6F1 related to
milk traits as well as HERC2, FAM169A, FTO, TP73, GRM2, GRM3, and UBR2 for body weight and growth
traits. Several candidate genes related to immune system and climate adaptation were detected by FLK, such as,
ADAMTS6, ADAMTS20, ARHGAP26 GALNT6, GALNT13, GALNT18, ATP2C1, ADAM19, MAPK10, MAGI2
ADAM33, LRP1B, CXCL14, TMPRSS3, TRPC4, NBEAL1, CD34, COL12A1, PCDH15, DOCK1, DOCK4,
DOCK10, UNC5B, BBS9, CDH6, CHD3, IRF6, ITGA, LRP1B, NAFATC1, RNF26, ZNF609, and ZNF692.
The FST and FLK tests with average 128 and 252 genes showed the minimum and maximum captured genes
among these four tests. Furthermore, five, six and three concordant genomic regions for (a) IR and IN breeds,
(b) IR and AF breeds, (c) IN and AF breeds were identified by FST, xp-EHH, Rsb, and FLK tests as candidates
for selection signals, respectively Fig. 8. These overlapping candidate genes for (a) IR and IN breeds include the
following genes,Scm-like with four MBT domains protein 1 (SFMBT1) on chromosome 19, plays a role dur-
ing spermatogenesis. Dedicator of cytokinesis protein 1(DOCK1) on chromosome 22, has an essential role in
embryonic development and involved immune response, Neural EGFL like 2 (NELL2) on chromosome three,
involved in involved in pubertal development. NCK-interacting protein kinase (TNIK) on chromosome one, the
protein encoded by this gene plays important role in embryonic development, especially during the early embryo
to blastocyst stages, participates in the regulation of the inflammatory response against infections.
The overlapping candidate genes for (b) IR and AF breeds include, Echinoderm microtubule-associated
protein-like 5 (EML5) on chromosome seven, may change the assembly dynamics of microtubules to make
microtubules are slightly longer but more dynamic and it is possible that EML5 plays a role during neuronal
development in the regulation of cytoskeletal rearrangements, IQ domain-containing protein E (IQCE) on
chromosome 24, involved in body development, TRNA-YW Synthesizing Protein 1 Homolog B (TYW1B) on
chromosome 24, influenced on the wybutosine biosynthesis pathway. Usherin (USH2A) on chromosome 12,
may be involved in the function of synapses and plays an important role in the development and maintenance
of cells in the inner ear and retina. SPO11 initiator of meiotic double-stranded breaks (SPO11) on chromo-
some 13, involved in the production of double-strand breaks (DSB) of DNA and it is specifically involved in the
growth of the testis, maintenance of the male germ line, and maturation of sperm. Three overlapping candidate
genes for c) IN and AF breeds were detected; the IQCE, TYW1B, and an unknown gene with Ensemble number
(ENSOARG00000025902) which all of these three genes were detected before (IR vs. AF).
We also detected overlapping candidate genes for IR vs. IN, IR vs. AF, and IN vs. AF data on the FST, xp-EHH,
Rsb, and FLK tests Fig. 9. For the F ST test PPA2, involved in the immune system, and KCNIP4 plays important
role in heart performance and it is related to skeletal muscle growth and also immune response. SYT1, associated
with feeding behavior traits such as residual feed intake and TMEFF2, involved in a wide range of traits such
as,immune response, milk production and sperm morphology, were detected as overlapping candidate genes
for the Rsb test. For the FLK test, PPA2, EML5 genes, which have been found in the previous tests, MGAT5,
associate with dry matter intake and NEB, involved in environment adaptation, were detected as overlapping
candidate genes on the three different data. We did not find any overlapping candidate genes on the all data by
the xp-EHH test.
Biological enrichment analysis of significant biological processes for candidate genes under positive selective
pressure revealed 26 Gene Ontology (GO) terms Table 2. These GO terms reflected protein function and biosyn-
thetic processes, including TNIK and DOCK1 genes associated with cytoskeleton organization (GO:0007010)
Scientific Reports | (2021) 11:2834 | https://doi.org/10.1038/s41598-021-82625-2 9
Vol.:(0123456789)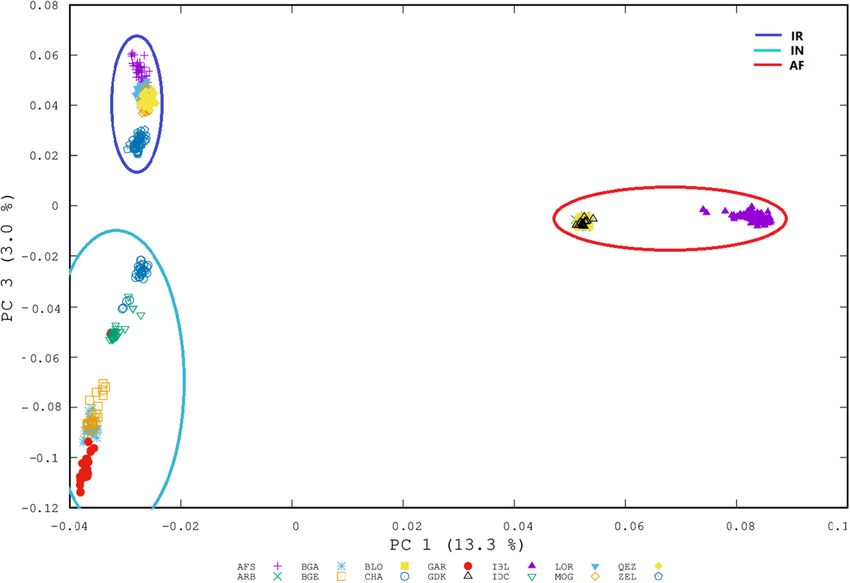
www.nature.com/scientificreports/
Figure 8. Venn diagram showing the unique and shared candidate genes for FST, Rsb, xp-EHH, and FLK tests
on: (a) IR vs. IN, (b) IR vs. AF, and (c) IN vs. AF sheep breeds. For breed abbreviations, see Table 1.
and six other GOs related to the TNIK gene. Four other GOs were associated with DOCK1. The SFMBT1 gene
associated with negative regulation of transcription (GO:0035556). Seven GOs were associated with the spo11.
Four GOs were related to the USH2A gene. Finally, tRNA processing (GO:0008033) was associated with the
TYW1B gene.
Absolute correlation coefficients among these four tests on (a) IR vs. IN, (b) IR vs. AF, and (c) IN vs. AF
sheep breeds showed the maximum correlation between FST and FLK on the all comparisons (average: 0.861)
and the minimum correlation between FLK and Rsb on IR vs. IN (0.107) and F ST and Rsb on IR vs. AF and IN
vs. AF data (average: 0.021) Fig. 10.
Discussion
The present study investigates the genetic diversity and selective sweeps of 14 sheep breeds from Iran, Afghani-
stan, India, and Bangladesh. The selective sweeps were studied using the F ST, FLK, xp-EHH and Rsb statistical
methods on the three cluster of breeds (IR, IN, and AF). Our goal in the current study was to search the genomes
of these indigenous sheep breeds to highlight genetic variants that can be used in developing next-generation
productive breeds, better suited to diverse Iran environments, in a comparative scale with Indian, Bengal, and
Afghan sheep breeds. Furthermore, the other goal was using four comparable selective sweeps tests to cover all
the regions of the genomes and capture maximum candidate genes, as well as review their biological function.
The results showed that these breeds’ genomes contain multiple regions under selection. These regions contain
Scientific Reports | (2021) 11:2834 | https://doi.org/10.1038/s41598-021-82625-2 10
Vol:.(1234567890)www.nature.com/scientificreports/
Figure 9. Venn diagram showing the unique and shared candidate genes for IR vs. IN, IR vs. AF, and IN vs. AF
data on: (a) FST, (b) xp-EHH, (c) Rsb, and (d) FLK tests. For breed abbreviations, see Table 1.
well-known economic trait-related candidate genes. This could help sheep breeders to: (1) improve adaptation
in extant breeds; (2) develop native breeds that are better adapted to local agro-climatic conditions; (3) launch
future research work on the genomes of Iranian, Afghan, Indian, and Bengal sheep, and highlight essential
genetic variants or haplotypes that can be used in the production of higher productivity and efficiency next-
generation breeds, better adapted to various Iranian environments, on a comparative scale with Afghan, Indian,
and Bengal sheep breeds.
Genetic relatedness and geographic origin. We demonstrated that the IR sheep breeds are genetically
distinct from the breeds of IN and AF. Based on their geographic origins, the studied sheep breeds are well clus-
tered. We categorized the IR, IN and AF breeds into three phylogeographic clades. Close connections between
breeds originating in the same geographical region have been found. In fact, phylogenetic analysis showed a
close genetic relationship among the IR breeds. These breeds are from cold and temperate climates of Iran. On
the other hand, the IN breeds showed a closer relationship among BGA, BGE, and GAR breeds from the eastern
region of India and Bangladesh. In contrast, IDC from the western peninsular region and CHA from northern
Himalayan part of India formed two distinct sub clusters.
Furthermore, the AF cluster showed an IBL sub-cluster and a compact sub-cluster of three Afghan breeds,
indicating a closer relationship among Afghan breeds and their genetic distance from IBL.
These findings are consistent with previous research on sheep38,39,3,40, which showed that individuals were
separated by global population structure patterns according to their geographical origin.
Scientific Reports | (2021) 11:2834 | https://doi.org/10.1038/s41598-021-82625-2 11
Vol.:(0123456789)www.nature.com/scientificreports/
Group Biological process Genes p. adjust
Cytoskeleton organization GO:0007010 DOCK1,TNIK 0.0027
Regulation of dendrite morphogenesis GO:0048814 TNIK 0.021
Actin cytoskeleton reorganization GO:0031532 TNIK 0.044
Hematopoietic progenitor cell differentiation GO:0002244 DOCK1 0.046
Small GTPase mediated signal transduction GO:0007264 DOCK1 0.046
Protein localization to plasma membrane GO:0072659 TNIK 0.046
a
Cell migration GO:0016477 DOCK1 0.046
Positive regulation of protein phosphorylation GO:0001934 TNIK 0.046
Protein auto phosphorylation GO:0046777 TNIK 0.046
Positive regulation of GTPase activity GO:0043547 DOCK1 0.065
Intracellular signal transduction GO:0035556 TNIK 0.081
Negative regulation of transcription GO:0045892 SFMBT1 0.097
Reciprocal meiotic recombination GO:0007131 SPO11 0.007
Sensory perception of light stimulus GO:0050953 USH2A 0.007
Synaptonemal complex assembly GO:0007130 SPO11 0.007
Male meiosis I GO:0007141 SPO11 0.007
DNA metabolic process GO:0006259 SPO11 0.007
Ovarian follicle development GO:0001541 SPO11 0.007
b Oogenesis GO:0048477 SPO11 0.007
Synapsis GO:0007129 SPO11 0.007
Photoreceptor cell maintenance GO:0045494 USH2A 0.007
Establishment of protein localization GO:0045184 USH2A 0.007
tRNA processing GO:0008033 TYW1B 0.011
Spermatid development GO:0007286 SPO11 0.013
Sensory perception of sound GO:0007605 USH2A 0.020
c tRNA processing GO:0008033 TYW1B 0.003
Table 2. Breed biological process of common candidate genes under selective pressure for F
ST, Rsb, xp-EHH,
and FLK tests on: (a) IR vs. IN, (b) IR vs. AF, (c) IN vs. AF.
ndings2,41,38 PCA results demonstrated that the genetic variation was associ-
In accordance with previous fi
ated with the separation among sheep breeds from different parts of the world. This was further supported by
neighbour-joining tree analysis revealing that the population was split according to geographic origin (IR, IN,
and AF). Population structure analyses of the IR, IN, and AF breeds clearly reflected the geographic distribution
at PC1 and the separation of northern from southern breeds at PC3.
Admixture and phylogenetic patterns. In accordance with the previous analyses, admixture results
confirmed that the first few ancestral breed components (K = 2 to K = 5) were related to the geographic origins.
High levels of breed admixture were detected among the Iranian (IR and IBL) breeds, and also among the IN
breeds. A significant IR ancestry is observed in the CHA breed at K = 4, which probably due to the same climate
between the CHA from Kashmir and the IR breeds from the northwest of Iran Table1, and also due to historical
ties and neighborliness between Iran and India, especially in the Kashmir region. It is possible that the IR breeds
and CHA have common ancestors. However, low levels of admixture events among the breeds originating from
the different geographical regions were detected. For example, although the GAR and BGA from India and
Bangladesh have a common breed name (Garole), they separated at k = 5 ancestral breed components, while
BGA and BGE which are known as two different breeds in Bangladesh showed more relationship and they have
been separated at k = 9 which confirm the effect of geographic origin in breeds separation. Admixture results
confirmed genetic divergence identified through the neighbor-joining and PCA.
Inference based on population neighbour-joining trees based on genome-wide allele frequencies clustered
the breeds into three monophyletic clades according to the geographical origin. The deepest population split
among the AF breeds separated IBL from the other AF breeds. Among the IN breeds, IDC and CHA showed
deeper population splits, in line with geographic clades detected by the PCA and admixture analysis. These
results support the previous findings2,41,38.
Runs of homozygosity. The history of inbreeding within a population can be estimated from the length
distribution of ROH s egments42. We estimated F ROH to study genomic inbreeding. The average F ROH levels esti-
mated for the breeds was (0.09), which was almost the same as the previous s tudy3. In the studied breeds, the
range of FROH recorded 0.008 to 0.5, was higher than the previous maxima but the observed minima were
consistent with previous findings. Mastrangelo et al.43 reported the range of FROH from 0.016 to 0.099 in domestic
sheep breeds.
Scientific Reports | (2021) 11:2834 | https://doi.org/10.1038/s41598-021-82625-2 12
Vol:.(1234567890)www.nature.com/scientificreports/
Figure 10. Absolute correlation among different methods used to detect selective sweeps on: (a) IR vs. IN, (b)
IR vs. AF, and (c) IN vs. AF sheep breeds. For breed abbreviations, see Table 1.
The IBL and IN breeds had the largest number of ROHs, and therefore showed highest FROH levels, indi-
cating the relationship between the number of ROH segments and FROH levels3. The results of ROH segment
also showed that more than 93% of the ROH segments were shorter than 8 Mb, which indicated older events of
inbreeding and a board effective population size of sheep flocks43. The IN breeds displayed a higher FROH vari-
ance than the IR and AF breeds which could indicate more effective population size variation in the IN breeds.
Inbreeding and extended ROH segments can be increased by small population size and intense selection, thereby
continuing to express the deleterious a lleles44.
Genome‑wide selective sweeps. The ability of specific genomic regions to detect selective sweeps
depends on the selection of analytical tools appropriate to the biological situation but no single method can
detect selective sweeps that are both starting and nearly completed. However, combining several tests increases
significantly the power to recognize the region s elected6,7. Therefore, we used FST, FLK, xp-EHH, and Rsb test
statistics to detect genome-wide selective sweeps in (a) IR and IN breeds, (b) IR and AF breeds, (c) IN and
AF populations. F ST was first implemented to measure the degree of genetic differentiation between popula-
tions based on variations in allele f requency45. The genomic variation information is provided by F ST at a locus
between the populations compared to within the populations. Therefore, the F ST is an evidence of selection: high
FST values indicate positive local adaptation46. The older selection events between populations are expected to
be identified by F HH31, that incorporates information on the rela-
ST47,48. The xp-EHH test is an extension of E
tionship between an allele’s frequency and LD measurements with neighboring alleles. Therefore, this test may
provide maximal statistical power and low ascertainment bias s ensitivity33. The Rsb test is population compari-
son test to identify selective sweeps33. The test is based on the same idea as the XP-EHH, identifies loci similar
to the XP-EHH test under selection, but can be implemented with unphased d ata28. Generally, the xp-EHH and
Rsb tests are used to detect recent positive selection within population and between-populations, respectively9.
The FLK (extended Lewontin and Krakauer test) test is based on the assumption that two new populations are
formed by the splitting of a population,calculates a statistic of population differentiation, which incorporates
a matrix of kinship describing the relationship between p opulations27,28. For each SNP, the FLK test calculates
Scientific Reports | (2021) 11:2834 | https://doi.org/10.1038/s41598-021-82625-2 13
Vol.:(0123456789)www.nature.com/scientificreports/
a global FST, but allele frequencies are first rescaled using a matrix of population kinship. This matrix, which is
estimated from the genome-wide data observed, measures the amount of genetic drift that can be predicted
along all branches of the population tree under neutral e volution27. Therefore, the integration of these four
complementary statistical tests provides a valuable tool for detecting, with greater confidence, positive selection
of genomic regions.
For FST and FLK, only the top 1% Z(FST) values and the top 1% -log(p-value) were considered, respectively
to be representing selective sweeps as recommended in previous s tudies29,40.
Analyses of selective sweeps were reported for several international sheep populations from several countries,
including China49, Europe41,50, Russia51, Egypt52, Brazil53, and New Z ealand54. Furthermore, several studies of
selective sweeps on sheep carried out using different tests, including the FLK and h apFLK2,55, hapFLK, FLK, F ST,
10 56
and hapFST , REHH and xp-EHH , FST and h apFLK , FST and iHS , FST, Rsb, and iHS53.
49 52
This study, using FST, xp-EHH, Rsb, and FLK, detected on average 128, 207, 222, and 252 genomic regions
as candidates for selective sweeps, respectively. Although the selected candidate regions are narrow and are
distributed across different chromosomes, however for FST and FLK tests, chromosome 1 showed a low value
for IR vs. AF and IN vs. AF comparisons which may indicate the genome of two populations are the same in
this region and many common genes were expected to be fixed in both populations48, Figs. 4 and 7. Several of
these genes encode economically important traits. For example, genes that have directly or indirectly influence
traits for adaptation to hot arid conditions and heat tolerance (TRHDE, IL4R,IL21R, and SLC4A4), which are
reported as candidate genes involved in heat tolerance on sheep57. The heat shock protein B1 (HSPB1) gene
which expresses both at mRNA and protein levels under heat stress on poultry58, reported in sheep59, and cattle60.
All of these candidate genes were detected in IR vs. AF, and vs. AF clusters, where the AF breeds are common
(Supplementary Tables S1, S2, and S3). This indicates that the AF breeds, which are from a hot dry climate, have
undergone selection for heat tolerance.
Many of the candidate genes identified in this study are effective in genetic resistance to disease, immune
response and climate adaptation, which indicates differential selections among the studied breeds. Since genetic
resistance against diseases and harsh environmental conditions are important characteristics of indigenous ani-
mal breeds, the identification of a large number of genes in this study points toward the associated genes have
been under selection pressure over time due to the natural selection of immune response traits61,62. For example,
we detected the DOCK family (DOCK1, DOCK4, DOCK10)63,64, ZNF family (ZNF572, ZNF655, ZNF609,
ZNF692, and ZNF789)65,66, ATP family (ATP2A1, ATP2B1, and ATP2C1)67, TMEFF268, CXCL169, PCDH1569,
and (COL12A1, COL15A1, COL27A1)69, VPS16 and P TPRA70, PLCE171, ATAMTS2072, TPRC473, candidate
genes involved in the immune response and climate adaptation (Supplementary Tables S1, S2, and S3). Almost
all these genes were detected in all three clusters, a (IR and IN), b (IR and AF), and c (IN and AF), which may
indicate genetic resistance and high immune response against diseases and harsh environmental conditions in
these native breeds.
We detected some genes involved in production traits and indirectly related to climate adaptation, such as,
FABP3. Calvo et al.74 showed linkage disequilibrium between FABP3 gene and quantitative trait loci (QTL) for
milk fat content. Other related milk traits candidate genes included the LRP1B and CNTN4 which previously
reported on sheep75 and cattle76. The ITPR2 and SLC27A6 are also two examples of important candidate genes
detected by Li et al.75 on sheep and both have been proposed to be candidate genes for milk and fat production
in cattle and indirectly involved in climate a daptation77,78. All of these genes were found in b (IR and AF), and
c (IN and AF) clusters, indicating AF breeds may be under selection pressure related to milk traits but it needs
further research to conclude. (Supplementary Tables S1, S2, and S3).
We found several candidate genes involved in body weight and growth traits specially post-weaning gain
in all population clusters, such as the TRHD, UBR2, GRM2, GRM3 which also related to climate adaptation
indirectly79,80.
Furthermore, 11 overlapping candidate genome regions were detected for FST, Rsb, xp-EHH, and FLK tests
on: (a) IR vs. IN, (b) IR vs. AF, and (c) IN vs. AF sheep breeds Fig. 8. The number of overlapping unique candi-
date genes are consistent with the previous results using F ST, Rsb, and iHS t ests81, FST, xp-EHH, and iHS t ests48,
ROH, FST, and xp-EHH82.
Four of the genes (DOCK1, TYW1B, USH2A, and TNIK) play important roles in resistance against dis-
eases and climate adaptation. DOCK1 located on chromosome 22 is involved in immune response63,64. TNIK
on chromosome 1 plays several functions in embryonic development, especially during the early embryo to
blastocyst stages, participates in the regulation of the inflammatory response against infections83, TYW1B on
chromosome 24 influences artery disease and blood pressure in human84, USH2A on chromosome 12 may be
involved in the function of synapses and plays an important role in the development and maintenance of cells
in the inner ear and r etina85.
In total, seven unique candidate genes were detected for IR vs. IN, IR vs. AF, and IN vs. AF comparisons by
FST, Rsb, and FLK analysis, but no overlapping candidate gene was found for the xp-EHH method Fig. 9.
PPA2 on chromosome 6 is associated with immune response and disease resistance in cattle86. KCNIP4
gene on chromosome 6 is directly involved in processes related to muscle growth and fat deposit and indirectly
climate adaptation in s heep87 and was reported in cattle involved in bovine growth and calcium m etabolism88.
89
SYT1 gene on chromosome 3 is associated with feeding behavior traits related to local adaptation , and TMEFF2
gene on chromosome 2 is involved in a wide range of traits such as, immune response, milk production and,
sperm morphology68,90. For the FLK test, PPA2, EML5, MGAT5, and NEB genes were detected, which PPA2 and
EML5 have been found in the previous tests Fig. 9. NEB gene on chromosome 2 is involved in environmental
adaptation. Among 1262 selected genomic regions reported by Yudin and Larkin91, only NEB gene was a shared
candidate gene among cattle, sheep, mammoth, polar bear, and whale genomes.
Scientific Reports | (2021) 11:2834 | https://doi.org/10.1038/s41598-021-82625-2 14
Vol:.(1234567890)www.nature.com/scientificreports/
GO classifications of the candidate genes were performed to enable a better understanding of their molecular
functions. Based on the GO biological process (BP) for a significant threshold (p ≤ 0.05), we implemented the
GO on 11 overlapping candidate genes. Only six genes (TNIK, DOCK1, SFMBT1, SPO11, USH2A, and TYW1B)
associated with the 26 GO terms were identified. In total 11 GOs were related to TNIK, USH2A, TYW1B, and
DOCK1, which are associated with local adaptation (resistance against diseases).
In confirmation of our results, Nie et al.92, reported different GO terms associated with the TNIK gene in
human92. Four other GOs associated with DOCK1. DOCK family genes have several biological functions63,64.
Absolute correlation among the F ST, FLK, xp-EHH, and Rsb tests were calculated Fig. 10. The xp-EHH, and
Rsb are based on the frequency of extended haplotypes between two p opulations33,34, whereas F
ST and FLK are
based on allele frequencies6,37. So as expected, maximum correlations were observed between FST and FLK, as
well as between xp-EHH and Rsb. On the other hand, we detected minimum correlations between haplotype
based tests (xp-EHH, and Rsb) and allele based tests ( FST and FLK). These findings are consistent with the previ-
ous reports8,28.
Conclusions
Our results showed the population structure and selective candidate genomic regions of the 14 indigenous
sheep breeds from Middle East and South Asia. This information would be valuable in future study on genetic
basis for local adaptation of indigenous breeds. In F
ST, FLK, xp-EHH, and Rsb complementary statistical tests,
some candidate genomic regions under selective pressure were detected in indigenous sheep breeds and these
candidate genomic regions may facilitate identification of the underlying genes and possible exploitation in
future sheep breeding.
Data availability
Genotype data from the sheep breeds (Afshari, Moghani, Qezel, Bangladeshi Garole, Bangladesh East, Indian
Garole, Changthangi, and Deccani) are available through the Sheep HapMap p roject11. The ZEL, Lori-Bakhtiari,
Iranian Balochi, Arabi, Afghan Balochi, and Gadik breeds data are part of the Iranian national genetic evaluations
of economic traits conducted at the Animal Breeding Center of Iran. Any request for data should be addressed
to the corresponding author.
Received: 8 December 2020; Accepted: 22 January 2021
References
1. Groeneveld, L. et al. Genetic diversity in farm animals—a review. Anim. Genet. 41, 6–31 (2010).
2. Alberto, F. J. et al. Convergent genomic signatures of domestication in sheep and goats. Nat. Commun. 9, 1–9 (2018).
3. Eydivandi, S., Sahana, G., Momen, M., Moradi, M. & Schönherz, A. Genetic diversity in Iranian indigenous sheep vis-à-vis selected
exogenous sheep breeds and wild mouflon. Anim. Genet. 51, 772–787 (2020).
4. FAOSTAT F. Crop statistics (2018).
5. Ardlie, K. G., Kruglyak, L. & Seielstad, M. Patterns of linkage disequilibrium in the human genome. Nat. Rev. Genet. 3, 299–309
(2002).
6. Hohenlohe, P. A., Phillips, P. C. & Cresko, W. A. Using population genomics to detect selection in natural populations: Key concepts
and methodological considerations. Int. J. Plant Sci. 171, 1059–1071 (2010).
7. Vatsiou, A. I., Bazin, E. & Gaggiotti, O. E. Detection of selective sweeps in structured populations: a comparison of recent methods.
Mol. Ecol. 25, 89–103 (2016).
8. Ma, Y. et al. Properties of different selection signature statistics and a new strategy for combining them. Heredity 115, 426–436
(2015).
9. Oleksyk, T. K., Smith, M. W. & O’Brien, S. J. Genome-wide scans for footprints of natural selection. Philos. Trans. R. Soc. B Biol.
Sci. 365, 185–205 (2010).
10. Fariello, M. I., Boitard, S., Naya, H., SanCristobal, M. & Servin, B. Detecting signatures of selection through haplotype differentia-
tion among hierarchically structured populations. Genetics 193, 929–941 (2013).
11. Sempéré, G. et al. WIDDE: A Web-Interfaced next generation database for genetic diversity exploration, with a first application
in cattle. BMC Genom. 16, 1–8 (2015).
12. Nicolazzi, E. L. et al. SNPchiMp: A database to disentangle the SNPchip jungle in bovine livestock. BMC Genom. 15, 123 (2014).
13. Purcell, S. et al. PLINK: A tool set for whole-genome association and population-based linkage analyses. Am. J. Hum. Genet. 81,
559–575 (2007).
14. Browning, S. R. & Browning, B. L. Rapid and accurate haplotype phasing and missing-data inference for whole-genome association
studies by use of localized haplotype clustering. Am. J. Hum. Genet. 81, 1084–1097 (2007).
15. Roshyara, N.R. Documentation for Genotype Format Converter: fcGENE (2014).
16. Cook, D. E. & Andersen, E. C. VCF-kit: assorted utilities for the variant call format. Bioinformatics 33, 1581–1582 (2017).
17. Rambaut, A. FigTree–molecular evolution, phylogenetics and epidemiology (2007). Available Accessed 14 (2015).
18. Price, A. L. et al. Principal components analysis corrects for stratification in genome-wide association studies. Nat. Genet. 38,
904–909 (2006).
19. Zhang, C., Dong, S.-S., Xu, J.-Y., He, W.-M. & Yang, T.-L. PopLDdecay: A fast and effective tool for linkage disequilibrium decay
analysis based on variant call format files. Bioinformatics 35, 1786–1788 (2019).
20. Alexander, D. H., Novembre, J. & Lange, K. Fast model-based estimation of ancestry in unrelated individuals. Genome Res. 19,
1655–1664 (2009).
21. Johnston, S. E., Bérénos, C., Slate, J. & Pemberton, J. M. A genomic region containing RNF212 and CPLX1 is associated with
sexually-dimorphic recombination rate variation in Soay sheep (Ovis aries). BioRxiv, 024869 (2015).
22. Milanesi, M., Capomaccio, S., Vajana, E., Bomba, L., Garcia, J.F., Ajmone-Marsan, P. & Colli, L. BITE: An R package for biodiversity
analyses. bioRxiv, 181610 (2017).
23. Vogelzang, C. Effects of sample size and single-vs. multiple-breed analyses on characterizing runs of homozygosity in dairy cattle
(2018).
24. Bjelland, D., Weigel, K., Vukasinovic, N. & Nkrumah, J. Evaluation of inbreeding depression in Holstein cattle using whole-genome
SNP markers and alternative measures of genomic inbreeding. J. Dairy Sci. 96, 4697–4706 (2013).
Scientific Reports | (2021) 11:2834 | https://doi.org/10.1038/s41598-021-82625-2 15
Vol.:(0123456789)You can also read