MOOSE AND DEER POPULATION TRENDS IN NORTHWESTERN ONTARIO: A CASE HISTORY - Alces
←
→
Page content transcription
If your browser does not render page correctly, please read the page content below
MOOSE AND DEER POPULATION TRENDS IN NORTHWESTERN
ONTARIO: A CASE HISTORY
Bruce Ranta1 and Murray Lankester2
311 Austin Lake Road, Kenora, Ontario, Canada P9N 4N2; retired; 2101-2001 Blue Jay Place,
1
Courtenay, British Columbia, Canada V9N 4A8; retired.
ABSTRACT: Many interrelated factors contribute to the rise and fall of white-tailed deer (Odocoileus
virginianus) and moose (Alces alces) populations in the mixed boreal forests of eastern North America
where these species often cohabit. A question not satisfactorily answered is why do moose populations
periodically decline in a pronounced and prolonged way while deer populations continue to do well
during times when habitat conditions appear good for both? Long-term historical data from the Kenora
District of northwestern Ontario, Canada provided an opportunity to better understand temporal rela-
tionships between trends in deer and moose numbers and landscape-level habitat disturbances, ensu-
ing forest succession, climate, predators, and disease. Over the past 100 years, moose and deer have
fluctuated through 2 high-low population cycles. Deer numbers were high and moose numbers were
low in the 1940s and 50s following a spruce budworm (Choristoneura fumiferana) outbreak. By the
early 1960s, deer trended downwards and remained low during an extended period with frequent
deep-snow winters; as deer declined, moose recovery was evident. Moose increased through the 1980s
and 1990s as did deer, apparently in response to considerable habitat disturbance, including another
spruce budworm outbreak and easier winters. However, despite conditions that were favourable for
both species, moose declined markedly beginning in the late 1990s, and by 2012 were at very low
levels district-wide while deer numbers remained high. Despite the moose decline being coincident
with a short-lived winter tick (Dermacentor albipictus) epizootic in the early 2000s and increasing
numbers of wolves (Canis lupus), we argue that the meningeal worm (Parelaphostrongylus tenuis)
likely played a major role in this moose decline.
ALCES VOL. 53: 159–179 (2017)
Key words: landscape disturbance, fire, wind, spruce budworm, forest succession, balsam fir, snow
depth, white-tailed deer, moose declines, population fluctuations, meningeal worm,
Parelaphostrongylus tenuis
Several factors constrained white-tailed eradication of predators, primarily wolves
deer (Odocoileus virginianus) densities and (Canis lupus), aided and abetted the expan-
distribution in the mixed-forest ecotone and sion of deer northward. Karns (1980) also
regions of the eastern boreal forest until argued that the density of deer in northern
about 200 years ago (Seton 1909, Voigt et al. mixed forests was constrained mostly by the
2000). Expansion was made possible by for- high frequency of cold, deep-snow winters
est rejuvenation resulting from human settle- rather than food limitations. Notwithstanding
ment and attendant land clearing, logging, a lack of agreement on the relative impor-
and agricultural practices, as well as tance of these limiting factors, periodic
increased frequency of forest fires (McShea increases in the abundance of deer in the
et al. 1997). As well, Mech et al. (1971) northern forests of eastern North America
documented how widespread reduction or have had consequences for caribou (Rangifer
159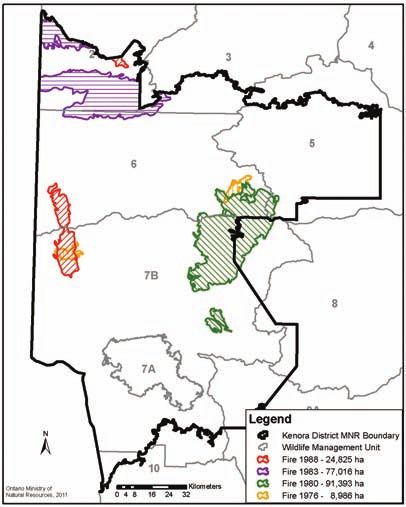
MOOSE AND DEER POPULATION TRENDS – RANTA AND LANKESTER                    ALCES VOL. 53, 2017

tarandus) (Racey and Armstrong 2000) and         formerly the Ontario Ministry of Natural
moose (Alces alces) (Anderson 1972,              Resources) is located in northwestern
Lankester and Samuel 2007).                      Ontario (Fig. 1) and is bounded by the prov-
     In the past century, deer at the northern   ince of Manitoba to the west and the Ontario
limits of their range in Ontario have reached    Districts of Red Lake, Dryden, and Fort
sustained high densities at least twice; in      Frances to the north, east, and south, respec-
the 1940s and 1950s and again in the 1990s       tively. The size of the KD changed mini-
and 2000s (Thompson 2000b). Moose                mally in 1961, was reduced in total area
declined noticeably in the Kenora District in    from 31,5302 to 14,189 km2 in 1972, and
northwestern Ontario (KD) in each of these       was increased to 19,744 km2 in 1992.
deer growth periods. These events in Ontario     Administratively, the KD consists largely of
mirrored recent prominent deer eruptions         3 Wildlife Management Units (WMUs 6,
concurrent with pronounced moose declines        7A, and 7B; Fig. 1).
in the eastern forests of mainland Nova               WMU 6 is the most northerly covering
Scotia, the northern mixed forests of            ~4,700 km2 and has had recent and extensive
Minnesota, and in adjacent northeastern          forestry activity, wildfires, and blowdowns
North Dakota (Parker 2003, Beazley et al.        (MNRF unpublished). WMU 7A, the
2006, Murray et al. 2006, Maskey 2008,           Aulneau Peninsula, is about 832 km2 and
Lankester 2010, Lenarz et al. 2010).             located south of the city of Kenora in the
Although not universally accepted (Lenarz        middle of Lake of the Woods. It has a recent
2009), the concurrence of sustained high         history of limited forest management and
deer populations and falling moose numbers       infrequent wildfire, and contains no all-
is supported by numerous anecdotal accounts      weather roads. WMU 7B lies immediately
(early authors reviewed by Anderson 1972,        south of WMU 6 and is >9,000 km2 with
Lankester and Samuel 2007) and by empiri-        limited agricultural activity near Kenora
cal data (Whitlaw and Lankester 1994a, b,        and a recent history of extensive forest man-
Maskey 2008).                                    agement and wildfire. Moose aquatic feed-
     Within the present day boundaries of        ing areas are abundant among numerous
the KD, changes in the presence and abun-        lakes, rivers, and beaver ponds in all 3
dance of a variety of cervids have been par-     WMUs.
ticularly dynamic. This area includes the             The forest of the more southerly portion
Aulneau Peninsula where, beginning in            of KD is representative of the Great Lakes –
about 1997, moose declined from more             St. Lawrence Forest Region and the more
than 1/km2 to almost none in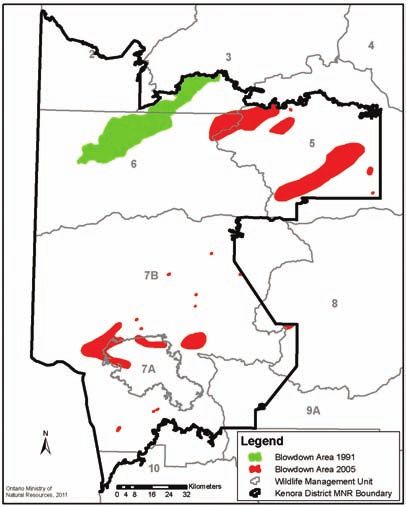
ALCES VOL. 53, 2017                                    RANTA AND LANKESTER. – MOOSE AND DEER POPULATION TRENDS

                                                                                            WMU 3

                                                                                   Red Lake District   Pakwash
                                                                                                        Lake
                                     WMU 2                                                                                              WMU 4

                                                                                                                                            Lac Seul
                                                                                           Whiskey
                                                                                             Jack
                                                                                            Forest
                                                                                                                      WMU 5
                             Umfreville
                               Lake
  M A N I T O B A

                                                       WMU 6
                                              Kenora District
                                                                     REDDITT
                                                                     "

                                                                                                                 VERMILLION BAY
                                                                                                                 "

                                                               KENORA                                                                                DRYDEN
                                                               "
                                                                                                                                                        "

                                                           Kenora                                         Dryden District                            Wabigoon
                                                                                                                                                      Lake
                                                           Forest                                                    Eagle
                                                                                                                     Lake

                                                       Lake of the             WMU 7B
                         Shoal
                         Lake
                                                       Woods (lac                                                    WMU 8
                                                        des Bois)

                                                                               SIOUX NARROWS

                                                         WMU
                                                                               "

                                                          7A
                                        Lake of
                                      the Woods                                          Kakagi Lake       WMU 9A

                                                                                                         Fort Frances District
                          U.S.A.
                                                                                                                 WMU 9B

                                                                                                                             ¯
                                                                                                            Rainy Lake
                                 Kilometers                                                                  (lac à la            Produced by the Ministry of Natural
  0            5    10           20      30       40      50                                                   Pluie)             Resources and Forestry © Queen's
                                                                                                                                  Printer for Ontario, 2017.

Fig. 1. The Kenora District including its 3 wildlife management units (WMUs 6, 7A, 7B) in
  northwestern Ontario, Canada.

                                                                                   161
MOOSE AND DEER POPULATION TRENDS – RANTA AND LANKESTER ALCES VOL. 53, 2017
from a January mean of -17 °C to a July mean Kenora (KR) and Sioux Narrows (SK).
maximum of 24.5 °C. Snow stations were located in open hard-
wood stands and snow depth (cm) was mea-
METHODS sured at 10 sites, 10 m apart, and averaged
The term KD refers hereafter to the weekly. The weekly averages were summed
actual geographical extent of the MNRF KD from the first to last snow of the season.
and applies collectively to WMUs 6, 7A, and Winter severity was equated to SDI values
7B, and as appropriate, to 2 forest manage- using the following classification: 760 = severe
Whiskey Jack MU. The boundary of the 2 (OMNR 1997, Warren et al. 1998, and with
MUs combined is not identical to that of the permission of MNRF SNOW Network for
MNRF KD; some area extends outside, but Ontario Wildlife). The SDI values from each
in total, the combined area is roughly equiv- station were averaged to provide a district-
alent in area (Fig. 1). wide SDI ranking. Mean differences between
Landscape-scale disturbance events time periods for total rainfall, snow depth
prior to European settlement and pre- index, and length of growing season were
industrial forest conditions are described in examined using Student’s t-test (two-sample,
broad terms from available internal histori- unequal variance) and accepted as different
cal reports and from survey notes on forest when P < 0.05.
cover recorded circa 1880 to 1930 (see Elkie Historical weather data including total
et al. 2009). More recent impacts including annual rainfall and the length of the frost-
spatial and temporal aspects of fires, blow- free season were obtained for the KR in the
downs, insect damage, and logging are period 1960 to 2013 from the Environment
reported at the District level and supported Canada website (http://climate.weather.
by empirical data from MNRF files. Fire gc.ca/historical_data/search_historic_
data for the period 1920 to 2010 were data_e.html). The length of the frost-free
reviewed and expressed as numbers of ha season was determined as the difference
burned annually from 1963 to 2007. Large between the first day of the first 5 consecu-
fires (>4000 ha) occurring from 1975 to tive days in spring with minimum tempera-
2010 were mapped, as were large blow- ture > 0 C and the day before the first 5
o
downs occurring since 1980. Insect infesta- consecutive days in autumn with minimum
tion data was mostly limited to outbreaks of temperature < 0 C.
o
the eastern spruce budworm (Choristoneura Several data sources were used to esti-
fumiferana) and the jack pine budworm mate past trends in deer populations, with
(C. pinus pinus). other information subjective in nature and
An index of winter severity has been formed by expert opinion. Data included
measured in the KD since 1952. Early data hunter numbers and deer harvest informa-
(Passmore 1953) were converted to a cumu- tion collected at check stations and from vol-
lative, over-winter, snow depth index (SDI) untary questionnaires. District-wide data
(Warren et al. 1998). Two snow stations have from 1955 to 1960 were limited to % hunter
existed in the KD since the onset of the pro- success, with total deer harvest and % hunter
gram; a third was added in 1960. One was in success available thereafter. Two time peri-
WMU 6 near the town of Minaki (MK); the ods were compared using information per-
other 2 were in WMU 7B near the towns of taining to the KD: 1961 to 1978 and 1999 to
2012. In the intervening time period, 1981 to
162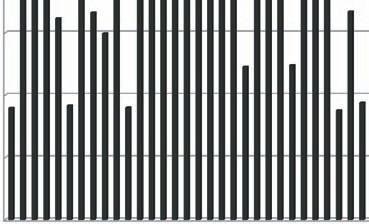
ALCES VOL. 53, 2017     RANTA AND LANKESTER. – MOOSE AND DEER POPULATION TRENDS

1997, only data from WMU 7B were exam-           hunters). Wolf (Canis lupus) sightings in
ined in detail. During the time period of        WMU 7B were estimated in 2000 to 2010
1963 to 1982, pellet group surveys in certain    using information from Provincial mail sur-
years provided additional deer density esti-     veys sent to resident and non-resident deer
mates in specific wintering areas and the        hunters.
larger landscape. Pellet group surveys in            Office files and the published literature
WMUs 6 and 7 from 1976 to 1978 followed          were searched for evidence of the presence
King (undated), and a 1982 survey in WMUs        of meningeal worm in deer and moose, as
7A and 7B followed Jones (1981). The num-        well as cases of moose sickness attributed to
ber of deer observed during moose aerial         meningeal worm infection in the KD and
inventories (MAI) in the KD were recorded        surrounding region. Anecdotal information
as the average number of deer per plot in 2      on the occurrence of giant liver fluke
periods: 1994 to 1999 and 2000 to 2012.          (Fascioloides magna) and winter tick
    Since 1957, moose numbers and popula-        (Dermacentor albipictus) were recorded.
tion trends in Ontario (including the KD)
have been estimated from mid-winter MAIs                           RESULTS
based largely on Caughley (1977a, b). After           Logging and land clearing — The
1972, MAIs were done at the WMU level            pre-industrial forest of Ecoregion 4S that
and their frequency declined after 1992.         includes the KD is believed to have been
MAIs were conducted using 16 mi2 plots           rich in conifer species (Elkie et al. 2009).
until 1975 when standardized surveys for         Compared to present-day forests, there were
WMUs were adopted using 25 km2 plots             more pure stands but similar amounts of
(McLaren 2006). Surveys were random or           young disturbed forest. In general, the
random-stratified depending on a variety of      pre-industrial forests were believed to have
factors, particularly prior knowledge of rela-   been less fragmented with larger disturbance
tive moose abundance and distribution pat-       patches from larger fires. About 20% of
terns. They were conducted using both            Ecoregion 4S is believed to have been in the
fixed-wing and rotary aircraft, and searches     mixed-wood condition (coniferous and
followed the methodology outlined by             deciduous trees), and only about 1% of the
Oswald (1997). Generally, MAIs in WMUs           forested area was comprised of pure balsam
6 and 7B were flown with the objective of        fir (Abies balsamae) stands; presently, ~55%
achieving a 90% confidence level (± 20%).        of the forested area is mixed-wood of which
However, MAIs in WMU 7A were often               7% is pure balsam fir (Elkie et al. 2009).
done with 50% coverage which tended to                Recently approved forest management
provide higher confidence levels. Voluntary      plans for the Whiskey Jack and Kenora MUs
Provincial hunter questionnaires and mail        document that logging began in the KD
surveys were also used as a proxy to provide     sometime in the early 1800s and has been
estimates of moose populations and to aid        more or less continuous since the 1880s.
moose management.                                Initially, most harvesting was from the near-
    Black bear (Ursus americana) harvests        shore areas of Lake of the Woods and other
from 1987 to 2010 in WMU 7B were esti-           large lakes in the vicinity, with the harvest
mated using returns from voluntary               rate increasing substantially after 1890. A
Provincial mail surveys (resident hunters)       paper mill was built in Kenora in 1922 fur-
and information from the returns of manda-       ther increasing the area logged annually, and
tory Validation Certificates (non-resident       a large timberstrand plant opened in 2002.

                                             163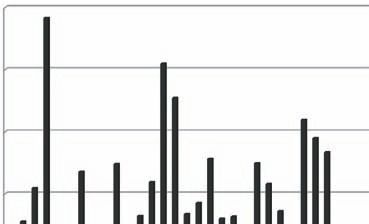
MOOSE AND DEER POPULATION TRENDS – RANTA AND LANKESTER ALCES VOL. 53, 2017
Table 1. Area of forest harvest (ha), 1990-2014, in the Kenora District Forests, Ontario, Canada.
Decade Kenora MU Whiskey Jack MU Total
1990 10,040 57,584 67,624
2000 13,263 32,425 45,688
2010 (4 years, 40% of decade) 5797 2368 8165
Table 2. Area of landscape-scale disturbances (ha) in the Kenora District, Ontario, Canada.
Fire Blowdowns Spruce budworm (1980-98)
Year Area (ha) Year Area (ha) Defoliation Area (ha)
1920s 108,942 1991 50,935 Moderate to severe 26,175
1930s 77,028 2005 67,942
1940s 8,373 High tree mortality 2,301,341
1950s 1,758
Although the paper mill in the city of Kenora frequent in the 1940s and 1950s (Table 2).
closed in 2005, a number of local sawmills More recently, in the mid-1970s to the late
continue to operate. The area logged annu- 1980s, large areas were again burned, mainly
ally has varied, but generally, a few 1000 ha by big fires in 1976, 1980, 1983, and 1988
of forest are cut annually (< 1% of the total (Fig. 2 and 3). The area burned annually
area of KD). Harvest data for the Kenora and from 1989 to 2007 was relatively small
Whiskey Jack MUs were available starting (generally < 100 ha/year) and has remained
in 1990 (Table 1), and MNRF forestry staff so; of note is the absence of fires since 1933
report that the greatest amount of harvesting on the Aulneau Peninsula (WMU 7A).
occurred during the 1990s. Clearings associ- Blow-down — In some years, blow-
ated with early European settlement created down affects large swaths of living forest in
an area of a few 1000 ha of field and pasture the KD; forestry staff report that, in general,
near the present city of Kenora. small blowdown events occur annually. A
Clearcut logging, the silvicultural prac- large blowdown in 1991 covered > 63,600
tice most commonly used in the KD, pro- ha, much of it in WMU 6, and a number of
duces an abundance of summer forage, blowdown events in 2005 totaled ~93,000 ha
although the interior of very large clearcuts (Table 2, Fig. 4).
(e.g., cover-to-cover distance >400 m) may Insect damage — Landscape-scale insect
be used little by deer (Thomas et al. 1979, damage is attributed to spruce budworm, jack
Roseberry and Woolf 1998) or moose pine budworm, and forest tent caterpillar
(Hamilton et al. 1980, Thompson and (Malacosoma disstria). Two infestations of
Vukelich 1981, Allen et al. 1987). However, spruce budworm in the past century caused
owing to terrain and other factors, clearcuts substantial mortality of balsam fir, and to a
in the KD have tended to be relatively small. lesser extent, white spruce (Picea glauca).
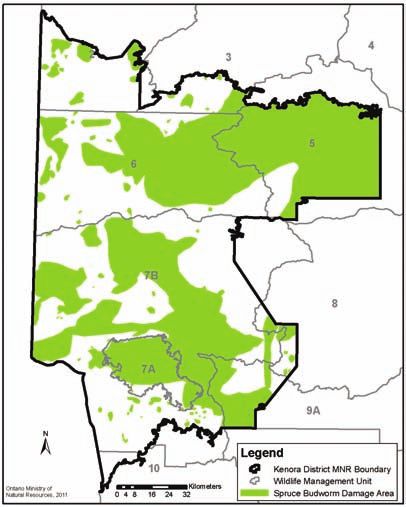
Fire — The amount of area burned each Jack pine budworm outbreaks tend to be
year in the KD has varied from 100,000 ha. Large areas burned in the break resulted in extensive mortality of jack
1920s and 1930s, with fires much less pine in certain areas in 2007-2008. Forest tent
164ALCES VOL. 53, 2017 RANTA AND LANKESTER. – MOOSE AND DEER POPULATION TRENDS
Fig. 2. Number of hectares burned from 1963 to 2007, Kenora District, Ontario, Canada.
Fig. 3. Forest fires >4,000 ha from 1975 to 2010, Fig. 4. Large blow-downs in forests from 1980 to
Kenora District, Ontario, Canada. 2010, Kenora District, Ontario, Canada.
caterpillar outbreaks are cyclical (~10 years), sizeable portion of the KD. The second spruce
but they prefer aspen (Populus spp.) and trees budworm epidemic occurred from about 1980
tend to recover quickly from defoliation. to 1998, with >8.3 million ha of Ontario for-
In 1934, a spruce budworm outbreak ests infested. Substantial tracts of forest in the
reached ‘epidemic proportions’ and by the KD were categorized as having “moderate to
end of the outbreak in 1947, 5.3 million ha of severe defoliation” and >2 million ha had
Ontario had been infested, including a “high tree mortality” (Table 2, Fig. 5).
165MOOSE AND DEER POPULATION TRENDS – RANTA AND LANKESTER ALCES VOL. 53, 2017
portion of the Aulneau and some parts of
WMU 7B had a pronounced loss of conifer-
ous canopy cover as a result of the jack pine
budworm outbreak in 2007-2008. Although
these infestations result in minimal growth
of arboreal lichen on dead and dying jack
pine trees, removal of the over-story likely
stimulated growth in the understory.
Winter snow depth — Winter severity
rankings for the 3 snow stations (SN, KR,
and MK) ranged from very mild to severe
(Fig. 6). Mean (± SD) annual SDIs were
greater (P = 0.03) in the period from 1960 to
1980 (801 ± 231) than in the subsequent
period from 1981 to 2014 (632 ± 241). The
most southerly station (SN) had lower (P =
0.03) mean SDI in the period from 1960 to
2014 (616 ± 235) than the two more north-
erly stations that were similar (KR = 732 ±
Fig. 5. Forests with significant spruce budworm 266; MK = 719 ± 244). Severe winters with
damage in 1998, Kenora District, Ontario, an SDI > 760 were most frequent in the
Canada.
20-year period from 1960 to 1980 when 11
winters were rated as severe and only 3 as
Before the second spruce budworm mild (90 cm were recorded in only 2 win-
lichens had been (presumably) consumed. ters (1955-56 and 2013-14). In the MK
The Aulneau Peninsula — Of particu- depths >80 cm were recorded for 3 consecu-
lar note is WMU 7A, the Aulneau Peninsula tive weeks in 1954-55, and for 7 consecutive
which had no large fires or blowdown since weeks the following year. In the winter of
1933 (OMNR 2003), although the effects 1965-66, all 3 snow stations had 1 weekly
from spruce budworm were widespread recording >80 cm; a single weekly reading
(Fig. 5). Beginning in 1964, however, was 81 cm at KR in 1977-78. During the
~15,000 m3 were logged annually, generally recent severe winter of 2013-14, snow depth
as small (80 cm occurred at both KR and MK; the
District staff believe greatly improved maximum depth was 72 cm at SN.
moose habitat conditions; logging ceased Annual rainfall and length of the frost-
in 1986 and has not resumed. A substantial free season — The amount of rainfall and
166ALCES VOL. 53, 2017 RANTA AND LANKESTER. – MOOSE AND DEER POPULATION TRENDS
1400
1200
Mild < 590
Moderate 591-760
Severe > 760
1000
800
SDI
600
400
200
0
Year
Fig. 6. Snow depth index (SDI) averaged for 3 snow stations (Sioux Narrows, Kenora, and Minaki)
from 1952 to 2014, Kenora District, Ontario, Canada.
the length of the frost-free season are climat- Trends in deer numbers — By the
ically important in the external survival and 1930s, deer were numerous in the KD and
transmission of parasites such as D. albipic- stayed high during the 1950s and early 1960s
tus and P. tenuis. The 20-year period from (Cumming 1972). By the late 1960s, deer
1970 to 1990 that had several large fires also numbers began to decline, increased some-
received less (P = 0.01) rain (474 ± 115 mm) what, again declined, then remained rela-
than in the following 20-year period from tively low until the mid-1980s (Fig. 7).
1991 to 2012 (609 ± 120 mm). The mean Thereafter, deer numbers steadily increased,
length of the frost-free period between these peaking about 2007. In 2014 a severe winter
time periods was not different (185 ± 16 vs. resulted in high deer mortality and likely
188 ± 18 days), ranging from 156 to 214 days substantial recruitment failure. Declining
and 156 to 223 days, respectively. hunter success and field observations sug-
Historical cervid populations — In the gested that deer in the northern portions of
late 1800s, caribou and moose occurred in what KD and deer away from settlements were
is presently KD (Cumming 1972, Darby et al. most affected.
1989). Seton (1909) believed that deer were Records of the number of hunters and
largely absent until the late 1800s, but some elk deer harvest for WMUs 6, 7A, and 7B
(Cervus elaphus) were extant. Caribou range showed a similar trend from 1974 to 2012
began to recede northwards concurrent with (Fig. 8). The annual deer harvest fluctuated,
the increase in deer numbers (Racey and but was relatively low through the 1970s. By
Armstrong 2000), with elk disappearing also; the late 1990s, hunter interest and success
moose remain extant to the present. rates had begun to increase and remained
167MOOSE AND DEER POPULATION TRENDS – RANTA AND LANKESTER ALCES VOL. 53, 2017
1.2 0.7
Bud Worm 18 yrs
Fires (4)
0.6
1
Estimated Moose Density (# / sq km)
Deer Harvest Success (# deer per hunter)
0.5
0.8
0.4
0.6
Blowdowns
We er Period 0.3
Deeper Snow Less Snow
0.4
Drier Period 0.2
0.2
0.1
0 0
Moose Pop'n Density Deer Harvest Success
Fig. 7. Changes in deer and moose numbers in relation to landscape scale habitat disturbances from
1955 to 2014, Kenora District, Ontario, Canada.
7000 WMU 6
14
6000 WMU 7A
Ave. no. deer seen/moose
5000
12
WMU 7B
Number
4000 Harvest 10
3000 8
No
plot
2000 Hunters
6
1000
4
0
2
06
08
99
10
74
75
76
77
78
00
01
02
03
04
05
07
09
11
12
19
19
19
19
19
19
20
20
20
20
20
20
20
20
20
20
20
20
20
Year
0
06
08
12
94
96
98
00
02
04
10
19
19
19
20
20
20
20
20
20
20
Fig. 8. Deer hunters and harvest for WMUs 6, Year
7A, and 7B, 1974 to 2012, in the Kenora
District, Ontario, Canada. Fig. 9. Number of deer observed per moose aerial
survey plot in WMUs 7A, 7B, and 6, Kenora
District, Ontario, Canada.
high except in 2008 and 2011. In 2002, deer
hunting regulations were relaxed and hunt- Spring pellet group surveys provided a
ers could purchase additional antlerless deer few disjunct estimates of winter deer popu-
tags in WMUs 6, 7A, and 7B. Data from this lations in portions of WMU 7 in 1976 and
additional deer kill is only available starting 1977, and the entire WMU 6 in 1978 (Ranta
in 2008, hence, total deer kill in 2002-2007 and Shaw 1982). Density estimates were:
is under reported. The number of deer WMU 7 - 1976, 4/km2 (14,557 ± 54.4%);
observed per moose plot clearly increased in WMU 7 - 1977, 4/km2 (15,515 ± 28.9%);
each of the 3 WMUs by the late 1990s, con- WMU 6 - 1978, 1/km2 (3,362 ± 36.93%).
tinuing through 2006 (Fig. 9). Recalculation of the WMU 7 - 1977 survey
168ALCES VOL. 53, 2017 RANTA AND LANKESTER. – MOOSE AND DEER POPULATION TRENDS
data led to a higher estimate of 31,000 deer. 600
WMU 7B - Moose, Bear Harvest; Wolves Seen
In 1979, in response to a suspected drastic Resident Moose Harvest
Wolves Seen (10%)
population decline after a severe winter, sup- 500 Bear Harvest (all)
plementary pellet group surveys were per- 400
formed and indicated that the deer population
Number
in WMU 6 had declined 75% from the previ- 300
ous year, and in WMU 7, 55% from 2 years 200
previous. The mid-winter deer population
estimate from pellet group surveys in 1982 100
was only 47 ± 76.8% in WMU 7A and 0
10,231 ± 41.2% in WMU 7B (Ranta and
84
87
90
93
96
99
02
05
08
19
19
19
19
19
19
20
20
20
Shaw 1982). Deer numbers were considered
Fig. 10. Hunter harvest of moose and bear, and
relatively low throughout the period of 1976 number of wolves observed by hunters in
to 1982. WMU 7B, 1984-2010, Kenora District,
Trends in moose numbers — Moose Ontario, Canada.
were described as fairly common in the Lake
of the Woods area by Europeans as early as
1731 (Cumming 1972, Darby et al. 1989). very low numbers by 2012 (Fig. 7). Moose
The population declined in the 1800s with hunter survey information in WMU 7B (Fig.
the growing population of settlers, survey 10) was used to corroborate the MAI data.
crews, and road builders relying largely on Increased harvest began in the late 1980s until
market meat. In response to perceived low about 2001, after which success rates began to
populations, the moose hunting season was decline to present day lows. Concurrently,
closed across the entire province from 1888 deer numbers increased until about 2007,
to 1895; thereafter, moose numbers appar- remaining high to 2012 (Fig. 8). After the
ently increased. severe winter of 2014, deer numbers declined
There are few estimates of moose num- throughout the KD and adjacent Districts
bers in the KD in the early years of the 20th (unpublished MNRF data).
century. Cumming (1972) reported that the When the MAI data for the 3 WMUs are
Royal Ontario Museum (from question- examined separately for the years 1980 to
naires) believed that the provincial moose 2010, it appears that the timing of the moose
population declined prior to WWII, increased decline differed slightly in each (Fig. 11). A
during the war years, but was considered decline from high density was first evident
low in 1949 when the hunting season was in the most southerly unit (WMU 7A) after
again closed. It was re-opened in 1951 when 1995, a distinct decline occurred in WMU 7B
populations across the province appeared to after 2001, and decline occurred after 2004 in
have increased, although actual population the most northerly WMU 6; numbers remain
estimates only began in the late 1950s. low in all. In 1972 on the Aulneau peninsula
In 1957, MAI data indicated that moose (WMU 7A), the moose population was esti-
were at fairly constant and moderate density mated at only ~80 animals (about 0.1/km2),
of ~0.2/km2 (Fig. 7). As deer numbers declined but by 1994 had peaked at ~1000 animals
in the 1960s, moose numbers increased (about 1.0/km2) with numbers still relatively
slowly, continuing into the late 1980s and high in 2000; however, rapid decline occurred
1990s when they peaked ~ 0.4/km2; beginning thereafter, and an aerial survey estimated
about 1995, moose began to decline reaching only ~30 animals in 2011 (< 0.04/km2).
169MOOSE AND DEER POPULATION TRENDS – RANTA AND LANKESTER ALCES VOL. 53, 2017
1.4
WMU 6
were reported to the District Office during
the 12-year period 1980 to 1992 (Whitlaw
Moose density (moose/km2
1.2 WMU 7A
1
WMU 7B
and Lankester 1994b). In the early 2000s,
0.8
one of the authors (Ranta) examined a num-
0.6
ber of sick, dying, and dead moose from
WMUs 6 and 7B that displayed classical
0.4
symptoms of meningeal worm infection.
0.2
The disease has been documented in adja-
0
cent southeastern Manitoba where Lankester
(1974) recorded 13 cases within a 12-month
Year
period in 1972-73.
Fig. 11. Moose estimated from aerial inventory Giant American liver fluke (Fascioloides
in WMUs 6, 7A, and 7B in 1975 to 2012, magna) is known to occur in deer of the KD
Kenora District, Ontario, Canada.
but no data exist about its relative abun-
dance. We know of no reports from hunters
Predators — Both black bears and tim- of noticeably infected moose for at least the
ber wolves are common and ubiquitous in all last 3 decades. Winter ticks are regularly
3 WMUs. Data from early years are largely seen on moose in early spring, and reports
limited to anecdotal information, but no con- from outfitters, trappers, and moose hunters
cerns about either animal being ‘rare’ or in suggest that a substantial die-off of moose
decline are on record. Bear harvest from occurred in WMUs 7A and 7B in 2000 and
1988 to 2009 rapidly increased, peaking 2001 when moose density was high (Fig. 7
around 1996 in all WMUs (Fig. 10). and 11). Anecdotal evidence on the Aulneau
Thereafter, harvest declined sharply with the Peninsula included a number of moose skel-
lowest combined harvests in 2006 and 2007 etons located the following spring, summer,
across the WMUs; harvest declined least on and fall.
the Aulneau (WMU 7A) and most in WMU
7B. Records of wolf sightings by deer hunt- DISCUSSION
ers in WMU 7B began in 2000 and indicated Data presented here indicate that deer
an initial wolf decline for 3 years, followed and moose populations in KD have experi-
by a large increase to 2010 (Fig. 10). enced significant population swings over the
Evidence of meningeal worm and past 100 years, and disturbances at the land-
other pathogens — A number of surveys scape scale have impacted both species.
have documented the continued presence of Logging and land clearing are likely respon-
P. tenuis larvae in deer feces and moose sible for the initial invasion and subsequent
deaths attributed to meningeal worm in maintenance of deer in the District, despite
northwestern Ontario and adjoining regions. periodic die-offs associated with severe win-
The prevalence of first-stage larvae in deer ters. Both logging and fire are also believed
pellets ranged from 57-85% in the KD responsible for an increase in moose in
(Saunders 1973, Whitlaw and Lankester British Columbia and northern Ontario
1994b, McIntosh 2003) and 86% in the adja- (Thompson and Stewart 1998). In Ontario,
cent Fort Frances District (McIntosh 2003). relatively high moose populations are typi-
Also in the Fort Frances District, 3 cases of cally found in forested areas with a mosaic of
moose sickness caused by P. tenuis were vegetation types providing a high intersper-
diagnosed by Anderson (1965) and 14 cases sion of cover and forage (Rempel et al. 1997).
170ALCES VOL. 53, 2017 RANTA AND LANKESTER. – MOOSE AND DEER POPULATION TRENDS
Formalized moose habitat guidelines used in adjacent to the large burns of the 1980s, but
Ontario and the KD since 1988 provide a more recent surveys indicate few moose in
detailed summary of the benefits of good for- these same areas. The association of moose
est management practices (OMNR 2010). with early seral stages of post-fire habitat
Logging, combined with forest fire sup- has long been recognized (Peek 1997).
pression, leads to shifts in forest composi- Kelsall et al. (1977) concluded that the opti-
tion and structure (Carleton 2000). Balsam mal successional stage for moose in the
fir is one species that becomes more promi- boreal forest occurred 11 to 30 years post-
nent in managed forests (Thompson 2000a), burn, and moose in Alaska respond posi-
making the forest more susceptible to spruce tively to fires as early as 5 years post-burn
budworm infestation and blowdown. (Schwartz and Franzmann 1989). Although
Infestations cause stand mortality after 5 deer have an abundance of food in the early
consecutive years of defoliation (Fleming et aftermath of fire, the loss of conifer cover in
al. 2002) followed by peeling bark, growth winter yarding areas can seriously jeopar-
of draped arboreal lichen (Usnea spp.), and dize winter survival (Hanley and Rose 1987,
top breakage culminating in wind-throw 5 to Broadfoot and Voigt 1996). Fires can elimi-
8 years later. Peaks of deer abundance in the nate balsam fir from stands (Thompson
mid-1900s and early 2000s appear to be 2000a), and little balsam fir was left in the
strongly associated with fir mortality and KD burns. Because these large burned areas
associated abundance of lichen. While bal- lacked winter conifer cover and associated
sam fir is generally not considered preferred lichen as winter forage (Usnea spp. do not
deer browse (e.g., Ullrey et al. 1968, Mautz thrive on fire-killed balsam fir), these burns
et al. 1976), the arboreal lichen associated presumably become unsuitable for deer in
with dead and dying balsams is heavily deep snow.
used by deer during winter (Hodgman and A severe winter can dramatically lower
Bowyer 1985). Usnea spp. compares favour- deer density on northern ranges and limit
ably with respect to crude protein, available range occupancy (Potvin et al. 1981). High
energy, and relatively high digestibility of mortality can occur when deep snows of
typical hardwood winter browse (Hodgman long duration are coupled with extreme cold
and Bowyer 1985, Gray and Servello 1995). (Severinghaus 1947, Verme 1968, Verme
No evidence of impacts to deer or moose and Ozoga 1971), conditions that affect
were evident from forest tent caterpillar out- fawns in particular (Karns 1980). The com-
breaks, although both species would pre- bination of severe winter conditions and pre-
sumably have access to improved quality dation by wolves produces higher deer
and quantity of understory forage in the mortality than either factor acting alone
immediate aftermath of an outbreak. (Mech et al. 1971).
Similarly, the effects of the jack pine bud- Winter severity indices are helpful to
worm and associated loss of coniferous can- identify winters when substantial deer losses
opy should seasonally benefit both deer and likely occur, but the typical values measured
moose. most years in the KD are not believed high
The last peak in the KD moose popula- enough to negatively impact moose. Peek
tion is attributed primarily to the large fire (1997) found moose tolerant of snow depths
events of the 1980s; considerably less area up to 80 cm, and Coady (1974) identified
has burned since. MAI found high concen- 90 cm as a critical depth when adults have
trations of animals in and immediately restricted movement and access to forage.
171MOOSE AND DEER POPULATION TRENDS – RANTA AND LANKESTER ALCES VOL. 53, 2017
Winters with snow depths >90 cm are rare in 2018), and our observations parallel those in
the KD, but depths of >40 cm that restrict other regions.
deer movement occur regularly (Kelsall and Moose with winter tick-associated hair
Prescott 1971). Weekly SDI values indicate loss were commonly observed during MAI
that snow depths >75 cm occur occasionally. surveys in the Kenora MU and unusually
At these depths, deer are in a severe energy high over-winter mortality was reported fol-
deficit due to restricted and energy-costly lowing the winters of 2000 and 2001 when
movement, even when browse is abundant moose densities were still relatively high.
(Potvin and Huot 1983). Carcasses and skeletal remains found in a
Both moose and deer populations in the fashion inconsistent with mortality from pre-
KD increased during the 1980s and 1990s in dation were likely due to disease or parasit-
response to increased forage created by a ism, but the exact cause of these winter
variety of large landscape scale disturbances, mortalities was never identified. Winter tick
and low snow depths that specifically favour numbers are not influenced by the presence
deer survival. Moose experienced a pro- or absence of deer and they have their great-
nounced decline beginning about 1995, est impact when moose densities are high.
reaching very low levels by 2012 as deer These ticks typically cause late winter mor-
numbers remained high. Similar moose tality for a few successive years and then
declines occurred concurrently in eastern subside in abundance at lower moose den-
North America and in jurisdictions neigh- sity or environmental conditions that reduce
bouring the KD. For example, populations larval survival and/or the questing period.
began to decline in the early 1990s and were Winter ticks alone are not thought to be
reduced to low numbers by 2003 in Nova capable of driving moose populations to low
Scotia (Beazley et al. 2006), moose declined levels in a short time frame (Lankester
in the late 1980s with few occurring by the 2010).
early 2000s in northwestern Minnesota The giant liver fluke is not prominent in
(Murray et al. 2006), and numbers peaked the KD and cannot be considered a major
about 1995 but moose had virtually disap- contributor to the moose decline, as this
peared in northeastern North Dakota by parasite has not been proven to cause large-
2006 (Maskey 2008). A similar increase in scale moose mortality. Heavy fluke infec-
deer and decline in moose also occurred in tions were interpreted as being significant
southeastern Manitoba during this time in a declining moose population in north-
frame (V. Crichton, Manitoba Fish and eastern Minnesota (Murray et al. 2006), yet
Wildlife, retired, pers. comm.). These flukes were equally common when that same
declines followed periods of shorter, less moose population was increasing 20 years
severe winters that sustained high density earlier (Karns 1972, Lankester 2010). Flukes
populations of deer with meningeal worm were not considered important in the moose
(Lankester 2018); longer and wetter growing decline in adjacent northeastern North
seasons were also associated with some Dakota (Maskey 2011) and do not occur
of these declines (Maskey et al. 2015). in Nova Scotia (Pybus 2001) where pro-
Typically, declines continued for 15-20 years nounced moose declines have occurred
reaching very low levels that persist to the twice.
present. It has been argued that the menin- Records of wolf sightings by deer hunt-
geal worm was a principal cause of these ers became increasingly common in the KD
declines (Maskey 2008, Lankester 2010, from about 2000 to 2012, the same period in
172ALCES VOL. 53, 2017 RANTA AND LANKESTER. – MOOSE AND DEER POPULATION TRENDS
which deer reached peak numbers and moose Hunting can reduce deer and moose
declined to low levels. This was also the numbers and significant declines may result,
period in which the effects of meningeal especially when stricter regulations are not
worm on moose were expected to be greatest implemented quickly enough in response
making it difficult to separate the relative to natural stochastic population changes
roles of parasites and wolves in the decline. (Fryxell et al. 2010). However, there is little
Classically, wolves increase in response to evidence that inordinately high hunter har-
increased deer numbers and may depress vest (Fig. 10) caused the abrupt and pro-
productivity of co-habiting moose by prey- longed decline of moose in the KD. Deer
ing disproportionately on calves. Wolves are invariably decline following severe winters,
also likely to find moose handicapped by and hunter harvest played a minimal role in
P. tenuis infection particularly easy prey. the 1970s decline (Ranta 1982). Further,
Yet, in most instances, wolves are not deer began to increase in the 1980s and con-
expected to reduce their prey to extremely tinued to increase until about 2007 despite
low levels (Mech 1970, Mech and Karns increasing hunting pressure.
1977). As well, several studies have shown Several climatic factors known to
that where deer and moose co-exist, wolves enhance transmission of P. tenuis circum-
tend to concentrate on deer whether deer stantially support a major role for this par-
numbers are increasing or declining (Pimlott asite in the KD moose decline. Shorter
et al. 1969, Mech et al 1971, Potvin et al. winters with less snow and lower SDIs dur-
1988). ing the 1990s and 2000s allowed increased
A prominent role for wolves in declines deer densities, and in particular, increased
elsewhere is even less likely as wolves do not survival of fawns. Fawns are the biggest
occur in mainland Nova Scotia, and the resi- producers of the parasite’s larval stages
dent eastern coyote (Canis latrans) is not and an early spring increases larval sur-
considered a significant predator of moose vival (Lankester 2018, in press). Also, the
(Parker 2003) or to have played a substantial length of frost-free seasons during this
role in mainland Nova Scotia moose being period increased, albeit marginally, but
declared “endangered” after the recent growing seasons were much wetter than in
decline. Nor were wolves considered a main the previous 20 years. Precipitation is an
factor in moose declines in northwestern important driver of terrestrial gastropod
(Lenarz et al. 2009) or northeastern Minnesota populations and determines the extent to
(Murray et al. 2006), or in neighbouring which they move on the forest floor to
northeastern North Dakota (Maskey 2008). become infected and ingested by cervids
However, Mech and Fieberg (2014) argued (Wasel et al. 2003).
for caution in accepting the conclusion of Caribou are much more susceptible than
Lenarz et al. (2009) that e levated winter tem- other cervids to neurological disease caused
peratures caused the impending decline of by meningeal worm infection (Anderson
moose populations in northeastern Minnesota, 1972). Records of range recession of caribou
and instead suggested a stronger role for in northwestern Ontario indicate that caribou
wolves. Current research has identified that P. disappeared from most of the present day
tenuis and wolf predation are principal mor- KD during the first era of high deer densities
tality factors in Minnesota moose (M. (Darby et al. 1989), and are now found only
Carstensen, Minnesota Department of Natural on the northern fringe of the KD (Ranta
Resources, pers. comm.). 2001).
173MOOSE AND DEER POPULATION TRENDS – RANTA AND LANKESTER ALCES VOL. 53, 2017
CONCLUSION REFERENCES
Landscape level factors, working in syn- Allen, A. W., P. A. Jordan, and
ergy, have been primary population-level J. W. Terrell. 1987. Habitat Suitability
drivers behind widely fluctuating popula- Index Models: Moose, Lake Superior
tions of deer and moose in the KD in much Region. United States Fish &
of the past century. However, habitat avail- Wildlife Service Biological Report 82
ability, winter conditions, and predation can- (10.155). U.S. Department of the
not adequately explain the moose decline in Interior, Fish and Wildlife Service
the KD. Much evidence suggests that pro- Research and Development, Washington,
D. C., USA.
nounced and prolonged declines in moose
Anderson, R. C. 1965. An examination of
populations result when specific conditions wild moose exhibiting neurologic signs,
occur concurrently: 1) when the distribution in Ontario. Canadian Journal of Zoology
of moose and infected (P. tenuis) deer are 43: 635-639.
sympatric, 2) when winter conditions are _____. 1972. The ecological relationships of
generally favourable for survival, growth, meningeal worm and native cervids in
and expansion of deer populations for many North America. Journal of Wildlife
consecutive years (e.g., > 10 years), and 3) Diseases 8: 304-310.
when environmental conditions are favour- Beazley, K., M. Ball, L. Isaacman.
able for the survival and mobility of terres- S. Mcburney, P. Wilson, and T. Nette.
trial gastropods required for transmission of 2006. Complexity and information gaps
the meningeal worm - as illustrated in Fig. 7. in recovery planning for moose (Alces
alces americana) in Nova Scotia,
We suggest that the meningeal worm played
Canada. Alces 42: 89-109.
a major role in the recent moose decline in
Broadfoot, J. D., and D. R. Voigt. 1996.
the KD and is likely to have done so repeat- White-tailed deer migration behaviour:
edly in several locations in eastern North a resource management perspective.
America within the past century (Lankester STERS Technical Report No. 5. Ontario
2018). Ministry of Natural Resources, Toronto,
Ontario, Canada.
ACKNOWLEDGEMENTS Carleton, T. J. 2000. Vegetation responses
The authors thank the many staff of the to the managed forest landscape of
central and northern Ontario. Pages
Ontario Ministry of Natural Resources and
178-197 in A. H. Perera, D. L. Euler,
Forestry who helped in the collection and
and I. D. Thompson, editors. Ecology
analyses of data over many years. In particu-
of a Managed Terrestrial Landscape.
lar, we thank L. Anderson and C. Martin for University of British Columbia
their efforts in tabulating data and assisting Press, Vancouver, British Columbia,
in the production of the figures used in the Canada.
manuscript. Special thanks are extended to Caughley, G. 1977a. Analysis of Vertebrate
the Kenora District Fire and Information Populations. John Wiley and Sons,
Management staff and those associated with London, England.
the Snow Network for Ontario Wildlife who _____. 1977b. Sampling in aerial survey.
graciously provided the data on landscape Journal of Wildlife Management 41:
level disturbances and winter severity. 605-615.
Mr. G. Gordon assisted with some graphics Coady, J. W. 1974. Influence of snow on
and Dr. D. Euler kindly read the manuscript behavior of moose. Naturaliste Canadien
and offered helpful suggestions. (Quebec) 101: 417-436.
174ALCES VOL. 53, 2017 RANTA AND LANKESTER. – MOOSE AND DEER POPULATION TRENDS
Cumming, H. G. 1972. The Moose in Ontario. Pacific Northwest Research Station,
Ontario Ministry of Natural Resources, Portland, Oregon, USA.
Toronto, Ontario, Canada. Hodgman, T. P., and R. T. Bowyer. 1985.
Darby, W. R., H. R. Timmerman, J. B. Winter use of arboreal lichens,
Snider, K. F. Abraham, R. A. Stefanski, Ascomycetes, by white-tailed deer,
and C. A. Johnson. 1989. Woodland Odocoileus virginianus, in Maine.
Caribou in Ontario: Background to a Canadian Field-Naturalist 99: 313-316.
Policy. Ontario Ministry of Natural Jones, S. L. 1981. How to conduct deer fecal
Resources, Toronto, Ontario, Canada. counts or what you always wanted to
Elkie, P., M. Gluck, J. Boos, J. Bowman, know about doing a spring deer survey,
C. Daniel, J. Elliott, D. Etheridge, but were afraid to ask. Unpublished
D. Heaman, G. Hooper, R. Kushneriuk, report. Ontario Ministry of Natural
G. Lucking, S. Mills, B. Naylor, Resources, Toronto, Ontario, Canada.
F. Pinto, B. Pond, R. Rempel, K. Ride, Karns, P. D. 1972. Minnesota’s 1971 moose
A. Smiegielski, G. Watt, and M. Woods. hunt: a preliminary report on the biolog-
2009. Science and Information in ical collections. Proceeding of the North
Support of the Forest Management American Moose Conference and
Guide for Landscapes: Package “A” Workshop. 8: 115-123.
Simulations, Rationale and Inputs. _____. 1980. Winter – the grim reaper. Pages
Ontario Ministry of Natural Resources, 47-53 in R. L. Hine and S. Nehls, edi-
Forest Policy Section, Toronto, Ontario, tors. White-tailed Deer Population
Canada. Management in the North Central States.
Fleming, R. A, J. Candau, and R. S. Proceedings of 1979 Symposium, 10
Mcalpine. 2002. Landscape-scale analy- December 1979. 41st Midwest Fish and
sis of interactions between insect defoli- Wildlife Conference, Urbana, Illinois,
ation and forest fire in central Canada. USA.
Climatic change 55: 251-272. Kelsall, J. P., and W. Prescott. 1971.
Fryxell, J. M., C. Packer, K. Mccann, Moose and deer behaviour in snow in
E. J. Solberg, and B. E. Sæther. 2010. Fundy National Park, New Brunswick.
Resource management cycles and the Canadian Wildlife Report Series 15.
sustainability of harvested wildlife _____, E. S. Telfer, and T. D. Wright. 1977.
populations. Science 328: 903-906. The effects of fire on the ecology of the
Gray, P. B., and F. A. Servello. 1995. boreal forest, with particular reference
Energy intake relationships for white- to the Canadian north: a review and
tailed deer on winter browse diets. selected bibliography. Canadian Wildlife
Journal of Wildlife Management 59: Service Occasional Papers Number 32.
147-152. King, D. R. Undated. Instructions for con-
Hamilton, G. D., P. D. Drysdale, and ducting stratified random pellet group
D. L. Euler. 1980. Moose winter brows- and dead deer surveys. Unpublished
ing patterns on clearcuttings in northern report. Ontario Ministry of Natural
Ontario. Canadian Journal of Zoology Resources, Toronto, Ontario, Canada.
58: 1412-1416. Lankester, M. W. 1974. Parelaphostrongylus
Hanley, T. A., and C. L. Rose. 1987. tenuis (Nematoda) and Fascioloides
Influence of Overstory on Snow Depth magna (Trematoda) in moose of south-
and Density in Hemlock Spruce Stands: eastern Manitoba. Canadian Journal of
Implications for Deer Management in Zoology 52: 235-239.
Southeastern Alaska. Resources Note _____. 2010. Understanding the impact of
PNW-RN-459. USDA Forest Service, meningeal worm, Parelaphostrongylus
175MOOSE AND DEER POPULATION TRENDS – RANTA AND LANKESTER ALCES VOL. 53, 2017
tenuis, on moose populations. Alces 46: Digestibility and related nutritional data
53-70. for seven northern deer browse species.
_____. 2018. Weather-enhanced trans Journal of Wildlife Management 40:
mission of meningeal worm, 630-638.
Parelaphostrongylus tenuis, in white- McIntosh, T. E. 2003. Movements, survival
tailed deer and implications for moose. and habitat use by elk (Cervus elaphus)
Alces 54: in press. reintroduced to northwestern Ontario.
______, and W. M. Samuel. 2007. Pests, M.Sc. Thesis, Lakehead University,
parasites and diseases. Pages 479-517 in Thunder Bay, Ontario, Canada.
A. W. Franzmann and C. C. Schwartz, McLaren, M. 2006. Standards and
editors. Ecology and Management of the Guidelines for Moose Population
North American moose. Second edition. Inventories in Ontario. Technical Report
University Press of Colorado, Boulder, Number SSI-121. Southern Science and
Colorado, USA. Information, Ontario Ministry of Natural
Lenarz, M. S. 2009. A review of the ecology Resources, North Bay, Ontario, Canada.
of Parelaphostrongylus tenuis in rela- McShea, W. J., H. B. Underwood, and
tion to deer and moose in North America. J. H. Rappole. 1997. Deer management
Pages 70-75 in M. W. DonCarlos, and the concept of overabundance.
R. O. Kimmel, J. S. Lawrence, and Pages 1-7 in W. J. McShea, H. B.
M. S. Lenarz, editors. Summaries of Underwood, and J. H. Rappole, editors.
Wildlife research Findings. Minnesota The Science of Overabundance: Deer
Department of Natural Resources, Ecology and Population Management.
St. Paul, Minnesota, USA. Smithsonian Institute Press, Washington
_____, M. E. Nelson, M. W. Schrage, and D. C., USA.
A .J. Edwards. 2009. Temperature medi- Mech, L. D. 1970. Wolf: The Ecology and
ated moose survival in northeastern Behaviour of an Endangered Species.
Minnesota. Journal of Wildlife University of Minnesota Press, St. Paul,
Management 73: 503-510. Minnesota, USA.
_____, J. Fieberg, M. W. Schrage, and _____, L. D. Frenzel, and P. D. Karns.
A J. Edwards. 2010. Living on the 1971. The effect of snow conditions on
edge: viability of moose in northeastern the vulnerability of white-tailed deer to
Minnesota. The Journal of Wildlife wolf predation. Pages 51-59 in L. D.
Management 74: 1013-1023. Mech and L. D. Frenzel Jr., editors.
Maskey, J. J. 2008. Movements, resource Ecological Studies of the Timber Wolf
selection, and risk analyses for parasitic in Northeastern Minnesota. Resource
disease in an expanding moose popula- Paper #NC-52. United States Department
tion in the northern Great Plains. Ph. D. of Agriculture, Forest Service, North
Thesis, University of North Dakota, Central Forest Experimental Station,
Grand Forks, North Dakota, USA. St. Paul, Minnesota, USA.
_____. 2011. Giant liver fluke in North _____, and J. Frieberg. 2014. Re-evaluating
Dakota moose. Alces 47: 1-7. the northeastern Minnesota moose
______, R. A. Sweitzer, and B. J. Goodwin. decline and the role of wolves. The
2015. Climate and habitat influence Journal of Wildlife Management 78:
prevalence of meningeal worm infection 1143-1150.
in North Dakota, USA. Journal of ______, and P. D. Karns. 1977. Role of the
Wildlife diseases 51: 670-679. Wolf in a Deer Decline in the Superior
Mautz, W. W., H. Silver, J. B. Holter, National Forest. Resource Paper
H. H. Hayes, and W.E. Urban Jr. 1976. NC-148. United States Department of
176ALCES VOL. 53, 2017 RANTA AND LANKESTER. – MOOSE AND DEER POPULATION TRENDS
Agriculture, Forest Service, North the winter of 1952-53. Report 2. Ontario
Central Forest Experimental Station, St. Department Lands and Forests, Wildlife
Paul, Minnesota, USA. Resources, Toronto, Ontario, Canada.
Murray, D. J., E. W. Cox, W. B. Ballard, Peek, J. M. 1997. Habitat relationships.
H. A. Whitlaw, M. S. Lenarz, T. W. Pages 351-375 in A. W. Franzmann and
Custer, T. Barnett, and T. K. Fuller. C. C. Schwartz, editors. The Ecology
2006. Pathogens, nutritional deficiency, and Management of the North American
and climate influences on a declining moose. Wildlife Management Institute,
moose population. Wildlife Monographs Washington, D. C., USA.
116: 1-30. Pimlott, D. H., J. A. Shannon, and G. B.
OMNR (Ontario Ministry of Natural Kolenosky. 1969. The ecology of the
Resources). 1974. Lake of the Woods timber wolf in Algonquin Provincial
Planning Area: Information Package. Park. Research Branch Research Report
Ontario Ministry of Natural Resources, (Wildlife) No. 87. Ontario Department
Queen's Printer for Ontario, Toronto, of Lands and Forests, Toronto, Ontario,
Ontario, Canada. Canada.
_____. 1997. The Snow Network for Ontario Potvin, F., and J. Huot. 1983. Estimating
Wildlife. The Why, When, What and carrying capacity of a white-tailed deer
How of Winter Severity Assessment in wintering area in Quebec. Journal of
Ontario. Ontario Ministry of Natural Wildlife Management 47: 463-475.
Resources, Queen's Printer for Ontario, _____, _____, and F. Duchesneau. 1981.
Toronto, Ontario, Canada. Deer mortality in the Pohénégamook
_____. 2003. Aulneau Peninsula Enhanced wintering area, Quebec. Canadian Field-
Management Area Wildlife Plan. Naturalist 95: 80-84.
Ontario Ministry of Natural Resources. _____, H. Jolicoeur, and J. Huot. 1988.
Ontario Ministry of Natural Resources, Wolf diet and prey selectivity during
Queen's Printer for Ontario, Toronto, two periods for deer in Quebec: decline
Ontario, Canada. versus expansion. Canadian Journal of
_____. 2010. Forest Management Guide Zoology 66: 1274-1279.
for Conserving Biodiversity at the Stand Pybus, M. 2001. Liver flukes. Pages
and Site Scales - Background and 121-149 in W. M. Samuel, M. J. Pybus,
Rationale for Direction. Ontario and A. A. Kocan, editors. Parasitic
Ministry of Natural Resources, Queen's Diseases of Wild Mammals. Second
Printer for Ontario, Toronto, Ontario, edition. Iowa State University Press,
Canada. Ames, Iowa, USA.
Oswald, K. 1997. Moose aerial observation Racey, G. D., and T. Armstrong. 2000.
manual. North East Science and Woodland caribou range occupancy in
Information Technical Manual TM-008. northwestern Ontario: past and present.
Ontario Ministry of Natural Resources, Rangifer, Special Issue No. 12:173-183.
Queen’s Printer for Ontario, Toronto, Ranta, W. B. 1982. The status of white-
Ontario, Canada. tailed deer in the Kenora District of
Parker, G. 2003. Status Report on The Ontario. Report Series. Kenora Fish and
Eastern Moose (Alces alces Americana Wildlife District, Ontario Ministry of
Clinton) in Mainland Nova Scotia. Nova Natural Resources, Kenora, Ontario,
Scotia Department of Natural Resources, Canada.
Kentville, Nova Scotia, Canada. _____. 2001. Report on woodland caribou
Passmore, R. C. 1953. Snow conditions in and their use of habitats in the Kenora
relation to big game in Ontario during management unit and southern portions
177MOOSE AND DEER POPULATION TRENDS – RANTA AND LANKESTER ALCES VOL. 53, 2017
of Woodland Caribou Provincial Par. Wildlife Habitats in Managed Forests.
Unpublished report. Kenora Fish and United States Department of Agriculture.
Wildlife District, Ontario Ministry of Agricultural Handbook. No. 553. U.S.
Natural Resources, Kenora, Ontario, Department of Agriculture, Forest
Canada. Service, Portland, Oregon.
______, and S. E. Shaw. 1982. White-tailed Thompson, I. D. 2000a. Forest vegetation of
deer pellet group and habitat inventory Ontario. Pages 30-53 in A. H. Perera,
survey; wildlife management units 7A D. L. Euler, and I. D. Thompson, edi-
and 7B spring/82. Report Series. Kenora tors. Ecology of a Managed Terrestrial
Fish and Wildlife District, Ontario Landscape. University of British
Ministry of Natural Resources, Kenora, Columbia Press, Vancouver, British
Ontario, Canada. Columbia, Canada.
Rempel, R. S., P. C. Elkie, A. R. Rodgers, and _____. 2000b. Forest vertebrates in Ontario:
M. J. Gluck. 1997. Timber-management patterns of distribution. Pages 54-73 in
and natural disturbance effects on moose A. H. Perera, D. L. Euler, and I. D.
habitat: landscape evaluation. Journal of Thompson, editors. Ecology of a
Wildlife Management 61: 517-524. Managed Terrestrial Landscape.
Roseberry, J. L., and A. Woolf. 1998. University of British Columbia Press,
Habitat-population density relationships Vancouver, British Columbia, Canada.
for white-tailed deer in Illinois. Wildlife _____, and R. W. Stewart. 1998.
Society Bulletin 26: 252-258. Management of moose habitat. Pages
Rowe, J. B. 1972. Forest regions of Canada. 377-401 in A. H. Perera, D. L. Euler, and
Publication. No. 1300. Department of I. D. Thompson, editors. Ecology of
Fisheries and the Environment, Canadian a Managed Terrestrial Landscape.
Forest Service, Ottawa, Ontario, Canada. University of British Columbia Press,
Saunders, B. P. 1973. Meningeal worm in Vancouver, British Columbia, Canada.
white-tailed deer in northwestern _____, and M. F. Vukelich. 1981. Use of
Ontario and moose population densities. logged habitats in winter by moose cows
Journal of Wildlife Management 37: with calves in northeastern Ontario.
327-330. Canadian Journal of Zoology 59:
Schwartz, C. C., and A. W. Franzmann. 2103-2114.
1989. Bears, wolves, moose, and forest Ullrey, D. E., W. G. Youat, H. E. Johnson,
succession, some management consider- L. D. Fay, B. E. Brent, and K. E. Kemp.
ations on the Kenai Peninsula, Alaska. 1968. Digestibility of cedar and balsam
Alces 25: 1-10. fir browse for the white-tailed deer.
Seton, E. T. 1909. Life Histories of Northern Journal of Wildlife Management 32:
Animals. Volume 1, Grass-eaters. 162-171.
Charles Scribner’s Sons, New York, Verme, L. J. 1968. An index of winter
New York, USA. weather severity for northern deer.
Severinghaus, C. W. 1947. Relationship of Journal of Wildlife Management 32:
weather to winter mortality and popula- 566-574.
tion levels among deer in the Adirondack _____, and J. L. Ozoga. 1971. Influence of
region of New York. North American winter weather on white-tailed deer in
Wildlife Conference Transactions 12: upper Michigan. Michigan Department
212-223. of Natural Resources and Development
Thomas, J. W., H. Black, R. J. Scherzinger, Report No. 237. Michigan Department
and R. J. Pedersen. 1979. Deer and elk. of Natural Resources, Lansing,
Pages 104-127 in J. W. Thomas, editor. Michigan, USA.
178You can also read