Determinants of population persistence and abundance of terrestrial and arboreal vertebrates stranded in tropical forest land-bridge islands ...
←
→
Page content transcription
If your browser does not render page correctly, please read the page content below
Contributed Paper

Determinants of population persistence and abundance
of terrestrial and arboreal vertebrates stranded in
tropical forest land-bridge islands
                               1,2                                     2,3
Maíra Benchimol                      and Carlos A. Peres
1
  Laboratório de Ecologia Aplicada à Conservação (LEAC), Departamento de Ciências Biológicas, Universidade Estadual de Santa Cruz,
Rodovia Jorge Amado, Km 16, Ilhéus, BA 45650-000, Brazil
2
  Center for Ecology, Evolution and Conservation, School of Environmental Sciences, University of East Anglia, Norwich Research
Park, Norwich NR47TJ, U.K.
3
  Departamento de Sistemática e Ecologia, Universidade Federal da Paraíba, Campus I - Lot. Cidade Universitaria, João Pessoa, PB
58051-900, Brazil

Abstract: Megadams are among the key modern drivers of habitat and biodiversity loss in emerging economies.
The Balbina Hydroelectric Dam of Central Brazilian Amazonia inundated 312,900 ha of primary forests and created
approximately 3500 variable-sized islands that still harbor vertebrate populations after nearly 3 decades after
isolation. We estimated the species richness, abundance, biomass, composition, and group size of medium- to
large-bodied forest vertebrates in response to patch, landscape, and habitat-quality metrics across 37 islands and
3 continuous forest sites throughout the Balbina archipelago. We conducted 1168 km of diurnal censuses and
had 12,420 camera-trapping days along 81 transects with 207 camera stations. We determined the number of
individuals (or groups) detected per 10 km walked and the number of independent photographs per 10 camera-
trapping days, respectively, for each species. We recorded 34 species, and patch area was the most significant
predictor of vertebrate population relative abundance and aggregate biomass. The maximum group size of several
group-living species was consistently larger on large islands and in continuous patches than on small islands. Most
vertebrate populations were extirpated after inundation. Remaining populations are unlikely to survive further
ecological disruptions. If all vertebrate species were once widely distributed before inundation, we estimated
that approximately 75% of all individual vertebrates were lost from all 3546 islands and 7.4% of the animals
in all persisting insular populations are highly likely to be extirpated. Our results demonstrate that population
abundance estimates should be factored into predictions of community disassembly on small islands to robustly
predict biodiversity outcomes. Given the rapidly escalating hydropower infrastructure projects in developing
counties, we suggest that faunal abundance and biomass estimates be considered in environmental impact assess-
ments and large strictly protected reserves be established to minimize detrimental effects of dams on biodiversity.
Conserving large tracts of continuous forests represents the most critical conservation measure to ensure that
animal populations can persist at natural densities in Amazonian forests.

Keywords: Amazon, homeotherms, hydroelectric, island biogeography, mammals, population abundance
Determinantes de la Persistencia Poblacional y la Abundancia de Vertebrados Terrestres y Arbóreos Varados en
Islas con Puentes Terrestres en los Bosques Tropicales

Resumen: Las megapresas se encuentran entre los causantes modernos de la pérdida de hábitat y biodiversidad
en las economías emergentes. La Presa Hidroeléctrica Balbina de la Amazonia central en Brasil inundó 312, 900 ha
de bosques primarios y creó ∼3500 islas de tamaños variables que todavía albergan poblaciones de vertebrados

Address correspondence to Maíra Benchimol, email mairabs02@gmail.com
Article impact statement: Tropical forest islands created by major hydroelectric dams can only retain very small, if any, vertebrate populations.
Paper submitted June 16, 2020; revised manuscript accepted August 24, 2020.
This is an open access article under the terms of the Creative Commons Attribution License, which permits use, distribution and reproduction
in any medium, provided the original work is properly cited.
870
Conservation Biology, Volume 35, No. 3, 870–883
© 2020 The Authors. Conservation Biology published by Wiley Periodicals LLC on behalf of Society for Conservation Biology
DOI: 10.1111/cobi.13619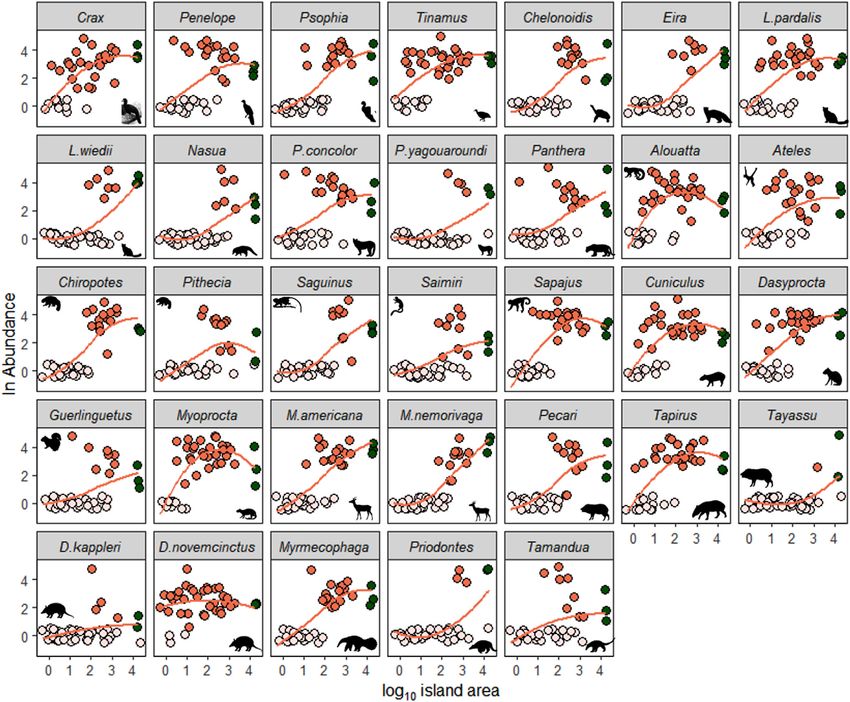
Benchimol & Peres                                                                                                                      871

después de casi tres décadas de aislamiento. Estimamos la riqueza de especies, abundancia, biomasa, composición
y tamaño grupal de los vertebrados de talla mediana a grande del bosque como respuesta a la a las medidas de
calidad del fragmento, paisaje y hábitat en 37 islas y tres sitios de bosque continuo en todo el archipiélago de
Balbina. Realizamos censos diurnos a lo largo de 1,168 km y tuvimos 12,420 días de trampeo con cámaras a
lo largo de 81 transectos con 207 estaciones de cámara. Determinamos el número de individuos (o grupos)
detectados en cada diez kilómetros recorridos y el número de fotografías independientes para cada diez días
de trampeo con cámara, respectivamente, para cada especie. Registramos 34 especies y el área del fragmento
fue el pronosticador más importante de la población de vertebrados en relación con la abundancia y la biomasa
agregada. El tamaño grupal máximo de varias de las especies gregarias fue sistemáticamente mayor en las islas
grandes y en los fragmentos continuos que en las islas pequeñas. La mayoría de las poblaciones de vertebrados
fueron extirpadas después de la inundación. Las poblaciones remanentes tienen pocas probabilidades de sobre-
vivir más perturbaciones ecológicas. Si todas las especies de vertebrados tuvieron alguna vez una distribución
amplia previa a la inundación, estimamos que se perdió ∼75% de todos los vertebrados individuales en todas las
3, 546 islas y el 7.4% de los animales en las poblaciones insulares remanentes tienen una alta probabilidad de
desaparecer. Nuestros resultados demuestran que las estimaciones de abundancia poblacional deberían incluirse
en las predicciones del desmontaje comunitario en islas pequeñas para predecir con solidez los resultados de
biodiversidad. Ya que cada vez existen más proyectos de infraestructura hidroeléctrica en los países en desarrollo,
sugerimos que las estimaciones de abundancia de fauna y de biomasa sean consideradas en las evaluaciones
de impacto ambiental y que se establezcan grandes reservas con protección estricta para minimizar los efectos
dañinos que tienen las presas sobre la biodiversidad. La conservación de grandes tramos continuos de bosque
representa la medida de conservación más crítica para asegurar que las poblaciones animales puedan persistir con
densidades naturales en los bosques de la Amazonia.

Palabras Clave: abundancia poblacional, Amazonia, biogeografía de islas, hidroeléctrica, homeotermos,
mamíferos

Introduction                                                             Medium- and large-sized forest vertebrates, especially
                                                                      birds and mammals, are widely recognized as high-
Both island and continental biotas worldwide have suc-                performing bioindicators of intact tropical landscapes
cumbed to unprecedented losses; current extinction                    (Ahumada et al. 2011). Indeed, large-scale monitoring
rates are nearly 1000 times higher than the prehuman                  programs and rapid assessment surveys frequently focus
background rate (Pimm et al. 2014). Regional extirpation              on large-bodied homeotherms to better elucidate their
processes result from cumulative local extinctions; aver-             main threats and monitor species fluctuations over the
age decline in vertebrate populations worldwide since                 time (Luzar et al. 2011). In hyperdiverse tropical forests,
1970 is 60% (WWF 2018). Steep declines in species oc-                 large terrestrial and arboreal vertebrates often comprise
cupancy and abundance, which are often considered                     the most important sources of protein for local com-
hallmarks of defaunation (Dirzo et al. 2014), have been               munities given their population biomass (Robinson &
driven by myriad anthropogenic activities that have in-               Bennett 2004). Yet several large-bodied vertebrates have
duced wide-scale ecological impacts. In particular, habi-             been extirpated or severely depleted in tropical forests
tat loss and fragmentation accelerate biodiversity decay,             (Ripple et al. 2017), including the Amazon (Peres & Pala-
especially for forest biotas sensitive to habitat distur-             cios 2007). Species occupancy in small and highly dis-
bance (Hanski 2015). For instance, nearly three quar-                 turbed patches is often exceedingly low (Thornton et al.
ters of the world’s remaining forests lie within 1 km of              2011), reflecting the strong species–area relationships
a forest edge, which threatens the persistence of myr-                that explain local vertebrate assemblages in fragmented
iad species (Haddad et al. 2015). Over the last 50 years,             landscapes (Michalski & Peres 2005; Benchimol & Peres
several studies have assessed patterns of species decline             2013, 2015a). However, the size of vertebrate popula-
and extinction, particularly in highly fragmented land-               tions persisting in forest patches is rarely assessed, and
scapes in tropical forests (Turner 1996; Benchimol &                  abundance–area relationships (AARs) have so far been
Peres 2015a). However, fluctuations in small numbers                  poorly investigated (but see Michalski & Peres 2007),
of individuals persisting in local populations can lead to            even though population declines are perhaps the best
rapid acceleration of negative effects and increase sever-            measure of biodiversity erosion (Gaston et al. 2000).
ity of negative effects on ecosystem functions; thus, they            Abundance estimates can therefore enhance understand-
provide a sensitive indicator of biodiversity loss (Ceballos          ing of population viability and the effects of anthro-
& Ehrlich 2002; Dirzo et al. 2014). The demographic and               pogenic disturbances on insular vertebrate populations,
effective sizes of populations persisting in isolated habi-           especially in hyperfragmented tropical landscapes.
tat remnants are critical, but have rarely been quantified               Beyond widespread forest conversion into pasture
in fragmented tropical landscapes.                                    and cropland since the 1970s, hydroelectric dams have

                                                                                                                      Conservation Biology
                                                                                                                      Volume 35, No. 3, 2021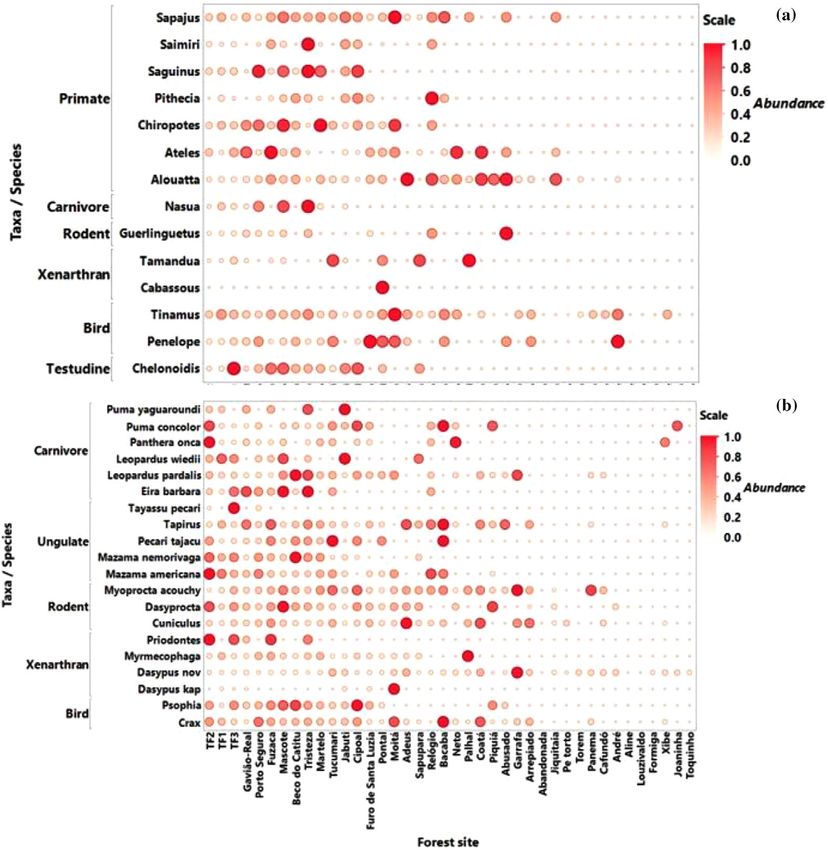
872 Population Loss
recently become an additional threat to Amazonian bio- ticularly in the upper watershed of the reservoir, which is
tas (Fearnside 2014; Lees et al. 2016). Terrestrial verte- far from the nearest village. Both islands and CFs were un-
brates and invertebrates have been extirpated at massive affected by logging, but some of our study islands were
rates on Amazonian forest islands formed in the after- affected by ephemeral understory fire during the 1997–
math of dam construction (Benchimol & Peres 2015a, 1998 El-Niño drought, which affected several islands in
2015b; Tourinho et al. 2020). In particular, most arboreal the reservoir.
and terrestrial species have been extirpated from large We collated a vertebrate species list (including terres-
numbers of small islands that are human-made archipela- trial and arboreal species) expected to occur across the
gos (Benchimol & Peres 2015b), yet the status of extant reservoir, which included 2 tortoise and nearly 40 for-
insular populations remains poorly investigated. Given est mammal and bird species. To carry out vertebrate
that there are currently 191 dams and another 243 have surveys, we established 1–5 variable-length (0.5–3.0 km)
been proposed for construction by 2024 across the Ama- linear transects on each island and 3 parallel 4-km tran-
zon basin (Lees et al. 2016), it is critical to assess pop- sects at each CF site, amounting to 81 transects (total
ulation sizes in insular areas to better understand their length of 108.5 km) (Benchimol & Peres 2015b). We used
demographic viability in areas affected by megadams. line transect censuses (LTC) and camera trapping, which
We quantified the local abundance of 34 vertebrate are widely recognized as the 2 most efficient sampling
species in forest sites to evaluate the species-specific re- techniques to survey homeotherm vertebrates >500 g
sponses to habitat insularization induced by a mega hy- in tropical forests (Peres 1999; Michalski & Peres 2007).
droelectric dam in central Amazonia. For this we used The LTCs were conducted 8 times at each site by 2 well-
2 sampling techniques to survey a wide range of for- trained observers, who surveyed 1168 km following a
est vertebrate species, including mammals, large birds, standardized protocol (Peres 1999). For camera-trapping
and tortoises, on 37 variable-sized islands and 3 mainland surveys, we deployed 2–15 digital-camera traps (CTs)
sites. We also assessed community-wide patterns of abun- (HC500-Hyperfire, Reconyx, Holmen, Wisconsin) at each
dance, biomass, species richness, species composition, sampling site, according to island size. Cameras were de-
and the socioecology of group-living species in response ployed over 2 continuous 30-day periods in consecutive
to patch, landscape, and habitat-quality metrics. Finally, years. The CTs were unbaited, placed 30–40 cm above
we predicted the number of individuals lost in all ver- ground, and spaced at least 500 m apart (except on very
tebrate populations and the number of populations that small islands). We deployed a total of 207 CT stations,
are likely to be extirpated across all reservoir islands. total of 12,420 CT days (mean [SD] = 310.5 [251.83],
range 120–900 CT days/site). All surveys were carried
out from June 2011 to December 2012, and LTCs were
Methods never conducted at any site during CT sampling periods.
Study Landscape
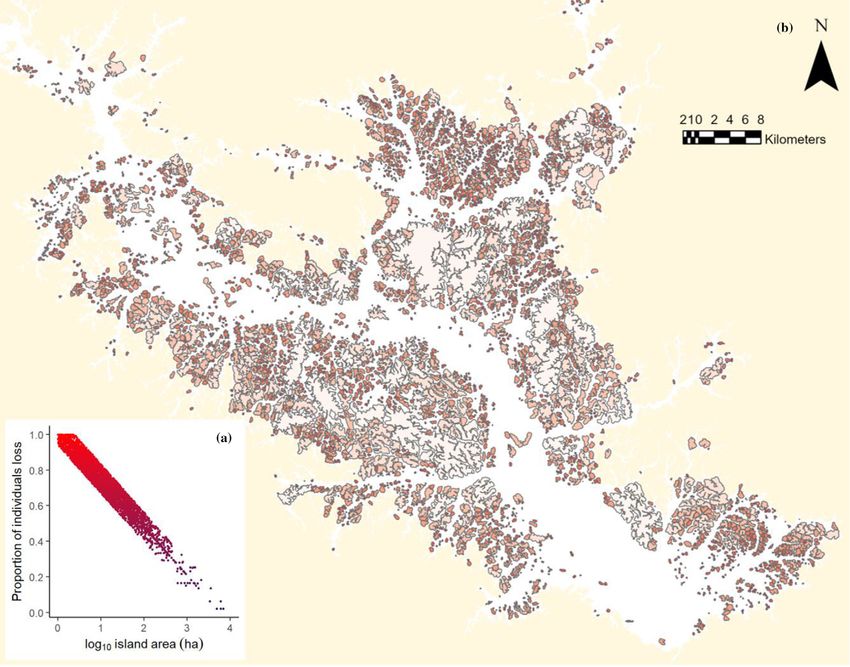
This study was conducted at the Balbina Hydroelec- Patch and Landscape Variables
tric Reservoir landscape in central Brazilian Amazonia We used 28 commercial tiles of high-resolution, multi-
(1°01 –1°55 S; 60°29 –59°28 W) (Appendix S1). The Bal- spectral RapidEye (5-m pixel) imagery of the entire Bal-
bina Dam was built in 1986 by impounding the Uatumã bina landscape to quantify spatial metrics for all surveyed
River, flooding 312,900 ha and creating 3,546 islands sites. We specifically used RapidEye (RapidEye, Berlin,
ranging in size from 0.2 to 4878 ha (Benchimol & Peres Germany) tiles that matched our field time (from March
2015a). In 1990 the left bank of the reservoir and the ad- 2011 to September 2012) and exhibited low (1 km fruits (BAFF ) at each site. The burn and (BAFF ) vari-
from one another), and absence of hunting pressure, par- ables were estimated from floristic surveys based on 87
Conservation Biology
Volume 35, No. 3, 2021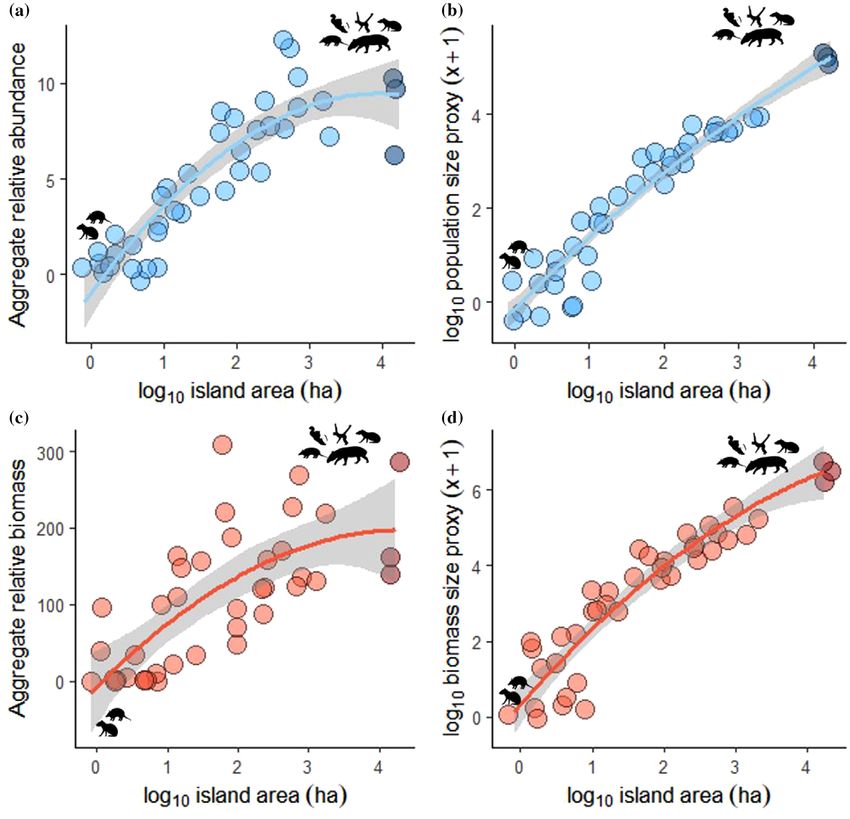
Benchimol & Peres                                                                                                      873

quarter-hectare plots inventoried at all survey sites         ing ordination axes based on the Bray–Curtis similarity
(Benchimol & Peres 2015c).                                    matrix of abundance data for each sampling technique.
   At the patch scale, we measured total island area (area,   All analyses were performed with the vegan R package
log10 x); distance between each focal island and the near-    (Oksanen et al. 2018).
est CF (isolation); perimeter of focal islands divided by        We performed generalized linear models (GLMs) to as-
their total area (shape); and a modified proximity index      sess the importance of habitat quality, patch, and land-
(prox), which accounts for the total size and distance to     scape variables in explaining patterns of overall verte-
any land mass (Benchimol & Peres 2015a), of 250, 500,         brate abundance, overall biomass, species richness, and
and 1000 m (hereafter buffer areas) outside the perime-       species composition across all survey sites. Models were
ter of each site, given that multiscale analysis is consid-   fitted using the lme4 package (Bates 2007). We tested
ered the most suitable approach to determine landscape        for multicollinearity among our 7 variables with variation
size when the scale of species responses is unknown           inflation factors (VIF) that we derived using the HH pack-
(Jackson & Fahrig 2015). At the landscape scale, we           age (Heiberger 2016). Given that prox was moderately
quantified the proportion of forest cover (cover) within      redundant or collinear (VIF > 3) for all response vari-
each buffer. We assigned a value one order of magnitude       ables, we excluded this variable in subsequent models.
greater than our largest island (i.e., 16,900 ha) for ev-     We ran all possible models and used model-averaged es-
ery CF included within the buffer area of a focal island.     timates in the MuMIn package (Barton 2018) to identify
We performed a Pearson correlation matrix among all           significant variables (i.e., p ≤ 0.05). We also determined
variables and excluded cover from subsequent analyses         the relative importance of each variable (i.e., contribu-
because it was highly correlated (r > 0.70) with other        tion of each variable to overall model variance) with hi-
variables.                                                    erarchical partitioning (HP), carried out in the hier.part
                                                              package (Walsh & Mac Nally 2003). We performed GLMs
                                                              considering only the 37 surveyed islands, including all
Data Analyses
                                                              6 explanatory variables, and all 40 surveyed sites, but
For each species recorded by at least one sampling tech-      excluding those explanatory variables inherently associ-
nique, we obtained abundance estimates defined as ei-         ated with islands (isolation, shape, and prox). We fur-
ther the number of individuals or groups detected per         ther investigated the relationships between each of our
10 km walked (for mostly arboreal species surveyed by         4 response variables (overall abundance, overall biomass,
LTC) or the number of independent photographs per 10          richness, and composition), and the variable showing the
CT days (for terrestrial species surveyed by CT). Given       highest HP in each GLM. For this, we performed a model-
the wide discrepancy in units of abundance provided by        selection procedure and compared differences in Akaike
LTC and CT, we tested which sampling technique most           information criterion (AIC) to select the most parsimo-
efficiently detected any given species and for that species   nious model (i.e., models exhibiting AIC ≤ 2.00). In all
used those estimates for subsequent analyses. In doing        cases, we tested 4 widely used models to investigate re-
so, we constructed cumulative detection curves for each       lationships in fragmented tropical landscapes: null (con-
species based on that technique as a function of all pos-     stant), linear, power law, and piecewise.
sible detections based on the same technique (Appendix           We calculated relativized abundance estimates for
S2). Because total numbers of records provided by each        each species, based on the most efficient sampling tech-
survey technique were not equivalent, we rescaled all         nique for each species, by rescaling all abundance esti-
observations from 0.0 to 1.0. In those cases where the        mates from 0.0 to 1.0. For this, we divided the observed
best technique failed to record a species within a certain    abundance estimate of each species at each sampling
site, we used the rescaled values obtained from another       site by the highest abundance observed for that species
technique, therefore avoiding 0 estimates of species oc-      across all sites. We also summed the relativized abun-
currences in a site where the species was indeed de-          dances for all species per site, which enabled us to ob-
tected. Besides the abundance estimate of each species        tain an aggregate relative abundance based on both sam-
per site, we also estimated the overall vertebrate abun-      pling techniques on a common scale. We subsequently
dance at each site by summing all abundance estimates of      obtained a proxy of population size for each sampling
all recorded species per site; a metric of biomass density    site by multiplying the aggregate relative abundance by
for each species at each sampling site by multiplying its     island area. We performed the same procedure to obtain
abundance estimate by its body mass (according to val-        estimates of aggregate relative biomass and a proxy of
ues in Benchimol & Peres [2015b]) and thus obtaining          biomass size. Finally, we used empirical models based
the overall vertebrate biomass by summing all biomass         on the variable with the highest HP (i.e., the contri-
estimates of all recorded species per site; overall species   bution toward explained variance) for abundance (i.e.,
richness based on the sum of all species recorded with        AAR) and biomass estimates across all surveyed islands
both techniques at each site; and species composition,        to predict local population abundances at all unsurveyed
defined as the first 2 nonmetric multidimensional scal-       islands.

                                                                                                      Conservation Biology
                                                                                                      Volume 35, No. 3, 2021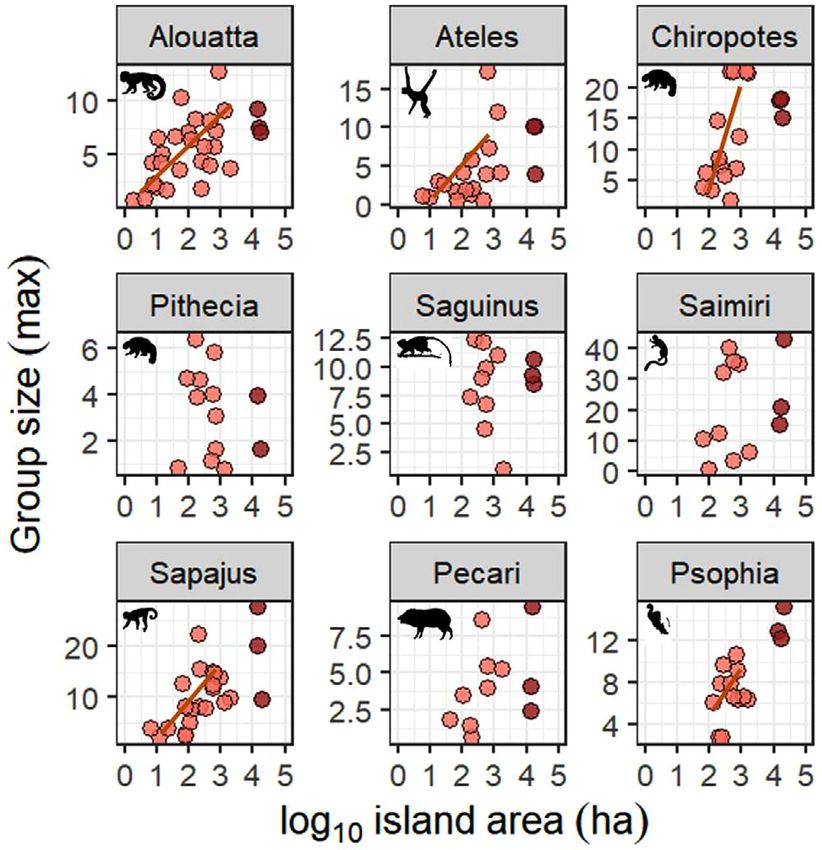
874                                                                                                           Population Loss

   We also estimated the numbers of individuals likely to      only on CT data, whereas the power-law and piecewise
become extirpated in the near future due to small local        models best explained species richness with data from
population sizes. We assumed that populations across all       both survey techniques (Appendix S4).
sites that were below the 25th percentile of abundance            Both relative abundance (mean [SD] = 5.1 [3.7], range
did not meet a minimum viability threshold. We further         0–12.5) and relative biomass (105.3 [88.3], range 0–
summed the relativized abundances for all viable popula-       309.6) summed across all species greatly increased as is-
tions per site, thereby obtaining the viable aggregate rela-   land area increased (Figs. 1a & 1c), so large islands and
tive abundance. We further used empirical models based         CFs had the largest animal numbers (Figs. 1b and 1d).
on the variable with the highest HP to predict the viable      However, large islands retained higher aggregate relative
aggregate relative abundance at all unsurveyed islands.        abundances than CFs. In contrast, our 15 small islands
   We investigated species-specific responses by examin-       (1200 ha) in the entire archipelago
the highest explanatory power in HP analysis (Appendix         could harbor healthy population sizes across all verte-
S3). Only fire was a significant predictor of species com-     brate species; CFs served as the main regional-scale refu-
position for LTC, albeit with a lower fraction of HP. The      gia of vertebrate assemblages (Fig. 4).
same pattern was observed with GLMs of all 40 sur-                Based on the assumption that populations across all
veyed sites. Island area was the only variable included        sites below the 25th percentile of abundance could not
in these models, and it showed the highest fraction of         meet a minimum viability threshold, one quarter of the
HP in explaining patterns of species richness (75.1% for       populations of 8 species in our 40 sites (howler monkey,
both techniques), overall abundance (76.5% for LTC and         spider monkey [Ateles paniscus], golden-handed tamarin
76.1% for CT), overall biomass (67.9% for LTC and 84.1%        [Saguinus midas], squirrel monkey [Guerlinguetus aes-
for CT), and composition (69.4% for LTC and 53.6% for          tuans], lowland paca [Cuniculus paca], collared pec-
CT). We thus performed model selection to investigate          cary [Pecari tajacu], Black Curassow, and Marail Guan
the relationship between area and all 4 response vari-         [Penelope marail]) are likely to be extirpated, and sev-
ables (Appendix S3). Piecewise and linear models per-          eral other species are vulnerable to many additional ex-
formed equally well in explaining patterns of overall          tirpations in the near future (Table 1). Mirroring these
abundance and overall biomass based on LTC data and            estimates, the viable aggregate relative abundance de-
species composition based on CT data, whereas only a           creased by 8% (187.1 of 203.3 individuals) for all sur-
piecewise model explained patterns of species compo-           veyed islands (mean [SD] = 4.68 [3.53], range 0–12.1),
sition based on LTC data. Linear and power-law models          a result that contrasted with our observed aggregate
best explained patterns of abundance and biomass based         relative abundances. When all reservoir islands were

Conservation Biology
Volume 35, No. 3, 2021
Table 1. The 34 vertebrate species recorded in 37 forest islands across the Balbina archipelagic landscape and 3 neighboring mainland sites in Brazil and the sampling techniques used to quantify relative
abundance of each species.
No. populations
Benchimol & Peres
highly likely to
English Bodymass Observed be extirpated
a b c
Taxonomic group Scientific name common name IUCN (kg) Sampling technique occurrence (%)
line transect camera
censuses trapping
Mammals
∗
Cervidae Mazama red brocket deer DD 22.80 × 18 4 (22)
americana
∗
Cervidae Mazama Amazonian LC 16.30 × 14 3 (21)
nemorivaga brown
brocket deer
∗
Tayassuidae Pecari tajacu collared peccary LC 21.27 × 16 4 (25)
Tayassuidae∗ Tayassu pecari white-lipped VU 32.23 × 3 0 (0)
peccary
∗
Mustelidae Eira barbara tayra LC 3.91 × 11 2 (18)
∗
Felidae Leopardus ocelot LC 11.90 × 24 3 (13)
pardalis
∗
Felidae Leopardus wiedii margay NT 3.25 9 0 (0)
∗
Felidae Panthera onca jaguar NT 80.00 × 15 2 (13)
∗
Felidae Puma concolor puma LC 51.60 × 18 4 (22)
∗
Felidae Puma jaguarundi LC 6.75 × 6 0 (0)
yagouaroundi
∗
Procyonidae Nasua nasua South American LC 3.79 × 9 2 (22)
coati
Dasypodidae∗ Cabassous Southern LC 4.80 × 1 0 (0)
unicinctus naked-tailed
armadillo
∗
Dasypodidae Dasypus kappleri greater LC 9.50 6 0 (0)
long-nosed
armadillo
∗
Dasypodidae Dasypus 9-banded LC 3.50 37 9 (24)
novemcinctus armadillo
∗
Dasypodidae Priodontes giant armadillo VU 38.00 5 1 (20)
maximus
∗
Tapiridae Tapirus terrestris South American VU 160.00 × 26 6 (23)
tapir
∗
Myrmecophagidae Myrmecophaga giant anteater VU 22.33 × 19 3 (16)
tridactyla
∗
Myrmecophagidae Tamandua southern LC 5.52 × 9 2 (18)
tetradactyla tamandua
∗
Atelidae Alouatta red howler LC 6.15 28 7 (25)
macconnelli monkey
Continued
Conservation Biology
Volume 35, No. 3, 2021
875876
Table 1. Continued.
Conservation Biology
Volume 35, No. 3, 2021
No. populations
highly likely to
English Bodymass Observed be extirpated
a b c
Taxonomic group Scientific name common name IUCN (kg) Sampling technique occurrence (%)
∗
Atelidae Ateles paniscus black spider VU 7.90 20 5 (25)
monkey
∗
Pitheciidae Chiropotes northern – 3.10 17 4 (24)
sagulatus bearded saki
∗
Pitheciidae Pithecia golden-faced LC 1.38 13 3 (23)
chrysocephala saki
∗
Callithrichidae Saguinus midas golden-handed LC 0.54 12 3 (25)
tamarin
∗
Cebidae Saimiri sciureus squirrel monkey LC 0.90 12 3 (25)
∗
Cebidae Sapajus apella brown capuchin LC 2.75 23 5 (22)
monkey
∗
Cuniculidae Cuniculus paca lowland paca LC 9.00 28 7 (25)
∗
Dasyproctidae Dasyprocta red-rumped LC 3.50 × 23 5 (22)
leporina agouti
∗
Dasyproctidae Myoprocta red acouchi LC 0.95 × 30 7 (23)
acouchy
∗
Sciuridae Guerlinguetus Brazilian – 0.19 × 11 2 (18)
aestuans squirrel
Birds
∗
Cracidae Penelope marail Marail Guan LC 0.95 20 5 (25)
∗
Cracidae Crax alector Black Curassow VU 3.40 × 28 7 (25)
∗
Psophiidae Psophia crepitans Grey-winged NT 1.50 × 17 4 (24)
Trumpeter
∗
Tinamidae Tinamus major Great tinamou NT 1.20 × 29 7 (24)
Reptiles
∗
Testudines/ Chelonoidis red-footed and VU 4.00 15 3 (20)
Testudinidae× carbonaria, C. yellow-footed
denticulata tortoises
a
b
Abbreviations: DD, data deficient; LC, least concern; VU, vulnerable; NT, near threatened. Classification based on IUCN (2019).
c
See Benchimol and Peres (2015b) for details on body mass acquisition.
∗
Asterisk ( ), abundance estimates not made due to low number of records; ×, Chelonoidis carbonaria and C. denticulata pooled given that they could not always be identified to species and
their strong ecological similarities.
Population LossBenchimol & Peres 877
Figure 1. Relationships between forest patch (island and mainland) area and (a) aggregate relative abundance,
(b) population size (proxy aggregate relative abundance × island area), (c) aggregate relative biomass, and (d)
biomass density (proxy aggregate relative biomass × island area) for 37 islands and 3 continuous forest sites
across the Balbina landscape (shading, 95% CI).
considered, we found that 7.4% (918.7 of 12,399.3) of few vertebrate species that collectively had small popula-
the extant individuals across all insular populations are tion sizes and low overall biomass density and that these
likely to be extirpated. differences were primarily driven by habitat area effects.
The maximum group size of several social species was Island size also largely explained patterns of conspecific
consistently larger on increasingly larger islands and CFs group size of several social species. These patterns indi-
(Fig. 5). In particular, significantly smaller group sizes cated that most islands failed to sustain sufficiently large
were found on small islands for howler monkeys (R2 = populations and thereby cannot ensure long-term popu-
0.395, p = 0.000), spider monkeys (R2 = 0.267, p = lation persistence of virtually all solitary and group-living
0.019), bearded saki monkeys (Chiropotes sagulatus) species. Although most conservation ecology studies on
(R2 = 0.416, p = 0.008), and brown capuchin monkeys tropical forest vertebrate persistence in habitat remnants
(Sapajus apella) (R2 = 0.293, p = 0.008). Collared have focused on binary patterns of patch occupancy
peccaries also showed a similar pattern of reduced herd (Sampaio et al. 2010; Benchimol & Peres 2015b), we
sizes on small islands (R2 = 0.202, p = 0.147). found that more severe area effects can be detected only
when local population abundance and AARs are quanti-
fied. In considering the overall numerical losses (in terms
of relative numbers of individuals) across all populations,
Discussion
we found that nearly three quarters of all vertebrate
populations are likely to be extirpated throughout
Our results clearly showed that the vast majority of
the reservoir. These substantial population losses are
islands created by a vast hydroreservoir retained only a
Conservation Biology
Volume 35, No. 3, 2021878 Population Loss Figure 2. Species-by-site matrix of relative abundances based on the most efficient sampling method for each vertebrate species: (a) line transect censuses of mostly arboreal species and (b) camera trapping of terrestrial species (circle size, proportional to relative population abundances based on each method). Mainland and island sites are sorted according to forest area from left to right. estimated despite effective protection from hunting pres- of the explanatory power among all patch, landscape, sure conferred on the Balbina landscape over its nearly and habitat-quality predictors. In fact, islands smaller 3-decade isolation history, not least because of active than 10 ha were either entirely empty or retained very enforcement by the Uatumã Biological Reserve. Under depauperate vertebrate populations. Overall abundance any other scenario of typical offtake in rural Amazonia, increased linearly as a function of island size beyond this we would expect a far worse outcome for isolated large area threshold. Given that half (50.3%) of all 3546 Balbina vertebrate populations, which would be expected to be islands are smaller than 10 ha and 87.8% of all islands extirpated due to the synergistic effects of small habitats are
Benchimol & Peres                                                                                                      879

Figure 3. Abundance–area relationships defined in terms of the relativized population abundance estimates
based on the most efficient sampling technique per species, considering all 40 forest sites surveyed throughout the
Balbina archipelagic landscape (light pink, unoccupied sites; orange circles, insular populations; green circles,
populations in continuous forest sites).

beetles, including nutrient cycling, topsoil fertilization,   species, which should be prioritized in conservation
and secondary seed dispersal, are severely disrupted          efforts.
on small islands, via the indirect effect of community           Patterns of vertebrate abundance in fragmented land-
disassembly of resource populations. Likewise, the            scapes are highly variable; species either benefit from
decline of mammal and gamebird abundance following            habitat modification or decline toward extirpation
patch reduction was also documented in another                (Michalski & Peres 2007; Laurance et al. 2011). In Bal-
Amazonian fragmented landscape (Michalski & Peres             bina, nearly all species either succumbed to local ex-
2007). Additionally, richness and composition of rodents      tinctions or exhibited extremely low relativized abun-
and marsupials (Palmeirim et al. 2018) and bird assem-        dance estimates on small islands, which comprise the
blages (Aurélio-Silva et al. 2016) were best predicted by     vast majority of islands within the reservoir. Nine-banded
island size; patches smaller than 15 and 55 ha retained       armadillo is an exception because it occurred in almost
an impoverished nested subset of each of these taxa,          all surveyed sites and even exhibited overabundance on
respectively. Therefore, our results provide evidence that    some islands. This ubiquitous species, which has been
preserving large tracts of unhunted Amazonian forest          previously classified as area insensitive (Benchimol &
is essential to sustain natural populations of vertebrate     Peres 2015b), has been recorded in much greater den-

                                                                                                      Conservation Biology
                                                                                                      Volume 35, No. 3, 2021
880 Population Loss Figure 4. (a) Proportion of the relative number of all individuals across all species predicted to have been extirpated as a function of forest patch area modeled for all 3546 forest islands across the Balbina archipelagic landscape and (b) level of overall losses of individuals based on all populations (losses increase from yellow to red) and on empirical estimates derived from the 37 surveyed islands. sities in small patches in other fragmented landscapes estimating their abundance. Furthermore, swimming ca- (Michalski & Peres 2007; Thornton et al. 2011). Yet pacity and therefore the probability of traversing the other area-insensitive species, including the red acouchi, open-water matrix between islands varied substantially lowland paca, tapir, black curassow, and great tinamou, among species (Benchimol & Peres 2015b), with poten- occurred at low abundances on small islands, where tial metapopulation consequences for population per- their natural population densities are likely curbed by sistence within islands. In particular, species that were low resource availability. Conversely, some species ex- most adept at swimming and frequently dispersed over hibited higher abundances on islands compared with open water were most likely to either recolonize vacant CF sites. For instance, the small-bodied Brazilian squirrel islands or boost small populations compared with those tolerates habitat perturbation (Mendes et al. 2019), and exhibiting low or no vagility. On the basis of a compre- the small-herd-living collared peccary can thrive in sec- hensive compilation of data on dispersal events (Benchi- ondary forests and small fragments (Keuroghlian et al. mol & Peres 2015b), many species are indeed observed 2004), suggesting that viable populations can persist on swimming across islands in Balbina. Across all species, medium to large islands. However, these results can also however, the number of populations likely to be extir- be attributed to a sampling artefact if the same individu- pated was positively associated with dispersal capacity als are detected repeatedly on small islands, thereby over- across open water (Spearman rank correlation = 0.476). Conservation Biology Volume 35, No. 3, 2021
Benchimol & Peres                                                                                                        881

                                                              quences to population persistence (Marsh et al. 2016).
                                                              The effect of small group size may have long-term costs
                                                              for population persistence, given that inbreeding and
                                                              limited gene flow become more likely, ultimately threat-
                                                              ening long-term genetic viability (Knapp 2013). All other
                                                              things being equal, reduced group sizes may not affect
                                                              group densities but rather depress the size of breeding
                                                              populations, ultimately reducing demographic viability.
                                                                 Our study clearly reinforces the notion that land-bridge
                                                              archipelagos formed by large hydroelectric dams are ex-
                                                              tremely detrimental to medium- to large-bodied verte-
                                                              brates, which are either extirpated or retained in small
                                                              numbers in most reservoir islands. We previously found
                                                              that most species are absent on small forest islands af-
                                                              ter 25 years of isolation, including invertebrates and ver-
                                                              tebrates (Benchimol & Peres 2015a, 2015b; Palmeirim
                                                              et al. 2018; Tourinho et al. 2020). Our new findings con-
                                                              sistently showed that population sizes and biomass den-
                                                              sity were generally low on most islands even for those
                                                              species that had somehow avoided extirpation so far.
                                                              This highlights the precarious demographic viability that
                                                              likely characterizes the small-population syndrome of all
Figure 5. Relationships between island size and               small islands, which can further contribute to a time-
maximum observed group sizes for all social species           lagged extinction debt. Furthermore, most vertebrate
based on the largest number of individuals recorded           species assessed here were forest specialists; correlated
during any line transect census provided that any             effects of island size and habitat degradation (Benchimol
given species was recorded at least once (darker              & Peres 2015c) further affected their abundance. As a
circles, continuous forest sites).                            result, key ecological processes directly or indirectly pro-
                                                              vided by forest-dwelling species can be lost, threatening
                                                              the maintenance of ecosystem integrity (Terborgh et al.
Species showing the highest proportions of populations        2001).
likely to be extirpated (Table 1), such as collared peccary      If current trends in hydropower expansion continues,
and terrestrial birds, could be rescued by successful colo-   the long-term ecosystem functioning of newly formed
nization events provided patch area sufficient and habitat    land-bridge islands will likely be strongly compromised.
quality is high.                                              Other planned or large dams under construction in low-
   Island size also affected the maximum operational          land Amazonia are also located in relatively flat terrains,
group size of several social species, such as primates        which creates shallow lakes inundating extensive areas
and Gray-winged Trumpeters (Psophia crepitans); large         where ridgetop archipelagos will be largely composed
groups typical of continuous sites were apparently sup-       of small islands (Fearnside 2014). As shown here, these
pressed on small islands. Group size comprises a trade-       small islands will likely be subject to severe defaunation
off between the costs of reduced foraging efficiency and      of area-sensitive species, resulting in massive population
the benefits of reduced predation risk (Pulliam & Caraco      declines if not extirpations. We therefore suggest that
1984); large groups are constrained by either small           policy makers explicitly consider the overall topography
food clusters or habitat patches (Oderdonk & Chapman          of planned reservoir areas, favoring dams associated
2000). Given that food resource availability is reduced       with large-island creation but embargoing those located
in small patches, our results indicate that islands retain-   in unfavorable terrains and river basins. Additionally,
ing group-living species are unlikely to accommodate the      we consider that biodiversity loss should be explicitly
natural range of group sizes typical of undisturbed CF.       included in environmental impacts assessments of large
In fact, tree assemblages on small Balbina islands were       hydropower projects in developing countries, with data
species poor and functionally impoverished (Benchi-           acquisition including population abundance estimates.
mol & Peres 2015c), resulting in reduced availability of      For those dams that have already been approved, we
fleshy fruits for frugivores. Habitat-area effects on group   recommend setting aside extensive tracts of strictly
sizes have also been observed in bearded saki monkeys         protected forest adjacent to reservoir areas to maximize
in other fragmented landscape (Boyle & Smith 2010).           the retention of functioning animal populations. This
Fission–fusion groups of spider monkeys were also             conservation strategy becomes crucial, given that only
smaller in fragments in Colombia, with potential conse-       mainland forest sites can safeguard natural population

                                                                                                        Conservation Biology
                                                                                                        Volume 35, No. 3, 2021
882 Population Loss
sizes. Finally, maintaining, restoring, or otherwise Boyle SA, Smith AT. 2010. Behavioral modifications in northern
protecting large tracts of tropical forests are the only bearded saki monkeys (Chiropotes satanas chiropotes) in forest
fragments of central Amazonia. Primates 51:43–51.
safe options to ensure population viability of charismatic
Ceballos G, Ehrlich PR. 2002. Mammal population losses and the ex-
large vertebrate fauna. tinction crisis. Science 296:904–907.
Dirzo R, Young HS, Galetti M, Ceballos G, Isaac NJ, Collen B. 2014.
Defaunation in the anthropocene. Science 345:401–406.
Fearnside PM. 2014. Impacts of Brazil’s Madeira River dams: unlearned
Acknowledgments lessons for hydroelectric development in Amazonia. Environmental
Science & Policy 38:164–72.
We thank Evanir, Evandro, Joelson, Naldo, Zé, Davi, Nina, Gaston KJ, Blackburn TM, Greenwood JJ, Gregory RD, Quinn RM, Law-
Márcio, and Aline for critical fieldwork assistance; the ton JH. 2000. Abundance–occupancy relationships. Journal of Ap-
plied Ecology 37:39–59.
Uatumã Biological Reserve/ICMBio for logistical support;
Haddad NM, et al. 2015. Habitat fragmentation and its lasting impact
D. Storck-Tonon for helping with landscape metrics; and on Earth’s ecosystems. Science Advances 1:e1500052.
W. Endo and CENAP for assisting with identification of Hanski I. 2015. Habitat fragmentation and species richness. Journal of
Leopardus species. This study was funded by the WCS Biogeography 42:989–993.
Research Fellowship Program, a NERC grant to CAP Heiberger RM. 2016. HH: statistical analysis and data display: heiberger
and Holland. R Package Version 3:1–31.
(NE/J01401X/1), The Rufford Small Grant Foundation,
IUCN (International Union for Conservation of Nature). 2019. The
and the Conservation Food and Health Foundation and IUCN red list of threatened species. Version 2016-3. IUCN, Gland,
Idea Wild. MB was funded by a Brazilian Ministry of Edu- Switzerland. Available from http://www.iucnredlist.org (accessed
cation PhD studentship (CAPES, 080410/0). April 2019).
Jackson HB, Fahrig L. 2015. Are ecologists conducting research
at the optimal scale? Global Ecology and Biogeography 24:52–
63.
Supporting Information Keuroghlian A, Eaton DP, Longland WS. 2004. Area use by white-
lipped and collared peccaries (Tayassu pecari and Tayassu tajacu)
in a tropical forest fragment. Biological Conservation 120:411–
Additional information is available online in the Support-
425.
ing Information section at the end of the online article. Knapp LA. 2013. Molecular genetic tools for evaluating the conse-
The authors are solely responsible for the content and quences of habitat fragmentation. Pages 389–398 in Marsh LK, ed-
functionality of these materials. Queries (other than ab- itor. Primates in fragments: complexity and resilience. Springer,
sence of the material) should be directed to the corre- New York.
Laurance WF, et al. 2011. The fate of Amazonian forest fragments: a
sponding author. Data are available on Figshare (https:
32-year investigation. Biological Conservation 144:56–67.
//doi.org/10.6084/m9.figshare.12996686.v1). Lees AC, Peres CA, Fearnside PM, Schneider M, Zuanon JA. 2016. Hy-
dropower and the future of Amazonian biodiversity. Biodiversity
and Conservation 25:451–66.
Luzar JB, Silvus KM, Overman H, Giery ST, Read JM, Fragoso JMV. 2011.
Literature Cited
Large-scale environmental monitoring by indigenous people. Bio-
Ahumada JA, et al. 2011. Community structure and diversity of tropi- science 61:771–781.
cal forest mammals: data from a global camera trap network. Philo- Marsh C, Link A, King-Bailey G, Donati G. 2016. Effects of fragment
sophical Transactions of the Royal Society of London B: Biological and vegetation structure on the population abundance of Ateles
Sciences 366:2703–2711. hybridus, Alouatta seniculus and Cebus albifrons in Magdalena
Aurélio-Silva M, Anciães M, Henriques LMP, Benchimol M, Peres CA. Valley, Colombia. Folia Primatologica 87:17–30.
2016. Patterns of local extinction in an Amazonian archipelagic avi- Mendes CP, Koprowski JL, Galetti M. 2019. NEOSQUIRREL: a data set
fauna following 25 years of insularization. Biological Conservation of ecological knowledge on Neotropical squirrels. Mammal Review
199:101–109. 49:210–225.
Barton K. 2018. MuMIn: multi-modal inference. Model selection and Michalski F, Peres CA. 2005. Anthropogenic determinants of pri-
model averaging based on information criteria (AICc and alike). mate and carnivore local extinctions in a fragmented forest land-
Bates DM. 2007. Linear mixed model implementation in lme4. Depart- scape of southern Amazonia. Biological conservation 124:383–
ment of Statistics, University of Wisconsin, Madison, Wisconsin. 396.
Benchimol M, Peres CA. 2015a. Widespread forest vertebrate ex- Michalski F, Peres CA. 2007. Disturbance-mediated mammal persis-
tinctions induced by a mega hydroelectric dam in lowland Ama- tence and abundance-area relationships in Amazonian forest frag-
zonia. PLOS ONE 10(e0129818) https://doi.org/10.1371/journal. ments. Conservation Biology 21:1626–1640.
pone.0129818. Onderdonk DA, Chapman CA. 2000. Coping with forest fragmentation:
Benchimol M, Peres CA. 2013. Anthropogenic modulators of species- the primates of Kibale National Park, Uganda. International Journal
area relationships in N eotropical primates: a continental-scale anal- of Primatology 21:587–611.
ysis of fragmented forest landscapes. Diversity and Distributions Oksanen JFG, et al. 2018. Vegan: community ecology package. R pack-
19:1339–1352. age version 2.4–1.
Benchimol M, Peres CA. 2015b. Predicting local extinctions of Amazo- Palmeirim AF, Benchimol M, Vieira MV, Peres CA. 2018. Small mammal
nian vertebrates in forest islands created by a mega dam. Biological responses to Amazonian forest islands are modulated by their forest
Conservation 187:61–72. dependence. Oecologia 187:191–204.
Benchimol M, Peres CA. 2015c. Edge-mediated compositional and func- Peres CA. 1999. General guidelines for standardizing line-transect
tional decay of tree assemblages in Amazonian forest islands after 26 surveys of tropical forest primates. Neotropical Primates 7:11–
years of isolation. Journal of Ecology 103:408–420. 16.
Conservation Biology
Volume 35, No. 3, 2021Benchimol & Peres 883
Peres CA. 2001. Synergistic effects of subsistence hunting and habitat Sampaio R, Lima AP, Magnusson WE., Peres CA. 2010. Long-term per-
fragmentation on Amazonian forest vertebrates. Conservation Biol- sistence of midsized to large-bodied mammals in Amazonian land-
ogy 15:1490–1505. scapes under varying contexts of forest cover. Biodiversity and Con-
Peres CA, Palacios E. 2007. Basin-wide effects of game harvest on ver- servation 19:2421–2439.
tebrate population densities in Amazonian forests: implications for Storck-Tonon D, da Silva RJ, Sawaris L, Vaz-de-Melo FZ, Silva DJ, Peres
animal-mediated seed dispersal. Biotropica 39:304–315. CA. 2020. Habitat patch size and isolation drive the near-complete
Pimm SL, Jenkins CN, Abell R, Brooks TM, Gittleman JL, Joppa LN, collapse of Amazonian dung beetle assemblages in a 30-year-old for-
Raven PH, Roberts CM, Sexton JO. 2014. The biodiversity of species est archipelago. Biodiversity and Conservation 29:2419–2438.
and their rates of extinction, distribution, and protection. Science Tourinho AL, Benchimol M, Porto W, Peres CA, Storck-Tonon D. 2020.
344:1246752. Marked compositional changes in harvestmen assemblages in Ama-
Pulliam HR, Caraco T. 1984. Living in groups: is there an optimal group zonian forest islands induced by a mega dam. Insect Conservation
size. Pages 122–147 in Krebs JR, Davis NB, editors. Behavioural ecol- and Diversity 13:432–444.
ogy, an evolutionary approach. Blackwell, Oxford, United Kingdom. Terborgh J, et al. 2001. Ecological meltdown in predator-free forest
R Development Core Team. 2018. R: a language and environment for fragments. Science 294:1923–1926.
statistical computing. R Foundation for Statistical Computing, Vi- Thornton D, Branch L, Sunquist M. 2011. Passive sampling effects and
enna, Austria. landscape location alter associations between species traits and re-
Ripple WJ, Wolf C, Newsome TM, Hoffmann M, Wirsing AJ, McCauley sponse to fragmentation. Ecological Applications 21:817–829.
DJ. 2017. Extinction risk is most acute for the world’s largest and Turner IM. 1996. Species loss in fragments of tropical rain forest: a
smallest vertebrates. Proceedings of the National Academy of Sci- review of the evidence. Journal of applied Ecology 33:200–209.
ences 114:10678–10683. Walsh C, MacNally R. 2003. Hierarchical partitioning. R project for sta-
Robinson JG, Bennett EL. 2004. Having your wildlife and eating it too: tistical computing.
an analysis of hunting sustainability across tropical ecosystems. An- WWF (World Wildlife Fund). 2018. Living planet report 2018: aiming
imal Conservation 7:397–408. higher. WWF International, Gland, Switzerland.
Conservation Biology
Volume 35, No. 3, 2021You can also read