Assessment of the status and trends in abundance of a coastal pinniped, the Australian sea lion - Inter-Research Science Publisher
←
→
Page content transcription
If your browser does not render page correctly, please read the page content below
Vol. 44: 421–437, 2021               ENDANGERED SPECIES RESEARCH
                                                                                                  Published April 22
 https://doi.org/10.3354/esr01118              Endang Species Res

                                                                                                  OPEN
                                                                                                  ACCESS

Assessment of the status and trends in abundance
  of a coastal pinniped, the Australian sea lion
                Neophoca cinerea
      Simon D. Goldsworthy1, 2,*, Peter D. Shaughnessy1, 3, Alice I. Mackay1,
Frederic Bailleul1, Dirk Holman4, Andrew D. Lowther5, Brad Page6, Kelly Waples7,
                  Holly Raudino7, Simon Bryars8, Tim Anderson9
             1
             South Australian Research and Development Institute, West Beach, South Australia 5024, Australia
            2
            School of Biological Sciences, The University of Adelaide, Adelaide, South Australia 5005, Australia
                     3
                      South Australian Museum, North Terrace, Adelaide, South Australia 5000, Australia
                   4
                    Department for Environment and Water, Port Lincoln, South Australia 5066, Australia
                                5
                                  Norwegian Polar Institute, Framsentret, 9296 Tromsø, Norway
                 6
                  Department of Primary Industries and Regions, Urrbrae, South Australia 5064, Australia
         7
          Department of Biodiversity, Conservation and Attractions, Kensington, Western Australia 6151, Australia
                       8
                         Department for Environment and Water, Adelaide, South Australia 5000, Australia
                                       9
                                        Helifarm, Ceduna, South Australia 5690, Australia

       ABSTRACT: Australian sea lions Neophoca cinerea are endemic to Australia, with their contem-
       porary distribution restricted to South Australia (SA) and Western Australia (WA). Monitoring of
       the species has proved challenging due to prolonged breeding events that occur non-annually
       and asynchronously across their range. The most recent available data from 80 extant breeding
       sites (48 in SA, 32 in WA) enabled us to estimate the species-wide pup abundance to be 2739, with
       82% (2246) in SA and 18% (493) in WA, mostly based on surveys conducted between 2014 and
       2019. We evaluated 1776 individual site-surveys undertaken between 1970 and 2019 and identi-
       fied admissible time-series data from 30 breeding sites, which revealed that pup abundance
       declined on average by 2.0% yr−1 (range 9.9% decline to 1.7% growth yr−1). The overall reduction
       in pup abundance over 3 generations (42.3 yr) was estimated to be 64%, with over 98% of Monte
       Carlo simulations producing a decline > 50% over a 3-generation period, providing strong evi-
       dence that the species meets IUCN ‘Endangered’ criteria (decline ≥ 50% and ≤ 80%). The popula-
       tion is much smaller than previously estimated and is declining. There is a strong cline in regional
       abundances (increasing from west to east), with marked within-region heterogeneity in breeding
       site pup abundances and trends. Results from this study should improve consistency in the assess-
       ment of the species and create greater certainty among stakeholders about its conservation status.
       To facilitate species management and recovery, we prioritise key data gaps and identify factors to
       improve population monitoring.

       KEY WORDS: Australian sea lion · Declining population · Endangered species · IUCN Red List
       Criteria · South Australia · Western Australia

                  1. INTRODUCTION                              Diversity (CBD) and the Sustainable Development
                                                               Goals (UN 2019, CBD 2020). Following the recent
   The global threat to biodiversity has spurred the           United Nations Summit on Biodiversity (September
world’s governments to develop a suite of policy ini-          2020), 77 countries signed The Leaders’ Pledge for
tiatives such as the UN Convention on Biological               Nature, committing them to reversing biodiversity
                                                               © The authors 2021. Open Access under Creative Commons by
*Corresponding author: simon.goldsworthy@sa.gov.au             Attribution Licence. Use, distribution and reproduction are un-
                                                               restricted. Authors and original publication must be credited.
                                                               Publisher: Inter-Research · www.int-res.com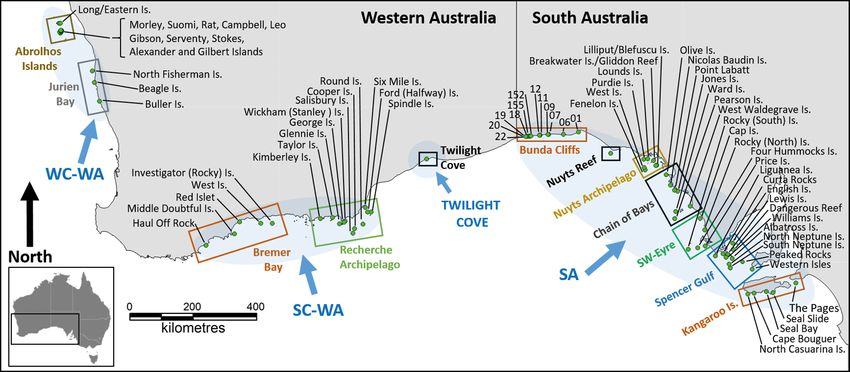
422                                     Endang Species Res 44: 421–437, 2021

loss by 2030 (Leaders’ Pledge for Nature 2020). The         fisheries interactions (especially bycatch in demersal
International Union for the Conservation of Nature          gillnet and rock lobster fisheries), entanglement in
(IUCN) Red List represents the largest standardised         marine debris and disease (Page et al. 2004, Golds-
database of the status, trends and threats to global        worthy & Page 2007, Goldsworthy et al. 2010, Hamer
biodiversity, and provides a critical indicator of the      et al. 2013, Marcus et al. 2014, 2015).
health of the world’s biodiversity against which the           Unlike all other pinnipeds, ASLs have a non-annual
success of policy initiatives (including those listed       breeding cycle of about 17−18 mo, with the longest
above) can be measured (IUCN Standards and Peti-            gestation period of any pinniped (up to 14 mo, Gales
tions Committee 2019).                                      & Costa 1997). Breeding is protracted (4−12 mo in du-
   Marine mammals have been previously charac-              ration, depending on pup production), can occur at
terised as disproportionally threatened and data poor       any time of the year and is asynchronous across its
(Kovacs et al. 2012), with almost one-third of all seal     range (i.e. adjacent breeding sites can breed at differ-
species threatened. Sea lions are 1 of 2 groups of          ent times) (Kirkwood & Goldsworthy 2013). Mecha-
otariid (eared) seals, and comprise 8 taxa (6 species       nisms suggested to maintain asynchronous breeding
and 2 subspecies) (Committee on Taxonomy 2020).             are thought to be extreme philopatry and population
The distribution of these taxa is centred on the Pacific    sub-structuring, effectively making most breeding
Rim. Globally, sea lions are facing significant conser-     sites closed subpopulations (Campbell et al. 2008b,
vation and management challenges, with many spe-            Lowther et al. 2012).
cies in low abundance or facing declines throughout            There is evidence of significant declines in abun-
parts or all of their ranges. Sea lions generally forage    dance across parts of the ASL’s range (Goldsworthy
demersally and mostly occur in near-coastal and con-        et al. 2015), with total population estimates ranging
tinental shelf waters, leaving them vulnerable to in-       between 10 000 and 15 000 (based on multipliers of
creased interactions with human activities such as di-      pup production) (Goldsworthy et al. 2009a, 2015,
rect and indirect interactions with fisheries, climate      Shaughnessy et al. 2011). Because of the species’ un-
change, extreme weather events (e.g. El Niño), en-          usual breeding biology, and the unpredictable timing
tanglement in marine debris and disease (Kovacs et          and duration of breeding seasons among breeding
al. 2012). Given this increased vulnerability, it is un-    sites, there has been limited reliable or useable data
surprising that the IUCN Red List assesses 75% of all       available to assess its status and investigate long-
sea lion taxa at a Near Threatened or higher category       term population trends with confidence or certainty
(Japanese sea lion Zalophus japonicus: Extinct; Aus-        (Shaughnessy et al. 2011, Goldsworthy et al. 2015).
tralian sea lion Neophoca cinerea, New Zealand sea             Despite the fact that the ASL has been listed as En-
lion Phocarctos hookeri, Galapagos sea lion Z. wolle-       dangered under the IUCN Red List since 2008
baeki and western Steller sea lion Eumetopias juba-         (Goldsworthy & Gales 2008, Goldsworthy 2015), the
tus jubatus: Endangered; eastern Steller sea lion E. j.     species has been listed as ‘vulnerable’ under Aus-
monteriensis: Near Threatened; Californian sea lion         tralia’s Commonwealth and State environment legis-
Zalophus californianus and South American sea lion          lations (Environment Protection and Biodiversity
Otaria bryonia: Least Concern). Even for those              Conservation Act of 1999 [EPBC Act]; SA National
species listed as Least Concern, some subpopulations        Parks and Wildlife Act of 1972; WA Biodiversity Con-
have undergone major declines. The Gulf of Califor-         servation Act of 2016), even though a common as-
nia subpopulation of Z. californianus has undergone         sessment method using the IUCN criteria and thresh-
a 65% decline since 1991 (Adame et al. 2020), and           olds has been applied in these jurisdictions. Different
the Falkland Islands subpopulation of O. bryonia is         interpretations on past (limited) data and the marked
estimated to have declined by 95% since the 1930s           variability in breeding site status and trends in abun-
(Thompson et al. 2005, Baylis et al. 2015).                 dance across its range have contributed to differences
   The Australian sea lion (ASL) was subject to seal-       in the assessment of the species’ conservation status
ing in the late 18th and early 19th century, resulting in   (Woinarski et al. 2014). ASLs were recently (23 De-
a reduction in population size and extirpation from         cember 2020) uplisted to ‘endangered’ under the
locations within and beyond its current range (Ling         EPBC Act (Threatened Species Scientific Committee
1999, Stuart 2018). Its extant breeding distribution is     2020). Consistency in the assessment of ASLs under
restricted to islands off South Australia (SA) and          the IUCN Red List and the Australian EPBC Act will
Western Australia (WA), with the exception of a             reduce confusion among stakeholders about the sta-
number of small mainland breeding sites at the base         tus of this species. This consistency, plus an improved
of cliffs. Known threats to species recovery include        ability to detect changes in abundance, will underpin
Goldsworthy et al.: Australian sea lion status and trends                        423

the development of a more cohesive and targeted               been conducted within a breeding season, individ-
policy and management framework for the recovery              ual surveys have included the cumulative number
of the ASL.                                                   of dead pups. Dead pups are typically marked
  With these issues in mind, the overarching goal of          within surveys to avoid double counting. Most sur-
our study was to undertake a comprehensive spe-               veys include details on the number of live pups
cies-wide assessment of the status of the ASL. Specif-        present in different pelage categories. This informa-
ically, our aims were to (1) compile all historic ASL         tion is critical for estimating survey timing relative
pup abundance time-series data; (2) evaluate and ex-          to the stage of the breeding season, as the pelage
tract useable data; (3) assess the status and trends in       categories provide a proxy for pup age: black mate-
abundance across breeding sites, subregions and               guarded (pups whose mothers are mate-guarded by
metapopulations; and (4) identify and prioritise key          an adult male are aged 0−10 d), black (post-mate-
data gaps and important factors to improve future             guarded pups, 1−4 wk), brown (pups approximately
population monitoring.                                        4−16 wk), moulting (pups ~16−20 wk) and moulted
                                                              (pups > 20 wk).

                   2. METHODS
                                                                       2.2. Evaluation and identification of
                  2.1. Source data                                             comparable surveys

  The number of pups produced in a breeding sea-                 The duration of ASL breeding seasons varies rela-
son is a commonly used index of abundance for pin-            tive to the pup production of a given breeding site.
niped populations because pups form the only age-             For breeding sites that produce
424 Endang Species Res 44: 421–437, 2021
‘comparable’ if they were made at a similar time version 3.5.1 (R Core Team 2017), using the package
within each breeding season. A challenge with as- ‘lme4’ (Bates et al. 2015).
sessing the data of many early surveys is that cate- The exponential rate of change (r) (slope of the re-
gories of pups based on pelage were either not gression line) was expressed as a percentage rate of
recorded (‘unclassed’), or recorded inconsistently growth (λ) as:
(e.g. brown pups in early moult were sometimes
λ = 100(er – 1) (1)
classed as moulted pups), or were recorded differ-
ently from recent surveys. For example, ‘black mate- An exponential decline was assessed to be the
guarded’ and ‘black’ pups have only been regularly most appropriate for ASL, based on the pattern of
recorded in SA surveys since ~2007; prior to this, decline observed in some subpopulations (Goldswor-
they were recorded as ‘brown’ pups. thy et al. 2019, 2020). In addition, as fisheries bycatch
Surveys were excluded from time-series analyses, is a key threat to the species, and mortality rates (in
if they were assessed to be: ‘Early’ (undertaken prior demersal gillnet fisheries) vary as a function of ASL
to, or early in the breeding season); ‘Late’ (under- density, populations exposed to consistent fishing
taken well after the breeding season had ended); effort would be expected to show a constant propor-
‘Unknown’ (timing relative to the breeding season tional rate of decline (i.e. decline exponentially,
could not be evaluated); ‘Incomplete’ (evidence of Goldsworthy et al. 2010).
inconsistent survey effort, i.e. parts of islands not sur-
veyed where breeding may have taken place); or
‘Incursions’ (evidence that the timing of breeding of 2.4. Assessment against IUCN Red List criteria
neighbouring breeding sites occurred earlier or was
similar to the breeding site being surveyed; pup Assessment of the status of ASL against IUCN Red
counts could be confounded [inflated] if there was List criterion A2(a) (reduction in population size over
significant movement of pups between sites, e.g. 3 generations ≥ 80%: Critically Endangered, ≥ 50%:
tagged Dangerous Reef pups sighted at Lewis, Eng- Endangered and ≥ 30%: Vulnerable) followed IUCN
lish and Albatross Islands; Nicolas Baudin Island Red List guidelines (IUCN Standards and Petitions
pups sighted at Jones Island; Shaughnessy et al. Committee 2019). A generation time of 14.1 yr was
2005, Goldsworthy et al. 2008, 2009b, 2014). estimated for the species using the IUCN generation
length calculator tool (https://www.iucnredlist.org/
resources/generation-length-calculator) and data on
2.3. Time-series analysis observed ASL fecundity and survival from the Seal
Bay ASL subpopulation, which is the only site for the
ASL breeding sites with a time-series of pup abun- species where detailed demographic data are avail-
dance consisting of 3 or more comparable breeding able (Goldsworthy et al. 2020). For each breeding
seasons were used for these analyses. All sites with site, the intercept and coefficient terms from the
admissible data sets were analysed separately, ex- regression were used to estimate past (1977) and
cept for those in the Bunda Cliffs, where site-by-site present (2019) pup abundances, and from these, the
analysis of trends is challenging due to regular cliff overall change in pup abundance over 3 generations
collapses that have resulted in the loss of breeding (42.3 yr) was estimated.
habitat and sites over time. It is not clear what hap- A sensitivity analysis was undertaken following
pens there when a breeding site is lost or becomes IUCN Guidelines for dealing with uncertainty (IUCN
unsuitable, but presumably, some animals move to Standards and Petitions Committee 2019). The prob-
adjacent suitable habitat or to nearby established ability distributions for the back and forward pro-
breeding sites. For these reasons, within-season sur- jected estimates of pup abundances for each subpop-
veys of pup abundance for the Bunda Cliffs breeding ulation with time-series data were estimated using
sites were pooled for the time-series analysis. For the the mean value and the 95% CI (converted to a stan-
pup abundance estimation, drone surveys in 2017 dard deviation) for the earliest and most recent sur-
were used for the Bunda Cliffs region. veys from regression analyses. Using the Monte
The change in pup numbers over time (with parts Carlo simulation method, these probability distribu-
of years expressed as decimals) was estimated using tions were used to provide a measure of the uncer-
regression analysis, which applied a linear regres- tainty around past and present abundance estimates,
sion of the natural logarithm of pup numbers against from which a pair of past and present breeding site
year. All analyses were undertaken in the software R, pup abundance estimates were randomly selected, aGoldsworthy et al.: Australian sea lion status and trends 425
3-generation change was calculated, and the proce- Cove (WA), between the SA and SC-WA metapopu-
dure was repeated 1000 times. By summing all of the lations, > 200 and > 300 km from the nearest breeding
past and present breeding site abundances for each sites in the SC-WA and SA metapopulations, respec-
simulation, the probability distribution for the reduc- tively; it can be considered as a fourth, minor meta-
tion in ASL population size could be estimated, and population (Fig. 1). Within these metapopulations, 12
from this the percentage of iterations where pup regional groups of breeding sites have been identi-
abundances had declined by more than 30% (Vul- fied. These are based on the 11 subregions identified
nerable) and 50% (Endangered) was determined. by Goldsworthy et al. (2007) with their WC-WA sub-
Because the management of ASL falls under both region divided into 2 subregions, Jurien Bay and
state and national environmental legislation, results Abrolhos Islands. The 12 subregions identified here
are primarily presented at both the whole of species are: Kangaroo Island, Spencer Gulf, SW Eyre, Chain
(national) and state level to facilitate management, of Bays, Nuyts Archipelago, Nuyts Reef, Bunda
rather than at the level of region or metapopulation. Cliffs, Twilight Cove, Recherche Archipelago, Bre-
mer Bay, Jurien Bay and Abrolhos Islands (Fig. 1).
A total of 80 extant ASL breeding sites (subpopula-
3. RESULTS tions) were identified, with 48 (60%) in SA, and 32
(40%) in WA (Table 1). There is uncertainty about
3.1. Breeding sites and pup abundance the breeding status of some sites where only single
records of black or brown pups were available (Mid-
Breeding sites for the species are distributed from dle Doubtful, Rat, Morley and Campbell Islands, all
The Pages Islands just off Kangaroo Island, SA, in the in WA), and where only large brown or moulted pups
east, west across the southern coast of Australia and were seen that may have originated from other
north along the west coast of WA to Easter Island in nearby breeding sites (North Islet, SA; Middle
the Abrolhos Islands. The breeding range can be Doubtful Island, SC-WA, and a number of the Abrol-
subdivided into 3 main and discrete regions or hos islands: Square, Lagoon, Keru, Helms, Sandy,
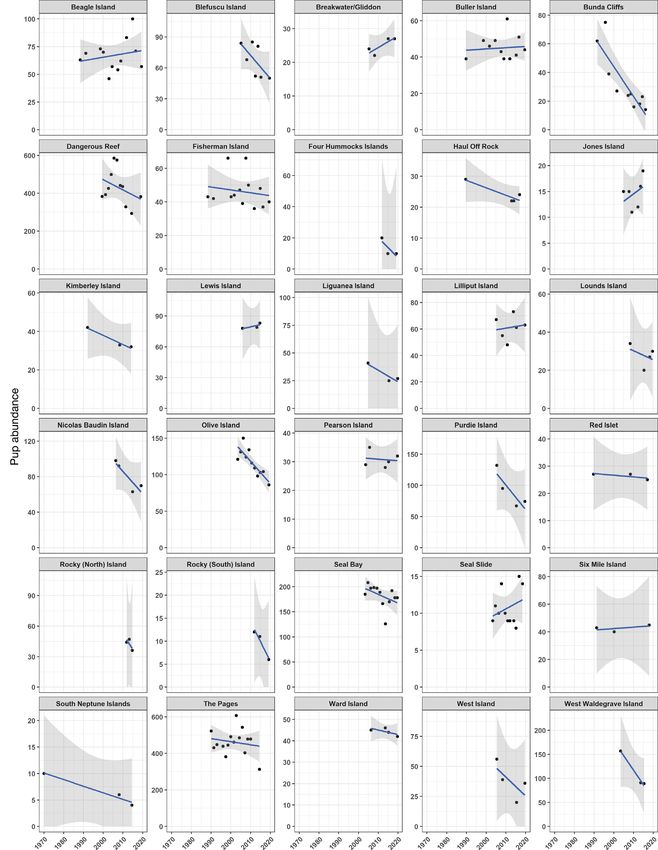
metapopulations: South Australia (SA), south coast West Wallabi and Wooded Island, WC-WA).
WA (SC-WA) and west coast WA (WC-WA) (Fig. 1). The total species-wide pup abundance is 2739, of
The distance between the nearest breeding sites in which 82% (2246) occur in SA and 18% (493) in WA
the SA and SC-WA and the SC-WA and WC-WA (Table 1). This is based on the most recent and/or
metapopulations is > 500 and > 700 km, respectively best available surveys for each site which extend
(Fig. 1). There is a single breeding site at Twilight from 1989 to 2019, but mostly between 2014 and
Fig. 1. Australian sea lion breeding sites within 12 regions (Kangaroo Island, Spencer Gulf, SW Eyre, Chain of Bays, Nuyts Ar-
chipelago, Nuyts Reef, Bunda Cliffs, Twilight Cove, Recherche Archipelago, Bremer Bay, Jurien Bay, Abrolhos Islands) and 3
major (SA: South Australia; SC-WA: south coast Western Australia; WC-WA: west coast WA) and 1 minor (Twilight Cove)
metapopulations (identified by blue shading)Table 1. Summary information on the location, pup abundance and survey history of 80 known Australian sea lion breeding sites. The state (SA: South Australia; WA:
426
Western Australia), region (KI: Kangaroo Island; SG: Spencer Gulf; SWE: SW-Eyre; CB: Chain of Bays; NA: Nuyts Archipelago; NR: Nuyts Reef; BC: Bunda Cliffs; TC:
Twilight Cove; RA: Recherche Archipelago; BB: Bremer Bay; JB: Jurien Bay; AI: Abrolhos Islands) and location (Lat: latitude; Long: longitude) of breeding sites are in-
dicated, as are the most recent survey year and method (G: ground count; CPP: cumulative pup production; MR: mark−recapture; CT: cliff-top survey; D: drone survey)
used to derive the ‘pup count’, and ‘Max count, MR/CPP’ (if listed), along with the data source for the listed survey year (DEW: South Australian Department for Envi-
ronment and Water; DBCA: Western Australian Department of Biodiversity, Conservation and Attractions). The number of breeding season surveys with admissible
data is listed, along with the year (decimal year) of the earliest and most recent admissible survey, and the duration of the time-series (Interval)
Breeding site Region State Lat Long Survey Pup Max count, Source Admissible surveys
(°S) (°E) Year Method count MR/CPP No. Earliest Most Interval
recent (yr)
The Pages Islands KI SA 35.756 138.300 2014 G 313 313 Goldsworthy et al. (2015) 15 1990.1 2014.5 24.4
Seal Slide KI SA 36.028 137.539 2018 G 14 14 Goldsworthy et al. (2019) 11 2003.4 2018.4 15.0
Seal Bay KI SA 35.995 137.317 2019 G, CPP 178 222 Goldsworthy unpubl. data 12 2003.4 2019.6 16.2
Cape Bouguer KI SA 36.042 136.909 2014 G 9 9 Goldsworthy et al. (2015) 1 2014.2 2014.2
North Casuarina Is. KI SA 36.068 136.703 2014 G 11 11 Goldsworthy et al. (2015) 1 2014.1 2014.1
Peaked Rocks SG SA 35.183 136.483 2020 G 59 59 Goldsworthy et al. (2012) 1 2020.2 2020.2
Western Isles SG SA 35.370 136.847 2020 A 10 10 Goldsworthy et al. (2012) 1 2020.2 2020.2
Dangerous Reef SG SA 34.817 136.217 2019 G 382 382 DEW 11 1999.5 2019.0 19.4
English Is. SG SA 34.637 136.197 2011 G 34 34 Goldsworthy et al. (2012) 0
Albatross Is. SG SA 35.069 136.181 2011 G 69 69 Goldsworthy et al. (2012) 2 2009.9 2011.4 1.5
South Neptune Islands SG SA 35.333 136.117 2014 G 4 4 Goldsworthy et al. (2015) 3 1970.0 2014.5 44.5
North Neptune Islands SG SA 35.226 136.077 2014 G 9 9 Goldsworthy et al. (2015) 1 2005.4 2005.4
Lewis Is. SG SA 34.957 136.032 2014 G 83 83 Goldsworthy et al. (2015) 3 2005.9 2014.7 8.8
Williams Is. SG SA 35.035 135.974 2019 G 2 2 Goldsworthy et al. (2020) 2 2014.7 2019.2 4.4
Curta Rocks SG SA 34.934 135.874 2019 G 5 5 Goldsworthy et al. (2020) 2 2014.7 2019.2 4.4
Liguanea Is. SG SA 34.998 135.619 2019 G 27 27 Goldsworthy et al. (2020) 3 2004.9 2019.8 14.9
Price Is. SWE SA 34.717 135.283 2014 G 32 32 Goldsworthy et al. (2015) 1 2014.9 2014.9
Four Hummocks Is. SWE SA 34.769 135.031 2019 G 10 10 Goldsworthy et al. (2020) 3 2011.9 2019.2 7.3
Rocky (South) Is. SWE SA 34.810 134.718 2019 G 6 6 Goldsworthy et al. (2020) 3 2011.9 2019.2 7.3
Endang Species Res 44: 421–437, 2021
Rocky (North) Is. SWE SA 34.267 135.267 2014 G 36 36 Goldsworthy et al. (2015) 3 2011.9 2014.7 2.9
Cap Island SWE SA 33.947 135.113 2014 G 31 31 Goldsworthy et al. (2015) 2 2011.9 2014.7 2.9
West Waldegrave Is. CB SA 33.600 134.783 2015 G 89 89 Goldsworthy et al. (2015) 3 2003.5 2015.3 11.8
Jones Is. CB SA 33.183 134.367 2014 G 19 19 Goldsworthy et al. (2015) 6 2005.0 2014.8 9.8
Point Labatt CB SA 33.152 134.261 2013 G 2 2 Goldsworthy et al. (2014) 0
Pearson Is. CB SA 33.950 134.267 2019 G 32 32 Goldsworthy et al. (2015) 5 2003.7 2019.7 16.0
Ward Is. CB SA 33.750 134.300 2019 G 42 42 Goldsworthy et al. (2020) 4 2006.4 2019.7 13.3
Nicolas Baudin Is. CB SA 33.010 134.126 2019 G 70 70 Goldsworthy et al. (2020) 4 2006.4 2019.2 12.8
Olive Is. CB SA 32.717 133.983 2019 G 86 86 Goldsworthy et al. (2020) 11 2003.5 2019.3 15.8
Lilliput NA SA 32.449 133.669 2019 G 63 63 Goldsworthy et al. (2020) 6 2005.2 2019.6 14.4
Blefuscu NA SA 32.462 133.639 2019 G 50 50 Goldsworthy et al. (2020) 7 2005.2 2019.6 14.4
Breakwater/Gliddon Is. NA SA 32.322 133.561 2015 G 27 27 Goldsworthy et al. (2015) 4 2005.4 2018.2 12.7
Lounds Is. NA SA 32.273 133.366 2019 G 30 30 Goldsworthy et al. (2020) 4 2008.3 2019.6 11.3
Fenelon Is. NA SA 32.583 133.283 2019 G 31 31 Goldsworthy et al. (2020) 2 2008.3 2019.6 11.4
West Is. NA SA 32.517 133.250 2019 G 36 36 Goldsworthy et al. (2020) 4 1992.0 2019.6 27.6
Purdie Is. NA SA 32.283 133.233 2019 G 74 74 Goldsworthy et al. (2020) 4 2005.4 2019.6 14.2
Nuyts Reef NR SA 32.117 132.133 2019 G 122 122 Goldsworthy et al. (2020) 2 2015.4 2019.7 4.3
Table continued on next pageTable 1 (continued)
Breeding site Region State Lat Long Survey Pup Max count, Source Admissible surveys
(°S) (°E) Year Method count MR/CPP No. Earliest Most Interval
recent (yr)
Bunda 01 BC SA 31.481 131.061 2016, 2018 CT, D - 2 DEW
Bunda 06 BC SA 31.414 130.562 2016, 2019 CT, D 1 8 DEW ⎫
Bunda 07 BC SA 31.413 130.069 2016, 2019 CT, D - 4 DEW
Bunda 09 BC SA 31.412 130.046 2016, 2019 CT, D 6 15 DEW ⎥
Bunda 11 BC SA 31.392 129.784 2016, 2017 CT, D - 1 DEW 10 1991.6 2016.1 24.6
Bunda 12 BC SA 31.390 129.763 2016, 2017 CT, D - 7 DEW ⎬
Bunda 18 BC SA 31.363 129.429 2016, 2019 CT, D - 1 DEW
Bunda 19 BC SA 31.359 129.377 2016, 2017 CT, D 5 14 DEW ⎥
Bunda 20 BC SA 31.357 129.357 2016, 2017 CT, D 2 1 DEW
Bunda 22 BC SA 31.351 129.308 2016, 2017 CT, D - 13 DEW ⎭
Bunda 152 BC SA 31.364 129.447 2016, 2017 CT, D - 11 DEW 0
Bunda 155 BC SA 31.369 129.479 2016, 2017 CT, D - 28 DEW 0
Twilight Cove TC WA 32.277 126.006 1996 G 4 4 Dennis & Shaughnessy (1999) 0
Spindle Is. RA WA 33.763 124.161 1990 G 53 53 Gales (1990), Gales et al. (1994) 0
Ford (Halfway) Is. RA WA 33.766 124.041 1990 G 17 17 Gales (1990), Gales et al. (1994) 1 1990.0 1990.0
Six Mile Is. RA WA 33.640 123.968 2017 G 45 45 DBCA 3 1991.3 2017.9 26.5
Round Is. RA WA 34.105 123.888 2013 G 13 13 DBCA, Goldsworthy unpubl. data 1 2013.9 2013.9
Salisbury Is. RA WA 34.360 123.552 2014 G 10 10 DBCA 2 1990.5 2014.2 23.8
Wickham (Stanley) Is. RA WA 34.020 123.291 2014 G 5 5 DBCA 2 1989.4 2014.2 24.9
George Is. RA WA 34.050 123.259 2011 G 13 13 DBCA 1 2011.1 2011.1
Glennie Is. RA WA 34.096 123.105 1999 G 21 21 DBCA 2 1992.1 1999.7 7.6
Taylor Is. RA WA 33.920 122.873 2013 G 4 4 DBCA, Goldsworthy unpubl. data 0
Kimberley Is. RA WA 33.949 122.469 2014 G 32 32 DBCA 3 1992.1 2014.2 22.1
Cooper Is. RA WA 34.231 123.607 2014 G 8 8 DBCA 1 2014.2 2014.2
Investigator (Rocky) Is. BB WA 34.083 120.867 1989 G 17 17 Gales et al. (1994) 1 1989.7 1989.7
West Is. BB WA 34.082 120.485 1991 G 20 20 Gales et al. (1994) 0
Red Islet BB WA 34.040 119.780 2017 G 25 25 DBCA 3 1989.7 2017.0 27.4
Middle Doubtful Is. BB WA 34.376 119.609 2012 G 1 1 DBCA 1 1989.7 1989.7
Haul Off Rock BB WA 34.702 118.661 2016 G 24 24 DBCA 4 1989.7 2016.9 27.3
Buller Is. JB WA 30.657 115.115 2019 G 44 44 DBCA 12 1989.8 2019.5 29.7
Beagle Is. JB WA 29.808 114.877 2019 G 57 57 DBCA 12 1988.4 2019.4 31.0
Goldsworthy et al.: Australian sea lion status and trends
North Fisherman Is. JB WA 30.130 114.944 2019 G 40 40 DBCA 13 1988.4 2019.4 31.0
Morley Is AI WA 28.746 113.813 2006 G 1 1 DBCA 0
Suomi Is. AI WA 28.719 113.837 2006 G 4 4 DBCA 1 2006.8 2006.8
Rat Is. AI WA 28.715 113.784 2014 G 1 1 DBCA 0
Campbell Is AI WA 28.694 113.836 2004 G 1 1 DBCA 1 2004.3 2004.3
Leo Is. AI WA 28.688 113.860 2006 G 2 2 DBCA 0
Gibson Is AI WA 28.687 113.829 2006 G 6 6 DBCA 1 2007.1 2007.1
Serventy Is. AI WA 28.680 113.832 2006 G 3 3 DBCA 1 2006.8 2006.8
Stokes Is. AI WA 28.673 113.852 2013 G 2 2 DBCA 1 2013.3 2013.3
Alexander Is. AI WA 28.673 113.830 2006 G 3 3 DBCA 1 2006.0 2006.0
Gilbert Is. AI WA 28.667 113.827 2006 G 9 9 DBCA 1 2006.8 2006.8
Long Is. AI WA 28.471 113.774 2006 G 2 2 DBCA 0
Easter Is. AI WA 28.468 113.814 2006 G 6 6 DBCA 1 2006.9 2006.9
Total SA 2111 2246
Total WA 493 493
427
Overall total 2604 2739428 Endang Species Res 44: 421–437, 2021
estimates, with at least 1 admissible survey obtained
in the last decade, were available for 60 (75%) of the
80 breeding sites (96% of SA and 44% of WA sites)
(Table 2).
3.2. Trends in abundance
Of the 1776 individual site-surveys evaluated, just
228 (13%) from 60 breeding sites were judged to pro-
vide admissible data. Of these, 189 surveys from 30
breeding sites (38% of total breeding sites) had 3 or
more comparable breeding season surveys suitable
for trend analysis (Table 2, Fig. 3). Of these 30 breed-
ing sites, 77% were in SA and 23% were in WA; fur-
thermore, they accounted for 74% of the species-wide
pup abundance (79% of SA, and 54% of WA pup
abundance). The duration between the earliest and
most recent survey ranged between 1.5 and 44.5 yr
Fig. 2. Comparison of the distribution of regional totals of (mean = 16.4 yr) for all breeding sites (Table 1), and
Australian sea lion pups, highlighting the general increas-
ing cline in pup abundance by region from the western to between 2.9 and 44.5 yr (mean = 18.5 yr) for breeding
the eastern part of the species’ range sites with 3 or more comparable surveys (Table 3).
Results of regression analyses undertaken on the
2019. There is a general cline in regional pup abun- 30 breeding sites with 3 or more comparable pup
dances, increasing from west to east across the spe- abundance surveys are detailed in Table 3 and Fig. 3.
cies’ range, largely reflecting the greater pup abun- The average growth rate among the 30 breeding
dance in SA, but also larger breeding sites (Fig. 2). sites was −2.0% yr−1 (range −9.9 to 1.7% yr−1,SD =
Only 4 sites produce more than 100 pups in a breed- 3.0%) and varied considerably among breeding sites
ing season, and all are in SA (The Pages Islands, Seal (Fig. 4). For SA, the average growth rate was −2.6%
Bay, Dangerous Reef, Nuyts Reef). These sites make yr−1 (SD = 3.2%; n = 23 sites) and for WA, it was
up 38% of total pup abundance but just 5% of breed- −0.3% yr−1 (SD = 0.6%; n = 7 sites) (Table 3). Overall,
ing sites. Most (81%) breeding sites produce fewer the median growth rate was −1.2% yr−1.
than 50 pups in a breeding season, and 56% produce There was no clear geographic pattern in the
fewer than 20 (Table 1). The species-wide median growth rates of breeding sites among or within re-
pup abundance per breeding site is just 14 (27.0 in gions (Tables 3 & 4). The greatest rates of decline
SA, 8.5 in WA). were in the SW Eyre (−8.7% yr−1) and Bunda Cliffs
Baseline data, defined as having admissible data (−5.9% yr−1) regions, followed by the Nuyts Archi-
from at least 1 survey, were available for 70 (88%) of pelago (−1.9% yr−1), Chain of Bays (−1.6% yr−1) and
the 80 breeding sites across the species’ range (96% Spencer Gulf (−1.5% yr−1) (Table 4). The lowest de-
of SA and 75% of WA sites) (Table 2). Contemporary clines were in the Recherche Archipelago and Bre-
mer Bay regions (both −0.6% yr−1), and Kangaroo
Island (−0.1% yr−1) (Table 4). The only region record-
Table 2. Number of Australian sea lion breeding sites by state (SA:
South Australia; WA: Western Australia), and the number (%) with
ing stable/positive growth was the Jurien Bay region
baseline data (at least 1 survey with admissible data), with con- (Table 4). Changes in population growth rates could
temporary estimates (at least 1 admissible survey obtained in the not be determined for Nuyts Reef, Twilight Cove or
last decade), and 3 or more comparable (admissible) surveys the Abrolhos Islands regions.
State Breeding Baseline Contemporary ≥ 3 comparable
sites data (%) estimate (%) surveys (%) 3.3. Population reduction
SA 48 46 (96) 46 (96) 23 (48)
WA 32 24 (75) 14 (44) 7 (22) Regression analyses undertaken on the 30 breed-
Total 80 70 (88) 60 (75) 30 (38) ing sites with 3 or more comparable surveys were
used to estimate the reduction between past andGoldsworthy et al.: Australian sea lion status and trends 429
Fig. 3. Trends in pup abundance for 30 Australian sea lion subpopulations with 3 or more comparable surveys. The plots show
changes in pup abundance over time for each breeding site, to which an exponential regression model with ± 95% confidence
limits (shaded) has been applied430 Endang Species Res 44: 421–437, 2021
Table 3. Summary results of trend analyses for the 30 Australian sea lion breeding sites with 3 or more comparable surveys
across 3 regions (SA: South Australia; SC-WA: south coast Western Australia; WC-WA: west coast WA). The year (decimal
year) of the earliest and most recent comparable survey at each breeding site is provided, along with the time-series duration
and number of surveys. For each site, the estimated change in past and present pup abundances over a 3-generation period
(42.3 yr) between 1977.2 (1977) and 2019.5 (2019) is provided, along with intrinsic rate of change (r), and estimated 3-genera-
tion change (%). The mean r, summed pup abundance (1977, 2019) and 3-generation change (%) in pup abundances are also
provided at the bottom of the table for SA, WA and the overall population. The time-series data and sources are provided in
Table S1 in the Supplement at www.int-res.com/articles/suppl/n044p421_supp.pdf
Breeding site Region Earliest Most recent Time series Number of r Pups Pups Estimated 3-gen
survey survey duration (yr) surveys 1977 2019 change (%)
The Pages SA 1990.1 2014.5 24.4 15 −0.005 514 418 −18.6
Seal Slide SA 2003.4 2018.4 15.0 11 0.011 7 12 58.9
Seal Bay SA 2003.4 2019.6 16.2 12 −0.010 253 167 −33.9
South Neptune Islands SA 1970.0 2014.5 44.5 3 −0.018 9 4 −53.5
Dangerous Reef SA 1999.5 2019.0 19.4 11 −0.014 639 359 −43.8
Lewis Is. SA 2005.9 2014.7 8.8 3 0.005 67 84 25.5
Liguanea Is. SA 2004.9 2019.8 14.9 3 −0.032 95 25 −73.6
Rocky (South) Is. SA 2011.9 2019.2 7.3 3 −0.099 396 6 −98.5
Four Hummocks Islands SA 2011.9 2019.2 7.3 3 −0.088 366 9 −97.6
Rocky (North) Is. SA 2011.9 2014.7 2.9 3 −0.074 615 26 −95.7
Jones Is. SA 2005.0 2014.8 9.8 6 0.017 8 17 109.3
West Waldegrave Is. SA 2003.5 2015.3 11.8 3 −0.050 584 70 −88.0
Pearson Is. SA 2003.7 2019.7 16.0 5 −0.001 32 30 −6.1
Ward Is. SA 2006.4 2019.7 13.3 4 −0.005 53 43 −18.7
Nicolas Baudin Is. SA 2006.4 2019.2 12.8 4 −0.031 234 63 −73.1
Olive Is. SA 2003.5 2019.3 15.8 11 −0.027 286 90 −68.4
Lilliput Is. SA 2005.2 2019.6 14.4 6 0.005 52 63 21.5
Blefuscu Is. SA 2005.2 2019.6 14.4 7 −0.035 225 51 −77.5
Breakwater/Gliddon Is. SA 2005.4 2018.2 12.7 4 0.014 15 28 79.8
Lounds Is. SA 2008.3 2019.6 11.3 4 −0.015 49 26 −47.7
West Is. SA 1992.0 2019.6 27.6 4 −0.041 149 26 −82.4
Purdie Is. SA 2005.4 2019.6 14.2 4 −0.041 375 66 −82.5
Bunda Cliffs SA 1991.6 2016.1 24.6 10 −0.059 150 12 −91.9
Six Mile Is. SC-WA 1991.3 2017.9 26.5 3 0.002 40 44 10.7
Kimberley Is. SC-WA 1992.1 2014.2 22.1 3 −0.013 51 29 −41.9
Red Islet SC-WA 1989.7 2017.0 27.4 3 −0.002 28 25 −9.5
Haul Off Rock SC-WA 1989.7 2016.9 27.3 4 −0.009 32 22 −32.6
Buller Is. WC-WA 1989.8 2019.5 29.7 12 0.001 43 45 6.1
Beagle Is. WC-WA 1988.4 2019.4 31.0 12 0.004 59 69 16.3
North Fisherman Is. WC-WA 1988.4 2019.4 31.0 13 −0.004 51 43 −15.1
South Australia −0.026 5174 1694 −67.2
Western Australia −0.003 304 278 −8.4
Overall −0.020 5477 1973 −64.0
present pup abundances over a period of 3 genera- 4. DISCUSSION
tions (42.3 yr) between 1977.2 (1977) and 2019.5
(2019) (Table 3). Overall, pup abundance estimates 4.1. Species-wide assessment
were 5477 in 1977 and 1973 in 2019, giving an esti-
mated decline over 3 generations of 64.0% (Table 3). This study provides the first quantitative estimate
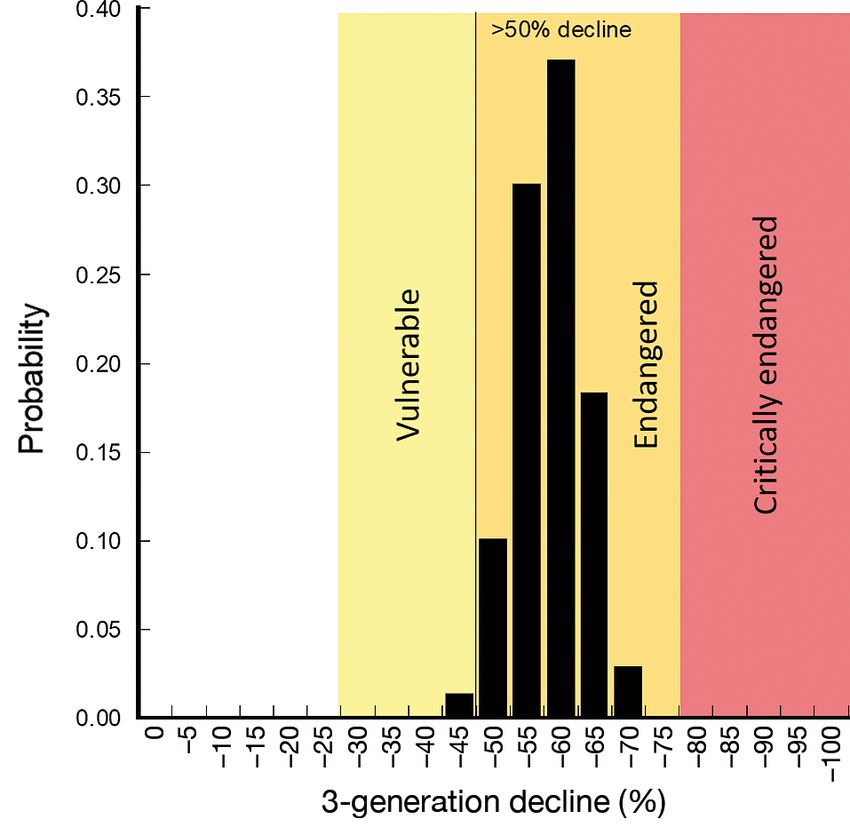
The probability distribution of the reduction in the of the trends in abundance of ASL populations across
ASL population over 3 generations based on Monte their range, although trends could not be determined
Carlo simulations indicates that the probability that for some subregions. We found that the ASL popula-
the pup abundances have declined by at least 30% tion is much smaller than previously estimated, and
over a 3-generation period was 100% (1000 of 1000 is declining. This reduction in population size (based
simulations), and the probability that they have on pup abundance) exceeds 50% over a period of 3
declined by at least 50% over a 3-generation period generations (42.3 yr), and clearly meets the ‘Endan-
was > 98% (> 980 of 1000 simulations) (Fig. 5). The gered’ criteria (decline ≥ 50% and ≤ 80%) under IUCN
median decline in pup abundance over 3 generations Criterion A2b (namely, A2: ’Population reduction
was 61%. observed, estimated, inferred, or suspected in theGoldsworthy et al.: Australian sea lion status and trends 431
Fig. 5. Probability distribution of Monte Carlo simulations of
Fig. 4. Estimated growth rates of 30 Australian sea lion sub- the decline over 3 generations in 30 Australian sea lion
populations, based on 3 or more comparable surveys of pup breeding sites, where at least 3 comparable pup abundance
abundance surveys have been undertaken. The vertical line indicates
the threshold for IUCN ‘Endangered’ status corresponding
Table 4. Summary by region of the number of Australian sea to a > 50% decline
lion breeding sites, the number of sites with admissible time-
series data (3 or more comparable surveys) and the average
intrinsic rate of growth (r). (–) no average for these regions
species-wide assessment in trends in abundance is
both representative and robust: the 30 sites where
Region No. With Average trends in abundance could be estimated account for
sites admissible r
time series over 75% of the species-wide pup abundance; they
span most of the geographic range of the species;
Kangaroo Island 5 3 −0.001 and our assessment of population reduction is rela-
Spencer Gulf 11 4 −0.015 tively insensitive to the error distributions around
SW Eyre 5 3 −0.087
past and present breeding site pup abundances (over
Chain of Bays 7 6 −0.016
Nuyts Archipelago 7 6 −0.019 98% of Monte Carlo simulations produced a decline
Nuyts Reef 1 0 − of > 50% over a 3-generation period).
Bunda Cliffsa 12 1 −0.059 The average rates of declines in pup abundances
Twilight Cove 1 0 − were greater for SA (−2.6% yr−1) compared to WA
Recherche Archipelago 11 2 −0.006
Bremer Bay 5 2 −0.006 (−0.3% yr−1) breeding sites. However, this apparent
Jurien Bay 3 3 0.000 difference may be an artefact of the low survey effort
Abrolhos Islands 12 0 − across large parts of the WA ASL distribution. Most
a
(~75%) of the WA time-series data come from just 3
For the Bunda Cliffs region, all breeding site data were
pooled within surveys
sites within a state marine reserve in the Jurien Bay
region (which accounts for 29% of the WA ASL pup
abundance) that have been frequently surveyed over
past where the causes of reduction may not have the last 30 yr. It is unclear how representative the
ceased OR may not be understood OR may not be Jurien Bay breeding sites are of ASL trends else-
reversible’ and b: ’an index of abundance appropri- where in WA. Time-series data for the remaining WA
ate to the taxon’) (IUCN Standards and Petitions regions (Abrolhos, Bremer Bay, Recherche Archipel-
Committee 2019, p. 16). Results from our study are ago, Twilight Cove) that account for 71% of the WA
consistent with the current IUCN Red List assess- ASL pup abundance are very limited, with just 13
ment for the species (Goldsworthy 2015). Three admissible surveys across 4 of the remaining 29
important considerations provide confidence that the breeding sites.432 Endang Species Res 44: 421–437, 2021 Our results suggest that total pup abundance for clining, stable or increasing) occur in close proximity the species (integrated across 80 known breeding to each other. For example, the Nuyts Archipelago sites) is at least 25% lower than that derived from an region contains 7 breeding sites within a 25 km assessment based mostly on surveys conducted some radius. Trend data are available for 6 of these sites, 3 11 to 15 yr earlier (between 2004 and 2008) of 3622 of which have been declining by more than 3% yr−1 pups (Shaughnessy et al. 2011). However, our study (Purdie, West, Blefluscu Islands), 1 that is declining by also included pup numbers from 6 recently discov- ~1.5% yr−1 (Lounds Island) and 2 that are stable or ered breeding sites (SA: Western Isles, Williams increasing (Lilliput Island, Breakwater/Gliddon Reef). Island, Curta Rocks, Rocky [South] and Cap Islands; Inasmuch as the strong cline in regional abundances WA: George Island; their combined pup abundance points to the influence of larger-scale oceanographic was 67), and from 3 sites where earlier surveys ap- processes driving a general increase in coastal marine pear to have been conducted either too early or out- productivity (and ASL population size) from west to side the breeding season (Nuyts Reef, North Casuar- east (van Ruth et al. 2010), the marked within-region ina and Rocky [North] Islands, which underestimated heterogeneity in the size and trends in ASL breeding pup abundance by at least 138 pups). These 2 factors sites points to the importance of local-scale factors in suggest that earlier surveys may have underesti- shaping within-region differences in population dy- mated pup number by at least 205. Accounting for namics. The latter is likely enhanced by marked inter- these factors suggests an even greater decline of site and inter-individual differences in foraging stra- around 30% over the last 15 yr. tegies, which have been identified from satellite Shaughnessy et al. (2011) estimated the total size of telemetry studies (Goldsworthy et al. 2009c, Lowther the ASL population to be 14 780, based on multiply- & Goldsworthy 2011a,b). As such, there is potential ing pup numbers by 4.08 to estimate total population for marked inter-individual and inter-site variability size. That multiplier was developed by Goldsworthy in exposure to natural and anthropogenic risks. & Page (2007) and was based on a generic otariid life-table developed by Goldsworthy et al. (2003), adjusted for a 1.5 yr breeding interval and female 4.2. Historic and current impacts on populations longevity of 25 yr. A more recent ASL life-table that utilised survival estimates from the Seal Bay popula- Limited historic information is available on the size tion, adjusted to achieve a stable population growth, and range of ASL populations prior to European derived a multiplier of pup numbers to total popula- colonisation. As with fur seals, the species was sub- tion size of 3.83 (Goldsworthy et al. 2010). With this ject to uncontrolled sealing following European set- multiplier, the size of the ASL population based on tlement, but the numbers recorded to have been surveys from 2004 to 2008 becomes 13 872; and for taken between 1800 and 1830 (4116) and in 1851− the present study (surveys up to 2019) it is 10 402. 1852 (745) are small relative to the numbers of Aus- These are likely to be over-estimates because the ap- tralian fur seals Arctocephalus pusillus doriferus and propriate multiplier depends on the growth rates of long-nosed fur seals A. forsteri (350 000) (Ling 1999, the populations (Harwood & Prime 1978), which are Stuart 2018). Historic accounts indicate that the known to differ among breeding sites. In both in- range of ASL once extended east to the southern stances, the ASL population was assumed to be stable, Furneaux (Clarke, Passage and Battery Islands) and but the reduction in pup abundance between the 2 Kent Group in Bass Strait (Warneke 1982), but there surveys indicates that a lower multiplier may be more is great uncertainty about the size and range of pre- appropriate, and that the total population may num- sealing populations, about the impact that sealing ber
Goldsworthy et al.: Australian sea lion status and trends                          433

ment of Sustainability Environment Water Popula-              ASL populations. As detailed above, key regions that
tion and Communities 2013). These include deaths              are poorly represented include the Abrolhos Islands,
caused by bycatch in fisheries, interactions with             Bremer Bay, Recherche Archipelago and Twilight
aquaculture operations and entanglement in marine             Cove, all in WA. These regions have had low survey
debris; habitat degradation and prey depletion;               effort over recent decades based in part on their re-
human disturbance to breeding sites (including                moteness and lack of accessibility. As a consequence,
tourism); deliberate killings; disease; pollution and         when surveys are undertaken, there is a high likeli-
oil spills; and climate change with potential inunda-         hood they will occur outside the breeding season and
tion of breeding sites and changes to food webs and           not provide admissible data. Less than half of these
prey availability (Goldsworthy et al. 2009a). Data on         sites (45%) have had an admissible, contemporary
the relative and cumulative importance of these fac-          survey within this last decade, and only 14% of them
tors is limited. Known impacts include fisheries by-          have 3 or more comparable surveys from which a
catch (especially in demersal gillnets), entanglement         trend in abundance can be estimated. The situation
in marine debris and disease (hookworm) (Page et al.          for SA populations is much better, but there are still a
2004, Goldsworthy & Page 2007, Goldsworthy et al.             number of breeding sites with no baseline surveys, or
2010, Hamer et al. 2013, Marcus et al. 2014, 2015).           for which an acceptable survey has only been
The relative impacts of these on the population sus-          achieved recently. More than half of the breeding
tainability has only been assessed for bycatch in the         sites still lack enough comparable surveys from
demersal gillnet fishery off SA. Between 2006 and             which to assess trends. Committing to a more syste-
2009, bycatch mortality was estimated to be unsus-            matic survey approach is the only way to address
tainable over much of the species’ range, and was             these key gaps and improve confidence in the status
likely to have resulted in declines observed at some          and trends in abundance of ASL across their range.
breeding sites (Goldsworthy et al. 2010). Between                Given the asynchronous breeding pattern of the
2010 and 2012, the Australian Fisheries Manage-               species, a critical aspect of survey success (irrespec-
ment Authority introduced a range of management               tive of the methodology used) is timing the surveys of
measures into the gillnet, hook and trap fishery off          individual sites appropriately with respect to their
SA to mitigate bycatch of ASL, including spatial clo-         breeding season and their pup production. As noted
sures around all ASL breeding sites, electronic mon-          in Section 2, the duration of an ASL breeding season
itoring of fishing activity, bycatch trigger limits and       in a particular breeding site varies with its pup pro-
the ability to use alternate fishing methods (hooks)          duction, and this affects how surveys are designed/
(Australian Fisheries Management Authority 2015).             planned, particularly the number of surveys and
Logbook data on ASL interactions reported since               their timing relative to the beginning and end of the
2012 suggest that these measures have reduced ASL             pupping season. For most breeding sites (
434                                     Endang Species Res 44: 421–437, 2021

cially for sites that have not been surveyed for some       increase in survey efficiency and capacity. The use of
years. As such, maintaining knowledge on the timing         helicopters has enabled multiple sites to be surveyed
of breeding seasons for sites is critical to ensure the     within a day, quickly and efficiently, and has in-
successful timing of future surveys. Beyond the tim-        creased the capacity to monitor ASL regional breed-
ing of surveys, consistency in the survey approach is       ing phenology (without necessarily having to land at
essential. In particular, accurate recognition of pup       each island). Given that many breeding sites are just
pelage categories during surveys is critical to deter-      tens of kilometres apart, it is feasible to survey all
mining survey timing relative to the stage of the           breeding sites within a region by helicopter over the
breeding season, and in evaluating if the survey pro-       course of 1−2 d. In past decades, ASL breeding sites
vides admissible data for trend analysis.                   were largely accessed by boat, limiting the number
                                                            of sites that could be feasibly surveyed, with access
                                                            often curtailed by unfavourable weather conditions.
      4.4. Recommendations on future monitoring             Such logistic constraints dictated a monitoring strat-
               strategies for the species                   egy focussed on a small number of ‘key’ (accessible)
                                                            sites, which were hoped to be indicative of regional
   Population genetic studies on ASLs have indicated        trends and abundance (Goldsworthy et al. 2009a,b,
little or no interchange of females between breeding        Pitcher 2018). Over the last decade, the monitoring
sites, even for those separated by short distances          strategy for ASLs in SA has changed to undertaking
(Campbell et al. 2008b, Lowther et al. 2012). The im-       regionally comprehensive surveys, because helicop-
portant conservation implication from such extreme          ters make this feasible, efficient and cost-effective
philopatry is that each breeding site is effectively a      (Goldsworthy et al. 2015, 2020). This change has
closed population. In light of this, conservation and       markedly improved the information on the status of
management measures need to focus at the level of           ASLs at many breeding sites, resulted in the discov-
the breeding site (subpopulation). That half of the         ery of a number of new breeding sites, enabled re-
known ASL breeding sites produce fewer than 14              gional trends in abundance to be assessed and facil-
pups every 18 mo with the likelihood that most sites        itated a more comprehensive assessment of the
are effectively closed subpopulations, heightens the        conservation status of the species across its range.
conservation imperative to improve monitoring ef-              ASLs typify many of the current issues facing
forts. At the most basic level, identifying and manag-      global sea lion populations. Their dependence on
ing threats to facilitate recovery of the species will be   shallow coastal seas exposes populations to in-
underpinned by an ability to detect changes in the          creased interactions with human activities, which are
status and trends of individual breeding sites/             the prevailing cause of the decline in most species
subpopulations.                                             (Kovacs et al. 2012). As high trophic-level marine
   A future monitoring strategy is essential to meet        megafauna, the status of sea lion populations reflects
the objectives of the Australian Sea Lion Recovery          the health and integrity of their marine ecosystems,
Plan (Department of Sustainability Environment              and they are harbingers of biodiversity loss and
Water Population and Communities 2013), and en-             human impacts in our coastal seas (Boyd et al. 2006,
sure that any recovery following management and             Hazen et al. 2019). Improved monitoring of the spe-
threat mitigation (such as bycatch mortality in dem-        cies will increase the understanding of population
ersal gillnet fisheries) can be adequately assessed.        dynamics and the targeting and assessment of criti-
Most historic monitoring has been ad hoc and oppor-         cal conservation measures.
tunistic, resulting in many surveys being undertaken
at the wrong time and providing inadmissible data.
As a consequence, significant gaps in baseline data         Acknowledgements. We thank the Australian Marine Mam-
remain over much of the species’ range, and limited         mal Centre (AMMC), the Department for Environment and
time-series data are available to assess trends in          Water (DEW) (SA) and the Department of Biodiversity, Con-
                                                            servation and Attractions (DBCA) (WA) for supporting the
abundance. Developing and committing to a more              surveys of Australian sea lion breeding sites. Surveying of
systematic monitoring strategy is essential to address      some breeding sites in SA was supported by in-kind funding
these key gaps and enhance current monitoring of            received from the Great Australian Bight Research Program,
the species.                                                a collaboration between BP, CSIRO, the South Australian
                                                            Research and Development Institute (SARDI), The Univer-
   Recent survey efforts in SA using helicopters have       sity of Adelaide and Flinders University. The work was con-
improved access to breeding sites on islands com-           ducted under an animal ethics permit from the SA Depart-
pared to boat transport, thereby facilitating a marked      ment of Primary Industry and Regions (PIRSA) Animal
Goldsworthy et al.: Australian sea lion status and trends 435
Ethics Committee (Approval No. 32-12) and the DEW, Sci- 2020/2/3. https://www.cbd.int/doc/c/efb0/1f84/a892b98
entific Research Permit (A24684). We thank Janice Good- d2982a829962b6371/wg2020-02-03-en.pdf (accessed 11
wins, Sandy Carruthers and Lisien Loan (DEW) for facilitat- Nov 2020)
ing recent surveys in SA, and Dr. Rebecca McIntosh (Phillip Committee on Taxonomy (2020) List of marine mammal spe-
Island Nature Park), Clarence Kennedy, Melanie Stonnill, cies and subspecies. Society for Marine Mammalogy.
Tanya Rosewarne, Alana Binns, Martine Kinloch (DEW) and www.marinemammalscience.org/science-and-publica
other DEW staff involved in Australian sea lion monitoring tions/list-marine-mammal-species-subspecies/
at Seal Bay and the Seal Slide on Kangaroo Island. For logis- (accessed 21 Jan 2021)
tic assistance with island surveys, we thank Erin Gibson, Dennis TE, Shaughnessy PD (1999) Seal survey in the Great
Sam Hensche and Will Miles (Helifarm), Tony Jones (Protec Australian Bight region of Western Australia. Wildl Res
Marine, Aqualinc Marine), Darren Guidera and Kangaroo 26:383−388
Island Helicopters. For assistance with field work, we thank Department of Sustainability Environment Water Population
Jarrod Hodgson, Sol Kraitzer, Paul Rogers, Leonardo Man- and Communities (2013) Recovery plan for the Aus-
tilla, Alex Dobrovolskis and Ian Moody (SARDI), Kristian tralian sea lion (Neophoca cinerea). Commonwealth of
Peters, Andrew Sleep, Robbie Sleep, Yasmin Wolfe and Australia, Canberra
Dyson Taverner (DEW), Emma Rowe, Lisa West, Matt Gales NJ (1990) Abundance of Australian sea lions
Dasey, Vaughn Chapple, Melissa Evans, Miecha Bradshaw, Neophoca cinerea along the southern Australian coast,
Stephen Goodlich, Anthony Desmond, Jon Pridham, Sarah and related research. Report to the Western Australian
Comer and Stephen Butler (DBCA), Richard Campbell, Department of Conservation and Land Management,
David Holley, Kevin Crane, Paul Jennings and Peter Collins South Australian National Parks and Wildlife Service
(formerly DBCA), Sylvia Osterrieder and Chandra Salgado- and the South Australian Wildlife Conservation Fund,
Kent (formerly of Curtin University), Mathew Hourston Perth
(Department of Primary Industries and Regional Develop- Gales NJ, Costa DP (1997) The Australian sea lion: a
ment) and Rory McAuley. We thank Professor Helene Marsh review of an unusual life history. In: Hindell M, Kem-
(Chair of Threatened Species Scientific Committee), Profes- per CM (eds) Marine mammal research in the South-
sor David Keith (University of New South Wales) and Dr. ern Hemisphere, Book 1. Surrey Beatty and Sons,
Ivan Lawler (Department of Agriculture, Water and the Sydney, p 78–87
Environment) for analytical advice. Gales NJ, Shaughnessy PD, Dennis TE (1994) Distribution,
abundance and breeding cycle of the Australian sea lion,
Neophoca cinerea (Mammalia: Pinnipedia). J Zool 234:
LITERATURE CITED 353−370
Goldsworthy SD (2015) Australian sea lion. Neophoca cine-
Adame K, Elorriaga-Verplancken FR, Beier E, Acevedo- rea. The IUCN Red List of Threatened Species. Version
Whitehouse K, Pardo MA (2020) The demographic de- 2015.2. e.T14549A45228341. https://dx.doi.org/10.2305/
cline of a sea lion population followed multi-decadal sea IUCN.UK.2015-2.RLTS.T14549A45228341.en (accessed
surface warming. Sci Rep 10:10499 11 Nov 2020)
Australian Fisheries Management Authority (2015) Aus- Goldsworthy S, Gales N (2008) Neophoca cinerea. The
tralian sea lion management strategy, southern and IUCN Red List of Threatened Species. Version 2008: e.
eastern scalefish and shark fishery (arrangements effec- T14549A4443172. https://www.iucnredlist.org/species/
tive from 1 May 2013; Version 2.0 — updated July 2015). 14549/4443172 (accessed 11 Nov 2020).
https://www.afma.gov.au/sites/default/files/uploads/ Goldsworthy SD, Page B (2007) A risk-assessment approach
2014/03/Australian-Sea-Lion-Management-Strategy- to evaluating the significance of seal bycatch in two Aus-
2015-v2.0-FINAL.pdf tralian fisheries. Biol Conserv 139:269−285
Bates D, Maechler M, Bolker B, Walker S (2015) Fitting lin- Goldsworthy SD, Bulman C, He X, Larcombe J, Littnan C
ear mixed-effects models using lme4. J Stat Softw 67: (2003) Trophic interactions between marine mammals
1−48 and Australian fisheries: an ecosystem approach. In:
Baylis MM, Orben RA, Arnould JPY, Christiansen F, Hays Gales NJ, Hindell M, Kirkwood R (eds) Marine mammals
GC, Staniland IJ (2015) Decline of sea lions. Bull Ecol Soc and humans: fisheries, tourism and management. CSIRO
Am 96:635−638 Publications, Collingwood, p 62–99
Berkson JM, DeMaster DP (1985) Use of pup counts in Goldsworthy SD, Shaughnessy PD, Page B, Dennis TE and
indexing population changes in pinnipeds. Can J Fish others (2007) Developing population monitoring proto-
Aquat Sci 42:873−879 cols for Australian sea lions. Report for the Department of
Boyd I, Wanless S, Camphuysen C (2006) Top predators in the Environment and Water Resources, July 2007. SARDI
marine ecosystems: their role in monitoring and manage- Aquatic Sciences Publication Number F2007/000554.
ment. Cambridge University Press, Cambridge SARDI Research Report Series No. 219. South Australian
Campbell R, Holley D, Christianopoulos D, Caputi N, Gales Research and Development Institute, Adelaide. https://
N (2008a) Mitigation of incidental mortality of Australian www.pir.sa.gov.au/__data/assets/pdf_file/0005/231629/
sea lions in the west coast rock lobster fishery. Endang No_219_Developing_population_monitoring_protocols_
Species Res 5:345−358 ASL_-DEH.pdf
Campbell RA, Gales NJ, Lento GM, Baker CS (2008b) Goldsworthy SD, Shaughnessy PD, Page B, Lowther A,
Islands in the sea: extreme female natal site fidelity in Bradshaw CJA (2008) Developing population monitoring
the Australian sea lion, Neophoca cinerea. Biol Lett 4: protocols for Australian sea lions: enhancing large and
139−142 small colony survey methodology. Final Report to the
CBD (Convention on Biological Diversity) (2020) Zero draft of Australian Centre for Applied Marine Mammal Science
the post-2020 global biodiversity framework. CBD/WG (ACAMMS), Department of Environment, Water, Her-You can also read