Physicochemical and Enzymatic Soil Properties Influenced by Cropping of Primary Wheat under Organic and Conventional Farming Systems - MDPI
←
→
Page content transcription
If your browser does not render page correctly, please read the page content below
agronomy
Article
Physicochemical and Enzymatic Soil Properties
Influenced by Cropping of Primary Wheat under
Organic and Conventional Farming Systems
Joanna Lemanowicz 1, * , Agata Bartkowiak 1 , Robert Lamparski 2 , Piotr Wojewódzki 1 ,
Jarosław Pobereżny 3 , Elżbieta Wszelaczyńska 3 and Małgorzata Szczepanek 4
 1   Department of Biogeochemistry and Soil Science, UTP University of Science and Technology in Bydgoszcz,
     6/8 Bernardyńska Street, 85-029 Bydgoszcz, Poland; bartkowiak@utp.edu.pl (A.B.);
     piotr.wojewodzki@utp.edu.pl (P.W.)
 2   Department of Biology and Plant Protection, UTP University of Science and Technology, 7 Kaliskiego St.,
     85-796 Bydgoszcz, Poland; robert@utp.edu.pl
 3   Institute of Microbiology and Food Technology, University of Science and Technology, 7 Kaliskiego St.,
     85-796 Bydgoszcz, Poland; poberezny@utp.edu.pl (J.P.); wszela@utp.edu.pl (E.W.)
 4   Department of Agronomy, UTP University of Science and Technology, 7 Kaliskiego St.,
     85-796 Bydgoszcz, Poland; malgorzata.szczepanek@utp.edu.pl
 *   Correspondence: jl09@interia.pl; Tel.: + 48-52-3749-556

 Received: 7 October 2020; Accepted: 22 October 2020; Published: 26 October 2020

 Abstract: The aim of the study was to assess the content of total organic carbon (TOC), macronutrients
 (P, K, and Mg), and glomalin (easily extractable glomalin-related soil protein (EEGRSP)) in soil,
 micronutrients (Zn and Cu) in soil and wheat, and the number of insects on plots in an organic (OF)
 and a conventional farming (CF) system, all against the background of alkaline phosphatase (AlP)
 and acid phosphatase (AcP) activity. The experimental design included two spring wheat species,
 Triticum sphaerococcum Percival and Triticum persicum Vavilov, and three sowing densities (grains m−2 ):
 400, 500, 600. Statistical analysis (ANOVA, η2 effect size) showed significant variation in parameters
 under the influence of experimental factors. In the duration of the field experiment, TOC content in
 soil had decreased by 61% compared to the content before starting the experiment. The contents of P,
 K, and Mg and activity of AlP and AcP were higher in soil under T. sphaerococcum. With a sowing
 density of 600 grains m−2 under OF and CF, the significantly lowest macronutrient content and the
 highest AlP and AcP activity were found. The parameters tested (TOC, EEGRSP, P, K, Mg, TZn, TCu,
 AZn, CU in plant, AlP, AcP) were higher under the CF than under the OF system. The experimental
 factors (spring wheat species and number of germinating grains) were demonstrated to influence the
 content of the forms of both microelements in soil and plants. In CF, more content in the amount of
 Zn and Cu was found than in OF. But the content they had did not exceed the standards set for arable
 soils. Both wheat species had a significant impact on the concentration of glomalin in the soil from
 the fields cultivated in the OF system. In CF, a significant difference was caused by sowing density
 and by interaction between wheat species and sowing density. Insects preferred plants grown in the
 OF system compared to CF. Regardless of cultivation system, the number of insects was greater on
 the plots of T. sphaerococcum than on plots of T. persicum. There were more insects at higher sowing
 densities in plants grown in the OF system only.

 Keywords: wheat; macro- and microelements; soil; alkaline and acid phosphatase; glomalin; insects

Agronomy 2020, 10, 1652; doi:10.3390/agronomy10111652                        www.mdpi.com/journal/agronomy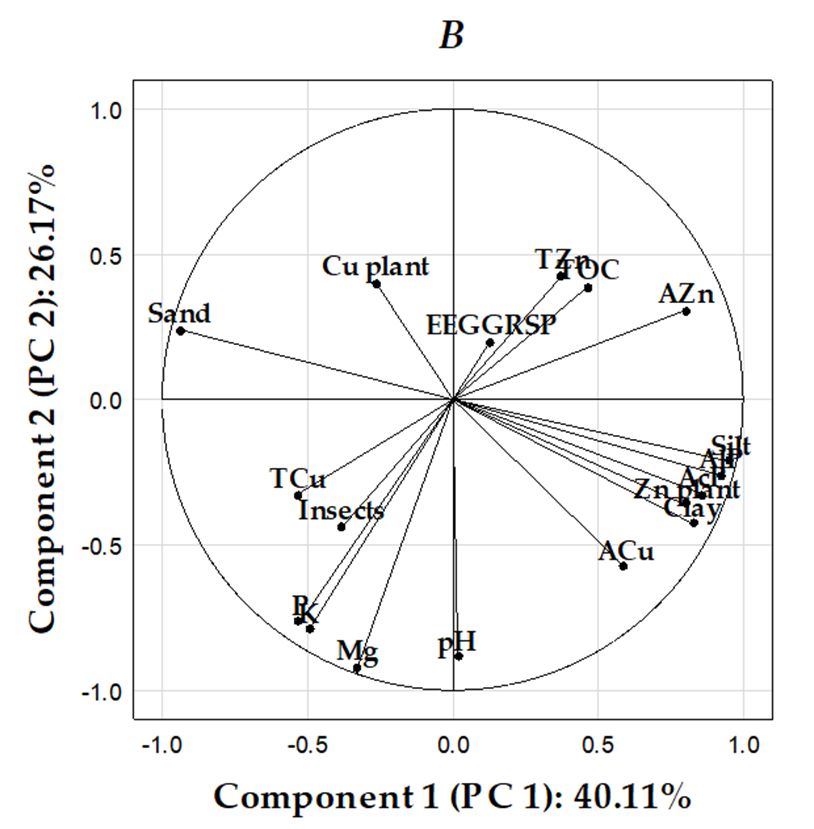
Agronomy 2020, 10, 1652                                                                               2 of 20

1. Introduction
      Common wheat is mainly grown in the conventional system. Wheat grown in an organic farming
system is of much less economic importance. Increased consumer demand has significantly increased
organic production of wheat as compared to conventional production [1]. Organic wheat production
standards prohibit the use of synthetic chemical crop protection products and certain mineral fertilizers
(N, KCl, and superphosphate) to reduce negative environmental impacts and the risk of pesticide
residues being present in grain [2]. Instead, they prescribe inputs of organic fertilizers, and application
of preventative and non-chemical crop protection methods. Organic standards also permit the use of
some plant or microbial preparations [3,4]. As a result, organic and conventional cropping system of
wheat may differ significantly in fertilization and crop protection protocols, as well as in the type of
crop varieties used [4–6].
      Contemporary conventional agriculture is highly productive and efficient, which affects the
soil environment [7]. All cultivation treatments must aim to maintain and increase soil fertility [8].
Over the past decades, farming practice has been taking a growing interest in the organic production
system [9,10]. In the new European Council Regulation 2018/848 [11], organic production, is the type of
farming that aims to combine best environmental and climate action practices, that prevent or minimize
any contribution to the contamination of the environment. Its basic goal is to implement sustainable
development principles, an important part of which is the rational management of soil nutrients.
Organic carbon (OC) has expanded significantly in Europe and around the world. As a result, it is
seen as a sustainable alternative to intensive farming systems [12]. Concerning soil management and
fertilization, cultivation practices allowed in organic farming should be specified and conditions should
be laid down for the use of fertilizers and conditioners [11]. At the same time, it must maintain a level
of soil fertility sufficient for the economic production of plants in the long term, while also protecting
the environment. However, organic cereal production is limited by yields being lowered as a result
of nutrient deficiencies in the soil, competition from weeds, and greater numbers of insect pests [13].
Poutala et al. [14] hypothesized that older wheat varieties may be better suited to lower soil nutrient
levels and greater weed infestation, and less susceptible to insect damage. It should be emphasized
that a lot of research has been devoted to such plants as wheat or maize, leading to the development of
higher yield varieties that are best suited to the conditions of organic cultivation systems [15].
      Conventional agriculture (e.g., high level of mechanization, the use of acidic fertilizers, pesticides)
can contribute to environmental degradation (e.g., a loss of biodiversity, soil erosion and acidification,
nitrate emissions in soil, deterioration of the soil structure, increasing the content of heavy metals in
soil and in food), which has serious consequences for human, animal and plant life [15,16]. One of
the important factors influencing the size and quality of crops is the abundance of nutrients available
to plants in soils. Assessing soil nutrients’ contents allows it to be determined which method of soil
use can limit the passage of these elements into the food chain. Soil fertility is assessed mainly on
the content of easily absorbable macro- and micronutrients (phosphorus, potassium, magnesium,
zinc and copper), taking into account soil pH [17]. Soil factors have the strongest impact on the content
of phytoavailable forms of elements in soil, and thus on the level of their accumulation in plants.
The amount of microelements taken up by plants depends on their type, content in the soil and forms
of occurrence, and on plant species [18].
      Metals influence the growth and development of animal organisms [19]. Copper and zinc are
microelements of great importance in biological processes and metabolism, where they are important
enzymatic agents (associated with around 300 enzymes), but they can be toxic in high concentrations.
Thus, excess zinc can seriously disturb the cellular environment, increasing oxidative stress [20,21].
Copper accumulates at the highest concentrations in flowers and is highly mobile in the plant [22].
Polyphagic herbivores can only overcome the toxic effects of metals by avoiding certain foods [23].
      Soil extracellular enzymes are a good indicator of soil changes caused by natural (e.g., temperature,
rainfall) and anthropogenic (e.g., industry, agriculture, urbanization) factors. They are actively involved
in: the decomposition of organic matter released into the soil during plant growth and development and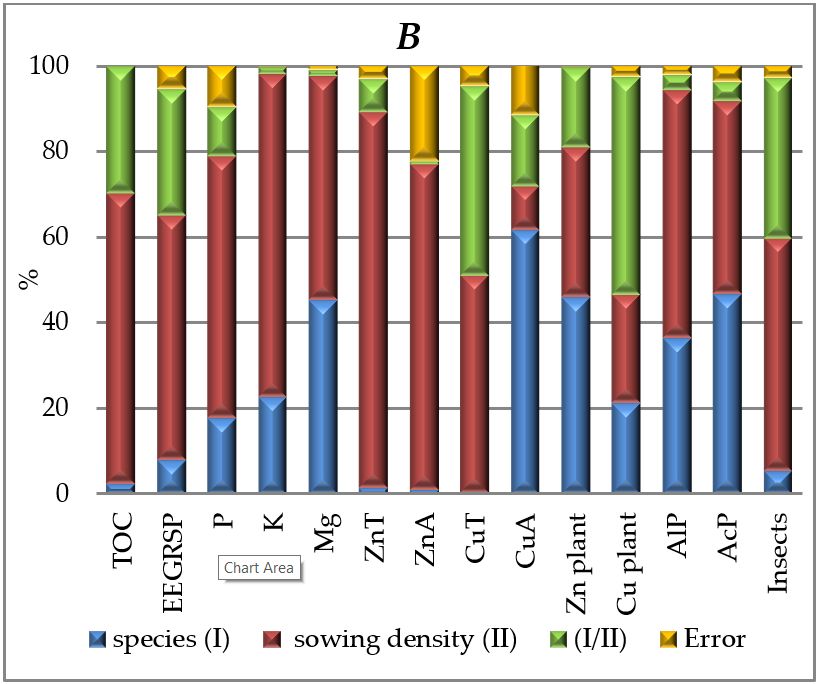
Agronomy 2020, 10, 1652                                                                            3 of 20

the release and availability of mineral substances to plants [24]. Therefore, they can provide immediate
and accurate information on the direction of changes in soil quality. Glomalin is described as a soil
particle binding agent that is insoluble, heat resistant and hydrophobic [25]. It is also characterized
by high Fe content [26]. Glomalin is an organic glycoprotein produced by arbuscular mycorrhizal
fungi in the phylum Glomeromycota [27] that colonizes the roots of the majority of vascular plants [28].
Because of its long turnover time, glomalin is an important factor in soil carbon sequestration [29].
The presence of glomalin is higher in grasslands, forest and fallow land than in agricultural soil [8].
It was found that intensive, frequent agrotechnical treatments mixing soil, as well as soil salinization,
both result in decreased glomalin concentrations in soil [30,31].
     Agriculture development should be established on scientific bases [32], but studies conducted
so far do not fully explain the changes in the physical, chemical and enzymatic properties of arable
soils, the accumulation of micronutrients in the plant and their impact on changes in the number
of insects, especially in the conditions of growing primary forms of wheat, both in conventional,
as well as in organic, farming systems. Understanding such phenomena gives an opportunity to
improve agricultural practices, increasing biodiversity and sustainable development of conventional
and ecological farms.
     Therefore, the research objective was to determine the effect that cultivating Indian dwarf wheat
and Persian wheat at different sowing densities had on the physicochemical properties, glomalin
content, activity of soil phosphatases, and total insect numbers in two cultivation systems: organic and
conventional farming (OF and CF, respectively).

2. Materials and Methods

2.1. Experiment Design
     Field experiments were located in two localities: Grabina Wielka (52◦ 110 N; 18◦ 800 E)—organic
farming and Mochełek (53◦ 130 N; 17◦ 510 E)—conventional farming, in Poland.
     In a strict field experiment, three different sowing densities of two species of spring wheat
grown using organic and conventional methods were compared. Field research and soil, plant and
entomological sampling were conducted in the project years 2018–2020. The test samples were collected
in each year of testing in the BBCH 61 phase of spring wheat (in agronomy, the BBCH-scale for cereals
describes the phenological development of cereals. BBCH61—beginning of flowering). The paper
presents average research results for the years 2018–2020. The average results from three years of
research were aimed at exclude the influence of such factors as temperature and rainfall on the
tested parameters.
     The whole-plots consisted of wheat species (144 or 254 m2 , in conventional and organic cropping
system, respectively) and subplots consisted of sowing densities (12.0 and 21.2 m2 , respectively).
     The factors in the experiment were: factor I—spring wheat species [two levels of factor I: Indian
dwarf wheat (Triticum sphaerococcum Percival) and Persian wheat (Triticum persicum Vavilov)]; factor
II—number of germinating grains per m2 (three levels of factor II: 400, 500, 600. The experiment was
set up in a split-plot arrangement, in four replicates.
     Plots with organic farming (OF) and conventional farming (CF) were subject to different agricultural
technology methodologies.

Organic Farming
     The forecrops for the tested species of spring wheat grown organic were cereals (triticale or winter
wheat). The farms where organic cultivation took place are certified organic by an accredited body.
Before starting the experiment, the soil had a medium content of available phosphorus (64.52 mg kg−1 ),
a high content of potassium (182.6 mg kg−1 ) (both determined with the Egner–Riehm method), and a
low content of magnesium (34.37 mg kg−1 ) (determined with the Schatschabel method), and was
slightly acidic (pH 5.9 in 1M KCl) [33]. The content of soil in available P [34], K [35], and Mg [36] was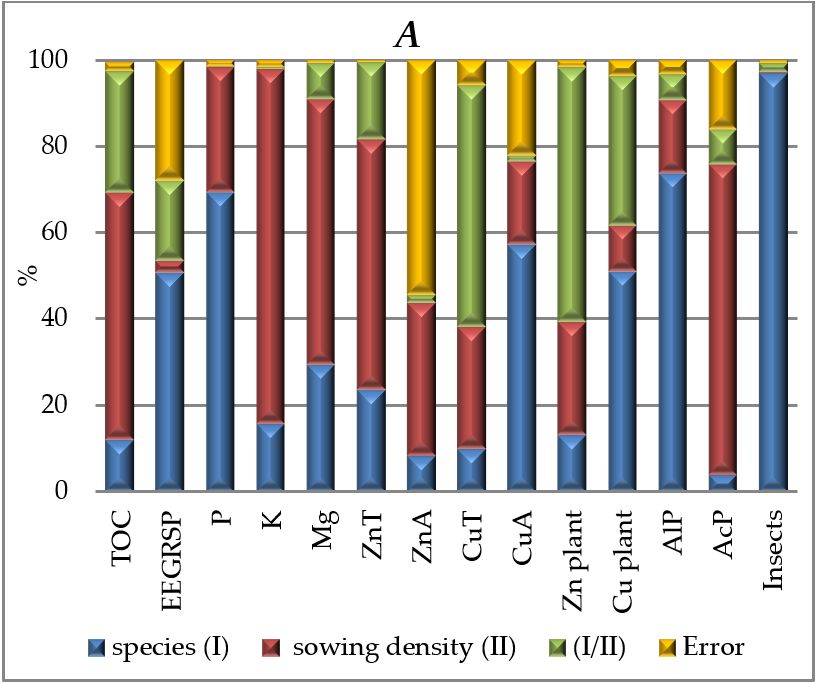
Agronomy 2020, 10, 1652                                                                           4 of 20

determined according to the standards. The total organic carbon content was 21.19 g kg−1 . Immediately
after harvesting the forecrop, an intercrop of peas of the tendril-leaved variety ‘Tarchalska’ were sown
in the amount of 240 kg ha−1 . The organic fertilizer Bioilsa (6% N; 5% P2 O5 ; 13% K2 O; 2% MgO,
10% SO3 ) was applied by sieving at a dose of 200 kg−1 . Pre-winter ploughing was carried out to a depth
of 22–23 cm. In the spring, before sowing, the soil was leveled with a cultivating aggregate. Wheat was
sown at the end of March using a disc seeder. The amounts sown for achieving densities of 400, 500,
and 600 grains m−2 were 148, 185, and 222 kg m−2 for Indian dwarf wheat, and 160, 200, and 240 kg ha−1
for Persian wheat. The amounts to be sown were determined based on the current parameters of the
seed material (thousand seed weight and germination capacity) and a field germination rate of 85%.
Rolling was performed immediately after sowing. Weed harrowing was performed at the initial wheat
tillering stage. Harvesting was performed using a Wintersteiger harvester in late July to mid-August.

Conventional Farming
     Winter triticale was the forecrop for the studied species of conventionally grown spring
wheat. Before starting the experiment, the soil had a very high content of available phosphorus
(92.43 mg kg−1 ) [34], a medium content of potassium (156.04 mg kg−1 ) [35], and a very low content
of magnesium (18.69 mg kg−1 ) [36], as well as was slightly acidic (pH in 1M KCl 6.4) [33]. The total
organic carbon content was 24.31 g kg−1 . Pre-winter ploughing was carried out to a depth of 22–23 cm.
In spring, in the first days of April, pre-sowing fertilization was performed in the amount of: P2 O5
30 kg ha−1 , K2 O 50 kg ha−1 , and N 30 kg ha−1 . Then, the spring soil was leveled with a cultivating
aggregate consisting of a cultivator and a flat-bar roller. The tested spring wheat species was sown
in the first ten days of April using a disc seeder with a 12-cm row spacing. The amounts sown for
achieving densities of 400, 500, and 600 grains per m2 were 149, 186, and 223 kg ha−1 for Indian dwarf
wheat, and 173, 216, and 260 kg ha−1 for Persian wheat. The amounts to be sown were determined
based on the current parameters of the seed material (thousand seed weight and germination capacity)
and a field germination rate of 90%. At all sites, nitrogen was additionally applied at a dose of
30 kg ha−1 at the end of tillering/the beginning of stem shooting (mid-May). For the conventionally
cultivated spring wheat, the following treatments were performed: herbicidal: with Mustang Forte
at a dose of 1 L ha−1 (1st half of May) and after a week Fenoxinn 0.7 L ha−1 ; fungicidal: Tango Star
1 L ha−1 (mid-May), retardant: CCC 720 1 L ha−1 + Cobra 0.5 L ha−1 (mid-May) and insecticidal:
Insodex 0.6 L ha−1 + Delcaps 100 mL ha−1 (end of May).

2.2. Physicochemical Properties
     In air-dried soil samples sieved through a ø 2-mm mesh, the selected physicochemical properties
were determined: granulometric composition by laser diffraction method using a Masterssizer MS
2000 (Merven Instrumenyt, Mervern, UK) analyzer, pH in a 1 M KCl extract and H2 O at a ratio
of 1:2.5 measured potentiometrically [31], and total organic carbon (TOC) was determined with a
Vario Max CNS analyzer (Elementar, Langenselbold, Germany). The content of available forms of
phosphorus (P) [34] and potassium (K) were also defined with the Egner–Riehm method (DL) [35],
and the content of magnesium available to plants (Mg) following the Schachtschabel method [36].
The total content of zinc (ZnT) and copper (CuT) in soil were determined after mineralization in a
mixture of HF + HClO4 acids according to the method of Crock and Severson [37]. Available forms
of zinc (ZnA) and copper (CuA) were extracted with 1 M HCl by Rinkins’ method. Zn and Cu in
plants were evaluated following mineralization with the microwave technique in concentrated HNO3 .
The content of macro- and microelements in the extracts obtained by the aforementioned procedures
was determined by atomic absorption spectroscopy and atomic emission spectroscopy with the use of
a PU 9100X spectrometer (Philips, Cambrigde, UK). The limit of determination for all analyzed metals
was 0.2 mg kg−1 . To verify the accuracy of the results, analysis of the certified material Loam Soil
No. ERM—CC141 and the so-called zero tests were performed, which were exposed to the identical
analytic procedure as the soil samples.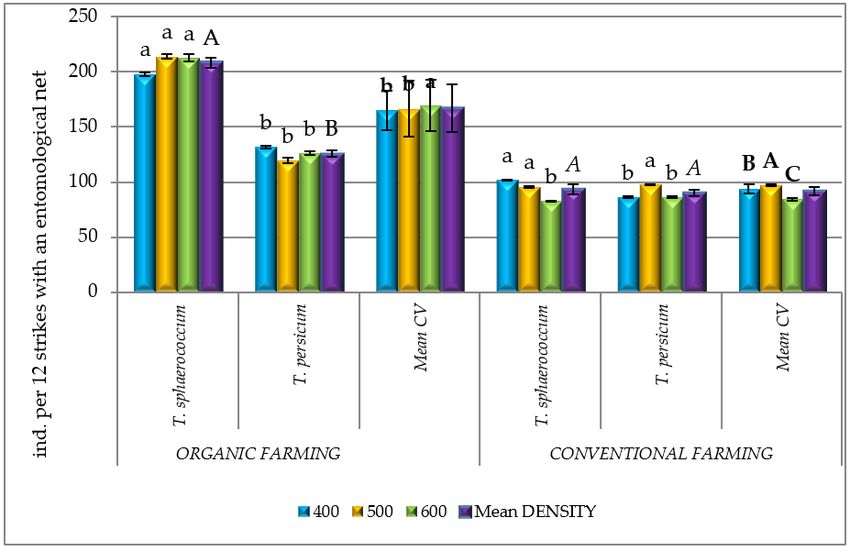
Agronomy 2020, 10, 1652 5 of 20
The results facilitated a calculation of the availability factor (AF%) as suggested by Obrador
et al. [38]. It is expressed as follows:
!
Available content
AF = × 100. (1)
Total content
On the basis of extraction methods, pure glycoprotein is described as “glomalin”, whereas
pressure extraction of soil in sodium citrate solution results in obtaining the glycoprotein described
as “glomalin-related soil protein” (GRSP). Furthermore, the number of extraction cycles specifies
easily extractable glomalin-related soil protein (EEGRSP—single extraction cycle) and total extractable
glomalin-related soil protein (TGRSP—several extraction cycles). The extraction of EEGRSP was
realized according to the protocol evaluated by Wright and Upadhyaya [39]. One gram of soil sample
was placed in a 50-mL PP centrifuge tube, then 8 mL of 20 mM sodium citrate (pH 7.0) was added.
The tubes were autoclaved (t = 121 ◦ C, p = 1.4 kg cm−1 , 30 min) and centrifuged (5000× g, 15 min).
The collected supernatant was stored at 4 ◦ C for further analysis. EEGRSP content was determined
by the Bradford assay. The extracts were carried into disposable 50-µL cuvettes, and the absorbance
was measured at 595 nm by UV-VIS Bio-Rad Smartspec spectrophotometer. The calibration curve was
prepared on the basis of ready solutions of bovine serum albumin (BSA). When necessary, extracts
were diluted by phosphate buffer saline (PBS) pH 7.4.
2.3. Enzyme Analysis
Enzyme activity studies were performed on fresh soils that had been stored at 4 ◦ C for no more
than two weeks. The activity of selected hydrolase enzymes: the soil alkaline phosphatase (AlP)
and acid phosphatase (AcP) activities were measured based on the detection of p-nitrophenol (pNP)
released after incubation (37 ◦ C, 1 h) at pH 6.5 for acid phosphatase and pH 11.0 for alkaline with
p-nitrophenyl phosphate disodium [40].
2.4. Insects Experiments
The entomological part of the research consisted in collecting insectsby scooping [41,42]. Sampling
was performed in the plant development phase that is important for the occurrence of insects—the
beginning of spring wheat flowering (BBCH 61). The results of this assessment were presented as the
insect density, i.e., total catches by scooping, in individuals per 12 strikes with an entomological net
(1 strike = 2 m2 of experimental plots).
2.5. Statistical Analyses
All experiment results were statistically analyzed using the Statistica 13.1 program. Measurement
data (n = 24) were analyzed by two-way ANOVA for spring wheat species (I factor), and sowing
density (II factor) was calculated independently for OF and for CF. The analysis of variance determined
the η2 effect size, which indicates the percentage share of qualitative variables (spring wheat species
and sowing density) in shaping the examined soil and plant parameters and insect numbers. Results
are expressed as arithmetic mean plus or minus standard deviation (±SD). The relations between
the studied parameters were estimated using correlation analysis based on Pearson’s correlation
coefficients with the level of significance set at p < 0.1, p < 0.05; p < 0.01. The power of the correlation
between soil properties is expressed by the determination coefficient (R2 ) and using a regression
equation. The correlation coefficient assessed the strength of the relationship between the tested
parameters. The coefficient of determination assessed how strong the linear relationship is between
these parameters.
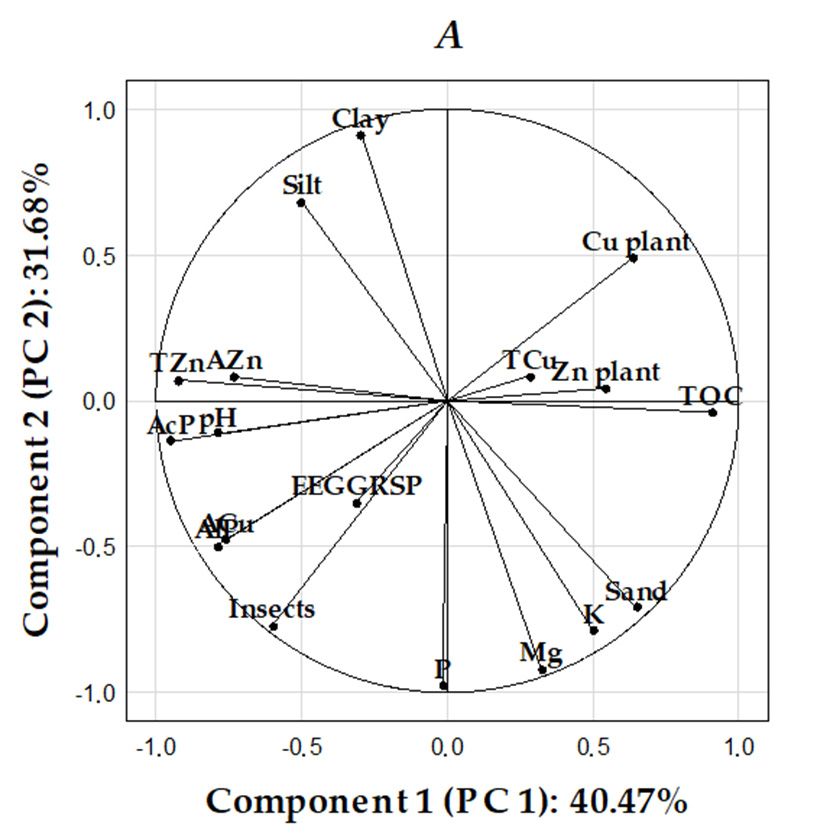
In addition, the studied parameters were evaluated using principal component analysis (PCA).
PCA is a variable reduction method which can be used to identify groups of observed variables that
tend to cluster together. The results of this analysis are presented as graphics that display traits inAgronomy 2020, 10, 1652 6 of 20
the arrangement of the first two principal components (PC1 and PC2), which synthetically represent
mutually correlated variables.
3. Results and Discussion
3.1. Granulometric Composition and Soil pH
Analysis of the granulometric composition revealed that the soil samples had a similar grain-size
distribution. In both the organic and the intensive farm, the sand fraction was highest and the clay
fraction lowest (Table 1). Based on the USDA [43] classification, all tested soil samples were classified
into one grain-size group: sandy loam. In terms of agrotechnical heaviness, they were classified as
medium soils [44]. The tested soils had a pH in 0.1 M KCl of 4.50–5.69 in OF (acidic and slightly acidic
soil) and 7.36–7.60 in CF (alkaline soil) (Table 1). Wheat is an acid-sensitive crop, and its optimal pH in
KCl range is 6.1–6.5.
Table 1. Granulometric composition and pH soil in 1 M KCl.
Organic Farming (OF) Conventional Farming (CF)
Sowing Species (I)
Density T. sphaerococcum T. persicum T. sphaerococcum T. persicum
(II)
Granulometric Composition (%)
Sand Silt Clay Sand Silt Clay Sand Silt Clay Sand Silt Clay
400 67.90 29.15 3.77 66.61 29.11 4.28 54.69 40.46 4.85 55.82 39.48 4.70
500 63.45 32.24 4.31 63.25 32.16 4.59 51.70 43.19 5.10 54.37 40.91 4.72
600 63.39 32.18 4.43 62.74 37.72 4.53 49.21 45.31 5.58 53.87 41.38 4.75
pH KCl
400 5.36 4.50 7.58 7.36
500 5.08 5.09 7.60 7.48
600 5.21 5.69 7.52 7.56
3.2. Content of TOC, Glomalin, and Available P, K, and Mg in Soil
The content of total organic carbon ranged from 7.32 (±0.065) to 9.53 (±0.036) (g kg−1 ) (mean
8.33 g kg−1 , ±0.566) (OF). In contrast, in CF, the TOC content was higher (from 9.14, ±0.032 to 11.56 g kg−1 ,
±0.039; mean 10.35 g kg−1 , ±0.442) (Table 2). Based on the European Soil Database [45,46] classes of
TOC content in soils, the studied soils are classified as being of very low TOC content. The TOC content
was found to have fallen by 61% since the start of the experiment. A decrease in TOC content in soils
adversely affects their fertility, and this may translate into the size and quality of plant crops [46]. Even a
small loss of soil organic matter can degrade soil structure. The appropriate level of organic matter is
also important due to the role of soil in sequestering atmospheric carbon dioxide [47]. The analysis of
variance showed that only in OF was soil TOC content under T. sphaerococcum significantly lower than
under T. persicum. The η2 measure of effect size showed that wheat cultivation accounted for 57.47%
(OF) and 68% (CF) of the influence on TOC content (Figure 1A,B). The significantly highest content
of TOC (on average 9.27 g kg−1 , ±0.442) was found in soil of sowing density 400 grains m−2 in OF,
as compared to 11.08 g kg−1 (±0.424) with a density of 500 grains m−2 in CF.Agronomy 2020, 10, 1652 7 of 20
Table 2. Content of total organic carbon (TOC) and glomalin (easily extractable glomalin-related soil
protein (EEGRSP)) in the soil.
Organic Farming (OF) Conventional Farming (CF)
Sowing Species (I)
Density
(II) T. sphaerococcum T. persicum Mean T. sphaerococcum T. persicum Mean
Total Organic Carbon (g kg−1 )
400 9.53 ± 0.576 8.96 ± 0.050 9.27 ± 0.403 A 9.41 ± 0.009 a 9.14 ± 0.032 b 9.27 ± 0.191 C
b a B a b
500 7.32 ± 0.065 9.53 ± 0.036 8.44 ± 1.563 11.38 ± 0.018 10.78 ± 0.024 11.08 ± 0.424 A
600 6.94 ± 0.013 7.62 ± 0.016 7.28 ± 0.481 C 9.83 ± 0.023 b 11.56 ± 0.039 a 10.70 ± 1.223 B
mean 7.95 ± 1.142 8.70 ± 0.801 8.33 ± 0.566 10.20 ± 0.847 B 10.49 ± 1.009 A 10.35 ± 0.442
Glomalin (g kg−1 )
400 0.978 ± 0.073 0.706 ± 0.020 0.841 ± 0.192 1.052 ± 0.013 0.962 ± 0.067 1.007 ± 0.064 B
500 0.839 ± 0.103 0.900 ± 0.026 0.870 ± 0.043 1.141 ± 0.081 1.224 ± 0.188 1.183 ± 0.059 A
600 0.902 ± 0.098 0.861 ± 0.062 0.881 ± 0.029 1.003 ± 0.059 1.085 ± 0.054 1.044 ± 0.058 AB
mean 0.906 ± 0.070 A 0.823 ± 0.103 B 0.864 ± 0.021 1.065 ± 0.070 1.090 ± 0.131 1.078 ± 0.581
Were analyzed by two-way ANOVA for spring wheat species (I factor), and sowing density (II factor) was
calculated independently for organic farming (OF) and for conventional farming (CF). Different small letters indicate
comparison between species of spring wheat. Different capital letters indicate a comparison among between sowing
density; ±Standard Deviation.
Studies concerning cereal cultivation in Poland indicate concentration of GRSP in soils in the range
of 0.82–4.06 mg g−1 under rye, 0.61–2.73 mg g−1 under winter wheat, and 0.62–2.19 mg g−1 under spring
wheat, as well as strong positive Pearson’s coefficient of linear correlation between GRSP and carbon
content (r = 0.701) and GRSP and nitrogen content (r = 0.760) [48]. The obtained results of EEGRSP
content in the soil under the two species of spring wheat within the range of 0.706 (±0.020)–1.224
(±0.188) g kg−1 coincide with the abovementioned research. The concentration of glomalin in the
soil from the fields cultivated under the system of OF was influenced significantly by wheat species
(Table 2). In CF, the significant difference resulted from sowing density and interaction between wheat
species and sowing density. Furthermore, the OF, was characterized by a positive relation between
EEGRSP and activities of AlP and AcP (r = 0.397; p = 0.05510 and r = 0.462 *; p = 0.02290, respectively,
Table 3). Correlations between EEGRSP and other soil enzymes vary widely; for example, for soil
protease and β-glucosidase, Pearson correlation coefficients were determined as −0.899 and 0.761,
respectively [49]. A positive correlation was also revealed between EEGRSP and TOC (r = 0.613 ***;
p = 0.00140, Table 4) in the system of CF, which corresponds to other studies that indicate a similar
relation [32,50].
The absorbable forms of nutrients are the most important soil fraction in determining plant
yields. The analysis of variance showed that experiment factors significantly influenced bioavailable
macronutrients (Table 5). The highest content of P (50.51 mg kg−1 , ±6.642), K (91.55 mg kg−1 , ±14.45),
and Mg (14.82 mg kg−1 , ±2.579) was obtained for the cultivation of T. sphaerococcum, both in OF and CF.
P content was lower at the density of 600 grains than 200 m−2 and 400 m−2 grains (Table 5). In addition,
the highest content of K (on average 99.95 mg kg−1 , ±6.025) and Mg (16.17 mg kg−1 , ±12.24) was found
with densities of up to 400 grains m−2 .
The crop canopy density is the basic agrotechnical factor shaping not only plant development
and yield, but also soil properties. According to Hinsinger [51], plants release various secretions into
the soil through the root system, which influence the transformation of nutrients. Their uptake and
accumulation by plants varies by species and even by variety. Optimal sowing density depends on
plant requirements and habitat conditions. Too high a sowing density may lead to plants competing
for nutrients and depleting them from the soil. Analysis of η2 coefficients indicated that it is mainly
sowing density that explains the variability of K (82%), Mg (61.5%) in OF (Figure 1A) and P (61.1%),
K (75.5%), Mg (52.3%) in CF (Figure 1B).Agronomy 2020, 10, 1652 8 of 20
Table 3. Relationship between selected soil properties in organic farming (OF) (n = 24).
Variable
Equation r R2 p
Dependent Independent
TZn pH KCl y = 16.429 + 1.239x 0.725 *** 0.526 0.00006
AZn pH KCl y = −0.695 + 1.249x 0.496 ** 0.247 0.01360
AlP pH KCl y = −0.298 + 0.135x 0.529 *** 0.208 0.00780
AcP pH KCl y = −1.141 + 0.473x 0.716 *** 0.513 0.00008
TZn Clay y = 19.174 + 0.822x 0.427 ** 0.182 0.03760
TZn TOC y = 26.548−0.464x −0.896 *** 0.803 0.00001
AZn TOC y = 9.673 − 0.488x −0.640 *** 0.409 0.00008
ACu TOC y = 4.602 − 0.328x −0.695 *** 0.483 0.00020
Cu plant TOC y = −3.049 + 0.838x 0.769 *** 0.592 0.00001
AlP TOC y = 0.788 − 0.050x −0.674 *** 0.454 0.00030
AcP TOC y = 2.652 − 0.168x −0.842 *** 0.708 0.00001
AlP P y = 0.202 + 0.003x 0.476 ** 0.226 0.01880
Insects Cu plant y = 281.54 − 29.612x −0.771 *** 0.595 0.00001
AlP AZn y = 0.092 + 0.049x 0.499 ** 0.249 0.01310
AcP AZn y = 0.318 + 0.167x 0.637 *** 0.405 0.00008
AlP ACu y = 0.091 + 0.492x 0.499 ** 0.249 0.01310
AcP ACu y = 0.318 + 0.167x 0.637 *** 0.405 0.00080
AlP EEGGRSP y = 0.083 + 0.332x 0.397 0.158 0.05510
AcP EEGGRSP y = 0.373 + 1.030x 0.462 * 0.213 0.02290
* p < 0.1, ** p < 0.05; *** p < 0.01.
Table 4. Relationship between selected soil properties in conventional farming (CF) (n = 24).
Variable p
Equation r R2
Dependent Independent
P pH KCl y = −1071.1 + 155.8x 0.573 *** 0.328 0.00340
K pH KCl y = −4198.7 + 581.6x 0.720 *** 0.519 0.00007
Mg pH KCl y = −3009.8 + 425.6x 0.786 *** 0.617 0.00001
TCu pH KCl y = −18.614 + 3.291x 0.466 ** 0.217 0.02180
ACu pH KCl y = −19.974 − 2.793x 0.416 ** 0.173 0.04350
AZn Clay y = −2.259 + 2.036x 0.502 ** 0.252 0.01250
ACu Clay y = −1.481 + 0.501x 0.579 *** 0.235 0.00310
AlP Clay y = −0.459 + 0.245x 0.854 *** 0.730 0.00001
AcP Clay y = 0.032 + 0.288x 0.750 *** 0.562 0.00002
AZn TOC y = 1.842 + 0.571x 0.478 ** 0.229 0.01810
EEGGRSP TOC y = 0.410 + 0.065x 0.613 *** 0.376 0.00140
AlP AZn y = 0.295 + 0.040x 0.636 *** 0.404 0.00080
AcP AZn y = 0.975 + 0.061x 0.647 *** 0.418 0.00060
AlP ACu y = 0.392 + 0.212x 0.727 *** 0.529 0.00006Agronomy 2020, 10, 1652 9 of 20
Table 4. Cont.
Variable
Equation r R2 p
Dependent Independent
AcP ACu y = 1.078 + 0.376x 0.850 *** 0.723 0.00001
Insects Cu plant y = 14.567 − 0.104x −0.468 ** 0.219 0.02100
** p < 0.05; *** p < 0.01.
Table 5. Content of available phosphorus (P), potassium (K), magnesium (Mg) in soil.
Organic Farming (OF) Conventional Farming (CF)
Sowing Species (I)
Density
(II) T. sphaerococcum T. persicum Mean T. sphaerococcum T. persicum Mean
Phosphorus (mg kg−1 )
400 57.24 ± 0.570 40.72 ± 0.987 48.98 ± 11.68 A 116.5 ± 9.280 99.91 ± 2.436 108.2 ± 11.73 A
500 50.32 ± 1.073 32.90 ± 0.647 42.61 ± 12.32 B 99.54 ± 0.925 93.50 ± 1.634 96.52 ± 4.271 B
600 43.96 ± 1.801 29.50 ± 3.011 36.73 ± 14.47 C 91.03 ± 2.623 89.74 ± 0.543 90.39 ± 0.912 B
mean 50.51 ± 6.642 A 35.04 ± 8.622 B 42.77 ± 6.127 102.4 ± 12.96 A 94.38 ± 5.142 B 98.38 ± 9.048
Potassium (mg kg−1 )
400 104.2 ± 0.035 95.68 ± 2.298 99.95 ± 6.025 A 202.1 ± 0.919 a 183.9 ± 3.429 b 192.9 ± 12.87 A
500 94.63 ± 1.732 81.38 ± 0.742 88.00 ± 9.369 B 183.9 ± 2.192 a 155.6 ± 0.919 b 169.8 ± 20.01 B
C a b
600 2020, 10,
Agronomy 75.80 ± 3.790
x FOR 66.35 ± 2.687
PEER REVIEW 71.08 ± 6.682 150.2 ± 0.071 114.2 ± 2.482 132.2 ± 24.469Cof 20
mean 91.55 ± 14.45 A 81.13 ± 14.67 B 86.34 ± 14.51 178.7 ± 26.33 A 151.3 ± 35.06 B 164.9 ± 30.64
The crop canopy density is the basic agrotechnical Magnesium (mg factor
kg−1 )shaping not only plant development
and yield,
400 but18.45
also±soil
0.636properties.
a According
13.89 ± 0.636 b 16.17 to Hinsinger
± 12.24 A [51],
21.53 plants release
± 1.273 18.55 ± various
4.313 secretions
20.04 ± 21.07 Ainto
the soil
500 through13.22the roota system,
± 1.980 11.46 ± which
4.243 b influence
13.24 ± 12.45the
B transformation
20.03 ± 1.344 of 17.06
nutrients.
± 3.323 Their18.55uptake
± 21.00 Band
accumulation
600 by plants
12.78 ± 0.424 avaries by species
11.28 ± 4.596 b and even
12.03 ± 10.61 by
C variety. Optimal
17.57 ± 2.192 sowing density
15.61 ± 1.556 16.58 ± 13.86 C on
depends
plantmean
requirements andAhabitat
14.82 ± 2.579 12.21conditions.
± 1.074 B Too± high
13.51 1.738 a sowing density
19.71 ± 1.632 A may
17.08 lead toB plants
± 1.200 18.3.9competing
± 1.417
for nutrients and depleting them from the soil. Analysis of η 2 coefficients indicated that it is mainly
Were analyzed by two-way ANOVA for spring wheat species (I factor), and sowing density (II factor) was calculated
sowing density that
independently explains
for OF and for the variability
CF. Different smallofletters
K (82%), Mgcomparison
indicate (61.5%) in OF (Figure
between species 1A) and wheat.
of spring P (61.1%),
Different capital letters indicate a comparison among between sowing density; ± Standard Deviation.
K (75.5%), Mg (52.3%) in CF (Figure 1B).
Figure 1.
Figure 1. (A,B)
(A,B) Percent
Percentofofobserved
observedvariability
variabilityη2ηin
2 in shaping the chemical properties in soil, Zn and
shaping the chemical properties in soil, Zn and Cu
Cuwheats,
in in wheats, activity
activity of soil
of soil enzymes
enzymes and and insects,
insects, in organic
in (A) (A) organic
and and (B) conventional
(B) conventional farming.
farming.
Potassium content in soil
Potassium soil was
was found
found to
to be
behigher
higherwith
withCFCF(98.38
(98.38mg
mgkg kg−1−1 on
on average,
average, ±9.048)
±9.048)
than with
than with OF
OF (42.77
(42.77 mg
mgkg −1
kg on average, ±6.127)
−1
±6.127) (Table
(Table 5). The
The K and Mg contents in the CF soil soil was
was
also higher
also higher than in OF.
OF. AA similar
similar tendency
tendency waswas noted
noted inin works
works by
by Gosling
Gosling and
and Shepherd
Shepherd [13]
[13] and
and
Kwiatkowski
Kwiatkowski et al. [18]. This is probably the result of the use of mineral fertilizers in the CF system
the use of mineral fertilizers in the CF system
increasing absorbable nutrients in the soil. The physical and chemical properties of soil tend to
change very slowly and on a time scale not suited to short-term field studies [52]. Those authors
found no differences in the physico-chemical soil properties between plots subjected to organic
management in the previous 2–8 years and corresponding conventional plots.
In OF, the soil tested is, according to PN-R-04023 [34], class IV with a low P content, whereas inAgronomy 2020, 10, 1652 10 of 20
increasing absorbable nutrients in the soil. The physical and chemical properties of soil tend to change
very slowly and on a time scale not suited to short-term field studies [52]. Those authors found no
differences in the physico-chemical soil properties between plots subjected to organic management in
the previous 2–8 years and corresponding conventional plots.
In OF, the soil tested is, according to PN-R-04023 [34], class IV with a low P content, whereas
in CF it is class I (very high fertility) and phosphorus fertilization was not required. According to
PN-R-04022 [35], in terms of bioavailable potassium content (86.34 mg kg−1 on average, ±14.51) the soil
tested is fertility class IV (low) (OF). By contrast, the cultivation of both types of wheat in CF (on average
164.9 mg kg−1 , ±30.64) placed the soil in class I with a very high K content. Magnesium content was
very low (class V for medium soils according to agronomic category) for both cultivation systems [36].
Usually, surpluses of some nutrients block plant uptake of others, which can then be leached and affect
other environmental systems, e.g., groundwater pollution. Linear correlation analysis showed that
soil pH beneath wheat in CF significantly affects P content (r = 0.573 ***; p = 0.00340), K (r = 0.720 ***;
p = 0.00007), and Mg (r = 0.786 ***; p = 0.00001) (Table 4). As reported by Guo et al. [53], it is mainly
soil reaction that influences the solubility of minerals, and thus their availability to plants. If the soil
pH value falls below the optimum for a given element, the yield quickly decreases.
3.3. Copper and Zinc Content in Soil and Wheat
The analysis of variance showed that experiment factors significantly influenced the content of total
forms of zinc under both management systems and the total content of copper in OF. In CF, only sowing
density was found to affect total copper content (Table 6). The total Zn content was as follows:
22.14–23.57 mg kg−1 in OF and 29.27–32.10 mg kg−1 in CF, compared to Cu of 4.89–5.46 mg kg−1 in
OF and from 5.68–6.38 mg kg−1 in CF (Table 6). The amount of analyzed microelements in the soil of
conventional cultivation increased, but not to levels that exceeded the standards established for arable
soils. All analyzed soil samples showed natural content of both Zn and Cu. According to Terelak et
al. [54], in agricultural soils in Poland, average content is 32.4 mg kg−1 for zinc and 6.50 mg kg−1 for
copper. The natural trace element content in agricultural soils derives from the mineral composition of
the parent rock, the rate and course of the soil-forming process, and human activity in terms of method
and intensity of soil cultivation [55,56]. The Cu and Zn concentrations were largely influenced by
the physical and chemical properties of the arable soils. The studies showed statistically significant
relationships between total zinc content and soil pH (r = 0.725 ***, p = 0.00006), the content of the
clay fraction (r = 0.427 **, p = 0.0376) and TOC (r = −0.896 ***, p = 0.00001) in OF (Table 3). However,
total copper content depended significantly on soil pH (r = 0.466 **, p = 0.0218) in CF (Table 4).
An increase in redox potential and a decrease in reaction with low organic matter content leads to
increased mobility of metals, such as lead, cadmium, zinc, copper, and mercury. The concentration of
microelements in the soil also depends on the possibility of creating complex compounds with soil
organic components. The formation of organometallic complexes in the soil is important in preventing
toxic heavy-metal ions leaching from the soil, as well as in partially detoxifying them and limiting
their uptake by plants [57].
Knowing the total content of trace elements in soils does not provide a picture of their actual
6availability to plants or their possibility of entering the biological cycle [56]. Nutrient mobility
depends on granulometric composition, content of organic matter, pH, and microbiological activity.
The soil-use method and the mineral and organic fertilization applied are also very important [58].
All these factors concurrently determine the amount of elements accumulated in biological material or
immobilized in soil particles [59]. The amount of microelements in the studied soils varied. The content
of available forms of Zn and Cu in the soil samples lay at the median level in relation to upper and
lower thresholds of permissibility, regardless of species and sowing density (Table 6). The ZnA soil
content was higher in CF than OF, while the opposite was true of CuA. The analysis of variance
confirmed the effect of wheat species and sowing density on the content of available forms of zinc
and copper in OF. Meanwhile, in CF, it was mainly the number of plants that determined the amountAgronomy 2020, 10, 1652 11 of 20
of bioavailable forms of the studied microelements. An analysis of the η2 measure of effect was
used to determine the percentage share of all factors influencing the Zn and Cu content in the soil
(Figure 1A,B). The results indicate that in both OF and CF it was mainly sowing density that influenced
the content of TZn (58.1% OC; 87.8% CF), AZn (35.5% OF; 76.1% CF), TCu (28.4% OC; 51.0% CF).
Only in the case of ACu was the wheat species the dominant determining factor. Variation in uptake of
microelements is particularly high under acidic soil conditions, as these increase solubility. In our own
research, significant relationships were found between soil pH and the content of available forms of
Zn (r = 0.496 **, p = 0.0136) in OF (Table 3) and the content of available forms of copper (r = 0.466 **,
p = 0.0435) in CF (Table 4). A significantly negative correlation was also found between available
forms of Zn and Cu, as well as TOC in OF soils (r = −0.640 ***, p = 0.00008 for Zn and r = −0.695
***, p = 0.0002 for Cu). The coefficient of determination (R2 ) showed that 41% of the variation in
AZn and 48% in ACu depends on TOC content. The linear regression equation shows that as the
TOC content increases by 1 g kg−1 , AZn content decreases by 0.409 mg kg−1 , and ACu content by
0.483 mg kg−1 . The mobility of copper is much lower than that of zinc. Copper in soil occurs mainly
in combinations with organic matter, clay minerals, and in the form of low mobile sulfates, sulfides,
and carbonates [60]. This element is easily absorbed by plants in the form of Cu2+ ions or chelates.
The organic substance has a particularly strong and high sorption capacity for copper. With copper,
humic, and fulvic acids give both soluble and insoluble compounds, depending on the degree of their
saturation and reaction [61]. In CF, on the other hand, a significantly positive correlation was noted
between bioavailable zinc and TOC (r = 0.478 **, p = 0.0181). Significantly positive relationships were
also found between the available forms of both elements and the clay fraction (r = 0.502 **, p = 0.01250
for Zn and r = 0.579 ***, p = 0.00310 for Cu). The value of the coefficient of determination (R2 ) showed
that only 25% of the variability in AZn and 23% of ACu was related to the size of the clay fraction
(Table 4).
The bioavailability coefficient (AFZn ) calculated for zinc was in a range from 22.2 to 28.2%.
Figure 2A shows that the increase in this coefficient was influenced by sowing density, regardless of the
management system. Its value was not influenced by wheat species. By contrast, the coefficient was
found to increase with sowing density, regardless of the type of farm (Figure 2A). A different relationship
was noted in the case of AFCu . Figure 2B shows that both wheat species and sowing density influenced
the coefficient’s value. The highest AFCu value of 49.2% was recorded for Triticum sphaerococcum with a
sowing density of 600 grains m−2 .
Agronomy 2020, 10, x FOR PEER REVIEW 12 of 20
Figure 2. (A,B).
(A,B). Availability
Availability factors
factors (AF%)
(AF%) forfor Zn
Zn (A)
(A) and
and for
for Cu
Cu (B).
(B). (Were analyzed by two-way
ANOVA
ANOVAfor forspring wheat
spring species
wheat (I factor),
species and sowing
(I factor), and density
sowing(II density
factor) was
(II calculated independently
factor) was calculated
for OF and forfor
independently CF.OF
Different
and forsmall letters indicate
CF. Different comparison
small letters indicatebetween species
comparison of spring
between wheat;
species of
Standard
spring Deviation).
wheat; Standard Deviation).
Apart from the conditions related to the physical and chemical parameters of the environment,
an important role modifying the cycle of elements can be attributed to biotic elements. The
bioaccumulation of elements in plants, their temporary retention and re-activation are all selective
[55]. The processes of bioaccumulation vertically displace soil-borne elements from lower soil levels
into plant organisms. Some elements have several-fold higher contents in plants than in soil. TheAgronomy 2020, 10, 1652 12 of 20
Table 6. Contents of Zn, Cu in the soil and plants.
Organic Farming (OF) Conventional Farming (CF)
Sowing Species (I)
Density
(II) T. sphaerococcum T. persicum Mean T. sphaerococcum T. persicum Mean
Total Zn (mg kg−1 )
400 22.14 ± 0.10 b 22.25 ± 0.01 a 22.19 ± 0.08 C 30.41 ± 0.21 a 29.27 ± 0.48 b 29.84 ± 0.81 B
a b B
500 23.23 ± 0.00 22.47 ± 0.02 22.86 ± 0.54 29.74 ± 0.04 30.02 ± 0.05 29.88 ± 0.20 B
600 23.57 ± 0.02 a 22.70 ± 0.01 b 23.13 ± 0.62 A 32.06 ± 0.03 32.10 ± 0.12 32.08 ± 0.03 A
mean 22.98 ± 0.75 A 22.47 ± 0.23 B 22.72 ± 0.48 30.73 ± 1.20 A 30.46 ± 3.64 B 30.60 ± 1.28
Total Cu (mg kg−1 )
400 5.17 ± 0.02 b 5.60 ± 0.01 a 5.38 ± 0.30 A 6.30 ± 0.02 6.38 ± 0.06 6.34 ± 0.81 A
a b C a b
500 5.25 ± 0.00 4.89 ± 0.07 5.07 ± 0.25 6.15 ± 0.05 5.68 ± 0.05 5.92 ± 0.33 C
600 5.07 ± 0.03 b 5.46 ± 0.13 a 5.27 ± 0.28 B 5.85 ± 0.01 b 6.19 ± 0.03 a 6.02 ± 0.47 B
mean 5.16 ± 0.09 B 5.32 ± 0.38 A 5.24 ± 0.13 6.10 ± 0.23 5.34 ± 0.29 5.72 ± 0.24
Available Zn (mg kg−1 )
400 5.23 ± 0.61 4.98 ± 0.79 5.11 ± 0.18 C 6.76 ± 0.77 6.63 ± 0.25 6.69 ± 0.09C
500 5.99 ± 0.38 5.25 ± 0.65 5.62 ± 0.52 B 7.82 ± 0.68 7.33 ± 0.03 7.58 ± 0.35 B
600 6.39 ± 0.98 6.05 ± 0.10 6.22 ± 0.24 A 9.11 ± 0.87 9.06 ± 0.64 9.08 ± 0.04 A
mean 5.87 ± 0.59 A 5.43 ± 0.56 B 5.65 ± 0.13 7.90 ± 1.18 7.67 ± 1.25 7.78 ± 1.21
Available Cu (mg kg−1 )
400 2.08 ± 0.00 1.44 ± 0.12 1.76 ± 0.45 B 1.19 ± 0.13 a 0.62 ± 0.05 b 0.90 ± 0.40 B
500 2.17 ± 0.40 1.29 ± 0.06 1.73 ± 0.62 B 1.21 ± 0.10 a 0.76 ± 0.14 b 0.98 ± 0.32 AB
600 2.50 ± 0.44 1.87 ± 0.14 2.19 ± 0.45 A 1.15 ± 0.05 1.04 ± 0.02 1.09 ± 0.08 A
mean 2.25 ± 0.22 A 1.53 ± 0.30 B 1.89 ± 0.26 1.18 ± 0.03A 0.80 ± 0.21 B 0.99 ± 0.10
Zn in plant (mg kg−1 )
400 34.03 ± 0.12 b 37.17 ± 0.79 a 35.60 ± 2.22 A 25.39 ± 0.45 a 21.85 ± 0.45 b 23.62 ± 2.50 C
a b B a b
500 36.09 ± 0.13 32.46 ± 0.33 34.27 ± 2.57 36.01 ± 0.36 29.46 ± 0.36 32.73 ± 4.63 A
600 28.93 ± 0.14 b 35.43 ± 0.40 a 32.18 ± 4.98 C 39.35 ± 0.44 a 22.45 ± 0.44 b 30.90 ± 11.9 B
mean 33.02 ± 3.68 B 35.02 ± 2.38 A 34.02 ± 1.72 33.58 ± 7.29 A 24.59 ± 4.23 B 29.08 ± 4.82
Cu in plant (mg kg−1 )
400 3.54 ± 0.06 b 4.48 ± 0.12 a 4.01 ± 0.66 A 4.51 ± 0.39 b 7.03 ± 0.16a 5.77 ± 1.78 A
a a
500 2.55 ± 0.09 b 5.89 ± 0.45 4.22 ± 2.36 A 2.10 ± 0.09 b 5.71 ± 0.29 3.90 ± 2.55 C
b a B a b
600 3.18 ± 0.04 3.57 ± 0.34 3.38 ± 0.28 6.25 ± 0.38 4.56 ± 0.31 5.40 ± 1.20 B
mean 3.09 ± 0.50 B 4.64 ± 1.17 A 3.87 ± 0.44 4.28 ± 2.08 B 5.76 ± 1.23 A 5.02 ± 0.99
Were analyzed by two-way ANOVA for spring wheat species (I factor), and sowing density (II factor) was calculated
independently for OF and for CF. Different small letters indicate comparison between species of spring wheat.
Different capital letters indicate a comparison among between sowing density; ± Standard Deviation.
Apart from the conditions related to the physical and chemical parameters of the environment,
an important role modifying the cycle of elements can be attributed to biotic elements.
The bioaccumulation of elements in plants, their temporary retention and re-activation are all
selective [55]. The processes of bioaccumulation vertically displace soil-borne elements from lower
soil levels into plant organisms. Some elements have several-fold higher contents in plants than in
soil. The content of both metals in the plant varies greatly by development stage, variety, and species,
as well as their environmental concentration [56]. Both Zn and Cu are essential components for normal
plant development and growth. However, there is a strong antagonism in plants’ uptake of these
metals [57]. In general, copper lowers the Zn level in above-ground parts of the plant. Conversely,
high doses of zinc cause copper deficiency, especially in cereals, and may reduce the yield of plants
with poor supply of copper [61]. However, the correlation analysis did not confirm such relationships.
Zinc was found in higher levels than copper in the analyzed plant material (Table 6). The type of wheatAgronomy 2020, 10, 1652 13 of 20
and the sowing density influenced the content of both elements in the plant. The analysis of the η2
measure of effect size showed that wheat species was the main influence on zinc content in the plant
(49.95%) in CF and on copper content (51.06%) in OF (Figure 1A,B). Meanwhile, higher levels of copper
were found in T. persicum. For this variety, copper content was also seen to fall with sowing density.
3.4. Alkaline and Acid Phosphatase Activity in Soil
Phosphatases belong to a broad group of enzymes that catalyze the hydrolysis of organic
phosphorus compounds and are used to assess the potential rate of mineralization of such compounds
in soil [62]. In addition, they are responsible for the plant’s management of phosphorus. The η2
analysis showed that wheat species influenced AlP activity by 50.9% (OF) and 36.55% (CF). In the case
of AcP, it was sowing density that most heavily determined activity (72% and 45.19%) (Figure 1A,B).
Only in OF was activity of AlP found to be significantly higher in soil under T. sphaerococcum (average
0.431 mMpNP kg−1 h−1 , ±0.058) than T. persicum (average 0.304 mMpNP kg−1 h−1 , ± 0.016) (Table 7).
AcP activity was found to be significantly higher in soil under T. sphaerococcum cultivation (in OF
and CF). The main source of phosphatases in the soil is microorganisms, and, in the case of acid
phosphatase, also plant roots. The intensity of AcP synthesis and secretion varies between species and
even varieties of plants, as they activate different acid phosphatase pools to obtain mineral phosphorus
from internal and external sources.
Both phosphatases were found to be more active in CF soil than in OF. Research by Lagomarsino
et al. [25] also showed in conventional farming that, in soil under tomato, pea, and durum wheat,
activity of acid phosphatase and arylsulfatase was higher than that of other enzymes (dehydrogenases,
β-glucosidase, N-acetyl-β-d-glucosaminidase). The applied mineral fertilizers probably became a
direct source of food for soil microorganisms, increasing their number, which additionally increased
the activity of enzymes. Agrotechnical treatments in conventional tillage lead to the improvement
of soil climate on the appropriate level of aeration and moisture of soil, which should increase its
biochemical activity.
The paper presents negative correlations between the content of TOC in soil and the activity
of AlP (r = −0.674 ***; p = 0.00030) and AcP (r = −0.842 ***; p = 0.00001) in OF (Table 3). Earlier
studies show positive correlations between these parameters [18,63]. According to Feng et al. [64],
the activation of enzyme activity could accelerate the degradation rate of soil organic matter (SOM),
leading to the depletion of soil organic carbon (SOC). Those authors believe that, in arable soils of low
SOC content, enzyme activity may be inhibited by a lack of energy and substrates. This suggests that
enzymatic activity is not a perfect reflection of SOC content. Research by Marinari et al. [65] showed
that the minimum period of organic farming should be seven years. After this period, the soils achieve
better physical, chemical and biological parameters. In CF, no significant correlations were found
between TOC content and the activity of phosphatases. This may be due to the low share of humic
substances in the soil’s total organic matter content. This limits the availability of easily absorbable
carbon, which affects the development of the soil microorganisms that produce these enzymes [66].
The correlation analysis showed a significant relationship between phosphorus content in the
OF soil and AlP activity (r = 0.476 **; p = 0.01880) (Table 3). This suggests that this enzyme was an
appropriate parameter to characterize the analyzed soils in terms of available phosphorus content,
as opposed to acid phosphatase activity. However, based on the R2 coefficient of determination, it was
found that only 22.7% of p determines AlP activity. Positive significant correlations in CF were obtained
between clay content and the activity of both AlP (r = 0.854 ***; p = 0.00001) and AcP (r = 0.750 ***;
p = 0.00002) (Table 4). Interpretation of this phenomenon is complicated by the possible long-term
occurrence of extracellular enzymes in soil in combinations with soil colloids. It is known that the
substrate for phosphomonoesterases consists of organophosphorus compounds found in soil [67,68].
Knowing the size of these two parameters should largely allow the bioavailable phosphorus content
to be estimated, which can be considered as phosphorus determined by the Egner-Riehm method.
The observed changes in available phosphorus content and phosphatase activity suggest that, at aAgronomy 2020, 10, 1652 14 of 20
density of 600 grains m−2 , wheat roots produce significant amounts of this enzyme under conditions
of competition for P.
Table 7. Activity of alkaline (AlP) and acid (AcP) phosphatase in soil.
Organic Farming (OF) Conventional Farming (CF)
Sowing Species (I)
Density
(II) T. sphaerococcum T. persicum Mean T. sphaerococcum T. persicum Mean
Alkaline phosphatase (mM pNP kg−1 h−1 )
400 0.390 ± 0.007 0.290 ± 0.002 0.340 ± 0.071 B 0.562 ± 0.035 0.416 ± 0.027 0.489 ± 0.103 C
500 0.406 ± 0.003 0.303 ± 0.009 0.354 ± 0.073 B 0.643 ± 0.032 0.565 ± 0.044 0.604 ± 0.055 B
600 0.498 ± 0.045 0.321 ± 0.003 0.409 ± 0.125 A 0.781 ± 0.006 0.605 ± 0.004 0.693 ± 0.124 A
mean 0.431 ± 0.058 A 0.304 ± 0.016 B 0.368 ± 0.036 0.662 ± 0.111 0.529 ± 0.100 0.595 ± 0.102
LSD0.05 I-0.106; II-0.046; I/II-n.s. LSD0.05 I-n.s.; II-0.059; I/II-n.s.
Acid phosphatase (mM pNP kg−1 h−1 )
400 1.238 ± 0.040 0.958 ± 0.086 1.098 ± 0.677 C 1.469 ± 0.008 1.270 ± 0.050 1.369 ± 0.141 B
500 1.372 ± 0.008 1.092 ± 0.041 1.232 ± 0.198 B 1.517 ± 0.028 1.369 ± 0.033 1.443 ± 0.105 B
600 1.542 ± 0.056 1.373 ± 0.028 1.458 ± 1.090 A 1.587 ± 0.022 1.500 ± 0.010 1.543 ± 0.062 A
mean 1.384 ± 0.845 1.141 ± 0.596 1.262 ± 0.182 1.524 ± 0.059 A 1.379 ± 0.115 B 1.452 ± 0.087
Were analyzed by two-way ANOVA for spring wheat species (I factor), and sowing density (II factor) was calculated
independently for OF and for CF. Different small letters indicate comparison between species of spring wheat.
Different capital letters indicate a comparison among between sowing density; ±Standard Deviation.
The correlation results revealed a significant positive relationship between soil pH and the activity
of both AlP (r = 0.529 ***; p = 0.00780) and AcP (r = 0.716 ***; p = 0.00008) (Table 3). Each enzyme has
its own pH for optimal activity, and phosphatases differ from other enzymes in having a wide pH
range (pH 8–10 for AlP and pH 4–6 for AcP) and sensitivity to this parameter. Statistical analysis also
showed a positive correlation between clay content and both AlP (r = 0.854 ***; p = 0.00001) and AcP
(r = 0.750 ***; p = 0.00002) (Table 4). The content of clay fractions determined 73% and 56%, respectively,
of the activity of the two phosphatases. The regression equation showed that a 1% increase in clay
content increased AlP by 0.245 mMpNP kg−1 h−1 and AcP by 0.288 mMpNP kg−1 h−1 . Both in OF and
in CF, significant positive correlations were obtained between the content of available forms of Cu and
Zn and the activity of soil phosphomonoesterases (Tables 3 and 4). The presence of phosphorus in the
soil is an important factor limiting heavy-metal uptake in plants, because with a higher content of its
easily soluble forms, poorly soluble phosphates of, for example, zinc, cadmium, lead and copper may
precipitate. However, it should be emphasized that in the present tests the permissible Zn and Cu
contents are not exceeded. This indicates their natural accumulation in the soil, which did not inhibit
the tested hydrolytic enzymes. It is also known that, in low concentrations, heavy metals are activators
for many enzymes.
3.5. Evaluation of Insect Numbers
In the plots with spring wheat grown organically, in the beginning of the flowering phase an
average of 167 insects (±42.760) were caught, compared to only 91.8 insects (±7.362) for CF (Figure 3).
The greater number of insects on OF cereals is caused by the limitations in using methods for regulating
the number of the phytophages that feed on them [69]. It was found, for both organic and conventionally
cultivated wheat, that significantly more insects were caught from T. sphaerococcum than from T. persicum
(respectively: for OF, 208.3 and 125.8 ind.; and for CF, 93 and 90 ind.). Insects prefer a higher density of
organically grown spring wheat (500 and 600 grains m−2 ), while, on CF plants, they prefer an average
density of spring wheat of 500 grains m−2 .You can also read