Acquired Traits Contribute More to Drought Tolerance in Wheat Than in Rice - Science
←
→
Page content transcription
If your browser does not render page correctly, please read the page content below
AAAS
Plant Phenomics
Volume 2020, Article ID 5905371, 16 pages
https://doi.org/10.34133/2020/5905371

Research Article
Acquired Traits Contribute More to Drought Tolerance in Wheat
Than in Rice

 Preethi Vijayaraghavareddy,1,2 Ramu S. Vemanna ,3 Xinyou Yin,2 Paul C. Struik ,2
 Udayakumar Makarla,1 and Sheshshayee Sreeman 1
 1
 Department of Crop Physiology, University of Agricultural Sciences, Bengaluru, India
 2
 Centre for Crop Systems Analysis, Department of Plant Sciences, Wageningen University & Research, PO Box 430,
 6700 AK Wageningen, Netherlands
 3
 Regional Centre for Biotechnology, Faridabad, Haryana, India

 Correspondence should be addressed to Sheshshayee Sreeman; msshesh1@uasbangalore.edu.in

 Received 11 November 2019; Accepted 4 May 2020; Published 12 June 2020

 Copyright © 2020 Preethi Vijayaraghavareddy et al. Exclusive Licensee Nanjing Agricultural University. Distributed under a
 Creative Commons Attribution License (CC BY 4.0).

 Drought tolerance is governed by constitutive and acquired traits. Combining them has relevance for sustaining crop productivity
 under drought. Mild levels of stress induce specific mechanisms that protect metabolism when stress becomes severe. Here, we
 report a comparative assessment of “acquired drought tolerance (ADT)” traits in two rice cultivars, IR64 (drought susceptible)
 and Apo (tolerant), and a drought-tolerant wheat cultivar, Weebill. Young seedlings were exposed to progressive concentrations
 of methyl viologen (MV), a stress inducer, before transferring to a severe concentration. “Induced” seedlings showed higher
 tolerance and recovery growth than seedlings exposed directly to severe stress. A novel phenomic platform with an automated
 irrigation system was used for precisely imposing soil moisture stress to capture ADT traits during the vegetative stage. Gradual
 progression of drought was achieved through a software-controlled automated irrigation facility. This facility allowed the
 maintenance of the same level of soil moisture irrespective of differences in transpiration, and hence, this platform provided the
 most appropriate method to assess ADT traits. Total biomass decreased more in IR64 than in Apo. The wheat cultivar showed
 lower levels of damage and higher recovery growth even compared to Apo. Expression of ROS-scavenging enzymes and
 drought-responsive genes was significantly higher in Apo than in IR64, but differences were only marginal between Apo and
 Weebill. The wheat cultivar showed significantly higher stomatal conductance, carbon gain, and biomass than the rice cultivars,
 under drought. These differences in ADT traits between cultivars as well as between species can be utilised for improving
 drought tolerance in crop plants.

1. Introduction enhance the genetic potential that can produce more biomass
 and yield with reduced water requirement.
Rice (Oryza sativa L.), being a semiaquatic species, is gener- Selection for higher absolute yields under water-limiting
ally cultivated under puddle conditions. However, with the conditions was one of the major approaches for improving
impending climate change combined with domestic and rice productivity. Although this approach provided initial
industrial demands for fresh water, cultivation of rice in the dividends, further improvement in rice productivity has
conventional puddle system is fast becoming less feasible become hard to achieve [4]. To overcome this bottleneck, a
[1]. This necessitates development of suitable water-saving focused trait-based breeding approach has been proposed
agronomic practices to save water. Practices such as semi- and is being widely adapted [5]. This led to a significant
irrigated aerobic cultivation are known to save more than increase in enumerating physiological and morphological
half of the water used and avoid the destruction of soil struc- traits and establishing their functional relevance in confer-
ture while puddling [2]. However, a concomitant yield loss by ring stress tolerance in rice plants [4]. Depending on the level
more than 40% when grown under the aerobic system has of organization and response to external stimuli, drought-
been observed [3, 4]. Therefore, we should attempt to adaptive traits are broadly classified as “constitutive,”
2 Plant Phenomics

“responsive,” and “acquired” tolerance traits [4]. Traits that with the use of specific stress “inducers” such as methyl vio-
are always expressed such as root number, stoma number, logen (MV) is also a simple approach to assess acquired tol-
specific leaf area, and epicuticular waxes are referred to as erance at the seedling stage [15]. Many studies have
"constitutive traits or integral traits" [6]. Traits that are documented significant genetic variability in acquired toler-
expressed always but would significantly change in response ance levels using these experimental protocols. Furthermore,
to stress such as root length and osmotic adjustment are often several studies reported that crop genotypes with higher
referred to as “responsive” traits [4]. On the other hand, acquired tolerance recorded improved growth and perfor-
“acquired tolerance traits” are conspicuously absent under mance under drought stress conditions. Rice genotypes with
well-watered conditions but get upregulated when plants higher acquired tolerance had higher spikelet fertility under
experience gradual induction of a stress [7]. De novo gene stress and hence were associated with a superior yield [9].
expression has been shown to increase when plants experi- Realising the importance of acquired tolerance in drought
ence mild stress levels. This upregulation of gene expression adaptation, several methods to quantify this trait were devel-
is known to induce specific mechanisms that provide protec- oped [16, 17]. Although these methods provide clues on
tion to cellular metabolism when stress gets severe. Acquired genetic variations in the propensity to respond to stress, these
tolerance is therefore associated with the upregulation of sev- methods rely on the induction of response through priming
eral diverse processes such as maintenance of redox homeo- young seedlings with temperature and/or stress-inducing mol-
stasis, regulation of gene expression, protein turnover, ecules. Examining the stress response by providing drought
DNA/protein repair mechanisms, osmotic adjustment, and itself as an inducer has been the most important limitation.
membrane stability including specific metabolomic changes To capture these stress-responsive mechanisms, precise
[8]. Maintenance of cellular metabolism is dependent upon imposition and accurate maintenance of a specific stress
the abilities of the plant to sustain positive tissue turgor and regime are of paramount importance. Advancements in
to maintain cell membrane integrity. While turgor mainte- high-throughput phenotyping approaches led to the estab-
nance is governed mostly by constitutive traits such as root lishment of high-end phenomic platforms that are increas-
and leaf surface characters [9], maintenance of cellular ingly being used for imposing stress and for capturing
metabolism even under decreasing tissue turgor is more asso- genetic variability in stress responses [18]. Gravimetric prin-
ciated with acquired tolerance traits [9]. ciples have, by and large, been the approach for determining
 Maintenance of cell membrane integrity is in turn depen- water lost by a potted plant. Automated water dispensing sys-
dent on the ability to manage oxidative stress [8]. Increased tems have also been developed in these high-end phenomic
production of reactive oxygen species (ROS) is an inevitable platforms to maintain a specific soil moisture status. How-
consequence of stress encountered by plants. Naturally, ever, these platforms are limited by the number of gravimet-
plants have evolved several mechanisms to balance the ROS ric determination of water loss in a day. Thus, mimicking the
homeostasis under stress through upscaling several ROS- progression of stress in natural conditions still remains a
scavenging mechanisms [4]. Increased activity of some key major challenge. We developed a novel phenomic platform
ROS-scavenging enzymes like ascorbate peroxidase (APX), with an automated irrigation system that is interfaced with
superoxide dismutase (SOD), glutathione peroxidase transpirational water loss. Thus, the system maintains the
(GPX), dehydroascorbate reductase (DHAR), and catalase water content in the soil within 1% of the fixed field capacity
(CAT) has been reported in many species. Wheat genotypes and hence represents an excellent system to examine stress
that show increased activity of these enzymes also display response of plants. The most important feature of this facility
considerable stress tolerance [10]. Interestingly, these protec- is its ability to progressively decrease the water added so as to
tive mechanisms are generally upregulated when plants expe- bring the soil to a specified level of soil moisture stress. This
rience mild levels of stress and hence develop tolerance to transpiration-interfaced automated irrigation system can
stress when the severity increases. These mechanisms that therefore accurately mimic a field-like drought progression
provide acquired tolerance display large genetic diversity, scenario. The other most prominent feature of this facility
which also depends on the type of stress and the progression is its ability to maintain the same level of stress despite any
of stress occurrence [11, 12]. possible differences in transpiration rates and hence repre-
 The premise of this investigation is based on the hypoth- sents an excellent system to compare stress responses of
esis that a combination of constitutive traits with acquired genotypes within as well as across species. Therefore, this sys-
tolerance traits would comprehensively improve drought tem provides an opportunity for a comparative assessment of
adaptation. Methods for determining constitutive traits have rice and wheat (Triticum aestivum L.) for the differences in
been developed under both laboratory and field conditions their acquired tolerance levels.
[4, 6]. Methods for determining acquired tolerance require Rice and wheat are the two most extensively consumed
the induction of young seedlings with a mild level of stress C3 cereals, with phenomenal differences in water use patterns
before transferring the seedlings to severe or lethal stress that render wheat to be better adapted to drought than rice.
levels. A few laboratory experimental protocols have been Therefore, growing rice like wheat would have phenomenal
developed where, young seedlings are induced with a gradu- significance in saving water. Comparing the stress response
ally increasing temperature until it reaches lethal levels. This of these two cereals to water limitation would provide scien-
method, referred to as Temperature Induction Response tific insights to prepare rice for limited water resources. Rice
(TIR), is a convenient assay for assessing acquired tolerance and wheat are known to differ in several morphophysiologi-
[13, 14]. Similarly, inducing changes in cellular metabolism cal traits and hence have reduced water requirement. While
Plant Phenomics 3

large differences in water absorption through root system tially increasing concentrations of MV, i.e., 2, 4, 6, and
architecture, metabolic status, etc., are well known to be 8 μM of MV. Seedlings were allowed to stay for a duration
superior in wheat [19–21], no systematic study has ever been of 3 hours in each of the concentrations before being trans-
done to assess the differences in acquired tolerance between ferred to the next higher concentration, and subsequently,
these cereal species. We hypothesise that when acquired tol- the “induced” seedlings were transferred to 10 μM concentra-
erance traits are combined with constitutive traits such as tion of MV (lethal stress). Three plates were maintained for
roots and water use efficiency, such genotypes would have each treatment, and a completely randomized design was
comprehensively higher adaptability to drought. We exam- adopted for statistical analysis. To every plate, 10 ml of each
ined rice and wheat cultivars for the differences in acquired concentration of MV was added. One set of seedlings was
tolerance besides other traits. The major intent of this study directly transferred to 10 μM MV, to represent the “severe
was to examine the relevance of acquired tolerance in stress” treatment, while a separate set of seedlings was con-
imparting drought adaptation, by comparing tolerant and tinuously kept in plates wetted with distilled water to repre-
susceptible rice cultivars and also rice and wheat. An initial sent the “absolute control.” Seedlings in all treatments were
experiment was conducted to assess the best suitable stress exposed to 600 μmol m-2 s-1 of light intensity in a controlled
imposition approach (induction and lethal) to study acquired growth chamber with an air temperature maintained at
mechanisms of rice and wheat using MV which is a potent 30°C with 60% RH throughout the experiment period. Shoot
inducer of oxidative stress. Further experiments were done and root lengths were recorded between 10:00 and 12:00
using the phenomic facility by following an induction proto- hours at the end of the stress period (72 hours from the stress
col. The results clearly demonstrate the superior drought tol- imposition). Recovery growth was assessed 48 hours after
erance in wheat compared to even a known drought-adaptive transferring the seedlings from the induction and severe
cultivar of rice. stress treatments to distilled water. Comparison was made
 between induction and lethal treatments within cultivars.
2. Materials and Methods Measurements of membrane damage, reactive oxygen species
 (ROS), and reactive carbonyl compound (RCC) production,
2.1. Plant Material and Approach. Two rice cultivars, IR64 antioxidant activities, etc., were made with the seedlings sub-
and Apo, and one wheat cultivar, Weebill, were used in the jected to induction stress, and the results were compared in
experiments. IR64 is a drought-susceptible, high-yielding, relation to that of the seedlings which were directly exposed
lowland rice cultivar, and Apo is a drought-tolerant, high- to sever stress.
yielding, and aerobic rice cultivar. The wheat cultivar Weebill
is known to be drought tolerant [21]. Two types of a stress 2.2.1. Quantification of Superoxide (O2-) by Nitrotetrazolium
imposition method and three independent experiments were Blue Chloride (NBT) Staining. Seedlings were transferred to
conducted at the research facilities of the University of Agri- NBT solution to detect superoxide radicals. Seedlings were
cultural Sciences, Bengaluru, India (12°58 ′ N, 77°35 ′ E): the immersed in 0.2% NBT solution dissolved in 50 mM sodium
first one used a chemical stress inducer with young seedlings phosphate buffer with a pH of 7.5. NBT reacts with O2- to
(48 h old), and the second was to examine the drought stress form a dark-blue insoluble formazan compound. The seed-
response both at the seedling (15 days after sowing (DAS)) lings were transferred to a bleaching solution to remove chlo-
and vegetative (35 DAS) stages. Drought treatment was rophyll. Tissues were ground in 0.1% acetic acid [16]. The
imposed using the phenomic platform with an automatic samples were centrifuged at 10,000 rpm for 10 min, and
irrigation capability (described later). absorbance was read at 560 nm.

2.2. Experiment 1: Stress Imposition Using Methyl Viologen. 2.2.2. Quantification of Hydroxyl (∙OH) Radicals. The pres-
Methyl viologen (MV) is an artificial electron donor to both ence of hydroxyl radicals in seedlings was quantified using
mitochondrial and chloroplast electron transport [22–24] the method described by [25]. Seedlings exposed to MV
and hence generates reactive oxygen species (ROS). At high stress as described above were immediately transferred and
concentrations, MV can be lethal. To assess the effect of homogenized in 1.2 ml of 50 mM sodium phosphate buffer
MV at the young seedling stage, 48 h-old uniformly germi- (pH 7.0) and centrifuged at 12,000 rpm at 4°C for 10 min.
nated seedlings were used. An induction protocol was de- The supernatant was collected (0.5 ml) and 0.5 ml of 50 mM
veloped by treating young seedlings with progressively of sodium phosphate buffer (pH 7.0) and 1 ml of 25 mM
increasing concentrations of MV before transferring the sodium phosphate buffer containing 2.5 mM 2-deoxyribose
seedlings to a “severe” concentration. To determine this were added to the supernatant, and this mixture was incu-
lethal concentration, uniformly germinated rice seeds of cv. bated at 35°C in the dark for 1 h. After incubation, 1 ml of
IR64 were spread on 13 cm diameter Petri plates with two 1% thiobarbituric acid (TBA, Sigma, USA) and 1 ml of glacial
layers of wet filter papers. Each plate had 10 seedlings. Plates acetic acid were added and the mixture was boiled for 10 min
with 48 h-old seedlings were exposed to different concentra- and cooled immediately on an ice bath. Absorbance was
tions of MV to determine the “severe stress” concentration recorded at 532 nm.
of MV, i.e., the concentration at which about 95% of the seed-
lings died (Fig. S1). A concentration of 10 μM MV was found 2.2.3. Measurement of Malondialdehyde (MDA) Content.
to be “severe” or lethal. An induction protocol was developed Fresh leaf tissue (0.2 g) was homogenized in 0.1% trichloro-
that involved transferring the 48 h-old seedlings to sequen- acetic acid (TCA) and centrifuged at 14,000 rpm for 15 min.
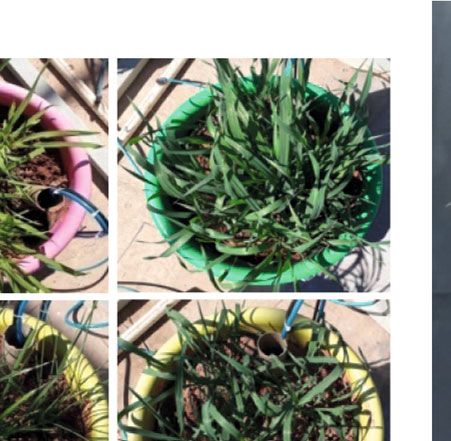
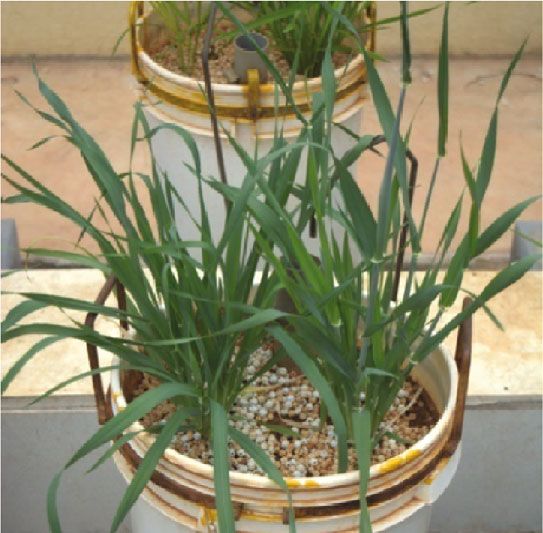
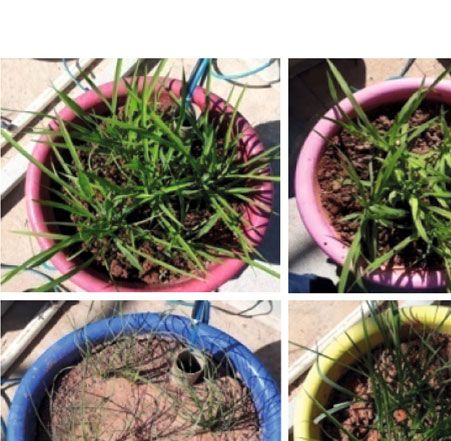
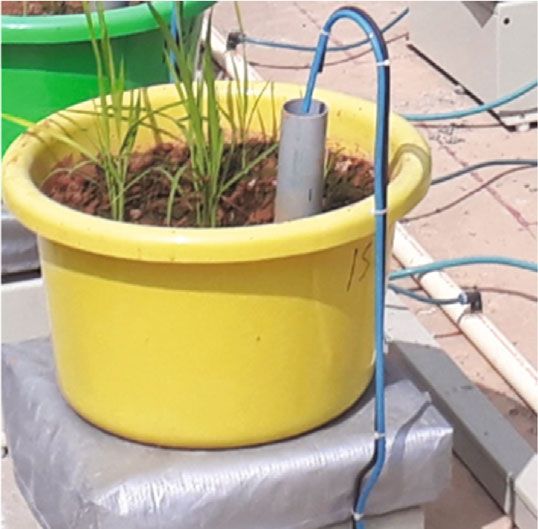
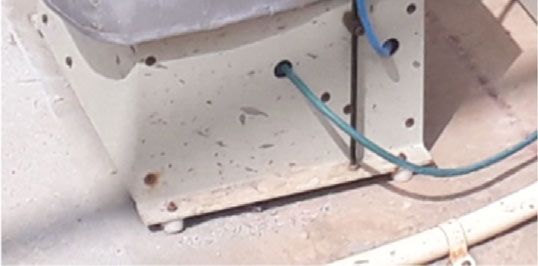
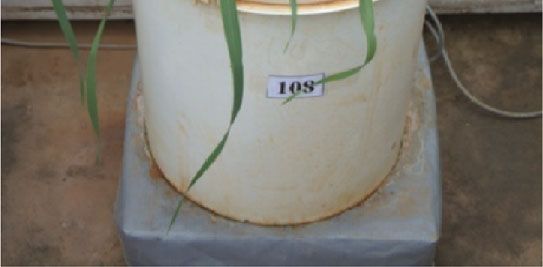
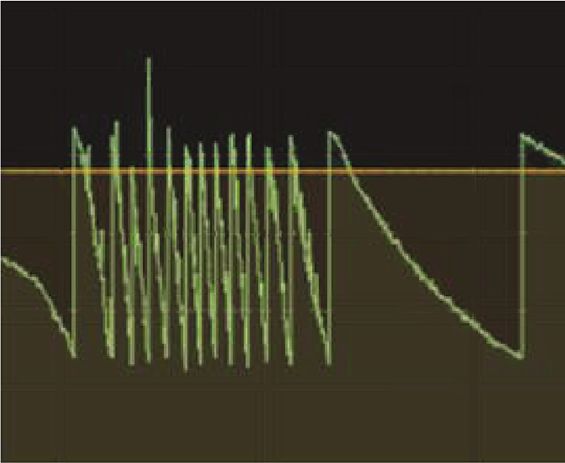
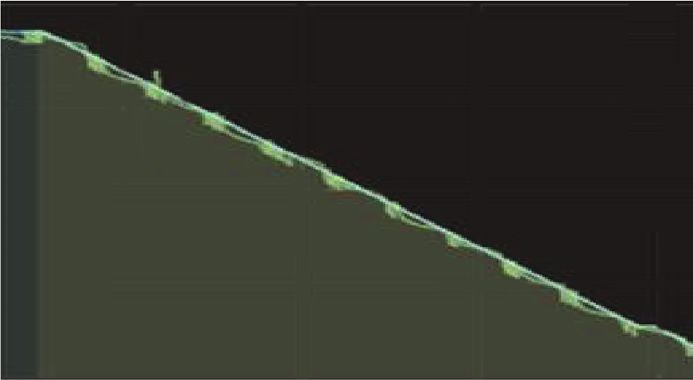
4 Plant Phenomics

2.5 ml of 0.5% thiobarbituric acid (TBA) in 20% TCA was added to a 2 ml aliquot and the mixture was boiled at 100°C
added to 1.0 ml of the supernatant, and the mixture was incu- for 1 h, and the reaction was terminated in an ice bath. 4 ml
bated at 95°C in a water bath. After 30 min of incubation, it of toluene was added to this mixture to extract chromo-
was cooled immediately and centrifuged at 10,000 rpm for phores from the aqueous phase, and absorbance was read at
30 min. Absorbance was determined at 532 and 600 nm, 520 nm. The proline content was determined from a standard
and MDA concentration was estimated by subtracting the curve and expressed as μmol g-1 fresh weight [29].
OD at 600 nm from the OD at 532 nm as a correction for
nonspecific turbidity [26]. 2.3. Experiment 2: Drought Stress Imposition Using an
 Automated Drought Simulator Phenotyping Platform. Two
2.2.4. Quantification of Methylglyoxal (MG). Fresh tissue independent experiments were conducted at the minilysi-
(100 mg) was collected from both control and treated seed- meter- (MLM-) based drought simulator platform to
lings and ground in a known volume of distilled water. The examine the response of plants to drought stress and to
extract was centrifuged at 11,000 rpm at 4°C for 10 min. assess acquired tolerance. The first experiment (experiment
250 μl of 7.2 mM 1,2-diaminobenzene and 100 μl of 5 M per- 2A) was carried out using 15-day-old seedlings in con-
chloric acid were added to the supernatant (650 μl). The tainers (10 l capacity) filled with 10 kg of a rooting mixture
absorbance in the mixture was measured at 336 nm using a comprising red sandy-loam soil mixed with farm yard
spectrophotometer (SpectraMax Plus 384, Spinco Biotech manure in a 3 : 1 (W/W) proportion. The second experi-
Pvt Ltd, Bangalore) [26]. ment (experiment 2B) was carried out using 35-day-old
 plants using larger containers (20 l capacity) filled with
2.2.5. α,α-Diphenyl-β-picryl-hydrazyl (DPPH) Assay for Total 20 kg of a rooting mixture.
Scavenging Activity. The total free radical scavenging activity Acquired tolerance for drought stress can be measured
was measured as described by McCune and Johns [27]. The only when the plants are exposed to a gradually progressing
reaction mixture containing 1 ml of the methanolic leaf stress. The novel phenomic platform established at our centre
extract and 1 ml of DPPH solution (0.3 mM) was incubated was utilised to generate a specific level of drought stress in
in the dark for 10 min. Absorbance was read at 517 nm, and container-grown plants. This facility consists of containers
percent inhibition was calculated over the control. (minilysimeters (MLM)) placed on individual load cell bal-
2.2.6. Quantification of Superoxide Dismutase (SOD) Activity. ances and is capable of determining the weights in real time.
SOD activity was quantified by using the photochemical NBT The load cell balances are capable of determining weights up
method as described by Beyer et al. [28]. In this method, to 50 kg with an accuracy of ±50 g (Figures 1(a)–1(c)). The
assay buffer containing L-methionine (300 mg/10 ml), NBT- weight of containers decreases due to evapotranspiration,
2HCl (14.1 mg/10 ml), and Triton X-100 (1%) were added and hence, this gravimetric approach represents a very accu-
to a glass tube. 20 μl of the sample extracted using phosphate rate method to determine water used by plants. Custom-
buffer was delivered to this mixture. To initiate the reaction, designed software recognises this weight reduction and com-
10 μl of riboflavin (4.4 mg in 100 ml) was added. The tube mands a solenoid value to dispense accurate volumes of
was illuminated at a light intensity of 600 μmol m-2 s-1 along water to replenish the water lost by evapotranspiration. The
with the control (without the sample). Absorbance at irrigation water is dispensed into a 2 cm diameter tube that
560 nm was recorded in all the tubes, and a percentage has a round coil of tube at the middle of the container. The
decrease in NBT reduction due to SOD activity was calcu- tubes are perforated to facilitate uniform distribution of
lated. The percent increase in SOD activity due to the stress water in the container. This setup ensures the maintenance
effect was calculated over the control. of soil moisture within 1% of the set water regime in the con-
 tainer. The most important feature of this software is its
2.2.7. Quantification of Membrane Damage by the Evans Blue capacity to bring down the water level at a rate determined
Technique. Seedlings exposed to MV stress were immediately by the user. This transpiration-interfaced irrigation software
transferred to 5 ml tubes containing 0.25 g of Evans blue dye dispenses a predesignated proportion of water so as to pro-
prepared in 0.1 M CaCl2 (pH 5.6). Seedlings were immersed vide an accurate rate of depletion of water. This “dry-
completely in Evans blue dye and incubated for one hour in down” protocol is capable of precisely mimicking the field
the dark. After incubation, seedlings were washed thoroughly conditions as well as creating a gradually developing stress
using distilled water to remove any stain adhered to the sur- condition (Figure 1(d)). The software controlling the auto-
face. Later, seedlings were transferred to 2 ml Eppendorf con- mated irrigation is also capable of maintaining the soil mois-
taining 1 ml of 1% sodium dodecyl sulphate (SDS) and ture status at any notified level, and hence, this system is the
ground using a tissue lyser. Suspension was centrifuged at most appropriate method for assessing acquired tolerance
10,000 rpm for 10 min. The supernatant was collected, and (patent application number is 201941028751). The other
absorbance was recorded at 600 nm [17]. major feature of this automated irrigation facility is its ability
 to precisely maintain a highly comparable tissue water status
2.2.8. Quantification of Proline Content. Fresh tissue (0.1 g) for cultivars independent of any differences in their transpi-
was homogenized in 3% sulfosalicylic acid. The homogenate ration rates (Figures 1(e) and 1(f)). The entire facility is
was centrifuged at 6000 g for 20 min. Acids ninhydrin (2 ml) established under naturally varying conditions. The weather
(1.25 g of ninhydrin, 20 ml of 6 M orthophosphoric acid, and parameters that prevailed during the experimental period
30 ml glacial acetic acid) and glacial acetic acid (2 ml) were were obtained from the weather station of the university,
Plant Phenomics 5

 Irrigation pipe

 Water inlet

 (a) (b) (c)

 100% FC

 60% FC

 36 DAS
 45% FC

 15 DAS 26 DAS
 (d)

 350 350 350 350
 ET (ml/day/pot)

 ET (ml/day/pot)

 ET (ml/day/pot)
 ET (ml/day/pot)

 300 300
 300 300
 250 250
 250 200 250
 200
 150
 200
 150 200
 IR64 Apo Weebill 100
 IR64 Apo Weebill IR64 Apo Weebill IR64 Apo Weebill
 Rice Wheat Rice Wheat Rice Wheat
 Rice Wheat

 (e)

 100% FC

 8/21 08:00 8/21 16:00 8/22 00:00 8/22 08:00 8/22 16:00 8/23 00:00 8/23 08:00 8/23 16:00
 (f)

Figure 1: Drought stress imposition protocol for rice and wheat using a plant phenomic platform. (a) Minilysimeter with an irrigation pipe.
(b) Pots of 10 l capacity and (c) 20 l capacity were kept on lysimeters with the automated irrigation facility. (d) Gradual moisture stress (dry-
down) was imposed with a reduction of 5% of FC per day to reach 45% FC which was then elevated to 100% FC after 10 days. (e) Bar graph
indicating evapotranspiration data of IR64, Apo, and the wheat cultivar Weebill for one day. (f) The graph is indicating real-time water
transpired and added per day.
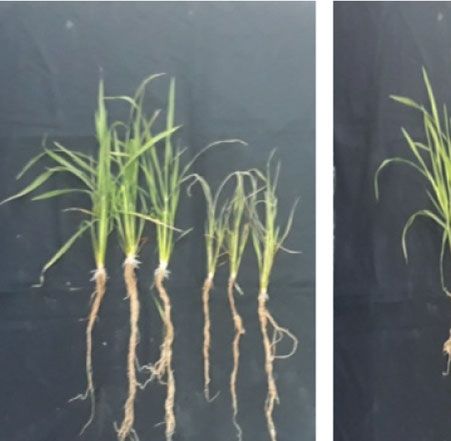
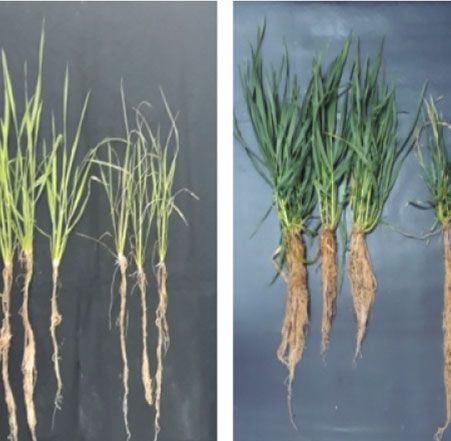
6 Plant Phenomics

located around 300 m from the experimental plot (Tables S1 gressively thinned to maintain two uniform and healthy
and S2). plants per container by 25 DAS. Stress imposition was initi-
 ated on the 35th DAS, as described above. A set of five con-
2.3.1. Experiment 2A: Stress Imposition at the Seedling Stage. tainers for each cultivar was designated as “45% FC” while
Stress imposition was initiated at 15 days after sowing the other five were maintained at 100% FC (well-watered).
(DAS) for rice and wheat seedlings by automated irrigation. The automated irrigation system of the drought simulator
A set of five containers were maintained at 100% field capac- platform regulates the water added to containers, and plants
ity (FC) while another five containers were subjected to grad- reached 45% FC on the 11th day after stress imposition. Soil
ual stress. The software was tuned to ensure a 5% reduction water status was maintained at 45% FC for additional 10 days
in soil water status per day irrespective of the differences in and later elevated to 100% FC and maintained until maturity.
evapotranspiration. The containers designated as “water During the stress period, photosynthetic rate and stomatal
stressed” reached 45% FC on the 11th day after stress imposi- conductance were measured using a portable photosynthetic
tion. Stress level was maintained at 45% FC for an additional system (LICOR 6400, Lincoln, Nebraska, USA). RWC and
10 days. Afterwards, soil water status was elevated to 100% MDA content were measured in the second leaf collected
FC for recovery. To measure relative water content (RWC), during bright sunshine hours (10:00 to 11:00 hours) using
leaf discs were made from both control and stress samples the protocol described above. The canopy temperature was
and fresh weight was recorded. Leaf discs were floated on measured in 100% and 45% FC plants using the Fluke ther-
distilled water in Petri plates for 5 h, and turgid weight was mal imaging system. Images taken from the canopy using a
recorded. Leaf discs were oven dried at 65°C for three days, Fluke camera were analysed using SmartView software.
and dry weight was recorded. The RWC was calculated Data was exported to Microsoft Excel to analyse all the
using the formula: RWC% = ððFreshweight − dry weightÞ, /; data points of the image. To avoid background noise, the
ðturgid weight − dry weightÞÞ × 100. Total chlorophyll con- canopy was outlined to arrive at mean temperature [32].
tent was measured using the acetone : DMSO (1 : 1) method. At harvest, from three replicates, shoot, leaves, and roots
Leaf discs were incubated in 10 ml of acetone : DMSO (1 : 1) were separated, oven dried at 65°C for three days, and
overnight in the dark. Absorbance was measured at 663, 645, weighed; values were computed to arrive at total leaf area
and 652 nm to calculate total chlorophyll content as and total biomass.
described by Arnon [30]. MDA and total proline were mea-
sured in replicates of three using the protocol described 2.4. Statistical Analysis. All the data were analysed to check
above in the second leaf collected during bright sunshine statistical significance using Genstat (15th edition) (http://
hours (10:00 to 11:00 hours). Plant height, tiller number, www.genstat.co.uk/). The goal of this investigation was to
and biomass were measured a week after recovery in three compare the effect of “induction” stress on plant perfor-
replicates. mance when stress levels become severe. For this compari-
 To prove that gradual drought stress upregulates drought- son, a one-way statistical algorithm was used in experiment
responsive scavenging enzymes, ascorbate peroxidase (APX), 1, where various parameters of induced and severely stressed
FeSOD, and catalase (CAT), aldo-keto reductase (AKR1) Δ1- plants were compared. Further, the comparisons were also
pyrroline-5-carboxylate synthase (P5CS) expression levels made between the two rice cultivars (Apo and IR64) and
were measured. Along with scavengers, ER stress-responsive between the tolerant rice cultivar Apo and wheat cultivar,
genes, binding protein (BiP1) and calreticulin (CRT1) activity Weebill in induction treatment only. In experiment 1,
were also measured by expression studies. Leaf tissues from methyl viologen, a stress inducer, was used. In experiment
seedlings grown at 100% and 45% FC in replicates of three 2, the comparison was made at 45%FC between the two
were used to extract total RNA using the phenol-chloroform cultivars of rice and between the tolerant rice cultivar
method according to Datta et al. [31], and cDNA was synthe- Apo and wheat cultivar, Weebill. Plants were exposed to
sized by oligo (dT) primers using Moloney murine leukaemia progressive drought stress using the automated phenomic
virus reverse transcriptase (MMLV-RT; MBI Fermentas, platform, and the statistical significance of several parame-
Hanover, MD). The cDNA pool was used as a template to per- ters was compared by performing a one-way ANOVA.
form RT-PCR analysis according to the manufacturer’s pro- Comparisons were also made between Apo and Weebill
tocol (Opticon 2; MJ Research, USA, and MJ Bioworks Inc.). using the same algorithm.
The quantitative real-time RT-PCR was performed with the
fluorescent dye SYBR Green (TAKARA SYBR Green qPCR 3. Results
Kit). The relative expression levels of the selected genes under
a given stress condition were calculated using the comparative 3.1. Wheat Has Higher Oxidative Stress Tolerance Than Rice.
threshold method. The PCR was performed with SYBR dye, A significant reduction in growth was observed in MV-
and the PCR conditions were 94°C for 3 min, 25 cycles of treated seedlings of the rice cultivars, with a strong reduction
94°C for 30 s, 52–58°C for 30 s, and 72°C for 40 s, and a final in root length, especially in the susceptible cv. IR64 at the end
extension of 72°C for 5 min. Ubiquitin was used as an internal of the stress period (Figures 2(a) and 2(b) and Table S3a).
control for normalization. The wheat cultivar, Weebill, on the other hand showed
 better tolerance with sustained shoot and root growth
2.3.2. Experiment 2B: Stress Imposition at the Vegetative compared to the tolerant rice cv. Apo (Figures 2(b) and
Stage. In a set of 10 containers, the plant population was pro- 2(c)). Neither of the two rice cultivars survived the severe
Plant Phenomics 7

 8
 Rice-IR64 7
 6
 ⁎

 Root length (cm)
 5
 4
 †
 3
 2
 1 ⁎ † †
 0
 Rice-Apo
 –1 IR64 Apo Weebill

 Rice Wheat

 (b)

 8

 Shoot length (cm)
 Wheat-Weebill 6

 4 ⁎

 2

 Control Induction 10 M MV 0
 IR64 Apo Weebill

 (a) Rice Wheat

 (c)
 11
 10
 9
 ⁎ 8 ⁎
 Shoot length (cm)
 Root length (cm)

 7
 6
 5
 † 4 †
 3 ¥
 † † 2 ¥
 1 †
 0
 –1
 IR64 Apo Weebill IR64 Apo Weebill

 Rice Wheat Rice Wheat

 Control
 Induction
 10 M MV

 (d) (e)

Figure 2: Effect of methyl viologen (MV) on plant growth in induction and severe stress treatments (10 μM) in both rice (IR64 and Apo)
cultivars and the wheat (Weebill) cultivar (Experiment 1). Effect of MV on (a) plant growth, (b) root length, and (c) shoot length
measured at the end of the stress period (72 hours after stress imposition). Seedlings from all the treatments were subjected to recovery
growth for two days, and (d) root length and (e) shoot length were measured after the recovery period. Scale bar = 8 cm. †Significant
difference between induction and severe stress treatments within cultivars at p ≤ 0:05. ¥Significant difference between rice cultivars (IR64
and Apo) in the induction treatment at p ≤ 0:05. ∗ Significant difference between tolerant rice cv. Apo and wheat cv. Weebill in the
induction treatment at p ≤ 0:05.

stress treatment, but wheat proved to be more tolerant to the Rice cv. Apo had a higher recovery when stress was
severe stress treatment (Figure 2(a)). In the induction gradually induced than cv. IR64. Wheat had significantly
treatment, recovery growth of seedlings was significantly more root and shoot growth than the tolerant rice cultivar
superior to that of seedlings directly exposed to the severe Apo when the stress was gradually induced (Figures 2(d)
stress treatment for both cereals (Figures 2(d) and 2(e)). and 2(e) and Table S3b).
8 Plant Phenomics

Table 1: Effects of methyl viologen on ROS and RCC production in seedlings of two rice cultivars and one wheat cultivar (Experiment 1).
Accumulation of superoxide (O2-), hydroxyl radical (∙OH), malondialdehyde (MDA), and methylglyoxal (MG) contents and extent of
membrane damage measured by the Evans blue technique in control, induction, and severe (10 μM) treatments of methyl viologen.
†
 Significant difference between induction and severe stress treatments within cultivars at p ≤ 0:05. ¥Significant difference between rice
cultivars (IR64 and Apo) in the induction treatment at p ≤ 0:05. ∗ Significant difference between tolerant rice cv. Apo and wheat cv.
Weebill in the induction treatment at p ≤ 0:05.

 Rice Wheat
Parameters Treatment
 IR64 Apo Weebill
 Control 127 ± 9:6 122 ± 6:0 104 ± 7:2
O2- (Absor × 1000) Induction 955 ± 37:6 ¥
 836 ± 18:4 601 ± 19:1∗
 10 μM MV (severe) 1668 ± 45:5† 1268 ± 39:4† 916 ± 23:4†
 Control 26 ± 2:1 29 ± 2:1 31 ± 5:5
∙ ¥
 OH (Absor × 1000) Induction 141 ± 2:8 102 ± 2:0 101 ± 5:0
 10 μM MV (severe) 275 ± 7:1† 218 ± 1:4† 173 ± 4:6†
 Control 12:6 ± 4:5 12:8 ± 1:5 18:6 ± 1:5
MDA (μg/gFW) Induction 59:1 ± 0:9 55:2 ± 0:3 45:0 ± 1:1
 † †
 10 μM MV (severe) 62:3 ± 0:9 58:8 ± 1:0 53:0 ± 0:4†
 Control 13:3 ± 1:5 18:6 ± 3:2 15:6 ± 3:5
MG (μg/gFW) Induction 52:0 ± 2:6 ¥
 45:3 ± 1:5 35:6 ± 3:0∗
 † †
 10 μM MV (severe) 78:0 ± 1:0 65:3 ± 4:0 56:3 ± 4:1†
 Control 0:7 ± 0:01 0:6 ± 0:15 0:6 ± 0:01
 ¥
Membrane damage (ngEvansblue/gFW) Induction 3:1 ± 0:32 2:0 ± 0:08 1:8 ± 0:08
 † †
 10 μM MV (severe) 5:1 ± 0:34 3:9 ± 0:25 3:7 ± 0:05†

 Generation of reactive oxygen species (ROS) is an inevi- staining, a sensitive assay to determine membrane damage,
table consequence of the stress response, and the ability to revealed that Apo experienced less membrane damage com-
scavenge these ROS is considered a stress-adaptive mecha- pared with IR64 indicating a superior induction response in
nism. There was a significant increase in O2- in all the culti- the tolerant cultivar. The membrane damage of the wheat
vars of both rice and wheat (Table 1). However, the cultivar Weebill was lower than that of Apo indicating an
increase in ROS production was significantly lower in the even better protective mechanism operating in wheat com-
seedlings receiving induction treatment than in the seedlings pared to rice (Table 1).
directly exposed to severe stress treatment. Similar observa- As a stress response, ROS-scavenging antioxidants and
tions were made for ∙OH accumulation. However, between enzymes increased in both induction and severe stress treat-
the two rice cultivars, there was a marginally lower accumu- ments as compared to the control for both cereals. Proline
lation of O2- and ∙OH in cv. Apo than in cv. IR64 in the content was not significantly different between the induction
induction treatment. Weebill recorded the lowest levels of and severe stress treatments in rice (Figure 3(a)). But fold
O2-, while ∙OH accumulation was not significantly different change in proline was significantly higher for wheat in severe
in the induction treatment than that in tolerant rice cv. Apo stress compared to induction treatment (Figure 3(a)). To
(Table 1). assess the acquired tolerance through their abilities to scav-
 Lipid peroxidation and glycation lead to the production enge ROS, a percent increase in total antioxidant activity
of several cytotoxic compounds called reactive carbonyl com- and SOD activity was measured (Figures 3(b) and 3(c)). Both
pounds (RCCs), which are consequences of oxidative stress. rice cultivars showed significant increases in total antioxidant
Seedlings exposed directly to svere levels of MV experience and SOD activities when induced with gradually increasing
an oxidative burst leading to a significant increase in MDA stress levels. The levels of induction of SOD activity and total
and MG content in the susceptible rice cv. IR64 compared antioxidants in wheat were comparable with those in the tol-
to Apo (Table 1). But when seedlings were induced with mild erant rice cultivar Apo (Figure 3(c)). But the SOD activity in
stress levels of MV, the increase in MDA and MG were sig- the wheat cultivar was significantly higher even in the severe
nificantly lower and it was lowest in Weebill. The MDA stress treatment which indicates a greater ability to scavenge
and MG levels in the wheat cultivar were lower than those ROS in wheat compared to rice (Figure 3(c)).
in the tolerant rice cultivar, Apo. These data indicate the
enhancement of acclimation response upon induction 3.2. Variability in Acquired Mechanisms at the Seedling Stage.
(Table 1). Lipid peroxidation and glycation processes are Rice and wheat seedlings (15 days old) were subjected to
known to damage the cell membrane stability. Evans blue gradual drought stress of 45% FC using the phenotyping
Plant Phenomics 9

 90 †
 80

 Proline ( g/gFW)
 ⁎
 70
 60
 50
 40
 30
 20
 IR64 Apo Weebill

 Rice Wheat

 Control
 Induction
 10 M MV
 (a)

 SOD (% increase over control)
 AA (% increase over control)

 14 60
 12 50
 10 †
 †
 †
 †
 40 ⁎
 8
 6 30
 4 20 †
 †
 2 10 ¥
 0 0
 IR64 Apo Weebill IR64 Apo Weebill

 Rice Wheat Rice Wheat

 Induction
 10 M MV
 (b) (c)

Figure 3: Effect of methyl viologen (MV) on scavenging activity in the induction treatment compared to the severe stress treatment (10 μM
MV) in both rice (IR64 and Apo) cultivars and the wheat (Weebill) cultivar (Experiment 1). (a) Proline content. (b) Percent increase in
antioxidant activity (AA) over the control measured by the DPPH method. (c) Percent increase in superoxide dismutase (SOD) activity
over the control measured at the end of the stress period. †Significant difference between induction and severe stress treatments within
cultivars at p ≤ 0:05. ¥Significant difference between rice cultivars (IR64 and Apo) in the induction treatment at p ≤ 0:05. ∗ Significant
difference between tolerant rice cv. Apo and wheat cv. Weebill in the induction treatment at p ≤ 0:05.

platform (Figure 4(a)). The gradual stress imposition proto- accompanied with the least percent reduction in total bio-
col that was adopted in these experiments ensured that the mass even when compared with the tolerant rice cv. Apo at
seedlings were “induced” with milder stress levels before 45% FC (Figure 4(g)).
reaching the target stress of 45% FC. At the end of the stress The automated irrigation system precisely maintains a
period, cv. IR64 was more wilted indicating poor tolerance to specific soil water status by gravimetrically recognising the
stress (Figure 4(a)). Morphophysiological parameters were water loss from each individual container. Therefore, mainte-
measured a week after recovery (Figure 4(b)). Although both nance of a given moisture status irrespective of differences in
the rice cultivars had a similar reduction in plant height at water use or root traits is the most prominent feature of the
45% FC, the reduction in the tiller number was marginally stress imposition system adopted. Accordingly, the relative
higher for cv. IR64 than for cv. Apo. But wheat was unaf- water content (RWC) did not differ significantly at 45% FC
fected by a reduction in soil moisture in terms of both plant between species (Table 2). Interestingly, no reduction was
height and tiller number (Figures 4(c) and 4(d)). No signif- found in the chlorophyll content relative to 100% FC in both
icant reduction in root length and weight was recorded for rice and wheat. However, the wheat cultivar Weebill
rice cultivars. Interestingly, in wheat, although root biomass recorded higher chlorophyll content than the rice cultivars
decreased under stress, a significant increase in root length in both well-watered and 45% FC conditions (Table 2). As
was observed (Figures 4(e) and 4(f)). Wheat plants recov- a biomarker that reflects stress, the MDA content increased
ered faster with higher biomass compared to cv. Apo significantly in both rice cultivars, but more so in IR64 than
(Figure 4(g)). The total biomass recorded after recovery in Apo. Wheat had much lower MDA levels than the
was significantly less in rice cv. IR64 than in rice cv. Apo, drought-tolerant rice cultivar Apo (Table 2). The highest
while wheat recorded significantly higher total biomass increase in the proline content was seen in wheat and was
10 Plant Phenomics

 Rice-IR64 Rice-Apo Wheat-Weebill Rice-IR64 Rice-Apo Wheat-Weebill
 100% FC
 45% FC

 100% FC 45% FC 100% FC 45% FC 100% FC 45% FC

 (a) (b)
 50 4.5
 45 ⁎ 4 ⁎
 40 3.5
 Plant height (cm)

 Number of tillers
 35 3
 30
 2.5
 25
 2
 20
 15 1.5
 10 1
 5 0.5
 0 0
 (c) (d)

 25 0.25 1.8
 ⁎ 1.6 ⁎
 Root weight (g/plant)

 20 0.2 1.4
 Root length (cm)

 TDM (g/plant)

 ⁎ 1.2
 15 0.15 1
 10 0.1 0.8
 0.6 ¥
 5 0.05 0.4
 0.2
 0 0 0
 IR64 Apo Weebill IR64 Apo Weebill IR64 Apo Weebill
 Rice Wheat Rice Wheat Rice Wheat

 100% FC
 45% FC
 (e) (f) (g)

Figure 4: Effect of gradual induction of moisture stress on morphophysiological parameters of IR64 and Apo (rice) and Weebill (wheat) (15
DAS—experiment 2A). (a) Phenotype of plants in 100% FC and 45% FC at the end of the stress period and (b) 7 days after recovery. Effects of
moisture stress on (c) plant height, (d) number of tillers, (e) root length, (f) root weight, and (g) total dry matter (TDM) measured after
recovery. Scale bar = 45 cm. ¥Significant difference between rice cultivars (IR64 and Apo) in the induction treatment at p ≤ 0:05.
∗
 Significant difference between tolerant rice cv. Apo and wheat cv. Weebill in the induction treatment at p ≤ 0:05.

marginally higher even under well-watered conditions com- showed significant upregulation of transcript in cv. Apo than
pared to that in rice. Between rice cultivars, IR64 had a higher in cv. IR64 (Figure 5). An endoplasmic reticulum (ER)
increase in proline than tolerant rice cv. Apo in 45% FC chaperon-binding protein (BiP1) activity was more enhanced
(Table 2). in cv. Apo than in cv. IR64. But another ER stress-responsive
 gene calreticulin (CRT1) activity did not show any variation
3.3. Upregulation of Drought-Responsive Genes Was Crucial between IR64 and Apo (Figure 5). However, interestingly, the
for Acquired Mechanisms. The tolerant rice cv. Apo showed gene involved in proline biosynthesis Δ1-pyrroline-5-car-
significant increases in drought-responsive genes. The ROS- boxylate synthase (P5CS) showed a greater upregulation in
scavenging enzymes, ascorbate peroxidase (APX), FeSOD, the susceptible rice cultivar IR64 (Figure 5).
and catalase (CAT), are known to balance the ROS in the sys- The transcription response was compared between the
tem by detoxifying and were significantly upregulated in cv. tolerant rice cultivar (Apo) and wheat (Weebill). Although
Apo compared to cv. IR64 under stress. Further, reactive car- ROS-scavenging enzymes FeSOD and CAT showed a mar-
bonyl compound scavengers, aldo-keto reductases (AKR1), ginally greater increase in wheat than in the cultivar Apo,
Plant Phenomics 11

Table 2: Effects of gradual imposition of drought stress on physiological parameters of two rice cultivars (IR64 and Apo) and one wheat
cultivar (Weebill) (Experiment 2A). Gradual drought stress was imposed at 15 DAS using an automated irrigation and plant phenotyping
platform. Physiological parameters like relative water content (RWC), total chlorophyll, malondialdehyde (MDA), and total proline were
measured at 100% FC and 45% FC conditions. ¥Significant difference between rice cultivars (IR64 and Apo) in the induction treatment at
p ≤ 0:05. ∗ Significant difference between tolerant rice cv. Apo and wheat cv. Weebill in the induction treatment at p ≤ 0:05.

 Rice Wheat
Parameters Treatment
 IR64 Apo Weebill
 100% FC 91:6 ± 2:4 93:4 ± 2:9 88:0 ± 0:9
RWC (%)
 45% FC 60:4 ± 5:4 62:5 ± 3:5 62:6 ± 1:2
 100% FC 0:8 ± 0:02 0:7 ± 0:06 1:3 ± 0:07
Total chlorophyll (mg/gFW)
 45% FC 0:6 ± 0:01 0:6 ± 0:06 1:0 ± 0:12
 100% FC 14:4 ± 1:8 63:1 ± 6:5 29:3 ± 3:4
MDA (μg/FW)
 45% FC 315:4 ± 3:7¥ 265:7 ± 6:9 247:0 ± 19:7∗
 100% FC 75:1 ± 24:1 76:2 ± 6:03 126 ± 5:3
Total proline (μg/gFW) ¥
 45% FC 396:4 ± 14:8 259:5 ± 24:4 408:4 ± 33:6

 3.5 marginally lower canopy temperature (Figure 6(b)). Signifi-
 ⁎
 3 cantly greater assimilation rate and stomatal conductance
 2.5 were maintained in wheat at both 100 and 45% FC than in
 Fold change

 2 rice cv. Apo (Figures 6(c) and 6(d)). Among rice cultivars,
 ¥ susceptible rice cv. IR64 exhibited significantly lower photo-
 1.5 ⁎
 ¥ synthetic rate and stomatal conductance at 45% FC. As a
 1 ¥
 0.5 ¥ ¥ ¥
 stress effect, the percent increase in MDA content was signif-
 icantly lower in wheat than in the drought-tolerant rice cv.
 0
 APX FeSOD CAT AKR BiP1 CRT1 P5CS Apo (Figure 6(e)). Of the rice cultivars, MDA content was
 –0.5
 significantly higher in cv. IR64 than in Apo at 45% FC. Total
 IR64 biomass was measured on 80 DAS; the percent reduction in
 Apo
 total biomass was least in the wheat cultivar Weebill, and it
 Weebill
 was highest in the rice cultivar IR64. Between the rice culti-
Figure 5: Real-time quantitative RT-PCR analysis for drought- vars, Apo maintained better carbon gain and hence more
responsive genes in cv. IR64 and cv. Apo (rice cultivars) and cv. biomass accumulation even under 45% FC (Figure 6(f)).
Weebill (wheat). The second leaf of 100% FC and 45% FC
treatments was used from experiment 2A. ¥Significant difference 4. Discussion
between rice cultivars (IR64 and Apo) in the induction treatment
at p ≤ 0:05. ∗ Significant difference between tolerant rice cv. Apo Plants have naturally evolved several mechanisms to survive
and wheat cv. Weebill in the induction treatment at p ≤ 0:05. under stressful conditions. A number of mechanisms have
 been ascribed to these survival strategies, which range from
 morphological traits associated with maintenance of tissue
there were no detectable differences in the activity of APX turgor to physiological mechanisms that help maintain
between wheat and the rice cultivar Apo. AKR1 showed sig- metabolism. Most of these traits are constitutively present
nificantly higher expression levels in wheat than in cv. Apo. and sometimes may also be responsive to stresses [4]. While
ER stress-responsive genes, CRT1 and BiP1, also showed these constitutive traits have been shown to provide stress
marginal increases in the transcript level in both tolerant rice adaptation, a set of traits, often referred to as “acquired” tol-
(Apo) and wheat (Weebill) cultivars (Figure 5). Fold change erance traits, also are known to provide significant levels of
in expression of P5CS was significantly higher in wheat com- tolerance to stresses. These acquired drought tolerance
pared to that in tolerant rice cv. Apo (Figure 5). mechanisms or traits are known to be upregulated or
 expressed only when the plants experience stress, unlike the
3.4. Higher Carbon Gain Helped Wheat to Maintain Higher constitutive traits. In natural conditions, most abiotic stresses
Growth Rates. At the same soil moisture level of 45% like drought and temperature progress gradually and plants
FC, both cereals had lower RWC compared to 100% FC would initially experience a mild level of stress and have an
(Figure 6(a)). The automated irrigation system maintained opportunity to trigger an acquired response [33]. It is well
the soil moisture status precisely and at the prescribed level documented that an array of genes is upregulated when
irrespective of differences in water mining (roots) and tran- plants experience a progressive stress and mechanisms regu-
spiration. Despite similar RWC, cv. Apo maintained a lower lated by these genes subsequently provide tolerance when the
canopy temperature at 45% FC compared to cv. IR64. How- stress aggravates and becomes severe [13, 14]. These acquired
ever, in comparison with tolerant rice cv. Apo, wheat had mechanisms are well documented for temperature tolerance
12 Plant Phenomics

 100 27.5

 27 ¥

 Canopy temperature (°C)
 90
 26.5
 80
 RWC (%)
 26
 70
 25.5
 60 25

 50 24.5

 40 24
 (a) (b)

 30 0.7
 Photosynthetic rate ( molm–2s–1)

 28
 0.6
 26
 ⁎
 24 0.5 ⁎

 gs (molm–2s–1)
 22 0.4
 20 ¥
 18 0.3
 16 ¥
 0.2
 14
 0.1
 12
 10 0
 (c) (d)

 140 35
 ¥ ¥
 in TBMover 100% FC

 120 30
 MDA ( g/gFW)

 100 ⁎ 25
 % reduction

 80 20
 60 15 ⁎
 40 10
 20 5
 0 0
 IR64 Apo Weebill IR64 Apo Weebill
 Rice Wheat Rice Wheat

 100% FC
 45%FC
 (e) (f)

Figure 6: Effect of gradual induction of moisture stress (45% FC) on morphophysiological parameters of IR64 and Apo (rice) and Weebill
(wheat) cultivars at the vegetative stage (35 DAS-experiment 2B). (a) Relative water content (RWC). (b) Canopy temperature. (c)
Photosynthetic rate. (d) Stomatal conductance (gs). (e) Malondialdehyde (MDA) content was measured during stress. (f) Biomass was
measured at 80 DAS and expressed as percent reduction in total biomass (TBM) over 100% FC. ¥Significant difference between rice
cultivars (IR64 and Apo) in the induction treatment at p ≤ 0:05. ∗ Significant difference between tolerant rice cv. Apo and wheat cv.
Weebill in the induction treatment at p ≤ 0:05.

[13, 34]. Studies have shown that seedlings of the induction Breeding programs predominantly selected genotypes
treatment had a higher recovery than those exposed directly with higher absolute yields under stress with the premise that
to the severe stress treatment. In an earlier study with diverse high yields under stress would result in an automatic selec-
rice genotypes, Raju et al. [9] reported that the genotypes that tion of acquired tolerance traits. Although this argument is
had better acquired tolerance (they referred to this trait as acceptable, there are significant genotypic and species varia-
cellular level tolerance) maintained higher spikelet fertility. tions in the mechanisms that govern acquired tolerance.
Thus, it can be visualised that a genotype that has a higher However there was not much research on understanding
propensity to respond to stress at the young seedling stage the component mechanisms leading to drought adaptation
would also reflect a higher level of tolerance to stress at later through acquired tolerance. The major aim of this investiga-
phenological stages as well [9]. tion was, therefore, to examine the variability in acquired
Plant Phenomics 13

tolerance levels between drought-susceptible (IR64) and in transpiration and water mining (Figure 1). Accordingly,
drought-tolerant (Apo) rice cultivars and a tolerant wheat both cereals showed similar leaf tissue water status at
cultivar (Weebill). Since wheat can sustain better growth 100% FC and at 45% FC irrespective of their differences
and productivity under water-limited conditions compared in leaf area and root traits (Table 2). This task could only
to rice, we aimed to understand the differences in the be achieved when the containers were irrigated very fre-
acquired tolerance levels between a wheat cultivar (Weebill) quently based on gravimetric determination of water loss.
and the two rice cultivars. The automated system was also equipped with a software-
 controlled stress imposition protocol that permitted the
4.1. Upregulation of Protective Mechanisms Helps in maintenance of a gradual water loss regime until the con-
Acquiring Better Tolerance in Induction Treatment. Captur- tainers reached the target of 45% FC from the well-watered
ing the variability in acquired traits or mechanisms depends status of 100% FC. To achieve this, the software commanded
on accurate phenotyping for the responses coupled with pre- the solenoid valves to dispense only a calculated fraction of
cise methods to impose induction and severe stress treat- the transpired water. This setup provided an excellent option
ments. Many compounds such as methyl viologen [23], to create gradual induction stress treatment before reaching a
DTT [34], NaCl [35], and Rose Bengal [36] have been used severe stress level.
to induce stress and capture genetic variability in stress Although tissue water status was similar in both cereals,
response. Most of these molecules as well as naturally occur- the reduction in total biomass was significantly different.
ring stresses are known to induce an oxidative burst through The rice variety IR64 recorded a higher tiller number in
the generation of reactive oxygen species (ROS). Oxidative 100% FC, and reduction due to stress was significantly
stress in turn induces membrane damage and inhibits most higher. Hence, differences in reduction of biomass were
metabolic activities, thereby leading to reduced growth rates. mainly due to the variability in acquired drought-tolerant
Therefore, to maintain the cellular homeostasis, it is essential mechanisms (Figure 4).
to either decrease the production of ROS or develop abilities
to effectively scavenge and ultimately detoxify the ROS by 4.3. Differences in ROS Balance and Carbon Assimilation
antioxidants or scavenging enzymes [4, 37]. Further, it is also Determine Growth under Stress. Imbalance between ROS
demonstrated that increases in such scavenging enzymes and production and scavenging leads to the generation of a class
antioxidants were high only when plants experienced mild of secondary radicals referred to as reactive carbonyl com-
induction treatment compared to plants exposed directly pounds (RCCs)through their reactions with lipids and pro-
to a severe stress treatment. Hence, rice seedlings directly teins [38, 39]. These RCCs undergo several modifications
exposed to the severe stress treatment did not show any with proteins by forming Schiff’s bases, Maillard products,
recovery growth (Figures 2 and 3). Therefore, it is plausi- and Amadori compounds. ROS-scavenging enzymes like
ble that variability in production and scavenging mecha- SOD and APX provide the first line of defence against
nisms would determine the susceptibility and tolerance oxidative stress. Similarly, RCC-scavenging enzymes like
mechanisms of a cultivar. In our study, the susceptible cul- aldo-keto reductases (AKR) catalyze the reduction of alde-
tivar IR64 showed higher ROS and RCC level damage with hydes and ketones to their respective alcohol using the
lower recovery growth in the induction treatment than the electrons from NADPH [26, 40]. Besides these ROS- and
tolerant cv. Apo. Although scavenging mechanisms were RCC-detoxifying strategies, plants have also developed
comparable between wheat cv. Weebill and tolerant rice mechanisms to overcome oxidative stress damage through
cv. Apo, the ROS levels were much lower for wheat, which protecting proteins through folding and unfolding mecha-
hence showed better recovery in the induction treatment nisms. A stress-responsive gene, BiP1, is involved in protein
(Table 1). Recovery hardly occurred after the direct severe folding and protection [34]. The other unfolded protein
stress treatment. pathway gene, CRT1, is known to bind to Ca2+ in ER and
 acts as a calcium buffer and helps in the folding of newly
4.2. Precise Maintenance of Soil Moisture Is Essential to synthesized proteins [34].
Capture ADT Traits. Lack of precise stress-imposing The rice cv. Apo had higher expression of these scaveng-
methods increased the difficulty in understanding these ing enzymes and unfolded protein response than cv. IR64
acquired mechanisms of stress response. The most critical (Figure 5) and hence showed lower ROS level and better
requirement in capturing genetic variability in acquired recovery growth. Although wheat is more tolerant than rice,
drought tolerance depends on the ability to maintain the a fold increase in expression of these scavenging enzymes
same levels of stress to plants irrespective of differences in and drought-responsive genes was only marginally higher
evapotranspiration. To capture the induction response, than that in the drought-tolerant rice cultivar Apo
the current study was done using a phenotyping platform (Figure 5). This could be due to lower levels of ROS produc-
with an automated irrigation facility that dispensed precise tion in wheat by reducing excess electron or a better quench-
volumes of water. The volume of water to be dispensed ing mechanism [41] or by better photochemistry with higher
was determined gravimetrically in real time, and the auto- carbon assimilatory capacity. With similar tissue water sta-
mated solenoid system dispenses water when the soil tus, higher photosynthetic rate and higher stomatal conduc-
moisture status decreased by 1% of the set field capacity. tance might be additional advantages for wheat to maintain
Thus, it was possible to precisely maintain the same level higher growth in stress conditions compared with the
of soil moisture in containers irrespective of differences drought-tolerant rice cv. Apo (Figure 6).
You can also read