Hydrothermal Depolymerization of Biorefinery Lignin-Rich Streams: Influence of Reaction Conditions and Catalytic Additives on the Organic Monomers ...
←
→
Page content transcription
If your browser does not render page correctly, please read the page content below
Article

Hydrothermal Depolymerization of Biorefinery
Lignin-Rich Streams: Influence of Reaction
Conditions and Catalytic Additives on the Organic
Monomers Yields in Biocrude and Aqueous Phase
Stefano Dell’Orco 1,2, Edoardo Miliotti 1, Giulia Lotti 1, Andrea Maria Rizzo 1, Luca Rosi 1,3 and
David Chiaramonti 1,4*
 1 RE-CORD, Viale Kennedy 182, Scarperia e San Piero, 50038 Florence, Italy;
 edoardo.miliotti@re-cord.org (E.M.); giulia.lotti@re-cord.org (G.L.);
 andreamaria.rizzo@re-cord.org (A.M.R.); luca.rosi@re-cord.org (L.R.)
 2 Department of Industrial Engineering, University of Florence, Viale Morgagni 40, 50135 Florence, Italy;

 stefano.dellorco@unifi.it
 3 Chemistry Department “Ugo Schiff”, University of Florence, Via della Lastruccia, 3-13,

 50019 Sesto Fiorentino, Florence, Italy
 4 “Galileo Ferraris” Energy Department, Polytechnic of Turin, Corso Duca degli Abruzzi 24,

 I-10129 Torino, Italy
 * Correspondence: david.chiaramonti@polito.it

 Received: 27 January 2019; Accepted: 3 March 2020; Published: 7 March 2020

 Abstract: Hydrothermal depolymerization of lignin-rich streams (LRS) from lignocellulosic ethanol
 was successfully carried out in a lab-scale batch reactors unit. A partial depolymerization into
 oligomers and monomers was achieved using subcritical water as reaction medium. The influence
 of temperature (300–350–370 °C) and time (5–10 minutes) was investigated to identify the optimal
 condition on the monomers yields in the lighter biocrude (BC1) and aqueous phase (AP) fractions,
 focusing on specific phenolic classes as well as carboxylic acids and alcohols. The effect of base
 catalyzed reactions (2–4 wt. % of KOH) was compared to the control tests as well as to acid-catalyzed
 reactions obtained with a biphasic medium of supercritical carbon dioxide (sCO2) and subcritical
 water. KOH addition resulted in enhanced overall depolymerization without showing a strong
 influence on the phenolic generation, whereas sCO2 demonstrated higher phenolic selectivity even
 though no effect was observed on the overall products mass yields. In conclusion, a comparison
 between two different biocrude collection procedures was carried out in order to understand how
 the selected chemical extraction mode influences the distribution of compounds between BC1 and
 AP.

 Keywords: Biorefinery; hydrothermal liquefaction; lignin stream recovery; lignin
 depolymerization; catalyzed liquefaction; supercritical carbon dioxide; biocrude and aqueous phase
 characterization; liquefaction conditions; biocrude solvent extraction

1. Introduction
 Lignin is one of the main constituents of lignocellulosic biomass, and making up to 15–35 wt. %
of the total organic matter weight, carrying also the highest specific energy content compared to
cellulose and hemicellulose [1–3]. The global amount of lignin estimated in the Earth’s surface is 300
billion tons and annually increases by around 20 billion tons [4]. Lignin separation from cellulose and
hemicellulose takes place extensively in the second generation lignocellulosic ethanol biorefineries

Energies 2020, 13, 1241; doi:10.3390/en13051241 www.mdpi.com/journal/energies

Energies 2020, 13, 1241 2 of 23

and pulp and papers industry [5]. In order to estimate the potential of lignin from lignocellulosic
ethanol biorefinery, an European study from E4 Tech [6] investigated scenarios for the growth of
biorefinery industry under a favorable supporting policy as the one foreseen by the Directive (EU)
2018/2001 of the European Parliament and of the Council of 11 December 2018 on the promotion of
the use of energy from renewable sources (in short Renewable Energy Directive - RED II). Future
scenario foresees a ramp up in Europe from one plant producing at commercial scale in 2017 to 46
plants in 2030. From 2022 to 2025, 3–4 new plants per year across Europe are expected, but from 2025
to 2030, this rate should increase to an average of 6–7 new plants commencing production annually.
Consequently, the amount of lignin co-product will considerably increase, rising the interests on its
conversion pathways to chemicals or fuels precursors, reducing CO2 emissions and the need for fossil
resources. For these reasons, the economic viability of future biorefineries will mostly depend on
efficient conversion of each biomass constituent, transforming both cellulose/hemicellulose and
lignin into value-added compounds.
 For decades the pulp industry has been converting lignocellulosic materials into valuable fibers
and products [7]. Second-generation biomass conversion technologies are nowadays able to produce
renewable chemicals and biofuels only from the cellulose and hemicellulose fraction at commercial
scale. However, due to its aromatic structure, lignin has unique properties that makes this material a
highly interesting biopolymer for further processing [8]. Lignin-rich streams (LRS) from
lignocellulosic ethanol contain high amount of water (60–70 wt. %) [9] making the material suitable
for hydrothermal liquefaction (HTL) as first-step for product valorization. Among other
thermochemical conversion strategies, HTL is a process recommended for wet biomass: the reactions
are generally carried out in water at 280–370 °C and between 10 and 25 MPa. At these conditions, the
water is in its subcritical state and the dielectric constant of water decreases; thus, behaving like a
non-polar organic solvent breaking structural links of the biomass matrix. In these physical
conditions it also has enhanced acidity donating protons to molecules, impacting the decomposition
process [10]. The main HTL reaction products are biocrude, char, water-soluble substances, and gas
(mostly CO2). Efforts have already been made to convert lignin feedstocks into valuable products
through liquefaction. Lignin from paper and pulp industries (Kraft lignin) have been depolymerized
by Yuan et al. [11] at 220–300 °C in a water-ethanol medium with NaOH as catalyst and phenol as
capping agent, observing a decrement in the products molecular weight distribution, optimized at
260 °C and 3 h of residence time. On the other hand, Nguyen et al. [12] studied the effect of higher
temperature (290–370 °C) on Kraft lignin liquefaction in subcritical water using ZrO2/K2CO3 as
catalysts and phenol as the co-solvent, characterizing the composition of the aqueous phase and the
biocrude at different temperature levels and catalyst load. Regarding lignin from lignocellulosic
ethanol, the conversion into valuable products through HTL has been investigated by other authors
in the past. Jensen et al. [13] investigated the conversion of enzymatic hydrolysis lignin, focusing in
how plant species and pretreatment severity affect the HTL product composition and lignin
depolymerization. Katahira et al. [14] investigated base catalyzed lignin depolymerization from five
different feedstocks, evaluating product composition after 40 min of reaction time, varying reaction
temperature (270–300–330 °C) and amount of alkaline additive. Nielsen et al. [15], studied batch
liquefaction of lignin from enzymatic hydrolysis in supercritical ethanol by varying reaction
temperature (250–450 °C), reaction time (0–8 h), and solvent:lignin ratio (0–40 g in 100 ml), in absence
of catalysts.
 In addition, the effect of KOH was evaluated, highlighting how the liquefaction conversion is
influenced. A variation of initial pH, with the addition of KOH, have already been demonstrated as
an effective method to optimize the depolymerization of Kraft lignin by Belkheiri et al. [16]. In this
study, its effect has been evaluated on a different type of lignin that was found to generate a higher
acidity in the aqueous product, thus finding always a low pH in the residual aqueous phase
regardless of the initial amount of KOH. On the other hand, the effect of an acid reaction environment
has been tested with the use of supercritical CO2 (sCO2). Indeed, concentrated carbon dioxide is
always produced in large amount during sugars fermentation: theoretically, 1 mol of glucose yields
2 mol of ethanol and 2 mol of CO2, and the worldwide carbon dioxide emission due to first and second
Energies 2020, 13, 1241 3 of 23

generation ethanol fermentation plants was estimated to be 49.8 Mt [17,18]. Some efforts have been
made to capture and store CO2 in order to further reduce the carbon footprint of the technology
through bio-energy with carbon capture and storage (BECCS) technologies as, differently to fossil
fuels, the CO2 produced in ethanol plants came from renewable sources and its capture would
determine a net atmospheric carbon removal [17,19]. Furthermore, the use of CO2 at its supercritical
state has been extensively investigated as selective solvent for phenolic compounds separation and
extraction [20–23]. Moreover, Numan-Al-Mobin [24] converted alkali lignin using a mixture of
subcritical water and supercritical carbon dioxide, varying temperature (250, 300, and 350 °C) and
water-to-sCO2 ratio (1:5, 1:2, 1:1, and 2:1) showing an enhanced yield of specific phenolic compounds
and suggesting a conversion mechanism driven by the heterogeneous acid catalytic activity of the
dissolved CO2. In another study, Chan et al. [25] studied the effect of supercritical carbon dioxide on
the liquefaction of palm kernel shell, suggesting an improved biocrude yield at lower temperature
due to the higher CO2 dissolution in water enhancing the protons availability in the water medium.
In the present work, the measured products yield and the selectivity towards phenolic species have
been evaluated at 300 °C, comparing the results to the ones observed in uncatalyzed and base
catalyzed reactions.
 In a perspective of industrial applications, HTL should ideally target high yield, minimization
of reaction time and the increasing in solid load of the processed slurry. For these reasons, in a
previously published manuscript [26], the authors suggested how the HTL conditions can be tuned
to optimize the process in term of biocrude mass yield testing in a batch-reactor unit, short residence
time (5–10 min) and two level of solid load (10–20 wt. % of dry biomass to water ratio, B/W). In
addition, the B/W ratio influence to the process was found to be not statistically significant in regards
to the light biocrude mass yield and in this work, it was chosen to analyze the results from
experiments with 10 wt. % B/W. These previous results suggested different ways for process
optimization, affecting the characteristics and the amount of produced biocrude. Thus, to further
improve the understanding of HTL-based conversion of lignin-rich stream, the present work intends
to add specific know-how on the influence of several reaction conditions in subcritical water such as
temperature, residence time, base or acid catalyzed reactions, focusing on the monomeric
composition of the liquid products. A critical characterization of the HTL products is here presented,
showing how valuable monomers from the LRS conversion can be optimized in terms of yield and
how the reaction conditions affect the depolymerization process and products.

2. Materials and Methods

2.1. Feedstock Characterization
 Lignin-rich material was obtained from an industrial demo-scale lignocellulosic ethanol plant
after ethanol distillation and water mechanical separation. The original biomass feedstock used in
the ethanol biorefinery was hardwood, specifically poplar. Carbon, hydrogen, nitrogen, and sulfur
(CHN-S) content was quantified using a Leco (St. Joseph, MI, USA) TruSpec (UNI EN 15104, ASTM
D4239) and oxygen was obtained by difference. LRS moisture, ash content and volatile matter were
determined in a Leco TGA 701 (UNI EN 13040, UNI EN 14775, UNI EN 15148) and fixed carbon was
calculated by difference. The feedstock was further characterized after mixing solid particles of lignin
with water for the slurry preparation, quantifying the water-soluble compounds in a LC–20 AT
Prominence (Shimadzu, Kyoto, Japan) prior to the hydrothermal reactions. The HPLC apparatus is
equipped with a refractive index detector, a Hi-Plex H column 300 x 7.7 mm and a guard column PL
Hi-Plex H 50 x 7.7 mm (Agilent, Santa Clara, CA, USA), operating at 55 °C with a flow of 0.6 mL min−1
with 0.005 M sulfuric acid as mobile phase. Moreover the percentage of lignin and structural sugars
were determined accordingly to the NREL/TP–510–42618 procedure [27].

2.2. Microreactors Test Bench for Screening Reaction Conditions
 Biocrude and aqueous phase samples from hydrothermal liquefaction were obtained in a
custom-made Micro-Reactor Test Bench (MRTB) described in previous publications [26,28]. In brief,
Energies 2020, 13, 1241 4 of 23

prior to experiments a slurry sample was prepared stirring dried feedstock in ultrapure water (0.055
μS cm−1) at the desired biomass-to-water mass ratio. For each test, 33 g of slurry were inserted into a
43 mL stainless steel reactor. A leakage test was performed with argon pressurized at 8 MPa before
purging the system with nitrogen (0.5 MPa). An initial pressure of 3 MPa was set using argon and
the reactor was afterwards immersed into a fluidized sand bath previously heated at the requested
temperature. Evaluation of residence time started when the temperature in the reactor reached 2 °C
below the set temperature, the reactor was then rapidly cooled by immersion into a water bath.
 Two biocrude fractions were always recovered at the end of each test by separating them from
the residual aqueous phase through a double-step diethyl-ether (#32203-M Merck/Sigma-Aldrich)
and acetone (#32201-M Merck/Sigma-Aldrich) extraction procedure (Procedure 1), carried out at
ambient temperature. First, the reactor was washed with diethyl-ether (DEE), vacuum filtering the
content over a Whatman glass microfiber filter (1 μm). Water and water-soluble organics (WSO) were
then recovered by gravity separation, while DEE-soluble fraction (lighter biocrude, BC1) was
obtained after rotary evaporation of DEE at reduced pressure. Finally, the reactor walls and the solids
were washed with acetone (DMK) recovering a second biocrude fraction (BC2) and separating the
solid residues (SR). A scheme representing the solvent extraction is depicted in Figure 1. Furthermore,
a second and different procedure (Procedure 2) was also tested to evaluate the influence of the
extraction method on compounds distribution. Here the aqueous phase was recovered before the
solvent extraction step.

 Figure 1. Extraction procedure for hydrothermal liquefaction (HTL) products recovery (Procedure
 1).

 For the additional tests with CO2, an overall molar ratio of 2.68% molCO2/molH2O was inserted
in the reactor at 3 MPa and 25 °C, substituting the Ar used for the uncatalyzed reactions and, at this
initial condition, 1.83% molCO2/molH2O were dissolved into water.
Energies 2020, 13, 1241 5 of 23

2.3. Hydrothermal Reaction Conditions
 The experimental campaign was first carried out by varying the reaction severity through
temperature and residence time regulations. The ranges of reaction parameters were chosen within
typical industrially viable limits. Residence time ranged respectively from 5 to 10 min and 10 wt. %
of B/W, while three values were investigated for reaction temperature, 300–350–370 °C. The effect of
base catalyzed reactions at 300 and 350 °C was also evaluated by adding KOH in a percentage of 2
wt. % and 4 wt. % relative to dry lignin sample. Hydrothermal reactions were also tested in the
presence of an acid environment using supercritical CO2 at 300 °C and the effect evaluated in
comparison with KOH and in absence of catalysts.

2.4. Characterization of Liquid Products
 Each hydrothermal liquefaction experiment was replicated at least two times. The aqueous
phase (AP) was analyzed by quantifying the WSO content in HPLC. Before the injection, aqueous
samples (25 μL) were first filtered through a 0.2 μm pore size syringe filters and quantitative analysis
was carried out after a five levels calibration for each compound. Moreover, total organic carbon
(TOC) analyses were carried out on aqueous phases samples by a TOC Cell Test Spectroquant® 14879
(Merck) test kit and a Shimadzu UV-1800 spectrophotometer (605 nm). A Merck TR320 thermoreactor
was used to heat the samples for 2 h at 120 °C and then cooled for 1 h in a test tube rack until reaching
room temperature. The correction due to DEE contamination is reported in authors’ previous work
[26]. Qualitative and quantitative analysis of BC1 samples were carried out into a GC-MS apparatus:
0.1 g of BC1 samples were first dissolved in 10 ml of isopropanol and 2 μL of the solution were
injected in a GC 2010 with a GCMS-QP2010 mass spectrometer (Shimadzu, Kyoto, Japan). The gas
chromatograph was equipped with ZB-5 MS column (Phenomenex, Torrance, California, USA): 30 m
length, 0.25 mm internal diameter and 0.25 μm film diameter . The temperature was initially set at 40
°C for 10 min, increased first to 200 °C (heating rate 8 °C min−1, holding time 10 min) and then to 280
°C (heating rate 10 °C min−1, holding time 30 min). Spectral interpretation was performed with NIST
17 database and the quantification was carried out through a 4-point calibration using o-terphenyl as
internal standard. A complete list of calibrated compounds for GC-MS and HPLC quantification is
given in Table S1 contained in the supporting information. In both the adopted analytical methods,
the compounds detected below 25 % of the lowest calibration point concentration were considered
as below limit of quantification and not taken in account. In addition, a comparison between the
molecular weight (polystyrene equivalent) of the light and heavy biocrudes obtained by KOH-
catalyzed reactions were evaluated by gel permeation chromatography (GPC). Tetrahydrofuran
(THF) was used to dissolve biocrude samples, leaving the solution overnight. The solution was
syringe-filtered at 0.45 μm and 100 μL were injected in an HPLC apparatus (Shimadzu LC 20 AT
Prominence) with two in-series columns (Agilent, PL gel 5 μm 100 Å 300 x 7.5 mm), a guard column
(Agilent, PL gel 5 μm 50 x 7.5 mm) a refractive index detector. The flow of the eluent (THF, 1 mL
min−1) was kept at 40 °C. Calibration was carried out with linear polystyrene standards (Agilent, 370–
9960 g mol−1).
 The quantitative results were further referred to the dry feedstock mass, calculating the yields
according to the equations below:
 = , + , (1)

 , ∙ , ∙
 , = ∙ 100 ; , = ∙ 100 (2)
 , ,
 Where Yx is the total yield of a x compound as sum of yields in BC1 (YBC1,x) and water soluble
organics (WSO) in the aqueous phase (YWSO,x). While CGC,x and CHPLC,x are the concentrations in μg
mL−1 obtained in GC-MS and HPLC multiplied for the respective volumes of each phase (vGC and
vHPLC). ml,db represents the mass of feedstock in dry basis employed in each experiment.
Energies 2020, 13, 1241 6 of 23

 NMR analyses were carried out on BC1 and BC2 samples. Moreover, 1H NMR spectra were
recorded with a INOVA NMR 400 (Varian, Palo Alto, CA, USA) using dimethylsulfoxide-d6 as
solvent. Spectra were referenced to tetramethyl-silane. Solvent suppression was employed to record
the spectra.

3. Results and Discussion
 The hydrothermal conversion of LRS resulted in the generation of five main products: DEE-
soluble biocrude (BC1), DMK-soluble biocrude (BC2), aqueous phase (AP) with water-soluble
organics (WSO), char or solid residue (SR) and gases. The solvent extraction procedure was employed
to maximize the recovery of biocrude fractions. In another work [26] the authors reported the results
of the uncatalyzed experimental campaign only in terms of yields, elemental analysis and molecular
weight: here, a detailed characterization of BC1 and AP was carried out to observe how the
mechanism of lignin depolymerization is influenced by reaction conditions.
 A detailed list of the resulting mass yields is presented in Table S2. The analyzed compounds
were grouped in these chemical classes: Phenol (considered as a single compound), Methoxyphenols,
Dimethoxyphenols, Catechols, Methoxycatechols, Phenolic Ketones, Phenolic Aldehydes, Acids, and
Alcohols.

3.1. Lignin-Rich Stream Characterization
 The lignin-rich feedstock was received in form of wet agglomerated particles with 69.7 wt. % of
moisture content; therefore, it was dried, knife-milled, and sieved to < 0.25 mm prior to be used in
the experiments. Carbon, hydrogen, nitrogen, and sulfur (CHN-S) and proximate analysis indicated
the dry based composition to be 54.2 wt. % carbon, 5.9 wt. % hydrogen, 1.0 wt. % nitrogen, 0.2 wt. %
sulfur, 36.1 wt. % oxygen (by difference), and 2.6 wt. % ash. Volatile matter and fixed carbon resulted
to be respectively 71.0 wt. % d.b. and 26.4 wt. % d.b. The lignin content of the feedstock, together with
its residual structural sugars is reported in Table 1 and the data are in good agreement with similar
feedstock from enzymatic hydrolysis of lignocellulosic biomass investigated by Jensen et al. [13].

 Table 1. Lignin and sugars content in LRS.

 Parameter Value [-] wt. % (d.a.f.)
 Acid insoluble lignin 52.7 ± 4.99
 Acid soluble lignin 0.253 ± 0.0216
 Total lignin 53.0 ± 5.02
 Structural sugars 35.8 ± 0.314
 Glucan 30.7 ± 0.484
 XMG* 4.94 ± 0.170
 Arabinan 0.163 ± 0.0287
 * Xylan, Mannan, Galactan

 The slurry of LRS in water was prepared at 10 wt. % of biomass to water ratio (B/W). The initial
aqueous fraction of lignin-rich slurry was analyzed in HPLC to characterize the water-soluble content
prior to the hydrothermal reactions, discriminating the compounds that were soluble at ambient
conditions from those produced during the hydrothermal treatment. The total water-soluble HPLC-
detectable content was about 4–5 wt. % (d.b.). The results, depicted in Figure S1 in the supporting
information, showed the presence of a small percentage of dissolved sugars such as glucose and
xylose-mannose-galactose (XMG) as well as glycerol, acetic and lactic acid. Lactic acid was the most
abundant compound, deriving from bacterial contamination in the fermentation process. Indeed,
lactic acid bacteria, which produces also acetic acid, can survive to typical fermentation conditions
and represent the most common bacterial species found in ethanol facilities [29]. On the other hand,
glycerol is known to be one byproduct of bioethanol production performed by yeasts, such as
Saccharomyces cerevisiae, under aerobic and anaerobic growth condition [30].
Energies 2020, 13, 1241 7 of 23

3.2. Analysis of HTL Products
 Typical chromatograms from GC-MS of BC1 and HPLC of AP are shown Figure 2 and Figure 3,
respectively, showing also chemical structures of the most present compounds. Moreover, Table S3
provides a complete light biocrude qualitative characterization with classes subdivisions for the same
sample. HPLC chromatogram in Figure 3 depicts only the fraction of chromatogram containing
organic acids and alcohols; however, this method was used to quantify also some phenolic
compounds retained in the AP (Phenol; Phenol, 2-methoxy-; Phenol, 2,6-dimethoxy-; Phenol, 2-
methoxy-4-methyl-; 1,2 Benzenediol and 1,2-Benzenediol, 3-methoxy-). A complete list of detected
and quantified compounds in BC1 and AP is given in Table S4 and Table S5, respectively in the Excel
supporting information file.
 The degradation of the main biomass constituents under hydrothermal conditions have been
extensively studied and reviewed [31,32]. The lignin three-dimensional matrix results from the
interaction of three main aromatic structures (monolignols) named coniferyl, sinapyl, and p-
coumaryl alcohols, which yielded aromatics constituents: guaiacyl (G), syringyl (S), and p-
hydroxyphenyl (H) units. These monolignols are linked together in the polymeric structure through
many different bonds such as ether (β-O-4, α-O-4, and 4-O-5) and C–C (β-β, β-5, and β-1) bonds
[33,34]. During hydrothermal conversion reactions, the chemical bonds of the branched aromatic
polymeric structure of lignin are broken to form phenolic monomers such as phenol,
methoxyphenols, alkylphenols, dimethoxyphenols, catechols, methoxycatechols, phenolic
aldehydes, and phenolic ketones [12,35,36]. In previous studies, it was observed that the ether bonds
are more easily broken than C-C bonds, and this is the main depolymerization mechanism occurring
in absence of catalyzed reactions [37]. The results from the present study confirmed that the reaction
products from hydrothermal conversion maintains the aromatic rings, while the substituent groups
have different trends depending on reaction conditions. Indeed, in absence of catalysts, the main
reaction occurring in aqueous environment at subcritical condition is known to be hydrolysis.
Moreover, also, fragmentation and repolymerization occur during the liquefaction reaction
mechanisms. Primary depolymerization products found in BC1 were Phenol, 2-methoxy (guaiacol)
and Phenol, 2,6-dimethoxy- (syringol) coming from the thermal cleavage of guaiacyl and syringyl
units as identified in peaks 5 and 10 in the GC-MS chromatogram in Figure 2. In addition, model
compounds studies [38,39] showed that secondary reactions lead to the formation of catechol (peak
7), methoxycatechol (peak 8) and phenol (peak 4) through demethylation and demethoxylation
giving rise to the methanol content in the AP, as detected through HPLC (Figure 3). Other lignin
degradation products, which were detected by GC-MS, as reported in Table S3 of the supporting
information, are phenolic aldehydes and ketones, especially: Syringaldehyde (Benzaldehyde,4-
hydroxy-3,5-dimethoxy-), Vanillin (Benzaldehyde,4-hydroxy-3-methoxy-), Acetovanillone
(Ethanone,1-(3-hydroxy-4-methoxyphenyl)-), and Acetosyringone (Ethanone, 1-(4-hydroxy-3,5-
dimethoxyphenyl)-). Due to the polarity of most of these compounds, a fraction of the oxygenated
aromatic substances (mostly phenol, guaiacol, and syringol) was also found trapped in AP after the
solvent extraction procedure.
Energies 2020, 13, 1241 8 of 23

 .

 Figure 2. Typical GC-MS chromatogram for BC1 fraction obtained at 350 °C, 10 min, 10% biomass to
 water ratio. 1. Acetic acid, 2. Propanoic acid, 3. 1.2-Cyclopenten-1-one, 2-methyl-, 4. Phenol, 5. Phenol,
 2-methoxy-, 6. Phenol, 2-methoxy-4-methyl-, 7. 1,2-Benzenediol, 8. 1,2-Benzenediol, 3-methoxy-, 9.
 Phenol, 4-ethyl-2-methoxy-, 10. Phenol, 2,6-dimethoxy-, 11. Phenol, 2,6-dimethoxy-4-methyl-, 12.
 Benzene, 1,2,3-trimethoxy-5-methyl-, 13. Homosyringaldehyde, 14. Syringylacetone, 15. o-Terphenyl
 (Internal Standard).

 The polysaccharides contained in the feedstock adopted for lignocellulosic ethanol production
were already subject to depolymerization during hydrolytic pretreatment in the ethanol production
process (steam explosion and enzymatic hydrolysis), right before fermentation [40,41]. In HTL,
cellulose, hemicellulose, and derived sugars (e.g., glucose or fructose) are mainly converted into
organic acids, alcohols and ketones during hydrolysis reaction [42–44]. As known, acid and alcohols
have higher affinity with water and therefore were mostly found in the aqueous phase, as reported
in the HPLC chromatogram of the residual aqueous phase in Figure 3. Acetic acid and formic acids
are formed by degradation of glucose in alkaline and neutral conversion. Even though acetic and
lactic acid can potentially be produced during hydrothermal reactions, they were also already found
in the feedstock slurry thus meaning that they were mainly produced and dissolved in water during
ethanol fermentation in the upstream production plant and not only during hydrothermal reactions
[40,45]. It was also confirmed that reaction of sugars in hydrothermal media leads to the generation
of cyclic ketones (e.g. cyclopentenones) and their alkylated forms, as already proposed in literature
[46].
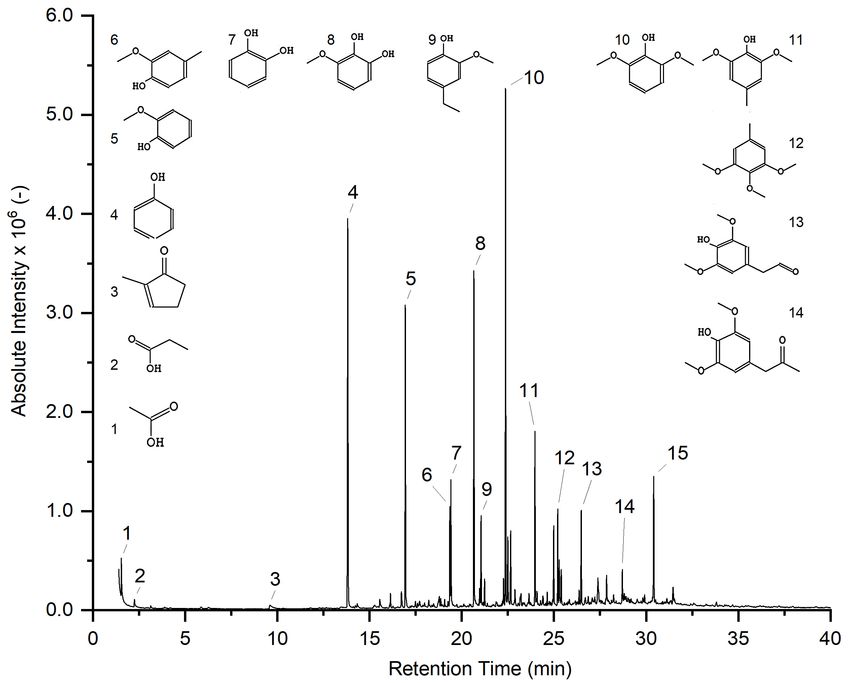
Energies 2020, 13, 1241 9 of 23

 4 5

 25
 3

 2 3
 6
 20

 2
 Absolute Intensity 103 (-)

 7
 15

 1

 10
 4 6
 7

 5
 1
 5

 0

 10 12 14 16 18 20 22 24
 Retention Time (min)

 Figure 3. Typical partial HPLC chromatogram for water-soluble organics (WSO) in aqueous phase
 (AP) fraction obtained at 350 °C, 10 min, 10% biomass to water ratio. 1. Succinic acid, 2. Glycolic acid,
 3. Lactic acid, 4. Glycerol, 5. Glutaric acid, 6. Acetic acid, 7. Methanol.

 It was not possible to analyze heavy molecular weight compounds comprised in BC2 using GC-
MS or HPLC. The heavier fraction still contains oligolignols generated in the first depolymerization
steps as well as repolymerization of lignin fractions [47]. Thus, we were unable to characterize the
composition of BC2 with these analytical techniques, but representative infra-red spectra and
molecular weight-average distributions of BC1 and BC2 were already given in a previous work [26],
showing similarities with the lignin feedstock and demonstrating the higher average molecular
weight of BC2, ranging from 1030 to 1400 g mol−1. Therefore, BC2 was supposed to be completely
composed by lignin-oligomers not converted to lighter compounds (e.g., phenolic monomers). Here,
to further characterize the biocrudes, 1H NMR analysis was carried out on BC1 and BC2 derived from
reaction at 370 °C and 5 min of residence time, comparing the resulting spectra with literature data.
1H NMR spectra reported in Figure 4 show typical depolymerized lignin signals in light and heavy

biocrude fractions [11,48–51]. The signals in the 8–10 ppm region, ascribable to phenolic OH [48,49],
are slightly visible only in BC1 and probably due to the cleavage of the β-O-4 bonds. The region
between 6–8 ppm indicates the aromatic protons and unsaturated aliphatic bonds (C=C) signals
typical of the lignin oligomers and primary lignin monomeric units, confirming the aromatic ring
and β-double bonds preservation in both BC1 and BC2 samples [48,50]. Both biocrude fractions also
denote the presence of peaks in chemical-shift range 3-4 ppm related to methoxy groups (−OCH3) as
confirmed by literature data [52,53]. The 1.5–3 ppm protons are typically assigned to -CH3 and -CH2-
bonded to aromatic structures [54] and signals are visible in both fractions. In the 0.5–1.5 ppm region,
aliphatic protons typical of methyl and methylene groups are more defined in BC2, suggesting an
ineffective hydrolysis of C-C lignin bonds [37,52]. To sum up, 1H NMR confirmed the incomplete
depolymerization of lignin structures and no conspicuous differences were found in the functional
groups of the two biocrudes due to the similar nature of the structural oligolignols constituents.
Energies 2020, 13, 1241 10 of 23

 Figure 4. 1H NMR spectra for DEE-soluble biocrude (BC1) and DMK-soluble biocrude (BC2) from
 test at 370 °C and 5 min.

 In the next sections, the trend of detected monomeric LRS-derived fractions in function of the
reaction conditions will be analyzed to further characterize the hydrothermal depolymerization
process.

3.3. Hydrothermal Liquefaction in Absence of Catalysts: Influence of Temperature and Time
 The results from hydrothermal liquefaction of lignin-rich streams shows an effective
depolymerization into more valuable products, even in absence of catalyzed reaction. These results
have been used to optimize the process conditions prior to test the effect of catalytic additives.
 The effect of temperature in non-catalytic condition was evaluated carrying out HTL tests at 300
–350–370 °C with 5 minutes of residence time and 10 wt. % of B/W. Yields of compounds versus dry
feedstock, evaluated according to Equation 1, are shown in Figure 5. First, higher temperatures
enhance the production of aromatic monomers from lignin. Catechols content linearly increased and
their methoxylated forms were almost absent at low temperature, appearing only at 350 °C. Similar
trends were observed for methoxyphenols, dimethoxyphenols, and phenol. However, a lower or
absent increment-rate at temperature between 350–370 °C was noticed. Moreover, the yield of
phenolic carbonyls zeroed passing from 300 °C to 350 °C, suggesting the high reactivity of the
carbonyl substituent that leads to the formation of simpler monomers. The same effect was observed
for cyclopentenones.
Energies 2020, 13, 1241 11 of 23

 1.20%
 300 °C-5 min-10 wt.% B/W
 350 °C-5 min-10 wt.% B/W
 a
 1.00%
 370 °C-5 min-10 wt.% B/W
 Yield on feed [wt.%]

 0.80%

 0.60%

 0.40%

 0.20%

 0.00%

 s

 ls
 ls

 s
 ol
 ol

 ol

 no
 ho

 en
 h

 en

 he
 ec

 ec

 Ph

 ph
 at

 at

 yp
 xy
 C

 c

 ox
 xy

 ho

 h
 ho

 et
 et
 et

 im
 M
 M

 D
 7.00% 0.30%
 b c
 6.00% 0.25%
 Yield on feed [wt.%]

 5.00%
 0.20%
 4.00%
 0.15%
 3.00%
 0.10%
 2.00%
 1.00% 0.05%

 0.00% 0.00%
 es

 ls
 s

 ls
 id

 ny
 ho

 on
 Ac

 bo
 co

 en

 ar
 Al

 nt

 C
 pe

 ic
 lo

 ol
 yc

 en
 C

 Ph

 Figure 5. Effect of reaction temperature on yields of quantified compounds for uncatalyzed HTL tests:
 (a) phenolics, (b) acids and alcohols, (c) phenolic carbonyls and cyclopentenones. When no graph
 column is depicted, the concentration was below quantification limits.

 It was also observed that an increment in the reaction temperature caused a considerably high
decrement in the acids yield, from 6 wt. % at 300 °C to less than 4 wt. % at 370 °C. This is mainly due
to the degradation of lactic acid while acetic and glycolic acid formation remained more stable, as
depicted in Figure 6a. In addition, the difference plot in Figure 6b shows a comparison between the
acids already contained in the initial slurry at ambient conditions and the acids content after the
reaction. Glycolic acid was always generated during liquefaction reactions as it was not identified in
the initial slurry. Acetic acid instead was partially produced, while lactic acid was always cracked
during the conversion process and it was not generated during the reactions. The rate of lactic acid
degradation increased at higher temperature and, as other authors suggests [55], the fragmentation
reaction forms mainly light gases like CO, CO2, and CH4. The gas yield was theoretically evaluated
from initial and final reactor pressure, by assuming only CO2 as gaseous specie and by considering
the ideal gas law; results are reported in Table S2. Benzoic acid has a similar trend as phenolic
carbonyls compounds, and its presence in the resulting liquids was reduced at higher temperature
(Figure 6a). The analysis on the AP showed that the alcohols produced are mainly methanol and
glycerol. Methanol content seemed to be highly influenced by the temperature (Figure 6a) while
glycerol, already presents in the LRS slurry, was cracked during the reactions (Figure 6b). As
explained before, the effect of higher temperature in the reaction zone promotes the
depolymerization of the lignin structures, including the loss of the methoxy group from the
fragmentation of the methoxyphenols and dimethoxyphenols. The availability of free methoxy
substituents in the subcritical environment gives rise to the formation of methanol through
demethylation reactions. This mechanism is enhanced by temperature: an increase in reaction
temperature leads to higher rate of formation of free radicals from lignin cracking, as the formation
Energies 2020, 13, 1241 12 of 23

of methoxyphenolic compounds raised together with the enhanced cracking into catechols and
phenol. To sum up, the reaction temperature had a strong effect on BC1 monomers and WSO yield,
especially in the range 300–350 °C. Moreover, even though moving close to critical condition, i.e., 370
°C, could have a positive effect on depolymerization and WSO reduction (see mass yields in Table
S2), the overall process costs would increase in a scale-up perspective. For this reason, a temperature
of 350 °C was selected in the following experiments, where the influence of residence time was
evaluated.

 4.0%
 300 °C-5 min-10 wt.% B/W a
 350 °C-5 min-10 wt.% B/W
 370 °C-5 min-10 wt.% B/W
 3.0%
 Yield on feed [wt.%]

 2.0%

 1.0%

 0.0%
 id
 id

 id

 id

 l

 ol
 ro
 ac

 an
 ac

 ac

 ac

 ce

 h
 lic
 ic

 ic

 c

 ly

 et
 oi
 et

 ct

 G
 co

 M
 nz
 La
 Ac

 ly

 Be
 G

 1.0%

 0.5%
 Yield difference [wt.%]

 0.0%

 -0.5%

 -1.0%
 b
 -1.5%
 id

 id

 l
 ro
 ac

 ac

 ce
 ic

 ic

 ly
 et

 ct

 G
 La
 Ac

 Figure 6. (a) Effect of reaction temperature on yields of specific acids and alcohols species; (b)
 difference plot for acids degradation versus formation compared to the initial acids content in the
 lignin-rich streams (LRS) slurry for uncatalyzed HTL tests.

 The reaction mechanisms of the HTL process also depends on the residence time of the feedstock
at the reaction condition with water at subcritical state. The latter is indeed a very important
parameter and should be kept as low as possible, as in a continuous scaled-up perspective, it
influences the size of the reactor and, consequently, the throughput of the plant. Moreover, other
studies [56,57] already reported that an increment in the residence time would favor condensation
and repolymerization reactions increasing the yield of heavy biocrude and solid residues. Thus, a fast
Energies 2020, 13, 1241 13 of 23

cooling step is needed to quench the reactions and partially avoids further polymerization of lignin
intermediates. Therefore, in agreement with literature, we decided to investigate rather short
residence times, from 5 to 10 minutes at 350 °C (Figure 7). As also found by other authors [58,59] ,
during HTL reactions in subcritical water, methoxylated phenols cleavage rate increases with
reaction time, leading to a higher amount of catechols in the product (e.g., 1,2 Benzenediol from
Phenol, 2-methoxy-). In agreement with them, in this work, a small increment in the yields of
catechols and methoxycatechols was observed together with a reduction of methoxyphenols yields
in the range 5–10 minutes. Phenol yield was reduced at higher time due to the fact that catechols
formation is always the preferred reaction route from methoxyphenols cleavage in subcritical water
conditions, meaning that phenols undergo to substitution reactions more rapidly than catechols [60].
Regarding the acids content in the liquid products, a higher residence time slightly reduced the
overall yield due to the enhanced cracking rate, leading to the formation of light gases, as confirmed
by the gas yield increase from 4.5 to 5.5 wt. % (see Table S2. This is due to the enhanced cracking of
lactic acid from the feed and to the degradation of the produced acetic and glycolic acids. The
generation of alcohols remained constants, probably due to an equilibrium between the cleavage of
alcohols functional group from lignin cracking and the consequent enhanced volatilization. The
phenolic carbonyls completely crack with higher reaction time, meaning that a complete hydrolysis
of the carbonyl substituent groups is achieved in the investigated residence time.

 1.20%
 350 °C-5 min-10 wt.% B/W
 350 °C-10 min-10 wt.% B/W
 a
 1.00%
 Yield on feed [wt.%]

 0.80%

 0.60%

 0.40%

 0.20%

 0.00%
 s

 s

 s

 ls
 ol
 ol
 ol

 ol

 no
 en
 ch

 ch

 en

 he
 Ph
 te
 e

 ph
 at

 yp
 ca

 y
 C

 ox
 ox
 xy

 h
 h
 ho

 et
 et
 et

 im
 M
 M

 D

 7.00% 0.30%
 b c
 6.00% 0.25%
 Yield on feed [wt.%]

 5.00%
 0.20%
 4.00%
 0.15%
 3.00%
 0.10%
 2.00%
 1.00% 0.05%

 0.00% 0.00%
 s

 ls
 s

 ls

 ne
 id

 ny
 ho
 Ac

 o

 bo
 co

 en

 ar
 Al

 nt

 C
 pe

 ic
 lo

 ol
 yc

 en
 C

 Ph

 Figure 7. Effect of residence time on yields of quantified compounds for uncatalyzed HTL tests: (a)
 phenolics, (b) acids and alcohols, (c) phenolic carbonyls and cyclopentenones. When no graph column
 is depicted, the concentration was below quantification limits.

3.4. Influence of Catalytic Additives in the Process
 The effect of additives with catalytic effect was evaluated as a method to improve the
liquefaction process. First, base catalyzed reactions were carried out by varying the reaction
Energies 2020, 13, 1241 14 of 23

temperature and comparing the results to those obtained in absence of alkaline hydroxides catalysts.
In addition, the catalytic effect of supercritical carbon dioxide (sCO2) was tested comparing the effect
at lower reaction temperature, substituting the Ar inside of the tubular reactor.

3.4.1. Effect of pH Control Using Strong Basis
 Base catalyzed depolymerization was realized adding KOH in the slurry mixture, at 2 and 4 wt.
% of KOH to LRS ratio dry basis, obtaining an initial slurry pH of 8.0 and 10.0 respectively, doubling
the baseline value as reported in Table 2.

 Table 2. pH values of feed and products with and without KOH. Test performed at 350 °C, 5 min,
 and 10 wt. % biomass to water ratio (B/W).

 Stream pH of Control pH @ 2 wt. % KOH pH @ 4 wt. % KOH
 feed 4.6 8.0 10.0
 AP 4.4 5.1 5.8

 When reactions occurred in alkaline condition, the overall biocrude mass yield (BC1 + BC2),
measured by weighting each resulting phase, increased at lower temperature (300 °C) from 48.8 wt.
% to 55.3 wt. % when 2 wt. % of KOH was used, as summarized in Table 3. On the contrary, increasing
the reaction temperature to 350 °C the total biocrude mass yield was reduced from 59.0 wt. % in
absence of KOH to 54.0 wt. % and 53.2 wt. % when 2 wt. % and 4 wt. % of KOH where tested
respectively. A further increment in the temperature (370 °C) confirmed the same trend. However,
high initial pH had an overall positive effect increasing on lighter biocrude fraction (BC1) resulting
in higher mass yields at each temperature tested. On the other hand, heavier BC2 yield was always
reduced, especially in the range 350–370 °C. Hence, although the total biocrude yield was found
decreased in basic conditions, higher amount of lighter lignin-derived compound was measured.
Moreover the WSO content in the residual AP increased when final higher pH was achieved, in
agreement with Belkheiri et al. [16]. TOC analysis (corrected subtracting the carbon contained in the
water-dissolved DEE), reported in Table 4 shows an increment in the concentration of soluble
organics in residual AP. At 350 °C the carbon concentration of WSO varied from 6648 to 8823 and
10,981 mg l−1 increasing the initial slurry pH from 4.6 to 8 and 10 respectively. Similar effects were
observed also at 370 °C. Moreover, as can be deduced from Table 4, the WSO carbon concentration,
calculated from HPLC detectable data, diverge from the TOC value when higher depolymerization
rate is reached, (i.e., at higher temperature and in alkaline conditions) and this is probably due to the
higher concentration of undetected oligomeric compounds.

 Table 3. Effect of base catalyzed reaction increasing KOH to LRS ratio from 2 wt. % to 4 wt. % at 300–
 350–370 °C, 5 min and 10 wt. % B/W: mass yields of light biocrude (BC1), heavy biocrude (BC2), solid
 residues (SR), Gas, and water-soluble organics (WSO) + loss. Absolute standard deviation is reported
 in brackets.

 Temp. KOH
 BC1 BC2 SR Gas WSO + Loss*
 [°C] [%]
 - 9.8% (1.6%) 38.8% (11.5%) 16.5% (3.0%) 2.4% (0.7%) 32.6% (10.5%)
 300
 2 18.8% (0.7%) 36.5% (2.6%) 13.5% (0.7%) 2.2% (n.d.) 29.0% (2.6%)
 - 27.0% (6.7%) 32.0% (6.4%) 11.4% (0.9%) 4.5% (0.8%) 23.8% (5.4%)
 350 2 37.0% (1.4%) 17.0% (0.5%) 10.2% (0.7%) 4.4% (0.6%) 31.3% (1.1%)
 4 35.5% (2.1%) 17.7% (1.4%) 9.3% (0.5%) 2.2% (0.3%) 35.4% (0.6%)
 - 36.8% (1.7%) 15.8% (3.1%) 13.0% (0.9%) 4.0% (0.1%) 30.3% (2.3%)
 370
 2 39.2% (0.5%) 9.7% (1.9%) 12.3% (0.0%) 4.3% (0.1%) 34.5% (2.0%)
 * calculated by difference, n.d.: not determined.
Energies 2020, 13, 1241 15 of 23

 Table 4. Total organic carbon (TOC) concentration of WSO, influence of KOH at 300–350–370 °C.
 Compared to carbon concentration calculated by HPLC detected compounds. Test performed at 5
 min and 10 wt. % B/W.

 TOC –
 Temp. KOH [wt. C – HPLC Detected WSO Concentration
 Concentration [mg
 [°C] %] [mg l−1]
 l−1]
 - 4741 3405
 300
 2 5310 3859
 - 6648 3186
 350 2 8823 3337
 4 10,981 4707
 - 5937 5608
 370
 2 8692 4513

 Molecular weight (or molar mass) was evaluated by gel permeation chromatography (GPC) and
the average results for BC1, BC2 and the total biocrude (BC tot) were compared with KOH-catalyzed
tests at 300 °C and 350 °C (Figure 8). The Mw of the total biocrude was determined as a yield-based
weight-average from that of BC1 and BC2. The strong alkaline environment improved BC1 yield over
BC2, consequently the resulting BC2 molecular mass increases. These results are in accordance with
the fact that the increased rate of depolymerization leads to higher quantity of BC1 leaving in BC2
only heavier compounds. A confirmation can be found observing the total biocrude molecular mass
(line in Figure 8) that it is always reduced when KOH is used. Therefore, an increment in the amount
of KOH from 2 wt. % to 4 wt. % resulted in a higher depolymerization rate as confirmed by lower
BC2 yields, plus a reduction of the total biocrude average molecular weight.

 1500 BC1
 Average molecular weight [g mol-1]

 BC2
 1250 BC tot.

 1000

 750

 500

 250

 0
 H

 H
 W

 H

 W

 KO

 KO
 KO
 B/

 B/
 t.%

 t.%

 t.%

 t.%
 t.%
 w

 w

 w

 w
 w
 0

 0

 -2

 -4
 -2
 ,1

 ,1

 W

 W
 W
 in

 in

 B/

 B/
 B/
 m

 m

 t.%

 t.%
 t.%
 ,5

 ,5
 °C

 °C

 w

 w
 w

 0

 0
 0
 0

 0
 ,1

 ,1

 ,1
 30

 35
 in

 in

 in
 m

 m

 m
 ,5

 ,5
 ,5

 °C

 °C
 °C
 0

 0

 0
 30

 35

 35

 Figure 8. Effect of base catalyzed reaction, increasing KOH to LRS ratio from 2 wt. % to 4 wt. %:
 average molecular weight of BC1, BC2, and total biocrude. Error bars represent absolute standard
 deviation.
Energies 2020, 13, 1241 16 of 23

 Looking at the monomeric compounds production, the results in term of yield of detected
compounds are summarized in Figure 9 at constant reaction temperature (350 °C), time (5 min) and
B/W (10 wt. %). Increasing the pH of the initial slurry solution from 4.6 to 8.0, corresponding to an
increment from no KOH to 2 wt. % of KOH to LRS ratio, a slight enhancement in the formation of
phenolics species was observed, especially the methoxylated forms (i.e. methoxyphenols and
dimethoxyphenols). Phenol yields were slightly increased with 2 wt. % of KOH but decreased again
adding more KOH in the slurry. Regarding the catechols, the yield remained almost constant
increasing the pH of the slurry but methoxycatechols yield was enhanced. The average acids yield
was not significantly affected by the basic environment. Indeed, an increase of pH negatively affected
the cracking of lactic acid, thus increasing its yield from 1.84 wt. % to 2.60 wt. % while the generation
of glycolic acid was inhibited from 1.73 wt. % to 1.22 wt. % when initial slurry pH was 4.6 and 10.0
respectively. Alcohols production increases by adding higher amount of KOH, due to the already
discussed effect on the overall enhanced depolymerization rate. In other words, the increment in BC1
yields can be correlated to the formation of a higher amount of methanol due to the demethylation
and demethylation of the methoxy groups during the cleavage of the lignin methoxyaromatic
building blocks. As regards to phenolic carbonyls species, the presence of base catalyzed reaction
reduced the presence of this compound class below instruments calibration limits, meaning that the
carbonyl branches were cracked to form other phenolic monomers (e.g., methoxyphenols) during
catalyzed hydrolysis reactions.

 1.20%
 350 °C-5 min-10 wt.% B/W
 350 °C-5 min-10 wt.% B/W-2 wt.% KOH
 a
 1.00%
 350 °C-5 min-10 wt.% B/W-4 wt.% KOH
 Yield on feed [wt.%]

 0.80%

 0.60%

 0.40%

 0.20%

 0.00%
 ls

 ls

 s
 ol

 s
 ol

 ol
 ho
 ho

 en

 en
 en
 ec
 ec

 Ph

 ph
 ph
 t
 at

 ca

 xy
 xy
 C

 y

 ho
 ho
 ox

 et
 et
 h
 et

 im
 M
 M

 D

 7.00% 0.30%
 b c
 6.00% 0.25%
 Yield on feed [wt.%]

 5.00%
 0.20%
 4.00%
 0.15%
 3.00%
 0.10%
 2.00%
 1.00% 0.05%

 0.00% 0.00%
 s

 s
 s

 ls

 ne

 l
 id

 ny
 ho
 Ac

 no

 bo
 co

 te

 ar
 Al

 n

 C
 pe

 ic
 lo

 ol
 yc

 en
 C

 Ph

 Figure 9. Effect of base catalyzed reactions increasing KOH to LRS ratio from 2 wt. % to 4 wt. % on
 yields of quantified compounds: (a) phenolics, (b) acids, and alcohols, (c) phenolic carbonyls and
 cyclopentenones. When no graph column is depicted, the concentration was below quantification
 limits.
Energies 2020, 13, 1241 17 of 23

3.4.2. Effect of Supercritical CO2
 The effect of supercritical CO2 was tested in a biphasic mixture together with subcritical water
in order to investigate the selectivity of specific monomers during the depolymerization of the
biorefinery lignin-rich material. Other previous literature works demonstrated that sCO2 can be used
to enhance the selectivity towards the formation of specific phenolic compounds such as guaiacol
during the depolymerization of alkali lignin [61]. Carbon dioxide become supercritical above 31.1 °C
and 7.39 MPa and its catalytic effect was evaluated in an HTL experiment carried out at 300 °C, 5 min
residence time and 10 wt. % B/W. As in the reference experiment, with inert Ar atmosphere, the
reactor was initially pressurized at 3 MPa, but the maximum obtained pressure (8 MPa) was lower of
about 5 MPa, denoting higher dissolution rate of CO2 compared to Ar. At the considered reaction
temperature the percentages of dissolved moles of CO2 increased, reaching a theoretical value of 2.9
molCO2/molH2O as other author suggests [61–63]. In this work the effect of CO2 was evaluated in
comparison to the results obtained in absence of catalysts and with KOH base catalyzed
depolymerization. The results showed that, compared to the uncatalyzed case, the light biocrude
yield increased, but the other mass yields were only slightly affected by the presence of supercritical
carbon dioxide, meaning that the overall depolymerization rate is not influenced by the presence of
sCO2, as summarized in Table 5.

 Table 5. Effect of CO2 acid catalyzed reaction compared to base catalyzed and control test at 300 °C, 5
 min and 10 wt. % B/W: mass yields of BC1, BC2, SR, Gas, and WSO + loss. Absolute standard deviation
 is reported in brackets.

 Temp.
 Catalyst BC1 BC2 SR Gas WSO + Loss*
 [°C]
 9.8% 16.5% 2.4%
 300 - 38.8% (11.5%) 32.6% (10.5%)
 (1.6%) (3.0%) (0.7%)
 18.8% 36.5% 13.5% 2.2% 29.0%
 300 2 wt. % KOH
 (0.7%) (2.6%) (0.7%) (n.d.) (2.6%)
 15.5% 38.1% 16.2% 3.3%
 300 sCO2 26.9% (2.56%)
 (5.0%) (8.2%) (0.7%) (n.d.)
 * calculated by difference, n.d.: not determined.

 Even though the mass of depolymerized material was almost constant, the synergetic effect of
sCO2 together with subcritical water was highlighted by an enhanced generation of phenol,
methoxyphenols and dimethoxyphenols compared to the results in absence of catalysts, as reported
in Figure 10. Similar catalytic effect has been explained by Numan-Al-Mobin et al. [24], observing
that sCO2 in hydrothermal medium acts like acid homogeneous catalyst promoting the selectivity
towards phenolic compounds. Compared to other homogeneous catalysts, the use of fluids at
supercritical state with catalytic effects, like carbon dioxide, reduces the mass transportation
limitations due to diffusivity and lower density that permits a higher penetration in the feedstock’s
pores. As a result, in our study, the phenolics yields obtained with supercritical carbon dioxide at 300
°C (1.10 wt. %) was comparable to the yields achieved in absence of catalyst or with 2 wt. % of KOH
at higher reaction temperature (350 °C). Catechols and methoxycatechols yields were not affected by
the presence of sCO2, confirming the catalytic selectivity towards monohydroxy benzenes species
(e.g., phenol, methoxyphenols and dimethoxyphenols), as also confirmed by the larger presence of
phenolic carbonyls (mostly vanillin and syringaldehyde) in the liquid products. However, the
methanol yield remained unvaried, therefore demethylation was not enhanced by the presence of
sCO2, confirming a stable depolymerization efficiency at 300 °C compared to the control test. In
addition, a higher yield of cyclopentenones (e.g. 1,2-Cyclopentanedione, 3-methyl-) was observed
when sCO2 was injected in the process, this is probably due to an effective repolymerization or
cracking inhibition of also sugars-derived compounds.
Energies 2020, 13, 1241 18 of 23

 1.20%
 350 °C-5 min-10 wt.% B/W
 350 °C-5 min-10 wt.% B/W-2 wt.% KOH
 a
 1.00%
 300 °C-5 min-10 wt.% B/W-CO2
 Yield on feed [wt.%]

 0.80%

 0.60%

 0.40%

 0.20%

 0.00%
 ls

 ls

 s
 ol

 s
 ol

 ol
 ho
 ho

 en

 en
 en
 ec
 ec

 Ph

 ph
 ph
 t
 at

 ca

 xy
 xy
 C

 y

 ho
 ho
 ox

 et
 et
 h
 et

 im
 M
 M

 D
 7.00% 0.40%
 b c
 6.00% 0.35%
 Yield on feed [wt.%]

 0.30%
 5.00%
 0.25%
 4.00%
 0.20%
 3.00%
 0.15%
 2.00% 0.10%
 1.00% 0.05%
 0.00% 0.00%
 s

 s
 s

 ls

 ne

 l
 id

 ny
 ho
 Ac

 no

 bo
 co

 te

 ar
 Al

 n

 C
 pe

 ic
 lo

 ol
 yc

 en
 C

 Ph

 Figure 10. Effect of CO2 acid catalyzed reaction compared to base catalyzed and blank tests on yields
 of quantified compounds: (a) phenolics, (b) acids and alcohols, (c) phenolic carbonyls, and
 cyclopentenones. When no graph column is depicted, the concentration was below quantification
 limits quantification limits.

3.5. Compound Distribution among HTL Fractions: Influence of Biocrude Extraction Procedures
 In the previous sections a detailed discussion on the depolymerization of LRS in subcritical
water, with and without the use of heterogeneous catalysts, has been presented without considering
how the detected compounds are distributed among the resulting fractions. It is important to note
that the products collection procedure have a strong effect on the detectable organic content of both
BC1 and AP, due to differences in the sample composition analyzed. Complex chemical and
thermodynamic equilibrium reactions are involved during the solvent extraction due to the presence
of a multitude of different organic compounds in the aqueous, oily and solid HTL products. The use
of a procedure rather than the other can have more than one justification. In this lab-scale work,
Procedure 1 (described in Figure 1) was chosen to maximize the organic collection in the biocrude
but, at larger scale, there could be the possibility to directly separate the oily fraction from the
aqueous solution only with physical techniques (e.g., centrifugation or gravimetric separation). For
this reason, a different test at the same HTL conditions (350 °C, 10 min, 10 wt. % B/W, no catalysts)
was carried out recovering the aqueous solution directly after the reaction removing the DEE-
extraction step on the aqueous phase (Procedure 2). The whole data set discussed before was obtained
using the Procedure 1. With this method, the solvent (DEE) was directly put in contact with the HTL
liquid and solid products, therefore maximizing the organic extraction in the BC1. As depicted in
Figure 11, substantial differences in the product distribution have been identified when the aqueous
solution was collected prior to the DEE extraction (Procedure 2). In this case, the solvent was not able
to recover part of the organics in the biocrude, leaving some molecules in the AP as WSO.
Energies 2020, 13, 1241 19 of 23

 AP
 o l
 en BC1
 Ph
 s
 ol
 en
 y ph
 ox

 s
 ol
 h
 et

 ch
 M

 a te
 yc

 ls
 x

 o
 ho

 en
 et

 ph
 M

 xy

 ls
 ho

 ho
 et

 ec
 im

 at
 D

 C

 ls
 ho
 co
 Al

 s
 id
 Ac

 0 20 40 60 80 100 0 20 40 60 80 100
 Procedure 1 - Normalized wt.% on sample Procedure 2 - Normalized wt.% on sample

 Figure 11. Influence of collection procedures on organic compounds distribution among BC1 and AP
 fractions. Tests performed at 350 °C, 10 min, 10 wt. % B/W in absence of catalysts.

 As regards the normalized distributions in Figure 11, the collection of phenolics in the BC1 is
highly reduced (about 20–30 %) when Procedure 2 was tested. Same results were observed for the
methoxycatechols, whereas the catechols (mostly 1,2 benzenediol) remained totally trapped in the
AP without getting recovered as DEE-soluble. Part of the carboxylic acids were recovered as DEE-
soluble with Procedure 1 (mostly acetic acid) but when the aqueous phase was recovered directly
after the reactions, the whole acid content remained in the AP, given the high affinity with water. On
the other hand, the collection methodology did not have any effect on the alcohols distribution since
the solvent was not able to extract these compounds. Thus, the collection procedure must be carefully
considered for adequate comparisons of results as well as for the implementation of these types of
procedures in an industrial scale-up perspective. Moreover, the implication of different extraction
procedures will impact on possible downstream aqueous phase valorization steps such as aqueous
phase reforming [64] or other valorization routes for chemicals extraction [65,66].

4. Conclusions
 Lignin-rich streams (LRS) from a demo-scale lignocellulosic ethanol plant was successfully
depolymerized in subcritical water varying three main process parameters, such as temperature,
time, as well as introducing KOH and sCO2 as catalysts for process optimization. Even though
temperature was found to be the most influent parameter increasing the LRS depolymerization
efficacy at the experimental conditions investigated in this work, the effect of time and B/W was
evaluated in order to observe differences in the detected monomeric products yields into BC1 and
AP. Regarding residence time, 5 minutes were sufficient for lignin and sugars cleavage in subcritical
water, while the increase to 10 minutes eventually promoted substitution and repolymerization
reactions, leading to a reduction in methoxyphenols contents while keeping constant the catechols
content. Temperature was demonstrated to play a fundamental role in the hydrothermal reaction
mechanisms, and a T increase from 300 to 370 °C caused an enhanced phenolic monomer content in
BC1 and AP, together with a reduction of AP acids content. However, increasing the temperature
closer to water critical point (374 °C, 22 MPa) will also increase the CAPEX of a scaled plant, due to
higher equipment costs related to materials resistance at these severe operation conditions, however
at sufficiently high pH of the liquid medium the corrosion effects on metals will be reduced. Thus,
the use of an alkaline slurry solution is a preferable route at higher temperature [67]. Moreover, the
use of KOH as alkaline homogeneous catalyst resulted in an improved overall LRS depolymerization,
You can also read