A GIS Multi-Criteria Analysis Tool for a Low-Cost, Preliminary Evaluation of Wetland Effectiveness for Nutrient Buffering at Watershed Scale: The ...
←
→
Page content transcription
If your browser does not render page correctly, please read the page content below

water
Article
A GIS Multi-Criteria Analysis Tool for a Low-Cost,
Preliminary Evaluation of Wetland Effectiveness for
Nutrient Buffering at Watershed Scale: The Case
Study of Grand River, Ontario, Canada
Angelos Alamanos 1,2, *         and George Papaioannou 3
 1   Water Forum, Dundalk Institute of Technology, Marshes Upper, Dundalk Co., A91K584 Louth, Ireland
 2   The Water Institute, University of Waterloo, Waterloo, ON N2L3G1, Canada
 3   Institute of Marine Biological Resources and Inland Waters, Hellenic Centre for Marine Research,
     19013 Anavyssos Attikis, Greece; gpapaioan@hcmr.gr
 *   Correspondence: angalamanos@gmail.com

 Received: 18 October 2020; Accepted: 7 November 2020; Published: 9 November 2020

 Abstract: One significant concern of Ontario’s water quality management is the reduction in nutrient
 export. Decision makers have considered nature-based solutions, such as wetlands, depending on
 their cost-effectiveness for nutrient filtering. All wetland ecosystems interact with the surrounding
 environment; however, their performances are not always known, which prevents a fair comparison
 with other treatment alternatives. This study presents a methodological approach for mapping areas
 that can potentially support effective (or ineffective) wetlands for nutrient buffering. The Grand
 River watershed, Ontario was selected to demonstrate the methodology. Geographic Information
 Systems (GIS) are combined with multi-criteria analysis (MCA) to evaluate wetland effectiveness
 under geomorphological, climatological, hydrological, and land use factors. The selected factor
 maps (criteria) are normalized, and then used as inputs in an analytical hierarchy process (AHP)
 and weighted by experts based on how these factors affect wetlands’ performance. The promising
 areas’ spatial distributions are the output, which is compared with previous studies’ mappings
 of nutrient concentrations in the watershed. The proposed tool provides a low-cost preliminary
 estimation that informs policymakers if wetland solutions could achieve the desired environmental
 goals. This methodological approach supports Canadian wetland conservation efforts and enables a
 more complete decision-making process.

 Keywords: multi-criteria analysis tool; water quality; wetland effectiveness; phosphorus;
 Grand River watershed; Ontario Canada

1. Introduction
     Deteriorating water quality is one of Canada’s main water resource management issues, especially
in Ontario. Lake Erie’s eutrophication and the accompanying economic consequences have led
to phosphorous reduction oriented environmental policy, considering a plethora of measures and
practices [1,2]. These measures basically include wastewater treatment plants, land use changes,
environmentally friendly agricultural practices, and nature-based solutions (wetlands, buffering
zones, etc.). The nature-based solutions (and mainly wetlands) are a significant environmental
component, providing multiple ecosystem services (ES) (e.g., stormwater retention, nutrient filtering,
climate stability, flora and fauna, soil improvement, etc.) [3]. One of the causes of increased
nutrient runoff is the conversion of wetland areas into (more profitable) farmland [4]. Subsequently,
the importance of wetland preservation and restoration has been increasingly highlighted by provincial

Water 2020, 12, 3134; doi:10.3390/w12113134                                    www.mdpi.com/journal/water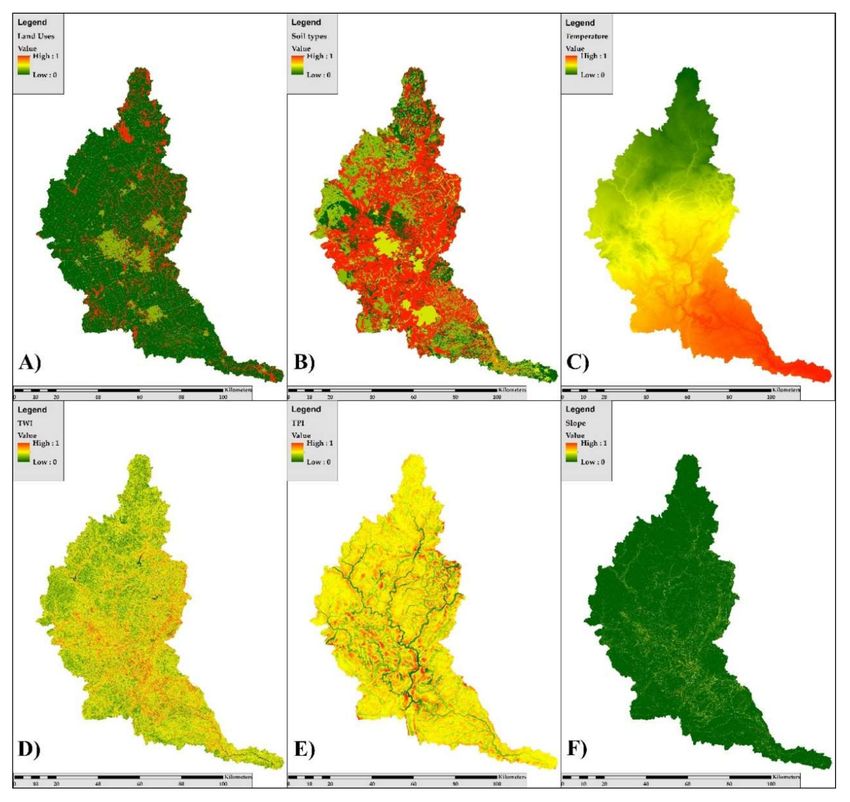
Water 2020, 12, 3134                                                                                 2 of 14

and federal governments in the last decades [1]. However, wetland areas have continued to be lost,
while more wastewater treatment plants have been built, but without tackling non-point farming
pollution [1,2].
      Although practices for improving surface water quality are more or less known, it is difficult to
have the same basis of comparison with equal certainty with respect to the implementation of the most
appropriate practices. More specifically, a wastewater plant’s performance can be known from a design
study (e.g., x% reduction in phosphorous loads), but this is not the case for wetlands. A wetland’s
performance for nutrient filtering depends on various factors (physical, geomorphological, hydrological,
climatological, vegetation, soil, surrounding land uses, inflows, initial concentrations, connectivity with
other water bodies, groundwater recharge, etc.) [5]. Therefore, an interdisciplinary and case-specific
study is required to give policymakers a proxy of a wetland’s performance. This process is very rarely
followed because it is time-consuming, costly, and it demands specialized knowledge. This is justified
by the fact that there is a lack of such studies in Canadian literature [5].
      At this point, our research question is, “Is it possible to provide a low-cost, fast, preliminary
estimation of wetland performances, covering most of the factors that determine it, in order to provide
policymakers with more info on such solutions?” To answer this question, we propose a novel approach,
based on the following classic techniques: Geographic Information Systems (GIS) are used to map
the factors that affect wetland effectiveness, combined with multi-criteria analysis (MCA) (to assign
weights to these factors), and produce a map with classified wetland potential performances. This has
been a challenging task worldwide, tied with computational challenges and uncertainties, as the
different factors (data) and the ways they interact are a complex dynamic system, which cannot be
validated [6]. The attempt to map the result of the complex process of nutrient filtering by wetlands
is a novel element, valuable for water quality management. The use of classic techniques makes
the tool easily replicable for analysts, however, not necessarily academics. The sentence should be:
The methodology is demonstrated at the Grand River watershed, Ontario, that directly runoffs to
Lake Erie. The watershed scale of the analysis facilitates the extent of data usage, covers the broader
ecosystem in which wetlands are a function, makes their interaction more comprehensive, and is in
line with nutrient reduction goals that refer to the outlet of the watershed.
      The integration of MCA into GIS applications has been demonstrated for eco-environmental
quality, vulnerability, and pollution [7–15]; however, to our knowledge (and after a comprehensive
literature review), this is the first application in Canada, and the first timed it has been implemented
for a spatial evaluation of wetland effectiveness. Knowing each solution’s performance is essential
when select a policy strategy, rather than just following traditional (but not always adequate) least-cost
approaches. Thus, the proposed framework is an important step towards the following: (a) achieving
a more complete decision-making process, (b) supporting Canadian wetland conservation efforts,
through providing insights on a more efficient wetland-farmland allocation policy based on its
estimation results, (c) filling this wetland-related knowledge gap, and (d) encouraging more studies on
wetlands’ potential to reduce nutrient concentrations in Canada.

2. Study Area
      The Grand River watershed in southwestern Ontario is an area of 6800 km2 . Grand River and
its tributaries flow into Lake Erie. The watershed’s climate is moderate to cool temperate, with four
seasons, characterized by rainy-snowy winters and hot-humid summers. There are various geological
schemes in the area that create different hydrologic conditions. The northern part, which consists of
till plains, and the Haldimand Clay Plain in the southern part create high surface runoff and limited
infiltration [16]. On the contrary, the watershed’s central part consists of moraines and sand/gravel
remnants of glaciers that facilitate infiltration while surface runoff is low [17]. The topography is
mainly flat (Figure 1A) and with pervious soils. The main soil types in the watershed are Perth (9.4%),
Huron (7.8%), Guelph (5.9%), Burford (4.1%), and Brantford (4.1%) [17]. According to the digital
elevation model (DEM) [18], the elevation ranges from +173 m (south) to +535 m (north). According to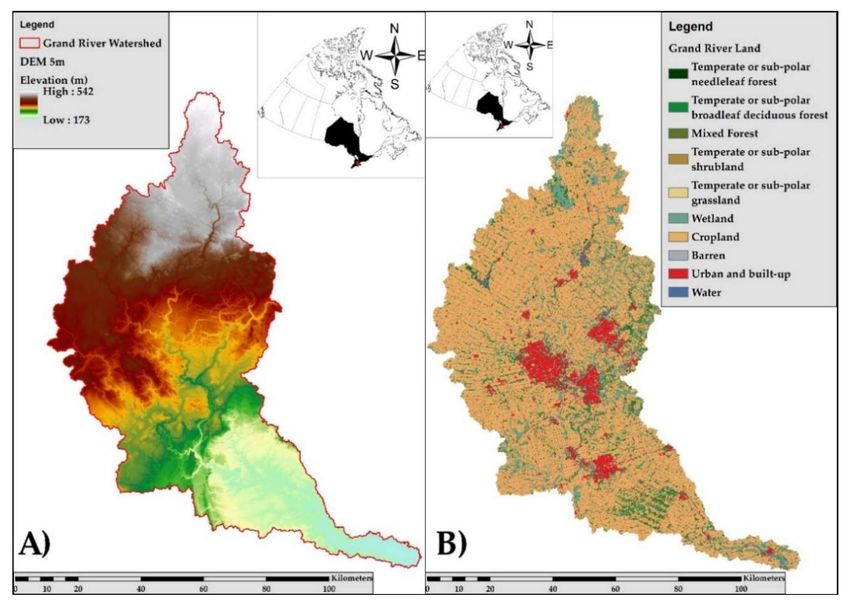
Water 2020, 12, 3134                                                                               3 of 14

the Canada Centre for Remote Sensing land cover data [19], the main uses include cropland (48%),
grassland (21%), forest (16%), pastures (8%), urban (5%), open water surfaces (1.5%), and transportation
(0.5%). The following three main reasons contribute to the increased nutrient (especially phosphorus)
contamination and runoff from the Grand River watershed to Lake Erie:

•     The watershed’s population is approximately 1,000,000 residents, concentrated in the central
      region and its surroundings (i.e., the cities of Kitchener-Waterloo area, Cambridge, Guelph,
      and Brantford), and it is continuously growing.
•     The intensification of farming activities in the rest of the watershed leads to qualitative and
      quantitative water resources degradation. Non-point (and point) pollution sources are the most
      significant challenges, especially regarding phosphorus and nitrogen concentrations [1,2].
•     As shown in Figure 1B, there are still several wetland complexes, i.e., Luther Marsh covers 30 km2
      in the north, Horseshoe Moraine covers 50 km2 of groundwater fed wetlands, Brisbane Swamp
      contributes to the Eramosa River in the Guelph Drumlin Field, Beverly Swamp covers 20 km2 in the
      southeast, as well as the Keldon and Amaranth Source Areas, and Roseville Swamp [17]. However,
      the Grand River watershed has lost almost 70% of its historical wetlands. This percentage exceeds
      85% in some areas, leaving less than 10% of wetland area, which is the threshold for a watershed
      to be considered ”healthy” [17].

                       Figure 1. Grand River watershed (A) elevation map and (B) land cover map.

     In this study we try to put together the data of factors affecting the potential of wetlands to
treat nutrients, and develop an objective evaluation of their performance, specifically for the Grand
River watershed.

3. Methodology
    The proposed tool uses factors that can play a role in a wetland’s ability to reduce nutrient
concentrations, as criteria in an MCA model. Weights (priority values) were assigned to them,
according to their importance. The result was used to produce a map (wetland effectiveness rating),
given the (weighted) normalized spatial distributions of these factors’ criteria. The following sections
analyze these steps.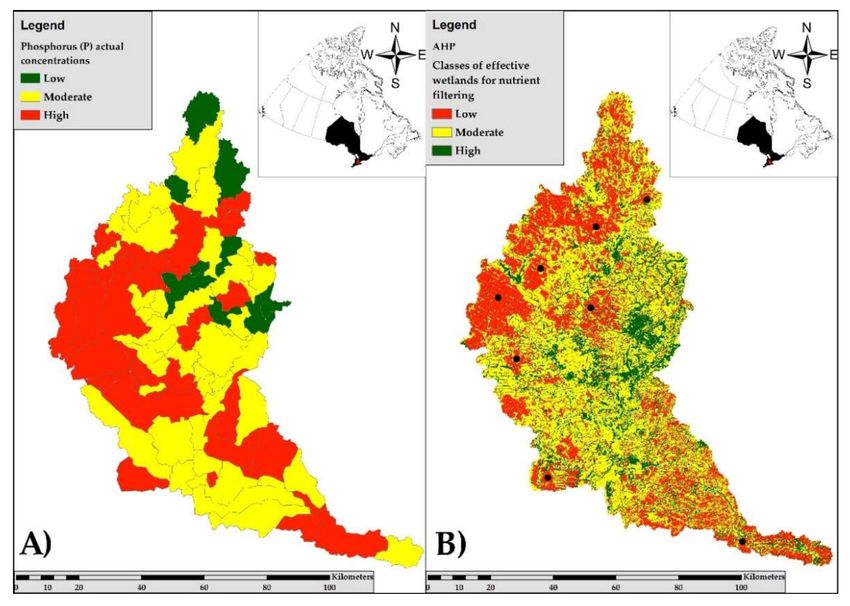
Water 2020, 12, 3134                                                                                   4 of 14

3.1. Selecting Criteria
     In order to assist policymaking to consider if the path towards nature-based solutions (i.e., wetland
restoration and preservation) is cost-effective, the aspects of filtering effectiveness and costs should be
examined. A recent Canadian review detected more studies on associated costs than effectiveness,
because of the involvement of case-specific and non-comparable factors [5]. In our previous review,
only a few studies included information about these wetland-specific factors; no study mentioned
or commented on all of the factors, while most studies estimated effectivenesses based on expert
judgment [5]. We list all the factors used in the past to support effectiveness estimates, as well as those
that made estimations difficult, made each study case specific, and prevented more general assessment,
according to each study reviewed, as follows:
•    Scale differences of existing Canadian studies, i.e., unit of reference of system (e.g., wetlands,
     watersheds, only outflows, etc.) [20,21].
•    Different purposes of studies (e.g., different periods of measurements, monitoring, design,
     restoration, case-specific characteristics, different needs expectations from wetlands, etc.) [22].
•    Different methods followed by researchers and how they estimated effectiveness (e.g., where the
     export was measured, seasonality, if phosphorus concentration was the main purpose or just
     additional estimations, etc.) [23,24].
•    Specific features that define how nutrient reduction is achieved, i.e., wetland type and age of operation
     (or being active/inactive), average depth, length, sediment/soil type, initial concentrations, vegetation
     type, density and coverage, fauna, landscape, surrounding land uses, climate, hydro-meteorological
     factors, loading rates, etc. [25,26].
     Scale is a parameter (“umbrella”) that directly or indirectly affects several of the above factors.
From the hydrogeological point of view, wetlands are parts of a wider ecosystem that functions in a
coupled and interactive way with nature’s and human’s activities. Wetland-scaled studies are also
necessary for specific factors, but they should be considered to be components of a broader system,
the watershed, which is why wetlands’ role for phosphorus contamination is examined at a watershed
scale. This is also a novel element, as it addresses all the above differences. Then, the specific factors
can be grouped into the following categories [5,27,28]:
Land use criteria A wetland’s surrounding land uses majorly affect its performance as they significantly
affect its inflows’ quantity and quality;
Soil and vegetation criteria Soil type, vegetation type and density result in different
nutrient-absorbing capacities;
Climatic criteria Temperature, precipitation, sunny hours, ice coverage, etc. are meteorological factors
that affect the speed of the processes and the response of other factors (such as soil and vegetation),
which absorb part of nutrients, contributing to the overall performance of a wetland;
Landscape/topography criteria DEM-related parameters which allow the calculation of slope, aspect,
topographic position index (TPI), topographic wetness index (TWI), overland flow distance, etc.
are factors that show the water concentration inside the watershed, topographic features, and are
important elements to consider for wetlands acting as sources or sinks of nutrients, and flow rates and
accumulation (or the time that phosphorus stay in the wetland) can also be indirectly addressed.
       Spatial data (raster files) were sought for the above parameters. Of course, a wetland’s ability to
filter nutrients is a multifactorial context and more criteria can be used to describe it (e.g., vegetation,
wetland type, etc.) [29]. However, from the available data, we used the following representative criteria
for each category: land Cover spatial data for land uses, soil type for soil, temperature for climatic,
slope, and TPI and TWI for landscape and topography criteria. This set of criteria has the following
advantages (i) the criteria have a small number which makes the computational process simpler,
(ii) a double effect is avoided during the evaluation process since the criteria stand for different drivers,
and (iii) all criteria are in agreement with other studies (see next section for each case) that highlight
Water 2020, 12, 3134 5 of 14
the main drivers of the nutrient-filtering process from natural or constructed wetlands [30–32]. In the
following subsections, we present the meaning and role of each selected representative criterion that
was used in this study.
3.2. Data Preparation: Criteria Scores and Normalization
Before forming the MCA model, the above criteria (the spatial data collected) need to be converted
to the same ”units”, and scale, i.e., a coherent scoring in a low–high system, indicative of their influence
on nutrient filtering ability. This process is described below for each criterion.
The relevant data were obtained from official sources [18,19,33–35]. Typical techniques were used
to calculate slope based on the 5 m resampled (natural neighbors) DEM. Higher effectiveness was
assigned to higher slopes, as they are indicative of water accumulation and flow in the central part of
the watershed [36].
Regarding the land use mapping, the classification in Figure 1B was used. The only layer that
needed to be added was the detailed distribution of the watershed’s wetlands, in order to have a clearer
picture. This dataset was obtained from the Ontario Ministry of Natural Resources and Forestry [35].
A detailed land cover map was essential, as land use majorly defines the phosphorus (P) and nitrogen
(N) exports (kg/ha/y). According to the P and N exports per land use, the scoring was assigned from
less effective (0) to more effective (1) as follows: cropland, grassland, broadleaf/mixed/needleleaf
forests, urban and built-up areas, shrubland, water and wetlands, and barren lands [37,38].
The Ontario Detailed Soil Survey [39] dataset series consists of georeferenced soil polygons
with linkages to attribute data, for example, soil name file (SNF) and soil layer file (SLF). Together,
these datasets describe the spatial distribution of soils and associated landscapes for nearly all
agricultural areas in southern Ontario. Soil types, as used for the present work’s purposes, address the
ground’s drainage and perviousness; pervious soils have the ability to remove higher quantity of
nutrients, as they allow infiltration, thus the scoring ”low” refers to poorly drained soils and ”high”
effectiveness to rapidly drained soils [40].
Temperature (T) is not uniformly distributed in the watershed and this is an element that can
affect the processing of P and N by wetlands. A temperature-gradient approach was followed based on
the DEM and the broader area’s stations’ meteorological data, which provided T’s spatial distribution
in the watershed. For the temperature gradient, four stations of the watershed were used for the period
2012–2019. Low temperatures slow down nutrient absorption processes by wetlands, while higher
temperatures support higher effectiveness [6,41–43].
Topography and wetness indirectly address precipitation and are parameters worth examining
for wetland efficiency, because they increase the precision of the results [44,45]. TPI and TWI were
also calculated based on the DEM, using the same resolution. TPI expresses relative locations of
interest (e.g., the topographic position of a location may be hilltops, plains, exposed ridges, or other
features). TWI (SAGA (System for Automated Geoscientific Analyses) wetness index [46]) is a physical
attribute of water accumulation areas, as it accounts for the hydrographic position of the watershed’s
grid cell, the drainage area per unit contour length, and the presence or absence of flat lands. Thus,
a proportional relation was followed for TPI effectiveness and an inversely proportional for TWI
effectiveness [47].
After converting the criteria in this scored-based low-high scale, it was necessary to use the same
units for the application of the multi-criteria weightings [48]. This was achieved by normalizing
each of the criteria in a 0–1 scale using the min-max normalization technique. Figure 2 shows the six
selected criteria and their normalized spatial distribution used for the detection of potential wetland
effective areas.Water 2020, 12, 3134 6 of 14
Figure 2. Normalized spatial distributions of the selected criteria. Low refers to less effective and high
to more effective filtering potential, based on each criterion’s features. The selected criteria. (A) Land
use; (B) Soil type; (C) Temperature; (D) Topographic wetness index (TWI); (E) Topographic position
index (TPI); (F) Slope.
3.3. Multi-Criteria Analysis (MCA) Model
For the evaluation of the above criteria, an MCA model was formed using the analytical hierarchy
process (AHP). The AHP assigns and distributes weights of significance to the defined criteria
(through pairwise comparisons), creates hierarchical structures to develop priorities (based on the
judgment of the user), and then classifies (ranks) the solutions [49–51]. The AHP was chosen for this
problem because it facilitated the organization and formation of the problems, it performed well with
5–10 criteria, it allowed us to control each step of the process, and it produced a set of weights linked
to the various criteria/objectives [52–54].
The ranking was accomplished with binary comparisons based on experts’ judgment regarding
which criterion was more important for wetland effectiveness. A specific comparison between two
criteria was characterized as ”equal”, ”marginally strong”, ”very strong”, and ”extremely strong” [55,56].
The degree of randomness of the answers was expressed by the consistency ratio (CR), which had to be
smaller than 10%. For the studied problem, the weights were assigned to a 6 × 6 criteria matrix (for a
single alternative, the effectiveness). The right principal eigenvector was calculated for the comparison
matrix. Subsequently, the synthesis of these preferences was carried out to determine which criterion
had the higher priority and effect on the estimated result [53]. Through the comparison relations,
the criteria were weighted (aij ) for each map, as shown in Figure 2 (weights for each one of the six
criteria, wj ), and a spatial value occurred for each grid’s cell, i.e., the potential effectiveness (i):
6
X
AiAHP = aij × w j (1)
j=1Water 2020, 12, 3134 7 of 14
Subsequently, the result was a map of low-high potential effective areas (as the total of the 5 m
grid cells , AiAHP ). Finally, the sum product of Equation (1) and Boolean algebra through GIS were
used to produce the final map with areas that could support effective wetlands for nutrient filtering.
4. Results
The AHP 6 × 6 criteria-weighting matrix was formed and completed by the authors, for the
purpose of the tool’s demonstration of “by expert user”, which is often used for similar AHP-GIS
applications [48,57–61], where experts’ opinions tend to converge anyway [48]. Table 1 shows an
example of the scale used for the evaluation, where each criterion gets a comparative score to the other
criteria. The procedure described above was followed, the results were normalized and examined
with the consistency ratio (CR) approach, which was acceptable (Water 2020, 12, 3134 8 of 14
highlighted. For the rural areas with wetlands of lower effectiveness potential, agricultural practices,
crop replacements, and fertilizer management options are recommended. A closer study is necessary
on specific wetlands, to identify if it would be better to restore or convert them into farmland.
Figure 3. Final map with areas that could support effective wetlands for nutrient filtering.
5. Discussion
The obtained results are an interpretation of the effectiveness of the watershed’s wetlands in
phosphorus filtering. From the beginning, this map’s achievement with an easy, holistic, and low-cost
method was a very challenging task, with limited to no previous experience to build on, especially
related to natural wetlands [67]. Subsequently, validation of the results was also difficult, for several
reasons which included the following: It required integrated knowledge and understanding of the
problem as well as integrated data (often difficult to collect); there were no similar applications or
even monitoring at a watershed’s scale; the examined processes were complex and dynamic; and the
wetlands’ ability to filter nutrients was dynamic and case specific, with different methods used in the
literature to estimate it, with different measurement, application, or computational scales. However,
we attempted to verify the results by comparing our output with a previous study that provided P
and N exports for the Grand River watershed. P and N export distributions were very similar in the
watershed, and since P was the main focus and issue in the broader area and in our study, it was used
for this indicative verification. Figure 4 compares the (digitized) respective map produced recently
by [16] and the map shown in Figure 3.Water 2020, 12, 3134 9 of 14
Figure 4. (A) Phosphorus (P) actual concentrations in the watershed; (B) Areas that could support effective
wetlands for nutrient filtering (black dots represent common areas within the red classes of (A,B)).
In Figure 4A, we recreated the map produced by [16] (digitized and with assigned value classes
of P export per polygon), to facilitate the visual comparison of the results. Both maps are normalized
and classified in three classes, indicating low, moderate, and high P exports and effectiveness,
respectively. The verification can only be considered indirectly, i.e., low P exports can indicate effective
wetland potential in the watershed, and vice versa [68]. A validation process will not be the case
here, as several factors distinguish the two maps’ outputs. P exports are often based on land use,
while several additional factors affect wetlands’ treatment ability. In addition, the wetlands that may
have contributed to the map in Figure 4A are the existing ones, while the map in Figure 4B examines
their potential effectiveness throughout the entire watershed.
According to the results produced in Figure 4B, the watershed’s biggest area is in line with the
map in Figure 4A. Other studies in the Grand River watershed have also resulted in similar spatial
distributions of P and P-sediment exports that support our findings [66,69,70]. The central and west
areas are quite similar, while slight differences appear in the northern and southern areas. This is
reasonable because of the following: (a) There are differences because of intensive loads, especially for
the intensively cultivated north and south parts of the watershed. The increased exports are difficult
to be completely filtered by the wetlands. (b) The river’s flow affects the southern drainage point’s
values. (c) The two maps, therefore, are used for an indirect validation (not completely homogenous,
just indicative), as mentioned before. Despite the different purposes of the older studies and our work,
the comparison provides significant elements related to the current work’s results. The similarity
among them is an encouraging sign for considering the presented results reasonable and valid.
The pinpoint locations in Figure 4B show areas where the water quality status, the actual
nutrient exports, and the existing wetlands’ amount and filtering ability should be examined more
closely. For example, the northern part that previously had more wetland areas, indicates that the
wetlands would have had the potential to filter significant amounts of P, while the existing complex is
”overloaded”, but still effective. The southern part of the watershed (drainage point) is also appropriate
for a more detailed study in order to scrutinize the factors that do not seem to be in line with the
general picture (even if, herein, it is assumed that the river’s flow, changing conditions, sediments,
etc. are the responsible dynamic parameters). Carrying out field studies and further research at those
points would also support future management for the improvement of the water quality.Water 2020, 12, 3134 10 of 14
6. Conclusions
The present study attempted to enhance the decision-making process for improving water quality
by providing a framework for efficient detection of nature-based solutions, in the context of wetland
conservation efforts in Canada. We attempted to fill wetland-application gaps and encourage further
research on the fair consideration of nature-based solutions in policymaking. An objective GIS-based
spatial MCA evaluation framework for the identification of potential wetland-effective areas was
presented. We approached the problem at the watershed scale, in order to be holistic and consider the
interactions of the system’s components in their actual scale, while the criteria used were selected under
the perspective to depict the processes of P buffering representatively. To date, wetlands’ conversion to
farmland is occurring with limited or no background study, because of the limited and case-specific
knowledge regarding wetlands’ ES potential. We hope that the proposed tool can easily give a picture
of their effectiveness spatially, and thus supporting Canadian wetland conservation efforts.
In the Discussion, we argued the credibility of the method, and since it was satisfactory,
the proposed tool could be tested in more case studies and by a larger group of experts in order
to be effectively established. In the future, more case studies at the watershed, or even at the
wetland-specific scale, would be useful, since there is limited experience around the topic. At this
stage, the difficulty of validating the results due to the limited work in the field (especially Canada)
is a limitation, and it is the main reason for presenting this tool as a preliminary estimator to detect
locations of interest. Future research could also consider additional criteria for nutrient absorption,
for example, vegetation which is a very challenging task (especially in natural wetlands) as it varies
continuously [71]. Scholars with further specialization in chemical processes and nutrient modeling
could build on and expand this tool by examining more substances, factors, and techniques. Finally,
in the future, having more data and insights from case-specific studies, and a quantitative calibration
or validation (e.g., effectiveness of 30, 50, and 70%) of the proposed tool should be implemented to
enhance its quality. This would be possible if the inflows and outflows in terms of P loads were known,
which could be achieved with a combination of SWAT modeling techniques. This is the reason we
developed the proposed framework in GIS, i.e., the compatibility with SWAT for future model-building
expansion. Thus, a (more) fair comparison of natural-based solutions with technical solutions (WWTPs)
could be (and would be in the future) better established.
The combined tool of GIS-based MCA evaluation could provide a better understanding, a strong
database, and guidance for policymakers. Application of the proposed framework in the Grand
River watershed is an important first step towards the consideration of wetlands and the provision of
scientifically accurate estimations of their potential.
Author Contributions: A.A. designed the study, conducted the modeling, performed the analysis, and drafted
the manuscript; G.P. supervised the research, conducted the modeling, contributed ideas and analyses, and edited
the paper. All authors have read and agreed to the published version of the manuscript.
Funding: This research received no external funding.
Conflicts of Interest: The authors declare no conflict of interest.
References
1. Ontario Ministry of Environment. Assessing the Economic Value of Protecting the Great Lakes Ecosystems;
Ontario Ministry of Environment: Ottawa, ON, Canada, 2010.
2. Ministry of the Environment and Climate Change Canada. Canada-Ontario Lake Erie Action Plan; Environment
and Climate Change Canada and the Ontario Ministry of the Environment and Climate Change: Ottawa,
ON, Canada, 2018; ISBN 9780660252698.
3. Jaramillo, F.; Desormeaux, A.; Hedlund, J.; Jawitz, J.W.; Clerici, N.; Piemontese, L.; Rodríguez-Rodriguez, J.A.;
Anaya, J.A.; Blanco-Libreros, J.F.; Borja, S.; et al. Priorities and interactions of Sustainable Development
Goals (SDGs) with focus on wetlands. Water 2019, 11, 619. [CrossRef]Water 2020, 12, 3134 11 of 14
4. Davidson, N.C. How much wetland has the world lost? Long-term and recent trends in global wetland area.
Mar. Freshw. Res. 2014, 65, 934–941. [CrossRef]
5. Alamanos, A.; Brouwer, R. The cost-effectiveness of wetlands as a nature-based solution to reduce
phosphorous runoff. In Proceedings of the International Association for Great Lakes Research (IAGLR)
Conference 2020, Winnipeg, MB, Canada, 8–12 June 2020.
6. Cheng, F.Y.; Basu, N.B. Biogeochemical hotspots: Role of small water bodies in landscape nutrient processing.
Water Resour. Res. 2017, 53, 5038–5056. [CrossRef]
7. Negi, P.; Jain, K. Spatial multicriteria analysis for siting groundwater polluting industries. J. Environ. Informatics
2008, 12, 54–63. [CrossRef]
8. Huang, P.H.; Tsai, J.S.; Lin, W.T. Using multiple-criteria decision-making techniques for eco-environmental
vulnerability assessment: A case study on the Chi-Jia-Wan Stream watershed, Taiwan. Environ. Monit. Assess.
2010, 168, 141–158. [CrossRef] [PubMed]
9. Bagdanavičiūtė, I.; Valiūnas, J. GIS-based land suitability analysis integrating multi-criteria evaluation for
the allocation of potential pollution sources. Environ. Earth Sci. 2013, 68, 1797–1812. [CrossRef]
10. Tirkey, P.; Gorai, A.K.; Iqbal, J. AHP-GIS Based DRASTIC Model for Groundwater Vulnerability to Pollution
Assessment: A Case Study of Hazaribag District, Jharkhand, India. Int. J. Environ. Prot. 2013, 2, 20–31.
11. Sener, E.; Davraz, A. Evaluation de la vulnérabilité de l’eau souterraine basée sur un modèle DRASTIC
modifié, sur un SIG et une procédure analytique hiérarchisée (AHP): Le cas du bassin du Lac Egirdir
(Isparta, Turquie). Hydrogeol. J. 2013, 21, 701–714. [CrossRef]
12. Serbu, R.; Marza, B.; Borza, S. A Spatial Analytic Hierarchy Process for Identification of Water Pollution with
GIS Software in an Eco-Economy Environment. Sustainability 2016, 8, 1208. [CrossRef]
13. Sahin, F.; Kara, M.K.; Koc, A.; Sahin, G. Multi-criteria decision-making using GIS-AHP for air pollution
problem in Igdir Province/Turkey. Environ. Sci. Pollut. Res. 2020, 27, 36215–36230. [CrossRef]
14. Neissi, L.; Albaji, M.; Boroomand Nasab, S. Combination of GIS and AHP for site selection of pressurized
irrigation systems in the Izeh plain, Iran. Agric. Water Manag. 2020, 231, 106004. [CrossRef]
15. Qiu, Z.; Luo, L.; Mao, D.; Du, B.; Feng, K.; Jia, M.; Wang, Z. Using Multisource Geospatial Data to Identify
Potential Wetland Rehabilitation Areas: A Pilot Study in China’s Sanjiang Plain. Water 2020, 12, 2496.
[CrossRef]
16. Liu, Y.; Yang, W.; Leon, L.; Wong, I.; McCrimmon, C.; Dove, A.; Fong, P. Hydrologic modeling and evaluation
of Best Management Practice scenarios for the Grand River watershed in Southern Ontario. J. Great Lakes Res.
2016, 42, 1289–1301. [CrossRef]
17. Lake Erie Source Protection Region Technical Team. Grand River Watershed Characterization Report; Grand
River Conservation Authority & Ontario: Cambridge, Canada, 2008.
18. Ontario Ministry of Natural Resources and Forestry Ontario Digital Terrain Model (Lidar-Derived). Available
online: https://geohub.lio.gov.on.ca/datasets/776819a7a0de42f3b75e40527cc36a0a?geometry=-82.652%2C42.
990%2C-78.480%2C43.689 (accessed on 10 June 2020).
19. Government of Canada; Natural Resources Canada; Canada Centre for Remote Sensing 2015 Land Cover of
Canada. Available online: https://open.canada.ca/data/en/dataset/4e615eae-b90c-420b-adee-2ca35896caf6
(accessed on 10 June 2020).
20. Cole, S. The Emergence of Treatment Wetlands. Environ. Sci. Technol. 1998, 32, 218A–223A. [CrossRef]
[PubMed]
21. Karst-Riddoch, T.; Sinclair, D.; Nesbitt, R. Managing New Urban Development in Phosphorus Sensitive Watersheds;
Hutchinson Environmental Sciences Ltd.: Bracebridge, ON, Canada, 2014.
22. Olewiler, N. The Value of Natural Capital in Settled Areas of Canada; Ducks Unlimited Canada and the Nature
Conservancy of Canada: Toronto, ON, Canada, 2004; p. 36.
23. Houlahan, J.E.; Findlay, C.S. Estimating the “critical” distance at which adjacent land-use degrades wetland
water and sediment quality. Landsc. Ecol. 2004, 19, 677–690. [CrossRef]
24. Rice, E.W.; Baird, R.B.; Eaton, A.D. Standard Methods for the Examination of Water and Wastewater, 23rd ed.;
American Public Health Association, American Water Works Association, Water Environment Federation:
Washington, DC, USA, 2017; ISBN 9780875532875.
25. Richardson, C.J.; Craft, C.B. Effective Phosphorus Retention in Wetlands: Fact or Fiction. In Constructed
Wetlands for Water Quality Improvement; Moshiri, G.A., Ed.; CRC Press: Boca Raton, FL, USA, 1993; p. 656.Water 2020, 12, 3134 12 of 14
26. Rutledge, J.M.; Chow-Fraser, P. Landscape characteristics driving spatial variation in total phosphorus and
sediment loading from sub-watersheds of the Nottawasaga River, Ontario. J. Environ. Manag. 2019, 234,
357–366. [CrossRef]
27. LaFlamme, C. Nutrient Removal Using a Constructed Wetland in Southern Québec; McGill University: Montréal,
QC, Canada, 2006.
28. Ontkean, G.R.; Chanasyk, D.S.; Riemersma, S.; Bennett, D.R.; Brunen, J.M. Enhanced Prairie Wetland Effects
on Surface Water Quality in Crowfoot Creek, Alberta. Water Qual. Res. J. 2003, 38, 335–359. [CrossRef]
29. Land, M.; Granéli, W.; Grimvall, A.; Hoffmann, C.C.; Mitsch, W.J.; Tonderski, K.S.; Verhoeven, J.T.A. How
effective are created or restored freshwater wetlands for nitrogen and phosphorus removal? A systematic
review. Environ. Evid. 2016, 5, 1–26. [CrossRef]
30. Fisher, J.; Acreman, M.C. Wetland nutrient removal: A review of the evidence. Hydrol. Earth Syst. Sci. 2004,
8, 673–685. [CrossRef]
31. Fink, D.F.; Mitsch, W.J. Seasonal and storm event nutrient removal by a created wetland in an agricultural
watershed. Ecol. Eng. 2004, 23, 313–325. [CrossRef]
32. Liu, T.; Xu, S.; Lu, S.; Qin, P.; Bi, B.; Ding, H.; Liu, Y.; Guo, X.; Liu, X. A review on removal of organophosphorus
pesticides in constructed wetland: Performance, mechanism and influencing factors. Sci. Total Environ. 2019,
651, 2247–2268. [CrossRef]
33. Government of Canada Natural Resources Canada. Available online: https://www.nrcan.gc.ca/home
(accessed on 10 June 2020).
34. Ministry of Natural Resources and Forestry Land Information Ontario. Available online: https://www.
ontario.ca/page/land-information-ontario (accessed on 10 June 2020).
35. Ontario Ministry of Natural Resources and Forestry Wetlands. Available online: https://geohub.lio.gov.on.ca/
datasets/5216a770ef684d2fae8bcc13ee9c4357_15?selectedAttribute=SOIL_TYPE (accessed on 10 June 2020).
36. Wu, Y.; Dai, H.; Wu, J. Comparative study on influences of bank slope ecological revetments on water quality
purification pretreating low-polluted waters. Water 2017, 9, 636. [CrossRef]
37. Reckhow, K.H.; Beaulac, M.N.; Simpson, J.T. Modeling phosphorus loading response under uncertain.
A manual and compilation of export coefficients. Water Resour. Res. 1980, 30, 214.
38. Kim, D.K.; Kaluskar, S.; Mugalingam, S.; Arhonditsis, G.B. Evaluating the relationships between watershed
physiography, land use patterns, and phosphorus loading in the bay of Quinte basin, Ontario, Canada.
J. Great Lakes Res. 2016, 42, 972–984. [CrossRef]
39. Ministry of Agriculture Food and Rural Affairs Soils Ontario. Available online: http://www.omafra.gov.on.
ca/english/landuse/gis/soils_ont.htm (accessed on 10 June 2020).
40. Loucks, D.P.; van Beek, E. Water Quality Modeling and Prediction. In Water Resource Systems Planning and
Management; Springer International Publishing: Cham, Switzerland, 2017; pp. 417–467. ISBN 978-3-319-44234-1.
41. Eimers, M.C.; Liu, F.; Bontje, J. Land Use, Land Cover, and Climate Change in Southern Ontario: Implications
for Nutrient Delivery to the Lower Great Lakes. In Contaminants of the Great Lakes. The Handbook of
Environmental Chemistry; Crossman, J., Weisener, C., Eds.; Springer: Cham, Switzerland, 2020; pp. 235–249.
ISBN ISBN 978-3-030-57874-9.
42. Hua, Y.; Peng, L.; Zhang, S.; Heal, K.V.; Zhao, J.; Zhu, D. Effects of plants and temperature on nitrogen
removal and microbiology in pilot-scale horizontal subsurface flow constructed wetlands treating domestic
wastewater. Ecol. Eng. 2017, 108, 70–77. [CrossRef]
43. Zhu, H.; Zhou, Q.; Yan, B.; Liang, Y.; Yu, X.; Gerchman, Y.; Cheng, X. Influence of vegetation type and
temperature on the performance of constructed wetlands for nutrient removal. Water Sci. Technol. 2017,
77, 829–837. [CrossRef] [PubMed]
44. Riley, J.W.; Calhoun, D.L.; Barichivich, W.J.; Walls, S.C. Identifying small depressional wetlands and using
a topographic position index to infer hydroperiod regimes for pond-breeding amphibians. Wetlands 2017,
37, 325–338. [CrossRef]
45. Hu, S.; Niu, Z.; Chen, Y.; Li, L.; Zhang, H. Global wetlands: Potential distribution, wetland loss, and status.
Sci. Total Environ. 2017, 586, 319–327. [CrossRef]
46. Böhner, J.; Köthe, R.; Conrad, O.; Gross, J.; Ringeler, A.; Selige, T. Soil Regionalisation by Means of
Terrain Analysis and Process Parameterisation. In Soil Classification 2001; Micheli, E., Nachtergaele, F.,
Montanarella, L., Eds.; The European Soil Bureau, Joint Research Centre: Ispra, Italy, 2002; Volume EUR
20398, pp. 213–222.Water 2020, 12, 3134 13 of 14
47. Little-Devito, M.; Mendoza, C.A.; Chasmer, L.; Kettridge, N.; Devito, K.J. Opportunistic wetland formation on
reconstructed landforms in a sub-humid climate: Influence of site and landscape-scale factors. Wetl. Ecol. Manag.
2019, 27, 587–608. [CrossRef]
48. Papaioannou, G.; Vasiliades, L.; Loukas, A. Multi-Criteria Analysis Framework for Potential Flood Prone
Areas Mapping. Water Resour. Manag. 2015, 29, 399–418. [CrossRef]
49. Saaty, T.L.; Vargas, L.G. Hierarchical analysis of behavior in competition: Prediction in chess. Behav. Sci.
1980, 25, 180–191. [CrossRef]
50. Saaty, T.L. The Analytic Hierarchy Process: Decision Making in Complex Environments. In Quantitative
Assessment in Arms Control; Springer US: Boston, MA, USA, 1984; pp. 285–308.
51. Saaty, R.W. The analytic hierarchy process-what it is and how it is used. Math. Model. 1987, 9, 161–176.
[CrossRef]
52. Alamanos, A.; Mylopoulos, N. MultiCriteria Analysis approaches for decision-support on agricultural
water resources management. In Proceedings of the Protection and Restoration of the Environment (PRE)
Conference, Kalamata, Greece, 7–10 July 2020.
53. Alamanos, A.; Mylopoulos, N.; Loukas, A.; Gaitanaros, D. An integrated multicriteria analysis tool for
evaluating water resource management strategies. Water 2018, 10, 1795. [CrossRef]
54. Choi, J.-H.; Yoon, T.-H.; Kim, J.-S.; Moon, Y.-I. Dam Rehabilitation Assessment Using the Delphi-AHP Method
for Adapting to Climate Change. J. Water Resour. Plan. Manag. 2018, 144, 06017007. [CrossRef]
55. Saaty, T.L. The Analytic Hierarchy Process; McGraw-Hill: New York, NY, USA, 1980.
56. Saaty, T.L. Rank generation, preservation, and reversal in the analytic hierarchy decision process. Decis. Sci.
1987, 18, 157–177. [CrossRef]
57. Yalcin, A.; Reis, S.; Aydinoglu, A.C.; Yomralioglu, T. A GIS-based comparative study of frequency ratio,
analytical hierarchy process, bivariate statistics and logistics regression methods for landslide susceptibility
mapping in Trabzon, NE Turkey. Catena 2011, 85, 274–287. [CrossRef]
58. Dai, F.; Lee, C.; Zhang, X. GIS-based geo-environmental evaluation for urban land-use planning: A case
study. Eng. Geol. 2001, 61, 257–271. [CrossRef]
59. Wang, G.; Qin, L.; Li, G.; Chen, L. Landfill site selection using spatial information technologies and AHP:
A case study in Beijing, China. J. Environ. Manag. 2009, 90, 2414–2421. [CrossRef]
60. Tegou, L.I.; Polatidis, H.; Haralambopoulos, D.A. Environmental management framework for wind farm
siting: Methodology and case study. J. Environ. Manag. 2010, 91, 2134–2147. [CrossRef]
61. Pourghasemi, H.R.; Moradi, H.R.; Fatemi Aghda, S.M. Landslide susceptibility mapping by binary logistic
regression, analytical hierarchy process, and statistical index models and assessment of their performances.
Nat. Hazards 2013, 69, 749–779. [CrossRef]
62. Arabameri, A.; Pradhan, B.; Rezaei, K.; Conoscenti, C. Gully erosion susceptibility mapping using GIS-based
multi-criteria decision analysis techniques. Catena 2019, 180, 282–297. [CrossRef]
63. Arabameri, A.; Rezaei, K.; Cerda, A.; Lombardo, L.; Rodrigo-Comino, J. GIS-based groundwater potential
mapping in Shahroud plain, Iran. A comparison among statistical (bivariate and multivariate), data mining
and MCDM approaches. Sci. Total Environ. 2019, 658, 160–177. [CrossRef] [PubMed]
64. Xiaofeng, L.; Yi, Q.; Diqiang, L.; Shirong, L.; Xiulei, W.; Bo, W.; Chunquan, Z. Habitat evaluation of wild Amur
tiger (Panthera tigris altaica) and conservation priority setting in north-eastern China. J. Environ. Manag. 2011,
92, 31–42. [CrossRef]
65. Jenks, F.G. The Data Model Concept in Statistical Mapping. Int. Yearb. Cartogr. 1967, 7, 186–190.
66. Hanief, A.; Laursen, A.E. Meeting updated phosphorus reduction goals by applying best management
practices in the Grand River watershed, southern Ontario. Ecol. Eng. 2019, 130, 169–175. [CrossRef]
67. Carvalho, P.N.; Arias, C.A.; Brix, H. Constructed wetlands for water treatment: New developments.
Water (Switzerland) 2017, 9, 397. [CrossRef]
68. Alavaisha, E.; Lyon, S.W.; Lindborg, R. Assessment of water quality across irrigation schemes: A case study
ofwetland agriculture impacts in Kilombero Valley, Tanzania. Water 2019, 11, 671. [CrossRef]
69. Hanief, A.; Laursen, A.E. SWAT modeling of hydrology, sediment and nutrients from the grand river, Ontario.
Water Qual. Res. J. Canada 2017, 52, 243–257. [CrossRef]Water 2020, 12, 3134 14 of 14
70. Shaker, S. Historical Trends in Water Quality in the Grand River, Ontario: Reconstruction of Phosphorus
Loadings. Master’s Thesis, University of Waterloo, Waterloo, ON, Canada, 2014.
71. Shelef, O.; Gross, A.; Rachmilevitch, S. Role of plants in a constructed Wetland: Current and new perspectives.
Water 2013, 5, 405–419. [CrossRef]
Publisher’s Note: MDPI stays neutral with regard to jurisdictional claims in published maps and institutional
affiliations.
© 2020 by the authors. Licensee MDPI, Basel, Switzerland. This article is an open access
article distributed under the terms and conditions of the Creative Commons Attribution
(CC BY) license (http://creativecommons.org/licenses/by/4.0/).You can also read