Climate Change and the Kawarthas - Context, Issues and Response - Kawartha Lake Stewards Association - Scugog Lake Stewards
←
→
Page content transcription
If your browser does not render page correctly, please read the page content below
Climate Change
  and the Kawarthas
Context, Issues and Response

         Kawartha Lake
      Stewards Association
             2020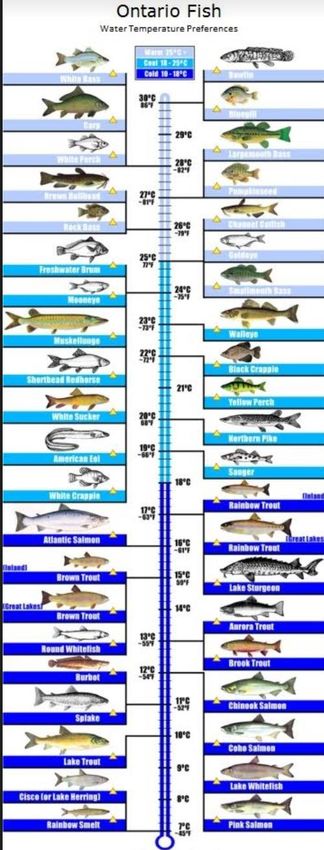
Kawartha Lake Stewards Association
             264 Bass Lake Road           Trent Lakes       Ontario             K0M 1A0
                                   kawarthalakestewards@yahoo.ca

Printed by the Lakefield Herald, Lakefield, Ontario, Canada
All rights reserved. Permission is granted to reproduce all or part of this publication for non-
commercial purposes, as long as source is cited.

Acknowledgements:
This Report was prepared by the KLSA Board of Directors for the benefit of our members and
the seasonal and permanent residents of the Kawartha Region. Board members Dr. M. Dolbey,
Ms. S. Gordon-Dillane, Ms. C. Lee, Messrs. T. McAllister, B. Tregunno and E. Leerdam provided
their review and comments on the Report. We are appreciative of the external reviewers; Drs.
P. Sales, E. Spence, B. Cumming and L. Hulett, and Ms. A. Currier and Ms. S. Fera for providing
their valuable comments.

Recommend Citation:
Napier W.A. 2020. Climate Change and the Kawarthas, Context, Issues and Response. Kawartha
Lake Stewards Association. Trent Lakes ON.

2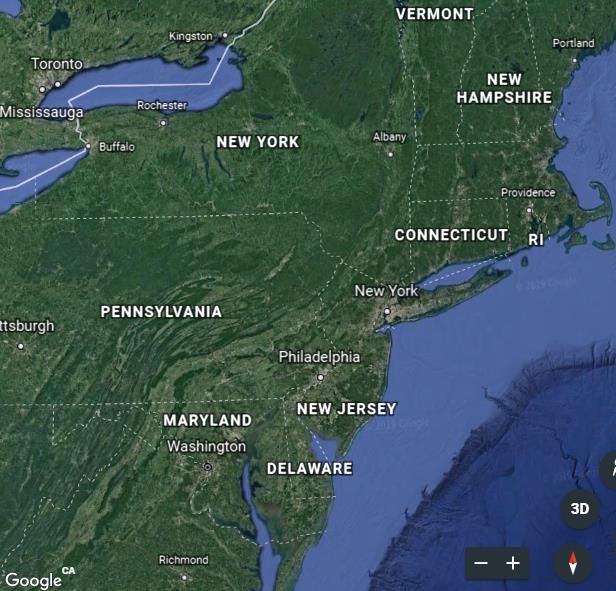
Kawartha Lake Stewards Association
264 Bass Lake Road Trent Lakes Ontario K0M 1A0
kawarthalakestewards@yahoo.ca
Introduction
Kawartha Lake Stewards Association (KLSA) members have identified climate change as an area
of interest and concern. Federal and provincial government scientists have undertaken a number
of studies and models to try to understand what the implications of a changing climate will be on
the lands and lakes located in the Great Lakes Basin and the Lake Ontario watershed and in some
cases the Kawartha Lakes region. Our interest is the Kawartha Region of the Trent-Severn
Waterway.1 The Kawartha Lakes region is shown in Figure 1 (Spence 2016). KLSA defines the
Kawartha Lakes as the lakes within the Trent-Severn Waterway whereby Balsam Lake is the most
upstream lake and Katchewanooka Lake is the furthest downstream lake (White 2006).2 In KLSA’s
2018 Annual Lake Water
Quality Report we
summarized climate change
related to projected annual
air temperatures and
precipitation rates for two
modeling scenarios which
extend to the end of this
century (Napier 2019a).
In this report, we describe
the effects of climate
changes on the
environment and paint a
scenario of what may be in
store for us.
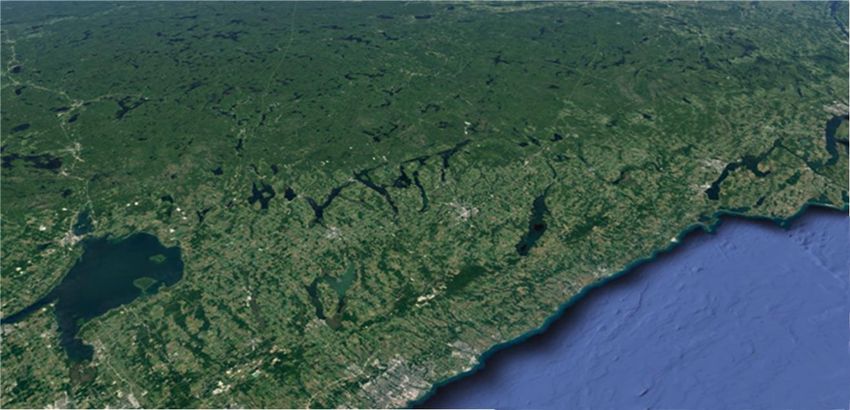
Figure 1. Watersheds of the Trent-Severn Waterway showing
the central location of the Kawartha Lakes. Canadian and US scientists
have assessed climate
change projections for the Great Lakes Basin and evaluated the degree of evidence and the
consensus of agreement on various climate change impact indicators (McDermid 2015a).
Physical Environment
Table 1 summarizes projected climate change impacts upon the physical environment. The
strength of evidence and degree of agreement by the scientists were ranked as “high”, “medium”
and “low”. Some of the key physical attributes found by these researchers are described below.
1
The Trent Severn Waterway comprises of the Severn Region, Simcoe Region, Kawartha Region and Trent Region.
See: http://www.thewaterway.ca/maps.html#sthash.pbUrH6Hn.dpbs.
2
See the KLSA 2018 Annual Lake Water Quality report for a map of the lakes where water quality is tested.
3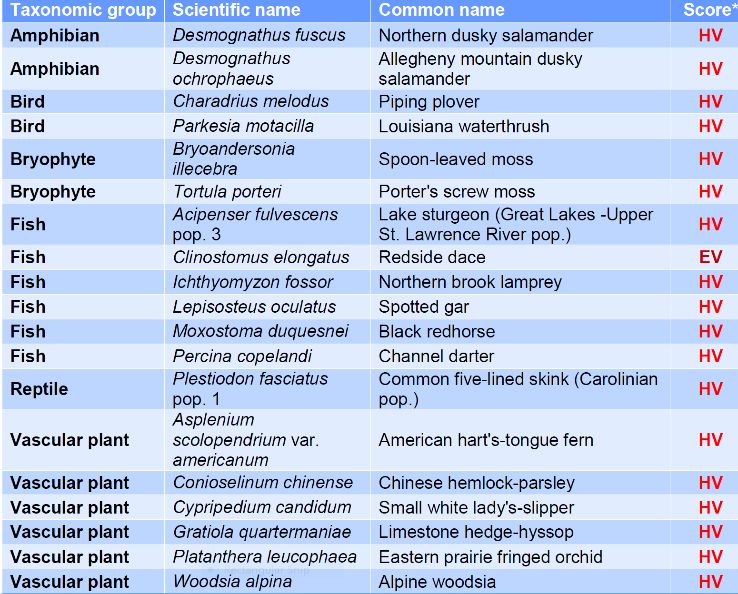
Kawartha Lake Stewards Association
                    264 Bass Lake Road                   Trent Lakes       Ontario               K0M 1A0
                                                  kawarthalakestewards@yahoo.ca

                 Table 1: Climate Change-Projected Impacts: Great Lakes Basin - Physical Effects3

                 ↑ Lake water temperature                  ↑ Precipitation (20%)
          H
                 ↑ Ice free days (42 to 90 days)           ↑ Rain ↓ snow                       ↑ Air temperature
          i                                                ↑ Extreme rain events               ↑ Frost free days
                 ↑ lake stratification
          g                                                ↓ Ice cover, thickness, extent
     E           Variable: water levels effects
          h                                                ↑ Mid winter thaws
     v
     i    M
     d    e
                                                         ↑ Flood severity and frequency
          d
     e                                                   ↑ Number and extent of fires
          i
     n    u
     c    m

     e          ↑ Ice storms
          L                                                                                 ↑ Drought periods
                ↑ Wind gusts
          o     ↑ Temperature wetlands
                                                                                            Variable: river temperatures
          w     Variable: Lake chemical effects

                                Low                                  Medium                            High
                                                                 Agreement

 Air Temperature
                                                   As previously reported there is a high degree of
              Peterborough
                                                   certainty surrounding the projections on air
                                                   temperatures (Napier 2019a). Over the last 63
                                                   years Ontario’s average annual air temperature
        Peterborough: projected mean Albany        has increased by 1.6°C. Annual average
         temp by 2100 {best case}
                                                   temperatures are projected to increase by 3.0°C
                                                   to 7.6°C above the baseline period (1971 to
                                                   2000) by the year 2100 (McDermid 2015b).
                                                   Figure 2 provides a context of where
                                                   geographically equivalent annual average
                                                   temperatures are expected to be by the end of
                                                   the 21st Century. Based on the low emission
                                                   (i.e. best case) scenario, the average annual
                                                   temperature for the Peterborough area will be
     Peterborough: projected mean                  similar to the present day average annual
      temp by 2100 {worst case}
                  Richmond
                                                   temperature at Albany NY. Assuming the high
Figure 2: Scenario Based Air Temperature emission (i.e. worst case) scenario the average
Locations                                          annual temperature for our area will be what is
 now occurring at Richmond VA. The warming temperatures in the Great Lakes Basin have already
 extended growing seasons by 1-1.5 days per decade during the past 50 years, which has a direct
 impact for plants, aquatic primary productivity and fish, whose life cycles are all highly dependent
 on temperature. With the increase in temperatures there will be the cascading effect of less

 3
     See McDermid 2015b and Fausto, undated for the information contained in Tables 1 and 2.

 4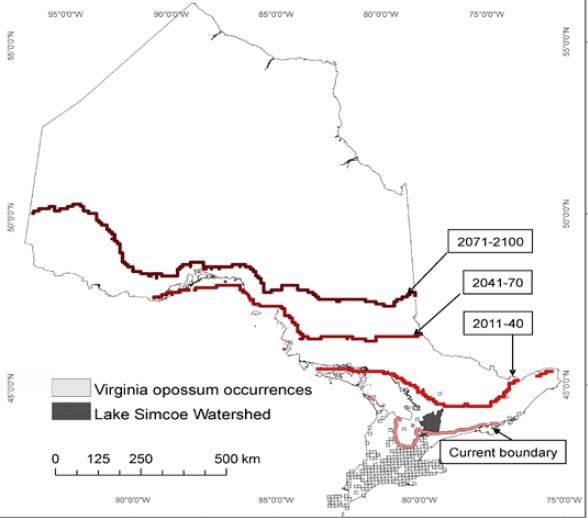
Kawartha Lake Stewards Association
               264 Bass Lake Road               Trent Lakes       Ontario                    K0M 1A0
                                         kawarthalakestewards@yahoo.ca

snowfall, more rain and more mid-winter thaw events (McDermid undated). Researchers are
beginning to suspect that the worst case scenario, which was estimated to have a 3% chance of
happening is unlikely to occur. “Under this scenario, a 500% increase in the use of coal was
estimated which is now considered unlikely” (McGrath 2020).

Lake Temperature

Lake water temperatures are a by-product of climate change (i.e. ‘the warmer the air, the warmer
the water’). In the last century, surface water temperatures of the Great Lakes have increased
by as much as 3.5°C. In the coming century, surface water temperatures are projected to increase
by a further 2.9°C to 6°C depending on the climate change scenario and location within the Great
Lakes Basin. Changes in air temperature and corresponding surface water temperature influence
the extent and duration of lake ice cover. Over the past century, there has been a strong trend
toward later freeze-up and earlier break-up of lake ice.

                                                                     The shortened ice period is
                                                                     derived not only from
                                                                     anecdotal evidence of
                                                                     grandparents lamenting the
                                                                     fact that the duration of ice
                                                                     rinks on the lakes has been
                                                                     shortened but also from
                                                                     historical data. As reported
                                                                     in the Port Perry Star, Figure
Figure 3: Lake Scugog ice cover – Historic trends                    3 shows the “ice out” days
                                                                     from Lake Scugog.4 Today,
the ice cover is off Lake Scugog approximately three weeks earlier than in the middle of the 19 th
Century. Similarly, Figure 4 shows the number of ice-free days (pink squares as shown on the
right hand axis) compared with the number of ice-cover days (blue diamonds as shown on the
left hand axis) on Harp Lake from 1975 until 2009.5 Harp Lake is one of the long-term monitoring
sites maintained by the Dorset Environmental Science Centre. The change in the lake’s thermal
dynamics will affect the lake’s ecosystem.

A consequence of fewer ice-cover days on both Georgian Bay and Lake Ontario could alter the
lake effect snowfall for both the reservoir lakes and the lower Trent Lake system respectively.
The longer open water period will increase evaporation from Georgian Bay and Lake Huron well
into the winter months, providing greater quantities of moisture delivered along the snow-belt
(e.g. reservoir lakes).

4
  Courtesy of J.P. Hvisten, Port Perry Star. This graph can be found at the Chandossier website which also contains
several environmental data sources: https://chandossier.com/.
5
  Figure 4 - courtesy of Dorset Environmental Science Centre.

5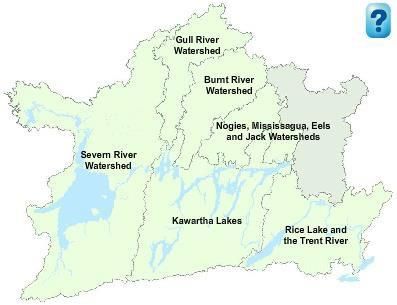
Kawartha Lake Stewards Association
               264 Bass Lake Road              Trent Lakes       Ontario                    K0M 1A0
                                        kawarthalakestewards@yahoo.ca

                                                                    Not only will ice cover be
                                                                    affected, the type of ice
                                                                    on lakes will also change
                                                                    (Buttle 2019). Alterations
                                                                    to the nutrient cycles,
                                                                    reduction in dissolved
                                                                    oxygen concentrations
                                                                    and changes in aquatic
                                                                    habitats may occur. Lake
                                                                    mixing regime responses
Figure 4: Harp Lake: Changes in Ice Cover Sale (2016)               to climate change are
                                                                    complex and may not be
                                                                    associated closely with
                                                                    change in any one
   Figure 4: Harp Lake: Changes in Ice Cover                        climatic variable. Climatic
factors that may contribute to the lake heat budget are air temperature, solar and thermal
radiation, cloud cover, wind speed, and humidity (Woolway 2019). The timing of breakup, freeze
dates and open water days are projected for Ontario’s fishery management zones including the
Kawartha Lakes. By the end of the century Kawartha Lakes open water duration is projected to
be 13 to 43 days longer that what occurred between 1971 and 2000 (Minns 2014).

Increased water temperatures and the corresponding increase in the duration of the lake
stratification period result in decreased oxygen levels in bottom waters.6 Warmer water
enhances productivity, which could increase the number and growth of undesirable species and
cause algal blooms. As temperatures increase, warm water holds less oxygen than cold water.
Oxygen levels in the lower levels of the lake can be further reduced by the decomposition of
organic matter as it drifts down from the surface which, in turn, may lead to depleted oxygen
conditions (anoxia) which is compounded by longer periods of lake stratification (Dove Thompson
2011). Dissolved oxygen levels of 5 mg/l or greater are preferred by most fish of interest to
anglers, while concentrations below 2 to 3 mg/l are considered hypoxic.7

Warmer waters can contribute to increases in algal blooms (Rex 2013). Each year, KLSA
summarizes Total Phosphorus (TP) concentrations within the Kawartha Lakes and also reports on
TP loadings from municipal sewage treatment plants and interprets historical phosphorus trends

6
 For a description of lake stratification see totsaltot2015a Box 2: Thermal stratification in lakes.
7
 Hypoxic water conditions are where dissolved oxygen concentrations are less than 2 mg/L, making life difficult for
aerobic organisms.

6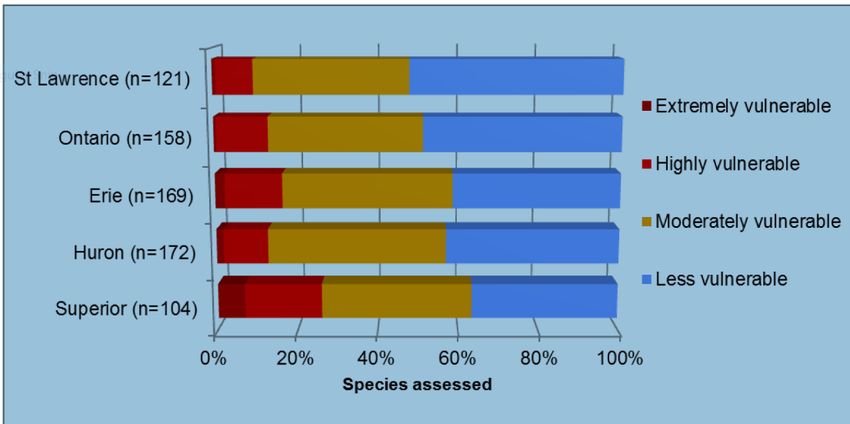
Kawartha Lake Stewards Association
                264 Bass Lake Road            Trent Lakes       Ontario                  K0M 1A0
                                       kawarthalakestewards@yahoo.ca

or anomalies (Dolbey 2016).8 KLSA has undertaken a review of Total Phosphorus trends for a 10
year period (Dolbey 2015) and has identified how TP concentrations have changed in the past
250 years and the implications for the lakes’ trophic status (Laird 2018, Napier 2019b).
Phosphorus release rates from lake sediments can be affected by dissolved oxygen
concentrations and a variety of other environmental factors (Orihel 2017). The release of
phosphorus from sediments is partially temperature dependent; therefore, warmer water
temperatures may increase phosphorus levels in the water column. “If lake sediments become
warmer and more hypoxic in response to climate change, the contribution of phosphorus from
lake sediments may increase” (Gibbons 2013). Because of increased frequency and intensity of
rainfall events, surface runoff may cause additional TP loadings to local waterbodies. Moreover
warmer water will promote the growth of both aquatic plants and algae biomass as well as
causing species shifts.

Precipitation

Table 1 shows there is high evidence (x axis) and medium concurrence (y axis) to the impacts on
both timing and the amount of precipitation resulting from climate change. As noted in the KLSA
2018 annual report,9 annual precipitation in the Kawarthas is projected to increase under all
climate projections across the watershed by 7% to 10% by the end of the 21 st century.

However, seasonal precipitation rates may vary. Mean summer precipitation is projected to
decrease under most scenarios, while winter precipitation amounts are projected to increase
across all scenarios. The winter precipitation event will see more rain and freezing rain and less
snowfall. The largest snowfall losses in North America are projected for the Great Lakes Basin
with declines of up to 48% by the late 21st Century. The increase in precipitation rates and
expected changes in the pattern of seasonal rainfall could cause a number of other effects such
as an increase in flood frequency and timing, an increase in severe storms and fluctuating river
and lake hydrological regimes. The Coalition for Equitable Water Flow assessed potential
changes in the Trent-Severn Waterway. 10 During the summer months of 2016, there was a
rainfall deficit in the Peterborough, Trenton and Haliburton districts from the ‘normal’ period
when compared to the ‘actual’ precipitation levels.11 We have already seen increased drought
periods in the Kawartha and Haliburton areas during the summer season coupled with extreme
spring rainfall events. For example, in 2013, 2016, 2017 and 2019 precipitation events were 130%
to 235% above the average amount for rainfall (Spence 2019a).

Parks Canada has developed a strategy for managing water levels along the Trent-Severn
Waterway (TSW) and this strategy is considered a mitigating feature to address climate change.12
8
  See https://klsa.wordpress.com/published-material/ for all KLSA Annual Lake Water Quality Reports.
9
  See Napier 2019a.
10
   See Spence 2016.
11
   See Spence 2016 slide 30.
12
   See: https://www.pc.gc.ca/en/lhn-nhs/on/trentsevern/info/infonet/gestion-eau-water-management.

7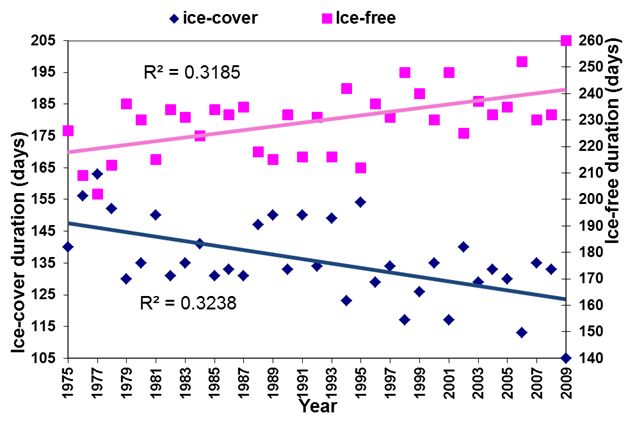
Kawartha Lake Stewards Association
                    264 Bass Lake Road                           Trent Lakes       Ontario                                 K0M 1A0
                                                          kawarthalakestewards@yahoo.ca

In recent years, TSW has added real-time snow gauges to augment snow surveys, installed
automatic level recorders on all the key reservoir lakes, reports daily on precipitation events and
undertakes inflow/outflow water balances to evaluate lake storage capacities. The collection of
these data and modeling analysis allows TSW to respond to real-time conditions (Spence 2019b).
The likely result is that the Kawartha Lakes will maintain its summer water levels by additional
scrutiny and management attention by TSW throughout the year especially during the shoulder
seasons.

Biological Environment

Table 2 shows the projections of the biological component for the Great Lakes Basin. Biological
environmental attributes are harder to predict and project because of the number of variables
that could influence biotic change. Climate is only one factor, albeit an important one!

Table 2: Climate Change-Projected Impacts: Great Lakes Basin - Biological Effects

     H
     i
     g
     h

                                              ↓ Range for coldwater fish, turtles
 E
     M                                        ↑ Range for cool/warmwater fish
 v
     e                                        ↑ Range oak/birch forest, sugar
 i
     d                                        maples, hickory, plant productivity
 d                                            ↓ Boreal species
 e   i
                                               Variable: wetland vegetation requiring
 n   u
                                              little water such as sedges, grasses, will
 c   m
                                              replace emergent and submergent
 e                                            species

         Variable: Phenology (amphibians)                                                  ↑ Non-native species
     L   Variable: Aquatic species genetics                                                ↑ Range for invasive species
     o   ↑ Wildlife Pathogens and                                                          ↑ Aquatic vegetation, trees,
     w   parasites range and prevalence.                                                   plant pathogens and parasites
                                                                                           range and prevalence.

                        Low                                   Medium                                   High
                                                              Agreement

Forests
It is difficult to predict the potential effects of climate change for the terrestrial environment in
the Kawartha region. We are blessed to live in a richly diverse terrestrial environment where
climate plays an important but not exclusive role in dictating the land cover. Ontario is divided
into three ecozones, based primarily on geological features and then is divided into 14 ecoregions
based on climate, physiographic differences, vegetation type and geology. “The climate within
an ecoregion has a profound influence on the vegetation types, substrate formation, and other
ecosystem processes, and associated biota that live there” (Crins 2009). The Kawartha region

8
Kawartha Lake Stewards Association
                  264 Bass Lake Road                  Trent Lakes       Ontario                             K0M 1A0
                                               kawarthalakestewards@yahoo.ca

straddles ecoregions 5E and 6E and is comprised of six ecodistricts13 and dozens of ecosites –
therefore predicting effects to one changing, albeit vital parameter, lends itself to uncertainty
(ESTR Secretariat 2016).14 A report prepared by Federal and Ontario scientists projected the
changes to Ontario’s ecoregions (McKenney 2010) by assessing the current climate and
comparing predicted climate scenarios. Their analysis indicates that by the end of the century
the ecoregions 5E and 6E will shift northwards and almost disappear in the Kawartha area and of
note the ecoregion conditions will become more fragmented than at present. 15 The Report
states that observing the climate conditions shift doesn’t necessarily mean that forest
ecosystems will shift within the same timeframe. “First, we do not suggest that tree populations
will actually follow the projected shifts in climate. We simply identify where the climatic
                             conditions in which a tree species currently grows are projected to
                             move to; the extent to which tree species will actually shift with
                             climate, through natural and/or assisted
                             migration, is highly uncertain”.

                           Without question, a changing climate will
                           affect forests. Trees on one hand are long
                           living and have evolved to live through
                           periods of stress. On the other hand, the
                           rapid change experienced by climate change
                           could cause changes to the types of trees
                           that constitute the Kawartha forest cover
                           and more importantly shift other vegetation
                           species found in the understory that in turn
                           alters land ecosystems. Also many of the
 Figure 5. Current Range                                                 Figure 6. Red Oak Range
                           dominant tree species in the Kawartha area
         of Red Oak                                                      by end of Century
                           have large ranges: Eastern white pine can be
found anywhere from southern Canada to the Appalachian Mountains".16 Figures 5 and 6 show
the extent of red oak currently and the expected range at the end of this century.17 As the
province warms, southern deciduous species (e.g., tulip, poplar, black walnut, and shagbark
hickory) are projected to have more areas with suitable climate in Ontario’s protected areas.

13
   There are 16 ecodistricts in ecozone 6E and 11 ecodistricts in ecozone 5E. Ecodistricts are divided into a finer
scale categorized as ecosections, ecosites and ecoelements. These categories are used to assess various habitat
types. Ecosites of Ontario. 2009. Operation Draft. http://www.cnfer.on.ca/SEP/PELC/PDFs/OntarioEcositesKey.pdf.
14
   For a description on anticipated changes to ecoregions see: https://biodivcanada.chm-cbd.net/ecosystem-status-trends-
2010/mixedwood-plains-summary#_fig02.
15
   For an interactive map showing the location of Ontario’s ecozones and the projected changes in the ecoregions
see: https://www.ontario.ca/environment-and-energy/climate-change-ecoregions.
16
  For an explanation of tree species ranges see:
https://projects.ncsu.edu/project/dendrology/index/plantae/vascular/seedplants/gymnosperms/conifers/pine/pinus/strobi/easternwhite/habi
tat.html.
17
     For projections on trees and plants see http://planthardiness.gc.ca/index.pl?lang=en&m=7&speciesid=1000963.

9
Kawartha Lake Stewards Association
264 Bass Lake Road Trent Lakes Ontario K0M 1A0
kawarthalakestewards@yahoo.ca
Figure 5 shows the current range of red oak. The green and brown areas represent respectively
the core and the extent of its range. Figure 6 show the projected range of red oak by end of the
century. Not all tree species found in the Kawartha region will experience range expansion. As
time marches on, boreal species such as black spruce, white spruce, balsam fir and trembling
aspen are likely to become absent from the area. In fact, black spruce is projected to be found
only in the northern reaches of the Province.
The change in black spruce range is more startling as shown in Figures 7 and 8. At present black
spruce is found along the north
shore of the Great Lakes. Black
spruce almost disappears in the
Kawartha Region.
The generally dryer conditions
during the growing season could
increase the risk of fire. During
the early stage of ecosystem
succession, pioneer species will
change as will the forest floor
understory as species from the Figure 8. Black Spruce Range
Figure 7. Current Range
Carolinian forests find their way by end of Century
of Black Spruce
into our neighbourhood.
Wetlands
The potential effect on wetlands (see Table 2) has been classified with medium evidence and
medium agreement. Wetlands constitute 14% of the area managed by the Kawartha Region
Conservation Authority.18 Wetlands are an important constituent of the water resources found
within the Kawartha Lakes. “Extensive wetlands were once associated with the rivers and lakes
of the region and many of these still exist, both treed swamps and marshes” (Berry 2011). While
there haven’t been many climate change assessments, higher wetland water temperatures in
shorter, warmer winters and longer summers will result in increased evapotranspiration and
evaporation leading to decreased water levels in wetlands (McDermid 2015a). Wetlands, such
as bogs, that depend on precipitation and surface runoff rather than groundwater are particularly
sensitive to drying and peatlands are likely to dry due to increased evapotranspiration. The drying
will promote the growth of sedges, grasses and trees that will eventually replace the emergent
and submergent species.
18
See: https://kawarthaconservation.com/wetlands.
10Kawartha Lake Stewards Association
264 Bass Lake Road Trent Lakes Ontario K0M 1A0
kawarthalakestewards@yahoo.ca
Fisheries
There is a link between water temperature and the
productivity of some fish species. A change in lake water
temperature could affect not only habitat suitability
(distribution) but reproduction, survival, growth and food
habits. Some fish species thrive in warmer water while
others prefer cooler temperatures. Fish body temperatures
are regulated by their environment, i.e. the water
temperature. Each fish species has a temperature range
which is considered to be optimal. The thermal guild is the
group of species that share a common preferred
temperature range. The three main thermal guilds relevant
to us are the cold water guild, the cool water guild and
warm water guild. The cold water guild includes lake trout
with an optimal temperature range of 10 to 18°C; the cool
water guild includes walleye with an optimal temperature
range of 18 to 25°C; and the warm water guild includes
smallmouth bass with temperatures greater than 25°C.
Figure 9 provides the preferred temperature range for
common Ontario fish species.19 Increasing lake
temperatures have already resulted in a change in fish
populations. Over the past 30 years some fish species have
moved northward at a rate of 12 to 17 km per decade in
Ontario (Alofs 2014). Efforts to model the fisheries gains
and fisheries losses have been undertaken by researchers
(Van Zuiden 2016 and Edwards 2016). Scientists project
that overall fisheries production in the Great Lakes will
expand as the upper and middle layers of the lake strata
increase creating more warm water fish habitat while not
limiting the habitat for those fish that enjoy cooler or cold
water (McDermid 2015).
However, in shallow lakes such as those found in the
Figure 9. Preferred temperature range Kawartha Lakes, cold water habitat will be severely
for Ontario fish species restricted. Cool water fish such as walleye could come
under stress in the Kawartha Lakes system. Warm water
19
For optimal lake temperature for certain species see: http://www.fishing.info/water_temp.html.
11Kawartha Lake Stewards Association
264 Bass Lake Road Trent Lakes Ontario K0M 1A0
kawarthalakestewards@yahoo.ca
fish, such as bass, are projected to benefit from elevated water temperatures. Researchers
project that a water temperature increase of 4.5oC to 5oC would increase fish species richness
from 12 to 60 fish species in Ontario’s 137 tertiary watersheds (Dove-Thompson 2011).
Ecosystems
The vulnerability of species in the Great Lakes Basin has been assessed by scientists (Brinker
2018) using an established methodology to rank species’ vulnerability. Two-hundred and eighty
species were assessed over 10 major taxonomic groups: amphibians, birds, bryophytes (mosses
and liverworts), fish, insects and spiders, lichens, mammals, molluscs, reptiles, and vascular
plants (see Figure 10).20
The Report states that
with the advance of
climate change,
populations have two
survival options: (i)
they can remain in situ
and tolerate/adapt
/evolve to the new
conditions; or (ii) they
can move to track
their climatic niches.
Thus we can expect
shifting distributions
Figure 10. Percentage of species found to be vulnerable to climate change of species as some
species will expand
their ranges north, in some cases vacating their current locations. Other species with constricted
habitats and niches may find it difficult to adjust.
Vulnerable species are molluscs, fish, amphibians, and lichens. Species with a restricted
ecological niche are more vulnerable. Mammals and birds are less vulnerable because of their
ability to disperse. The Lake Superior watershed has the most species in the extreme and highly
vulnerable categories. This is in part because the species found in this region are located at the
southern boundary of their habitat range and other species have local specialized niches which
will be altered with a warmer climate. In the Lake Ontario watershed approximately 78 species
are considered to be vulnerable to climate change. Figure 11 shows the 19 most vulnerable
20
See Table 2 in Brinker 2018.
12Kawartha Lake Stewards Association
264 Bass Lake Road Trent Lakes Ontario K0M 1A0
kawarthalakestewards@yahoo.ca
species. The redside dace was found to be extremely vulnerable.21 Eighteen other species were
assigned a highly vulnerable score. Taxa found to be highly vulnerable included 2 amphibians, 2
birds, 5 fish, 2 bryophytes, 1 reptile, and 6 vascular plants. Another 59 species (not listed in Figure
11)22 were considered
moderately vulnerable.
Within the Kawartha region
there are no areas where
there are concentrations of
extremely or highly
vulnerable species. 23
In our sister watershed to
the west, (Lake Simcoe),
another wildlife
vulnerability study
assessing climate change
was undertaken (Walpole
2011). This study observed
an increase in bird and
mammal species richness
and accelerated
reproduction in spring-
Figure 11: Lake Ontario Basin species found to be extremely or breeding anurans (frogs and
highly vulnerable species resulting in an increased incidence of toads). There will be a shift
hybridization in bird and mammal
composition as some
species expand into the area while others recede out of the watershed.
A National Audubon Society study attributes a 30% loss in bird numbers since 1970 to a number
of non-related climate change effects but states that climate change will compound declining
bird populations. The Society has projected the amount of habitat loss and habitat gained
(usually less habitat) for hundreds of bird species as a result of climate change (see:
https://www.3billionbirds.org/).
21
Redside dace is classified as a threatened species, primarily because of urban sprawl resulting in habitat loss
along the GTA and western section of Lake Ontario, see: https://www.ontario.ca/page/guidance-development-
activities-redside-dace-protected-habitat.
22
See Table 3 in Brinker 2018.
23
That is an area with greater than 4 extremely or highly vulnerable species. See Figure 40 in Brinker 2018.
13Kawartha Lake Stewards Association
264 Bass Lake Road Trent Lakes Ontario K0M 1A0
kawarthalakestewards@yahoo.ca
While the opossum has been around Southern Ontario since 1970, Figure 12 shows its projected
range expansion as a result of climate change24. Several authors have pointed out that the influx
of subspecies will lead to
hybridization of various mammals
and plants. For example, the rapid
northward expansion of some
species may lead to new or renewed
contact and interbreeding and
hybridization of distinct populations
of species (Morand undated).
Examples of hybridization that is
expected to occur is among different
species/populations of flying
squirrels and chickadees (Varrin
2007, Garroway 2010). While
hybridization can result in a decrease
in diversity and fitness there can also
be positive outcomes in terms of
genetic variation (McDermid 2015a).
Figure 12: Welcome the Virginia Opossum
Data Interpretation – caveats
Tables 1 and 2 showing the projections for flora and fauna changes are hinged with model
uncertainty.25
There is relatively high confidence and agreement for model projections of air temperature
(Table 1). Projection for elements that require a number of factors to consider and which are
dependent on other projections become less certain. This explains in part why biological
projections fall within the medium confidence and medium agreement category.
All models have limits to the precision of projections and occasionally the results of models
portraying the same ecological component offer conflicting conclusions. For example, some
models project groundwater recharge rates will increase by 3% to 4%, others have projected a
19% decrease in recharge: both using recognized climate models. The uncertainty of climate
change projections at the regional level is greater than with Canada-wide or world-wide analyses,
therefore attributing anthropogenic climate change at a local scale is more difficult to determine
(Bush 2019).
24
See Figure 4 in Walpole 2011.
25
Note the evaluation of climate change effects referenced in McDermid 2015a was published before the Dinker
2018 article. Therefore, it is unknown if the rankings shown in Table 2 would be altered as a result of this new
information and interpretation.
14Kawartha Lake Stewards Association
264 Bass Lake Road Trent Lakes Ontario K0M 1A0
kawarthalakestewards@yahoo.ca
The next revision to the model scenarios developed by the Intergovernmental Panel on Climate
Change (IPCC) is expected in 2021. The IPCC will release the Sixth Assessment Report, AR6. Based
on their projections, we can expect another round of projections and proposed
recommendations.
Summary, projections and what the future may hold.
So, what does all this mean for the Kawartha region?
While there will still be warm years and cold ones, wet ones and dry ones, the typical year
at mid-century is likely to be 2oC to 3oC and by the end of the century 3oC to 7oC warmer
and possibly about 10% wetter.
A dramatic ‘weather change’ will be the intensity of storms that we will need to adjust to.
Lake ice conditions will become variable as slushing conditions prevail; ice will be off the
lakes sooner and arrive later on our lakes.
Fishing for lake trout and walleye will become more difficult but bass, catfish, pumpkin
seed and maybe even pike may become more plentiful.26
We will be on the telephone to the Trent-Severn Waterway asking them to raise or lower
lake elevations as water levels fluctuate with more intense rain events and dry periods.
There will still be forests but there will be a variety of different species found in all regions.
The boreal trees that are located in the northern border of the Kawartha region are at
their current southern range and will become stressed under warmer climate conditions.
The generally dryer conditions during the growing season could increase the risk of fire,
and some of our forests may well be reshaped by new fire regimes.27
During the early stage of ecosystem succession, pioneer species will change as will the
forest floor understory as species from the Carolinian forests find their way into our
neighbourhood.
Similarly, some new bird species will become present and some of our current friends
will find the Temiskaming Lakes area more to their liking.
The warmer climate and increased atmospheric carbon dioxide levels should facilitate
plant growth and farmland should become more productive given ample water.
Some economists see an economic advantage, on a macro scale, for an area that will have an
annual increase in average air temperatures (Burke 2015). With the extended season, it is
anticipated certain Kawartha businesses will benefit. It is expected there will be an increase in
tourism because of an earlier spring and warmer summer and autumn conditions. For Ontario’s
provincial parks, visitation is projected to increase by the 2020s (11–27%) due to a warmer
climate, and this increase could even be greater (23-41%) when combined with demographic
26
For a description of the potential effects of climate change on fish species, see Dove Thompson 2011, section 6
“The Effects of Climate Change on Selected Fish Species”.
27
Droughts are predicted to increase in frequency and extent, while rain events will become more sporadic and
extreme see McDermid 2015a.
15Kawartha Lake Stewards Association
264 Bass Lake Road Trent Lakes Ontario K0M 1A0
kawarthalakestewards@yahoo.ca
changes (Parks Canada 2017). In response to projected climate change, the weather-visitation
models suggest that for each additional degree of warming experienced, despite the negative
effects of increasing precipitation and more frequent heat extremes, annual park visitation could
increase by 3.1%, annually. The projected increase in park visitation as a result of rising
temperatures was mainly associated with shoulder season visitation, with only minor increases
in peak season visitation (Hewer 2016).
What can be done?
Individual action, or as some believe, Canada’s action is insufficient to prevent the ongoing
effects of a changing climate. Canada contributes about 1.6% of the world’s greenhouse gas
(GHG) emissions.28 Canada’s emissions reduction commitment under the Paris Agreement is
that GHG should be 30% below 2005 levels by 2030. Currently sitting at a 2% reduction since
2005, we have a long way to go (Environment and Climate Change Canada 2019). The strategy
in the Paris agreement consists of countries reducing their own emissions and for developed
countries to offset high emission by transferring funds to developing countries. This transfer of
wealth has made some countries and pundits critical of the Paris Agreement (Roman 2019).29
Notwithstanding the ineffectiveness of international agreements, the climate change issue is
imminent, real and occurring. Therefore, simply doing nothing is not an option for the planet.
Addressing climate change is not only a necessity but a responsibility of every government and
citizen.30 It is necessary to both adapt to the changes that are taking place and to take action to
reduce the cause of these changes, our CO2 emissions.
“You can’t manage what you can’t measure”
KLSA, as a citizen science organization, believes that by quantifying issues, by measuring and
monitoring, we can provide the necessary information to take prudent and effective actions. The
breadth and complexity of a changing environment can be overwhelming. KLSA proposes a two-
pronged approach that is tangible, realistic and within the capability of each of us to deliver. We
have distilled the two actions to make a positive change and support the credo of “thinking
globally and acting locally”.
Action #1 - Individual metrics
While it is incumbent on governments to show leadership in GHG emission reduction, it is also
incumbent on individuals to take actions by assessing if, where, when and how to reduce our
28
These data are for 2017, the most recent annual publicly available dataset and referenced Environment and
Climate Change Canada 2019.
29
In 2015, Canada committed $2.65 billion in climate finance over five years to support climate change action in
developing countries.
30
Climate change adaptation is the means of mitigating the potential adverse effects of climate change. See:
https://www.nrcan.gc.ca/environment/resources/publications/impacts-adaptation/reports/municipalities/10081
16Kawartha Lake Stewards Association
264 Bass Lake Road Trent Lakes Ontario K0M 1A0
kawarthalakestewards@yahoo.ca
own GHG emissions. Canada’s per capita emissions have dropped 14% since 2005. In 2005
Canada’s total emissions from all sources were about 22.7 tonnes CO2 eq/capita; by 2017 they
were 19.5 tonnes CO2 eq/capita. 31 However, a per capita value doesn’t equate to a household
or an individual’s GHG production rate. Permanent and seasonal Kawartha residents are
constrained by some measure in the means to reduce GHG emission. Outside the urban areas in
the Kawartha region, options to substitute energy use or take advantage of alternative
transportation are limited. By virtue of lifestyle, necessity and opportunities to enjoy the
recreational experience offered in the Kawarthas, we are in many ways tied to the use of fossil
fuels. Some of you may recall the Federal government’s initiative to have each Canadian reduce
their emissions by one tonne. Comedian Rick Mercer led the charge with a series of commercials.
At that time, 2004, the average Canadian produced about 5 tonnes of GHG emissions per year –
about ¼ of Canada’s total emissions.32 While the ad campaign that was initiated was ineffective,33
the idea of each of us taking responsibility for our own emissions resonates with most Canadians.
The Deep Decarbonization Pathways Project determined that in order to hold the global
temperature rise to 2˚C or less, everyone on Earth will need to average an annual carbon
footprint of 1.7 tonnes by 2050.34 There are a number of publicly available tools that can be
used to calculate one’s carbon footprint. Once an individual’s or household GHG use is known,
measures can be employed to manage our carbon footprint.35 There is no shortage of those who
suggest ways to reduce individual carbon footprints – some are reasonable.36
Action #2 Environmental monitoring, measurement and program assessment
Virtually every publication cited in this article calls for monitoring key environmental variables.
Monitoring can serve the purpose of validating model results and assessing trends to determine
what actions are required. Shoreline communities and lake managers need the most up-to-date
and locally relevant information in order to be in the best position to anticipate and adapt to
changes. Furthermore, shoreline residents are more likely to take action on their own properties
if they are engaged in collecting data, and if they are well-informed with local and current
climate-related information and adaptation/resilience options.
KLSA and its partners propose undertaking a multi-year project to collect information on lake
temperatures and dissolved oxygen measurements. This program will need to be long term to
assess climate changes.
31
Assuming on average each tree absorbs 0.063 tonne of CO 2/a, each Canadian would need to plant 309 trees.
32
https://danielquinn.org/blog/take-the-one-tonne-challenge/
33
https://www.theglobeandmail.com/news/national/the-challenge-no-one-understands/article18240876/
34
https://blogs.ei.columbia.edu/2018/12/27/35-ways-reduce-carbon-footprint/
35
Two of the tools are: http://www.carbonzero.ca/calculate and https://treecanada.ca/reforestation-carbon-
offsetting/carbon-offsetting/carbon-calculator/
36
For some suggestions, see http://www.globalstewards.org/reduce-carbon-footprint.htm
17Kawartha Lake Stewards Association
264 Bass Lake Road Trent Lakes Ontario K0M 1A0
kawarthalakestewards@yahoo.ca
Upon consultation with our scientific advisors, it was suggested that one of the most direct
effects of climate change will be on lake temperatures. As noted above, dissolved oxygen is
important for aquatic species and is essential to prevent internal loading of nutrients from the
sediments into the lake. Low levels of dissolved oxygen have been observed in some of the
Kawartha Lakes (Hill 2018). The Environmental Council for Clear, Ston(e)y and White Lakes
recognized the importance of dissolved oxygen measurements and has initiated an annual
summer sampling program (Baxter 2020).37,38
The results of the study will be used to determine if mitigating strategies for variables such as
phosphorus loadings need to be implemented or enhanced, as well as being used to determine
the effectiveness of programs developed to “remove/mitigate watershed and in-stream features
that contribute to stream warming, and install/maintain features that contribute to stream
cooling” (Kawartha Conservation 2016). Lastly, the results will provide residents, business
communities, and municipal governments information on the state of the lakes’ physical
properties and anticipated ecological changes.
Conclusion
Natural ecosystems have evolved over a number of successional events and change is inherent
to all aspects of the Earth’s biosphere.39 The “world we are entering is not an impossible one in
which to live” (Sale 2016) and with the onslaught of anthropogenic climate change we too, need
to plan, prepare, reduce and adapt. As stated in the Muskoka Climate Change Report 40 which
can equally apply to the Kawartha region:
“Climatic changes likely to come to Muskoka by mid-century are manageable if we plan ahead
and take adaptive action. Our experience will be better, and the expense we will incur in adapting
to the new climate will be less, if we begin that planning and those actions now”.
Let’s make it so.
37
http://www.environmentcouncil.ca/dissolved-oxygen-key-indicator-of-aquatic-health/.
38
For an overview on some factors that affect dissolved oxygen levels in one of the Kawartha Lakes see:
https://www.youtube.com/watch?v=eM08-j0v45Q and https://www.youtube.com/watch?v=vbXSllV6fWg.
39
Currently, the world’s forests store more carbon than is in the entire atmosphere. Yet, deforestation contributes
11 percent of global greenhouse gas emissions — more than all passenger cars combined.
40
See Sale 2016.
18Kawartha Lake Stewards Association
264 Bass Lake Road Trent Lakes Ontario K0M 1A0
kawarthalakestewards@yahoo.ca
References
Alofs, K.M., D.A. Jackson and N.P. Lester. Ontario freshwater fishes demonstrate differing range-
boundary shifts in a warming climate. Divers. 2014.
Baxter S., V. Castro. 2020. Temperature and Dissolved Oxygen in Clear and Stony Lakes. Climate
Change and Citizen Science in the Kawarthas. KLSA 2019 Lake Water Quality Report.
https://klsa.wordpress.com/.
Berry G. et al. 2011, Peterborough Field Naturalists. Nature in the Kawarthas. Chapter 2, Regional
Ecosystems.
Brinker, S.R., M. Garvey and C.D. Jones. 2018. Climate change vulnerability assessment of species
in the Ontario Great Lakes Basin. Ontario Ministry of Natural Resources and Forestry, Science and
Research Branch, Peterborough, ON. Climate Change Research Report CCRR-48. 85 p. + append.
Burke M. et. al. 2015. Global non-linear effect of temperature on economic production. Nature.
Bush, E. and Lemmen, D.S., editors. 2019.: Canada’s Changing Climate Report. Government of
Canada. 444 p. see Box 8.1.
Buttle J. 2019. Lake ice dynamics and the Kawarthas: Climate change at your dock. Kawartha Lake
Steward Association Spring meeting.
Crins, W. J., Paul A. Gray, Peter W.C. Uhlig, and Monique C. Wester. 2009. The Ecosystems of
Ontario, Part I: Ecozones and Ecoregions. Ontario Ministry of Natural Resources, Peterborough
Ontario, Inventory, Monitoring and Assessment, SIB TER IMA TR- 01, 71pp.
Dolbey M. 2015. Analysis of Ontario Lake Partner Program: Total Phosphorus Data for the
Kawartha Lakes. The Nature of our Lakes. KLSA 2014 Lake Water Quality Report.
https://klsa.wordpress.com/.
Dolbey M. 2016. Investigation of apparent increase in Total Phosphorus between Cameron Lake
and Sturgeon Lake. Protecting the Natural Beauty Around Us. KLSA 2015 Annual Lake Water
Quality Report. https://klsa.wordpress.com/.
Dove-Thompson, D., C. Lewis, P.A. Gray, C. Chu and W.I. Dunlop. 2011. A summary of the effects
of climate change on Ontario’s aquatic ecosystems. Ont. Min. Nat. Resources., Appl. Res.
Develop. Br., Sault Ste. Marie, ON. Clim. Change Res. Rep. CCRR-11. 68p.
Edwards B. A. et al. 2016. Using Climate and a Minimum Set of Local Characteristics to Predict
the Future Distributions of Freshwater Fish in Ontario, Canada, at the Lake-Scale. Global Ecology
and Conservation.
https://reader.elsevier.com/reader/sd/pii/S2351989416300026?token=4CE567215008CDFB38FED569C81DDA3BA90B51456DD
8ADFBDB54B92810C1EF0FC630CD5964539A2925BC0E896618214B.
19Kawartha Lake Stewards Association
264 Bass Lake Road Trent Lakes Ontario K0M 1A0
kawarthalakestewards@yahoo.ca
Environment and Climate Change Canada. 2019. National Inventory Report 1990–2017:
Greenhouse Gas Sources and Sinks in Canada: Executive Summary. Issued by the Pollutant
Inventories and Reporting Division.
ESTR Secretariat. 2016. Mixed wood Plains Ecozone evidence for key finding summary. Canadian
biodiversity: ecosystem status and trends 2010, Evidence for Key Findings. Summary Report No.
7. Canadian Councils of Resource Ministers. Ottawa, ON. x + 145 p.
Fausto E. Undated. State of Climate Change Science in the Great Lakes Basin: A Focus on
Climatological, Hydrological and Ecological Effects. Ontario Climate Change Consortium.
Garroway C.J. et al. 2010. Climate change induced hybridization in flying squirrels. Global Change
Biology 16: 113–121.
Gibbons K.J. 2016. Effect of Temperature on Phosphorus Release from Anoxic Western Lake Erie
Sediments. MSc Thesis. University of Toledo.
Hewer M., Daniel Scott & Adam Fenech. 2016. Seasonal weather sensitivity, temperature
thresholds, and climate change impacts for park visitation, Tourism Geographies, 18:3, 297-
321, DOI: 10.1080/14616688.2016.1172662.
Hill C., C. Houston, M. Van Meer, C. Vieau. 2018. Report on the Status of Dissolved Oxygen Levels
in Pigeon, Lovesick and Stony Lakes. Fleming College. https://klsa.wordpress.com/.
Kawartha Conservation. 2016. Climate Change Strategy. 277 Kenrei Road, Lindsay ON.
KawarthaConservation.com.
Laird K.R., B. Cumming. 2018. Assessment of Algal And Elemental Changes in Three Kawartha
Lakes: A Paleolimnological Assessment. Queen's University, Kingston. Paleoecological
Environmental Assessment and Research Laboratory (PEARL). https://klsa.wordpress.com/.
McDermid, J., S. Fera, and A. Hogg. Undated. Climate Change Projections for the Lake Ontario
watershed: An updated synthesis for policymakers and planners. Ontario Ministry of Natural
Resources and Forestry.
McDermid, J.L., S.K Dickin, C.L. Winsborough, H. Switzman, S. Barr, J.A. Gleeson, G.
Krantzberg, P.A. Gray. 2015a. State of Climate Change Science in the Great Lakes Basin: A
Focus on Climatological, Hydrological and Ecological Effects. Prepared jointly by the Ontario
Climate Consortium and Ontario Ministry of Natural Resources and Forestry to advise Annex
9 - Climate Change Impacts under the Great Lakes Water Quality Agreement, October 2015.
McDermid, J.L., S. Fera and A. Hogg. 2015b. Climate change projections for Ontario: An updated
synthesis for policymakers and planners. Ontario Ministry of Natural Resources and Forestry,
Science and Research Branch, Peterborough, Ontario. Climate Change Research Report CCRR-44.
20Kawartha Lake Stewards Association
264 Bass Lake Road Trent Lakes Ontario K0M 1A0
kawarthalakestewards@yahoo.ca
McGrath. M. 2020. Climate change: Worst emissions scenario 'misleading', British Broadcasting
Correspondent.
McKenney, D.W. 2010. Current and Projected Future Climatic Conditions for Ecoregions and
Selected Natural Heritage Areas in Ontario. Climate Change Research Report CCRR-16.
Minns C.K. B.J. Shuter and S.R. Fung. 2014. Regional Projections of Climate Change Effects on Ice
Cover and Open-Water Duration for Ontario Lakes Using Updated Ice-Date Models.
Climate Change Research Report CCRR-40.
MIRARCO. Undated. Climate Impacts and Adaptation Resources. Poster. Laurentian University,
Sudbury, Ontario, Canada
Morand A., A. Douglas. Undated. Biodiversity In a Changing Climate: Impacts and adaptation in
Ontario. Ontario Centre for Climate Impacts and Adaptation Resources, Mirarco.
Napier W.A. 2019a. The Impact of Climate Change on the Kawarthas. Our Kawartha Lakes: Past,
Present, Future. KLSA 2018 Annual Lake Water Quality Report. https://klsa.wordpress.com/
Napier W.A. 2019b. Part 2 Historical Lake Productivity Levels. Our Kawartha Lakes: Past, Present,
Future. KLSA 2018 Annual Lake Water Quality Report. https://klsa.wordpress.com/
Parks Canada. 2017. Office of the chief ecosystem scientist. Let’s Talk about Climate Change:
Great Lakes Region.
Rex E. 2013. Harmful Algal Blooms Increase as Lake Water Warms - Increasing temperatures as
a result of climate change have aided blooms of algae. Scientific American.
https://www.scientificamerican.com/article/harmful-algal-blooms-increase-as-lake-water-
warms/.
Robinne R.N., et al. 2018. A spatial evaluation of global wildfire-water risks to human and
natural system. Science of the Total Environment.
Roman A. November 19, 2019. We need to stop pretending the Paris Agreement will fix the
'climate crisis' Opinion: Are we really willing to suffer painfully high taxes to fund new energy
infrastructure while China and others massively increase their emissions? Financial Post.
Sale P., Richard Lammers, Norman Yan, Neil Hutchinson, Kevin Trimble, Paul Dinner, Piret Hurrell,
Jan McDonnell, and Scott Young, 2016. Planning for Climate Change in Muskoka. A Report from
the Muskoka Watershed Council. Muskoka Watershed Council, Muskoka, Canada, 52 pages.
Spence T. 2016. Climate Change, the Trent-Severn Waterway and the Reservoir Lakes. Coalition
for Equitable Water Flow. Presentation to Environment Haliburton Enviro-Café.
21Kawartha Lake Stewards Association
264 Bass Lake Road Trent Lakes Ontario K0M 1A0
kawarthalakestewards@yahoo.ca
Spence T. 2019a. A CEWF Perspective on the Context for 2019 Water Management in the TSW
Reservoirs Lots of snow and extreme spring rain followed by drought in 2019! Coalition for
Equitable Water Flow.
Spence T. 2019b. Overview of the Coalition for Equitable Water Flow and the TSW and Review of
Water Management Across the TSW Reservoirs with Focus on Soyers Lake Area. Soyers Lake
Meeting –July 6, 2019. Coalition for Equitable Water Flow.
Van Zuiden T. M. et al. 2016. Projected impacts of climate change on three freshwater fishes and
potential novel competitive interactions. Biodiversity and Distributions.
https://onlinelibrary.wiley.com/doi/full/10.1111/ddi.12422.
Varrin, R., J. Bowman and P.A. Gray. 2007. The known and potential effects of climate change on
biodiversity in Ontario's terrestrial ecosystems: Case studies and recommendations for adaptation.
Ont. Min. Nat. Resour., Appl. Res. Develop. Br., Sault Ste. Marie, ON. Clim. Change Res. Rep. CCRR-
09. 47p.
Walpole A. A., Bowman J. 2011. Wildlife Vulnerability to Climate Change: An assessment for the
Lake Simcoe Watershed. Wildlife Research and Development Section, Ontario Ministry of Natural
Resources.
White M. 2006. Phosphorus and the Kawartha Lakes (Land use, Lake Morphology and Phosphorus
Loading). Kawartha Lake Stewards Association. https://klsa.wordpress.com/
Woolway R., C.J. Merchant. 2019. Worldwide alteration of lake mixing regimes
in response to climate change. Nature Geoscience. VOL 12.
22You can also read