Climate change vulnerability assessment of the main marine commercial fish and invertebrates of Portugal
←
→
Page content transcription
If your browser does not render page correctly, please read the page content below
www.nature.com/scientificreports
OPEN Climate change vulnerability
assessment of the main marine
commercial fish and invertebrates
of Portugal
Juan Bueno‑Pardo1*, Daniela Nobre1, João N. Monteiro1, Pedro M. Sousa1,
Eudriano F. S. Costa1, Vânia Baptista1, Andreia Ovelheiro1, Vasco M. N. C. S. Vieira2,
Luís Chícharo3, Miguel Gaspar4, Karim Erzini1, Susan Kay5, Henrique Queiroga6,
Maria A. Teodósio1 & Francisco Leitão1
This is the first attempt to apply an expert-based ecological vulnerability assessment of the effects
of climate change on the main marine resources of Portugal. The vulnerability, exposure, sensitivity,
adaptive capacity, and expected directional effects of 74 species of fish and invertebrates of
commercial interest is estimated based on criteria related to their life-history and level of conservation
or exploitation. This analysis is performed separately for three regions of Portugal and two scenarios
of climate change (RCP 4.5 and RCP 8.5). To do that, the fourth assessment report IPCC framework for
vulnerability assessments was coupled to the outputs of a physical-biogeochemical model allowing
to weight the exposure of the species by the expected variability of the environmental variables in
the future. The highest vulnerabilities were found for some migratory and elasmobranch species,
although overall vulnerability scores were low probably due to the high adaptive capacity of species
from temperate ecosystems. Among regions, the highest average vulnerability was estimated for the
species in the Central region while higher vulnerabilities were identified under climate change scenario
RCP 8.5 in the three regions, due to higher expected climatic variability. This work establishes the
basis for the assessment of the vulnerability of the human activities relying on marine resources in the
context of climate change.
Portugal has the third highest level of fish consumption per capita in the world. The Portuguese fisheries industry
represents 0.24% of the gross domestic product of the c ountry1, although it can reach much higher relevance at
a local scale2. The number of registered fishermen in 2018 was 16,164 and the total revenue of marine landings
was 291,715 1 03 €3. As in other primary sectors, provisioning from marine fisheries varies because of both envi-
ronmental and social fluctuations4. The current fast rate of environmental change induced by human activities
challenges, as never before, the capacity of response of the sector by disrupting the ecological equilibrium of the
underlying marine ecosystem5.
The coast of Portugal follows a North–South orientation and is situated in a continental west boundary at
temperate latitudes (37–42° N) (Fig. 1). As a result, the marine ecosystem of Portugal is strongly influenced by
upwelling events6, while showing strong latitudinal environmental g radients7. The likely consequences of climate
change on upwelling systems have been broadly discussed (e.g. Refs.8,9). Although the high number of variables
and their interplay makes it difficult to predict the response of these ecosystems, it has been broadly accepted that
an increase of spring and summer upwelling events are expected in the next years as a consequence of increased
thermal difference between the land and ocean surfaces, promoting the intensification of upwelling-favourable
winds and offshore a dvection8. In Portugal, between 1950 and 2010, the coastal temperature increased at a rate
1
Centro de Ciências do Mar (CCMAR), Universidade do Algarve, Campus de Gambelas, 8005‑139 Faro,
Portugal. 2Maretec, Instituto Superior Técnico, Universidade de Lisboa, Av. Rovisco Pais, 1049‑001 Lisboa,
Portugal. 3CIMA, Faculdade de Ciência e Tecnologia, Universidade do Algarve, Campus de Gambelas,
8005‑139 Faro, Portugal. 4Centro de Olhão, Instituto Português do Mar e a Atmósfera (IPMA), 8700‑305 Olhão,
Portugal. 5Plymouth Marine Laboratory, Prospect Place, The Hoe, Plymouth PL1 3DH, UK. 6Departamento de
Biologia e Centro de Estudos do Ambiente e do Mar (CESAM), Universidade de Aveiro, Campus Universitário de
Santiago, 3810‑193 Aveiro, Portugal. *email: jbuenopardo@gmail.com
Scientific Reports | (2021) 11:2958 | https://doi.org/10.1038/s41598-021-82595-5 1
Vol.:(0123456789)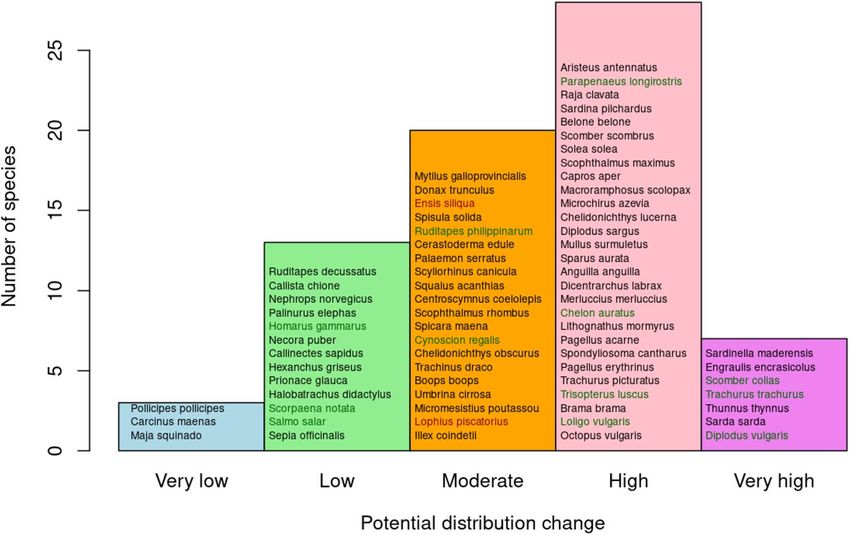
www.nature.com/scientificreports/
Figure 1. Map of Portugal showing the regions of study. The map was created using QGIS 3.10 (http://qgis.org).
of + 0.1 °C decade−1 in the Northwestern and Southwestern coasts and + 0.2 °C d ecade−1 in the Southern coast10
which points to the necessary to consider the inherent impacts of climate change along coastal areas in studies on
ecosystem productivity or fisheries (e.g. Ref.4). The frequency and intensity of upwelling events also increased in
recent years in P ortugal6 (but see Ref.11 for an opposite t rend12). These environmental changes are likely to lead to
consequences for the main fisheries of Portugal, including changes in the catch composition by the introduction
of subtropical s pecies13, or fluctuations of landings due to environmental changes with mechanistic consequences
on the recruitment of small and medium pelagics14–18 also found a general decreasing trend of landings of spe-
cies with affinity for temperate waters and an opposite trend for species with affinity for subtropical/tropical
waters, evidencing that species might respond differently to climate change due to their ecology and biology. A
big effort to understand the effect of environmental variables on marine fish landings has been paid in recent
years (e.g. Refs.4,19,20). These works relate observed fish landings to environmental time series and usually lack a
mechanistic understanding of the relationship between environment and (i) organisms ecology or (ii) fisheries
functioning, being limited to inferring the evolution of these fisheries under future scenarios of climate change.
To evaluate the potential risks posed by climate change on marine species, two strategies are commonly
used. The first one combines population models with climate models to develop mechanistic frameworks that
are projected into the future using expected future environmental parameters as driving forces (e.g. range of
models in Ref.21). These approaches are validated using environmental conditions from the past, allowing to
hindcast the population dynamics and compare them with population o bservations22. The second perspective
considers trait-based climate change vulnerability assessments to identify the most vulnerable parts of marine
systems, including both exploited organisms and exploiting communities (e.g. Refs.23,24). This method often
relies on expert judgement to estimate characteristics of the species related to their vulnerability, such as the
level of exposure to environmental change, or their r esilience25. In this context, Cheung et al.26 developed a fuzzy
logic expert system for estimating intrinsic extinction vulnerabilities of seamount fishes related to fishing. This
system evaluates certain life-history traits that are allocated into domains defined by membership functions.
The benefit of this methodology is that it can reach conclusions from premises with a gradation of truth, instead
of classifying them as true or false. Life history traits can thus be assigned to bins representing ranges of values
into which species can be allocated, allowing to add some uncertainty in the classification23,27,28. Similarly, the
Intergovernmental Panel for Climate Change (IPCC) of the United Nations developed a conceptual framework
for the assessment of the vulnerability of ecosystems, communities, and species to the impact of climate change
(climate change vulnerability assessments)29. This methodology is based on the definition of different criteria
relating to the exposure, sensitivity, and adaptive capacity of the subject of study to environmental change. Due
to the simplicity of the framework, it has been widely used by conservation managers to estimate the climate
change vulnerability of specific habitats (e.g. Ref.30), groups of species (e.g. Ref.31), and human communities (e.g.
Ref.32). Including human communities into these vulnerability assessments has been recently found to be a valu-
able tool for defining actions of anticipation and mitigation in the context of climate c hange33–35. This approach
integrates the vulnerability of human communities to the changes imposed on the ecosystem by environmental
change. Cinner et al.36, extended the conceptual framework developed by the IPCC to assess the vulnerability of
Scientific Reports | (2021) 11:2958 | https://doi.org/10.1038/s41598-021-82595-5 2
Vol:.(1234567890)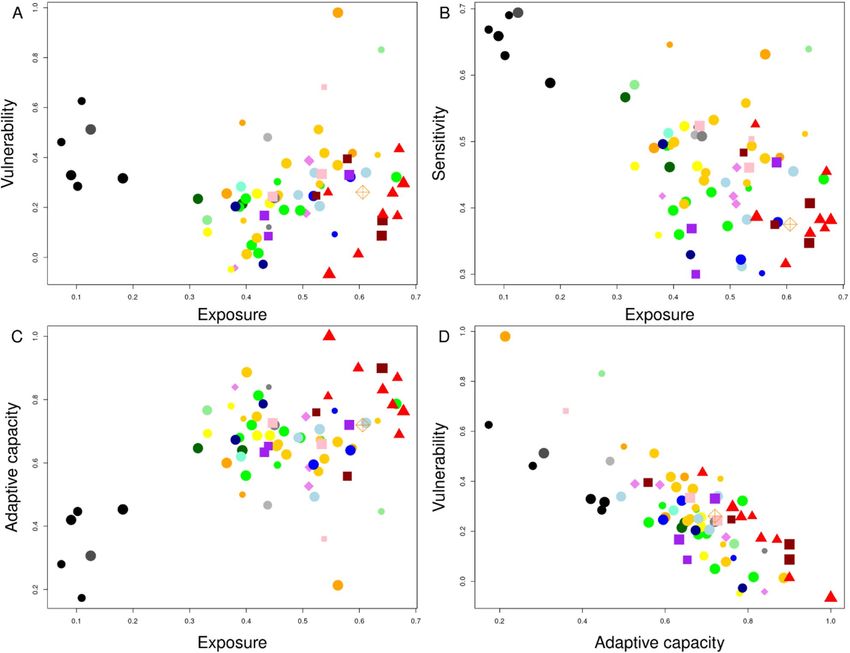
www.nature.com/scientificreports/
coral reef fisheries considering that the ecological vulnerability of the targeted species represents the exposure
of the human community to climate change (Fig. 1 in Cinner et al.36) and assessing their sensitivity and adaptive
capacity on the basis of social and economic criteria.
Here we aim at setting the basis for the assessment of the vulnerability of Portuguese fisheries by assessing
the vulnerability to climate change of the main fish and invertebrates of ecological and economical interest in the
country. Our perspective is broad and comprises many different aspects of the ecology and biology of the organ-
isms under consideration, in regards of their different biological aspects and stages of their life cycles (involving
very different environments in most cases). This wide approach poses a challenge as the information on the
biology and ecology of the initial stages of life is scarce and difficult to obtain in comparison to adult data. The
mechanisms underlying the survival of eggs and larvae in the marine system are complex, with many interrelated
variables playing very different r oles37. Also, the consequences of climate change in the upwelling-driven marine
ecosystem mentioned above are still poorly understood at the biological s cale38,39. For example, the increase of
winds promoting upwelling could be beneficial for organisms with planktonic larvae as the upwelling of deep
nutrient-rich water to the surface could promote primary production and hence favour larvae survival. But on the
other hand, the increase of upwelling could be prejudicial as stronger upwelling events could wash away larvae
from the coast, causing massive deaths and pervading recruitment back to coastal a reas40. Another example is the
different effect of the temperature increase on organisms with planktonic larvae. Higher temperature shortens
the developmental time of organisms implying that planktonic larvae have less time to disperse. This would have
a negative effect on the connectivity between populations but, at the same time, increased temperature could
contribute positively to the fecundity of f emales41. A higher number of dispersive particles would compensate
for the shorter time these particles have to reach new environments, balancing the final effect on the connectivity
between populations. The application of fuzzy t heory26 on ecological risk assessment allows to account for all this
uncertainty as different life-history characteristics can be classified by multiple categories with different degrees
of membership, and the different aspects behind a given ecological trait can be treated separately.
The separated treatment of the dimensions of vulnerability (exposure, sensitivity, and adaptive capacity,
according to IPCC’s fourth assessment report29) allows to introduce the effect of different degrees of environ-
mental variation in the assessment. In this regard, considering different levels of exposure related to different
regions or different scenarios of climate change allows us to obtain specific degrees of vulnerability. Here we
consider three regions of Portugal (North, Centre, South; Fig. 1) and two IPCC scenarios: RCP 4.5 and RCP 8.5.
For each combination of region and scenario, the level of exposure (E), sensitivity (S) and adaptive capacity (AC)
is assessed by a panel of experts, considering different life-history or fisheries-related indicators ranked in three
categories following an expert-based distribution of certainty. The establishment of a ranking of vulnerabilities
of the main Portuguese marine resources represents valuable information to establish priorities of protection and
as a first step to assess the ecological exposure of the human communities depending—directly or indirectly—on
these organisms for subsisting.
Materials and methods
Selection of species. The list of species for the vulnerability assessment was based on five different criteria.
First, we considered the proportion of each species in the total Portuguese landings between 1989 and 2015,
using public landings data from the Direção Geral dos Recursos Marinhos de Portugal (DGRM). The most
landed species, accounting for 95% of purse seine, 70% of trawling and 70% of the multigear landings, were
included. This selection was carried out separately for each combination of gear and region (Supplementary
Table SI1-1). Second, species were chosen in regards of their economic relevance, considering the species repre-
senting more than 3% of the total economic revenue of the marine landings within each combination of region
and gear (DGRM, Supplementary Table SI1-2). Third, we included the most frequent species in the discards of
Portuguese fisheries, according to the work of Leitão et al.42, where the top-ten discarded species per métier are
listed (Supplementary Table SI1-3). Fourth, we included the species of importance for the canning industry,
obtained by means of a survey covering the main can enterprises of Portugal (Supplementary Table SI1-5). Fifth,
a selection of the species of relevance for the Moroccan fisheries sector was carried out, using the reports from
the Department of Marine Fisheries of the Kingdom of Morocco43 and the FAO software FishStatJ (most cap-
tured species between 2007 and 201744) (Supplementary Table SI1-6). Additionally, due to their importance for
specific fleet segments, we included some shark species of interest that were not included by the previous criteria.
The selection of shark species was based on reports from the Instituto Português do Mar e as Pescas (IPMA) and
included: Galeus melastomus, Prionace glauca, Squalus acanthias, Scyliorhinus canicula, and Hexanchus griseus.
Some riverine species were finally removed from the list (Petromyzon marinus, Salmo trutta), as well as cod
(Gadus morhua), since it is not captured within the area of study. Finally, some extra species were pointed out by
experts during the evaluation process as species with economic interest (Pollicipes pollicipes) or with potential
distribution shift into/from the area of study in the context of climate change such as the bivalves Callista chione
and Ruditapes philippinarum, and the crabs Callinectes sapidus and Carcinus maenas. The final list of species
considered, and their functional group are shown in Table 1.
Environmental change. RCP (representative concentration pathway) scenarios of atmospheric green-
house gas concentration have been proposed by the IPCC for use in research to project the evolution of environ-
mental variables. Using scenarios RCP 4.5 and RCP 8.5 (predicting a global warming of 1.8 and 3.7 °C respec-
tively by the end of the twenty-first century) as forcing, the POLCOMS-ERSEM m odel45 forecasted a wide array
of physical, chemical and biological variables for the Northeast Atlantic and adjacent seas at a resolution of 0.1
degree (approximately 11 km). For the evaluation of the vulnerability of the species of interest, a selection of the
most cited variables with impact on the ecology of marine organisms in the Portuguese marine environment
Scientific Reports | (2021) 11:2958 | https://doi.org/10.1038/s41598-021-82595-5 3
Vol.:(0123456789)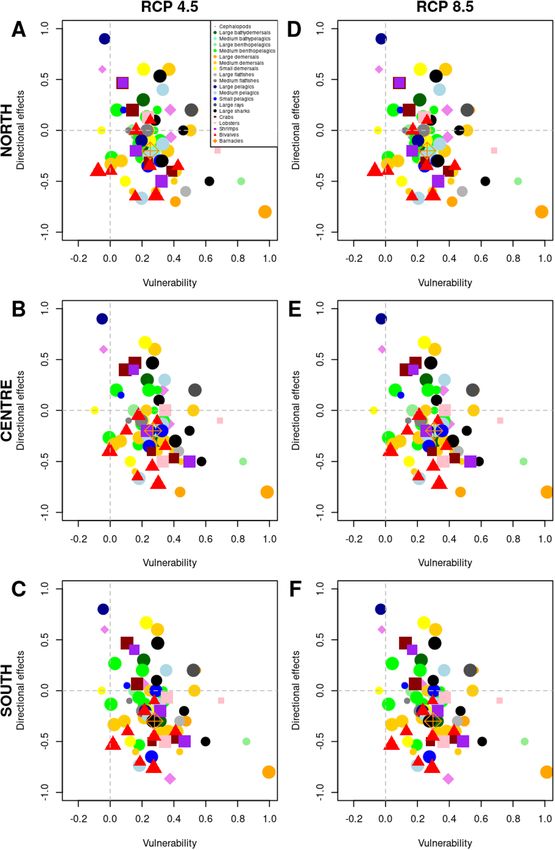
www.nature.com/scientificreports/
Functional group Species number Species Functional group Species number Species
1 Sepia officinalis Large flatfishes 38 Scophthalmus maximus
2 Octopus vulgaris 39 Scophthalmus rhombus
Cephalopods Medium flatfishes
3 Loligo vulgaris 40 Solea solea
4 Illex coindetii 41 Sarda sarda
Large pelagics
5 Lepidopus caudatus 42 Thunnus thynnus
Large bathydemersals
6 Lophius piscatorius 43 Trachurus trachurus
Medium bathypelagics 7 Brama brama 44 Scomber scombrus
Medium pelagics
8 Aphanopus carbo 45 Scomber colias
Large benthopelagics
9 Salmo salar 46 Belone belone
10 Micromesistius poutassou 47 Sardina pilchardus
11 Trisopterus luscus Small pelagics 48 Engraulis encrasicolus
12 Trachurus picturatus 49 Sardinella spp.
13 Pagellus erythrinus Large rays 50 Raja clavata
Medium benthopelagics 14 Spondyliosoma cantharus 51 Centroscymnus coelolepis
15 Diplodus vulgaris 52 Prionace glauca
16 Pagellus acarne Large sharks 53 Squalus acanthias
17 Lithognathus mormyrus 54 Scyliorhinus canicula
18 Chelon auratus 55 Hexanchus griseus
19 Merluccius merluccius 56 Callinectes sapidus
20 Conger conger 57 Necora puber
Large demersals Crabs
21 Dicentrarchus labrax 58 Maja squinado
22 Anguilla anguilla 59 Carcinus maenas
23 Sparus aurata 60 Homarus gammarus
24 Mullus surmuletus Lobsters 61 Palinurus elephas
25 Diplodus sargus 62 Nephrops norvegicus
26 Chelidonichthys lucerna 63 Parapenaeus longirostris
27 Umbrina cirrosa Shrimps 64 Aristeus antennatus
Medium demersals 28 Boops boops 65 Palaemon serratus
29 Trachinus draco 66 Callista chione
30 Chelidonichthys obscurus 67 Cerastoderma edule
31 Scorpaena notata 68 Ruditapes decussatus
32 Halobatrachus didactylus 69 Ruditapes philippinarum
33 Cynoscion regalis Bivalves 70 Spisula solida
34 Microchirus azevia 71 Ensis siliqua
Macroramphosus
35 72 Donax trunculus
Small demersals scolopax
36 Capros aper 73 Mytilus galloprovincialis
37 Spicara maena Barnacles 74 Pollicipes pollicipes
Table 1. Species and functional groups considered during the climate change vulnerability assessment.
was carried out (e.g. Refs.7–9). As a result, these variables were finally considered: sea surface temperature (SST,
°C), surface pH, surface salinity (psu), surface zooplankton biomass (mol m−3), surface phytoplankton biomass
(mol m−3), surface northward and eastward current velocities (m s−1) and river discharge (m−3 year−1). The zoo-
plankton and phytoplankton biomass were summed to obtain an overall plankton biomass (mol m −3) which was
finally used in the assessment of vulnerability. Surface variables were calculated using the top sigma layer of the
outputs of the model.
Two time slices of the POLCOMS-ERSEM outputs were used to define two periods for comparison. The
first was between 2000 and 2019 setting a reference point for the state of the environment at the beginning of
the century (hereafter “reference”), then, the period between 2040 and 2059 served to define the likely state of
the environment in the near future (hereafter “future”). Defining the future and reference periods allowed us to
compare the expected degree of change of the environmental variables between both periods. To do this on a
regional basis, we considered the outputs of the model for each region of Portugal (North, Centre, and South;
Fig. 1) and calculated a dimensionless variation index (VI) using the mean of each variable during the reference
and future periods, and the standard deviation of the reference period:
µ future − µ reference
VI = , (1)
σ reference
Scientific Reports | (2021) 11:2958 | https://doi.org/10.1038/s41598-021-82595-5 4
Vol:.(1234567890)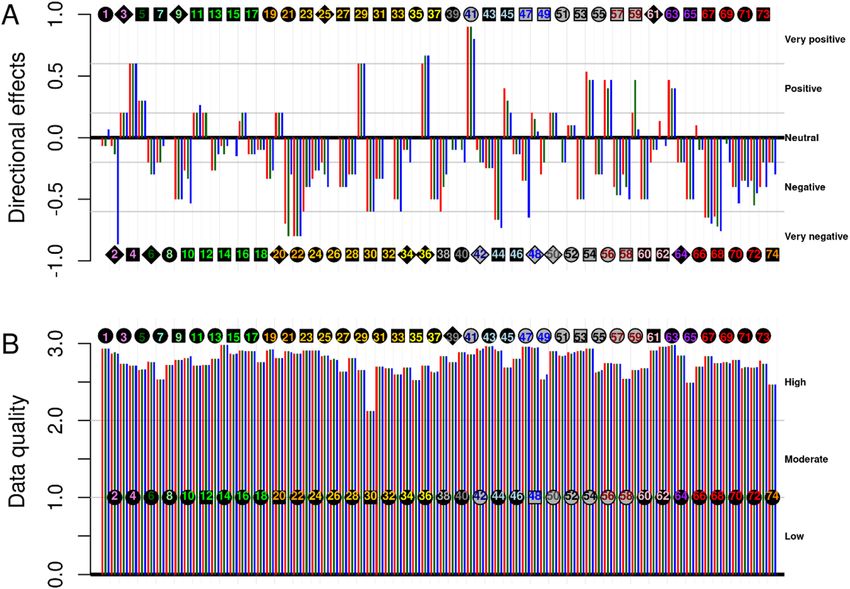
www.nature.com/scientificreports/
Variable Region Scenario Average reference Average future SD reference VI Weight factor 1 Weight factor 2 Final weight factor
RCP 4.5 16.1187 − 0.21 1.0248 1.8 1.4124
North 16.2109 0.4237
RCP 8.5 16.1634 − 0.11 1.0118 1.8 1.4059
RCP 4.5 17.5855 + 0.43 1.0514 1.8 1.4257
SST (°C) Centre 17.3394 0.5673
RCP 8.5 17.6430 + 0.53 1.0639 1.8 1.4319
RCP 4.5 19.4834 + 0.78 1.0947 1.8 1.4473
South 19.1247 0.4566
RCP 8.5 19.8362 + 1.55 1.1898 1.8 1.4948
RCP 4.5 35.0774 − 2.01 1.2453 1.2 1.2226
North 35.3938 0.1574
RCP 8.5 34.9138 − 3.04 1.3731 1.2 1.2865
RCP 4.5 35.5385 − 4.24 1.5207 1.2 1.3603
Salinity (PSU) Centre 35.7099 0.0403
RCP 8.5 35.3814 − 8.14 2 1.2 1.6000
RCP 4.5 35.7443 − 0.86 1.1046 1.2 1.1523
South 35.8391 0.1094
RCP 8.5 35.6166 − 2.03 1.2482 1.2 1.2240
RCP 4.5 8.1407 − 1.47 1.1801 1 1.0900
North 8.1784 0.0254
RCP 8.5 8.1406 − 1.48 1.1804 1 1.0902
RCP 4.5 8.1823 − 6.02 1.7399 1 1.3699
pH Centre 8.2380 0.0092
RCP 8.5 8.1715 − 7.19 1.8835 1 1.4417
RCP 4.5 8.1903 − 3.55 1.4358 1 1.2179
South 8.2290 0.0108
RCP 8.5 8.1807 − 4.44 1.5446 1 1.2723
RCP 4.5 − 0.0098 − 0.15 1.0166 2 1.5083
North -0.0066 0.0211
RCP 8.5 − 0.0185 − 0.56 1.0671 2 1.5335
Eastward current (m s−1)
RCP 4.5 − 0.0206 − 0.35 1.0411 2 1.5206
Centre -0.0152 0.0156
RCP 8.5 − 0.0165 − 0.08 1.0085 2 1.5043
RCP 4.5 0.0071 − 0.25 1.0028 2 1.5014
Northward current (m s−1) South 0.0052 0.0473
RCP 8.5 0.0035 − 0.03 1.0027 2 1.5013
RCP 4.5 0.0112 + 0.40 1.0472 1.6 1.3236
North 0.0099 0.0031
RCP 8.5 0.0116 + 0.52 1.0625 1.6 1.3312
Plankton concentration RCP 4.5 0.0095 + 0.31 1.0362 1.6 1.3181
Centre 0.0086 0.0027
(mol m−3) RCP 8.5 0.0102 + 0.54 1.0647 1.6 1.3324
RCP 4.5 0.0067 + 0.164 1.0177 1.6 1.3088
South 0.0064 0.0019
RCP 8.5 0.0067 + 0.13 1.0152 1.6 1.3076
RCP 4.5 761,171 + 0.14 1.0163 1.4 1.2082
North 734,209 181,656
RCP 8.5 731,350 − 0.01 1 1.4 1.2000
−3 −1
RCP 4.5 162,081 + 0.24 1.0279 1.4 1.2140
River flow (m s ) Centre 144,533 72,258
RCP 8.5 140,402 − 0.05 1.0051 1.4 1.2025
RCP 4.5 296,071 + 0.41 1.0485 1.4 1.2243
South 255,960 97,765
RCP 8.5 243,390 − 0.12 1.0139 1.4 1.2069
Table 2. Expected physical variability between 2000–2019 (reference) and 2040–2059 (future) according to
POLCOMS-ERSEM physical-biogeochemical model. Outputs are shown considering three regions of Portugal
(North, Centre, South) and two scenarios of climate change (RCP 4.5 and RCP 8.5). Weight factor 1 captures
the degree of variability of the physical variables (see “Methods”). Weight factor 2 represents the likely impact
on the physiology of the marine organisms and was obtained from the experts’ criteria. The final weight factor,
used in the vulnerability assessment, is the average between weight factor 1 and 2.
where µ future and µ reference represent the regional average values of the corresponding time slice of the vari-
able, and σ reference is the standard deviation of the regional values in the reference time slice (except for the
variable river discharge, for which the average and standard deviation are calculated on a temporal basis) VI
takes theoretical values between 0 (when there is no variation between future and reference) and ± infinite (when
reference shows no variation all over the region of study). VI was used to weight the influence of each variable
in the assessment of the exposure of the species to climate change n Table 2. The idea was to capture the degree
of variability of each physical variable, so species exposed to the most variable environmental conditions would
be more exposed to the effects of climate change. Then, a weight factor was calculated normalizing between 1
and 2 the absolute values of the VI defined above (“weight factor 1” in Table 2).
Since two versions of the future period were available (climate change scenarios RCP 4.5 and RCP 8.5), the
level of exposure to changing environmental variables was calculated separately for both climate change scenarios,
making it possible to estimate the overall vulnerability of the species under each scenario separately.
Beyond the degree of variability of each variable, a panel of experts on the ecology of marine organisms of
Portugal was asked to rank, according to the likely impact on the physiology of marine organisms, the physical
variables under consideration. Each expert was asked to order the variables independently, but a consensus
Scientific Reports | (2021) 11:2958 | https://doi.org/10.1038/s41598-021-82595-5 5
Vol.:(0123456789)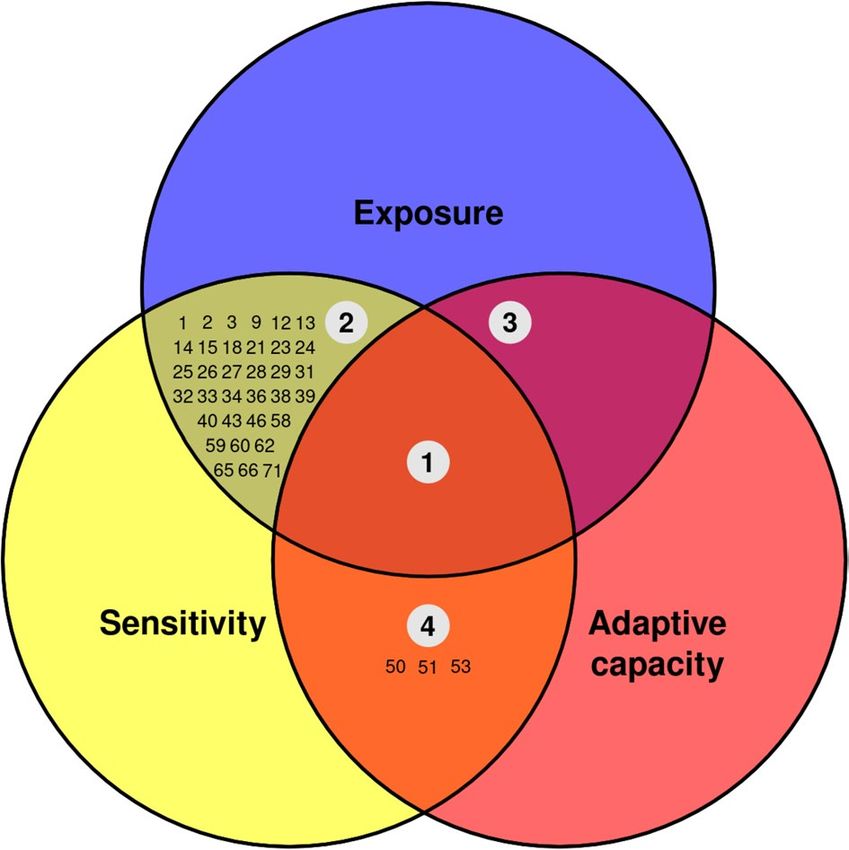
www.nature.com/scientificreports/
answer was finally asked from them. The ranking of the physical variables was posteriorly transformed numeri-
cally between 1 and 2, being 1 the less relevant variable and 2 the most relevant variable. Intermediate variables
got a value between 1 and 2 following equally distanced steps (see “weight factor 2” in Table 2). The final weight
given to each physical variable during the vulnerability assessment was calculated as the average between weight
factors 1 and 2 (“final weight factor” in Table 2). It was possible to estimate this parameter for all the exposure
indicators with exception of the extreme events frequency, which was not included in the POLCOMS-ERSEM
outputs. The likely evolution of this parameter is controversial and thus, a final weight factor of 1 was assigned
by consensus with the panel of experts. In the case of oceanic currents, considered as a proxy for upwelling, we
considered eastward currents in the North and Centre regions (North–South oriented coast) and northward
currents in the South region (East–West oriented coast).
Vulnerability assessment. Indicators. The vulnerability of the species to climate change was evaluated
following the conceptual framework described in the 4th Assessment Report of the IPCC29. This approach as-
sumes that the vulnerability (V) of species to environmental change is a function of: (1) their exposure (E) to
the changing environmental variables (defined as the overlap between the expected geographic range of change
of the variables and the area/habitats of occurrence of a given species), (2) their sensitivity (S) to environmental
change (considered as the degree to a which extent a given species will be affected—in terms of population dy-
namics or life-history traits—by a change in the environment), and (3) their adaptive capacity (AC) to environ-
mental change (understood as the mechanisms of a given species to resist to a specific change of the environment
and recover to the state prior to the perturbation).
For each species, the degree of exposure, sensitivity and adaptive capacity was evaluated considering different
aspects (hereafter “indicators”) of its biology, ecology, and exploitation (see Supplementary SI2 for a description
of the indicators). The selection of the indicators was made considering the context of climate change in the
Portuguese marine environment. Hence, for the level of exposure, the most referenced environmental variables
with impact on the ecology of the species of interest were chosen. For the analysis of the sensitivity, a selection
of life history traits driving the relationship between the species’ population dynamics and the environment was
carried out based on existing literature (e.g. Refs.23,26,28,36). The traits finally considered were: trophic level, fecun-
dity, number of reproductive events in a lifetime, egg spawning strategy, individual growth parameters (growth
coefficient, k, in Von Bertalanffy’s growth function), age at maturity, longevity, intrinsic population growth rate
(r), sexual strategy (gonochorism, hermaphroditism or protogyny/protandry), length of the spawning seasons,
planktonic larval duration (PLD), latitudinal range of distribution, temperature range of distribution, adult
mobility, seasonal migrations, sociability, and complexity of the reproductive strategy. The adaptive capacity
of the species was analysed considering different aspects related to the degree of conservation or exploitation
of the species and the kind of fisheries associated, which give an idea of the capacity of response of the popula-
tions to environmental change at a national or regional scale. In this case we considered: the ICES stock status
(referred to Portuguese or Iberian stocks when available), the general replenishment potential of the species,
related to different life-history parameters such as growth and reproduction, the vulnerability degree assigned
by the IUCN, the specific vulnerability to fisheries assessed in Cheung et al.26, and the fishing pressure suffered
by each species in Portuguese waters.
Expert’s assessment. To evaluate each species from the point of view of each indicator, a fuzzy logic expert-
judgement method was applied26. This method consists of categorizing the range of possible answers or values of
each indicator into three levels (bins) corresponding to low, moderate, or high levels of exposure, sensitivity and
adaptive capacity, respectively. The number of levels considered (3) has been found to be sufficient for this kind
of study28,46, and their ranges were defined for each indicator following the existing literature, adjusting their
values to the reality of the Portuguese marine environment. For a description of the levels within each indicator
see Supplementary SI2.
Assigning each species to each bin of each indicator was carried by a group of experts in marine biology and
ecology with experience in the Portuguese marine environment. A variable number of species was assigned to
each expert in regards of their field of knowledge and previous experience. Each species received a minimum
of three experts and a maximum of four. The number of tallies assigned to each bin of each indicator (variable
between 0 and 5) represented the degree of confidence in the answer. In this way, an absolute confidence in the
answer provided was represented by allocating 5 tallies in the corresponding bin, while spreading the five tallies
among the three bins meant the highest level of uncertainty. In order to avoid biases in the expert evaluations,
each expert was provided with the description of the indicators and their bins found in Supplementary SI2, the
maps of climate variability found in Supplementary SI3, and a list of online resources to consult. The experts
were allowed to consult any other scientific literature for their evaluations if needed.
After the evaluation of each indicator of exposure, sensitivity and adaptive capacity, each expert was asked to
provide a formed opinion on the likely direction of the effects of climate change for each species. This directional
effect (DE) evaluation had two steps: (1) the allocation of five tallies among three bins representing negative,
neutral, or positive DE, and (2) providing a short rationale text explaining the allocation of tallies among the bins.
Experts were also asked to score the quality of the data used to distribute the tallies among the bins of each
indicator following the methodology of Hare et al.23. In this case, the experts should assign a value between 0 and
3 to describe the quality of the information. These values correspond to (0) No Data. No information is avail-
able to provide an opinion; (1) Expert Judgement. The distribution of tallies among the bins reflects the expert
judgement, based on knowledge of the general ecology of the species and its role on the ecosystem; (2) Limited
Data. The data used to distribute the tallies may come from similar species or from other geographic regions out
Scientific Reports | (2021) 11:2958 | https://doi.org/10.1038/s41598-021-82595-5 6
Vol:.(1234567890)www.nature.com/scientificreports/
of the Iberian Peninsula; (3) Adequate Data. The score is based on data observed, modelled or directly measured
for the species in question and is provided by scientific work carried out in the Iberian Peninsula.
After the individual assessments, a 2-day workshop was carried out where the experts were asked to discuss
their evaluations and provide a summarizing text on the likely sign of directional effects of climate change on
each species. They were also allowed to modify the distribution of tallies of their votes for the directional effects
after the discussion.
Regional evaluation. Each expert was asked to perform the evaluation of each indicator independently for each
region of Portugal (North, Centre and South; Fig. 1). This procedure made it possible to obtain, for a given spe-
cies, region-specific assessments of E, S, AC and DE, which could be finally translated into region-specific overall
vulnerability assessments.
Calculation of the overall vulnerability score. For each species, the number of tallies assigned by the experts
to each bin of each indicator was averaged. Then, each tally was assigned a different value in regards of the bin
where it was assigned: 1-low, 2-moderate, 3-high, making possible to calculate the value of each indicator by
summing the value of the tallies. The final score of the indicator (minimum: 5; maximum: 15) was standardized
between 0 and 1. To obtain the value of each dimension of the vulnerability (E, S, or AC) the sum of the values
of the related indicators standardized between 0 and 1 was computed. All the indicators had the same weight.
Finally, to calculate the overall vulnerability, the value of each dimension was standardized between 0 and
1, being V calculated as:
Vr−cc = (Er−cc + Sr ) − Acr , (2)
where subscripts indicate region (r) and climate change (cc) specificity, respectively.
The vulnerability score (Vr-cc) obtained was finally categorized as: “very low vulnerability” (Vr-cc < 0.20, note
that negative values could exist), low (0.20 < Vr-cc < 0.40), moderate (0.40 < Vr-cc < 0.60), high (0.60 < Vr-cc < 0.80),
and very high (Vr-cc > 0.80, note that values higher than 1 could exist).
Probability of distribution change. The method for assessing the potential for a change in species distribution
was adapted from that described in Hare et al.23. These authors consider that species with high adult mobility,
broadly dispersing early life stages, low habitat specificity, and high temperature sensitivity would have higher
potential to change their area of distribution in the context of climate change. Here, we adapted these criteria to
the descriptors of vulnerability considered, and calculated the probability of distribution change (P) as a func-
tion of these indicators considering that high P will be characterized by high adult mobility, long PLD, broadcast
egg spawning strategy, wide latitudinal range, and narrow temperature tolerance range. These indicators were
standardized between 0 and 1 and then considered as:
Ad.mobility + PLD + Eggsp.strategy + Lat.range − temp.range
P= . (3)
4
The range of values of P was categorized as: very high (P > 0.80), high (0.60 < P < 0.80), moderate
(0.40 < P < 0.60), low (0.20 < P < 0.40) or very low (P < 0.20).
Variability in experts’ voting. To evaluate the inter-experts’ variability in the allocation of tallies among the bins
of each indicator, a bootstrap analysis was carried out. This analysis consisted of a random sampling (10,000
iterations) with replacement of the total number of tallies allocated per indicator (5 tallies × 3 or 4 experts), cal-
culating the overall vulnerability as described before. Then, the proportion of iterations resulting in a vulnerabil-
ity of the same category (very low, low, moderate, high, or very high) as the original was computed to estimate
the variability in the assignment of vulnerability scores by the experts.
The same procedure was carried out considering the indicators needed to compute the probability of distri-
bution change and the directional effects, allowing to evaluate the certainty on these parameters independently
of the overall vulnerability.
Vulnerability categories in regards of the relationship between the components of vulnerability. Foden et al.47
described four categories of vulnerability based on the relationship between the vulnerability dimensions E, S,
and AC. The first category (“highly climate change vulnerable species”) comprises species with high E and S but
low AC, which means that they are at great risk due to climate change. The second group (“potential adapter spe-
cies”) is formed by species with high E, S, and AC, so they may be at risk due to climate change. The third group
(“potential persistent species”) considers species with high E and low S and AC, representing those species that
may not be at risk due to climate change. Finally, the “high latent risk species” are those with high S and low E
and AC, comprising species that would not be currently at risk. Different management perspectives have been
proposed for the species within each category (see Foden et al.47).
To allocate the species to these categories, we considered “highly climate change vulnerable species” those
with very high and high exposure and sensitivity, and low or very low adaptive capacity. Potential adapter species
were those with very high, high, or moderate exposure, sensitivity, and adaptive capacity. Potential persistent
species were defined as those with very high, high, or moderate exposure and very low or low sensitivity and
adaptive capacity. Finally, high latent risk species were considered those with very low or low exposure and
adaptive capacity, and very high or high sensitivity.
Scientific Reports | (2021) 11:2958 | https://doi.org/10.1038/s41598-021-82595-5 7
Vol.:(0123456789)www.nature.com/scientificreports/
Relationship between overall vulnerability and ecosystem indicators. Aiming at providing a simple but relia-
ble approximation to the assessment of the vulnerability of a given species, we also analysed the relationship
between the final vulnerability score and the different indicators used in this work by means of linear regressions.
Results
Environmental change. The outputs of the POLCOMS-ERSEM model for the period 2040–2059 under
scenarios RCP4.5 and RCP8.5 for SST, pH, salinity, currents, river flow, and zooplankton productivity are shown
in the Supplementary SI3 and Table 2. For the SST, a regional increase is expected for the Centre and South of
Portugal under both scenarios of climate change, while in the North the average temperature is expected to
decrease, overall cooling seems to be caused by offshore rather than coastal waters (Supplementary Fig. SI3-1).
The salinity is expected to be lower in the future than in the reference period (Table 2), specially under cli-
mate change scenario RCP 8.5 in the three regions, with the drop being higher in a gradient from the North to
the South. Ocean acidification is expected to increase (lower pH), especially in coastal waters (Supplementary
Fig. SI3-3), with no relevant differences between regions or climate change scenarios. The Eastward currents
intensity in the North are expected to increase under both scenarios, especially in RCP 8.5. In the Centre, sce-
nario RCP 4.5 predicts a stronger increase than RCP 8.5. The Northward currents in the South are expected
to decrease in intensity under both scenarios (Table 2). The projected plankton concentration is expected to
increase under both climate change scenarios in the three regions of Portugal (Table 2). Finally, the river flow is
expected to increase under scenario RCP 4.5 and decrease under scenario RCP 8.5.
The weight factors derived from the expected future variability (weight factor 1) are shown in Table 2. These
weight factors were standardized between 1 and 2, with the highest variation corresponding to the salinity
decrease in the South under climate change scenario RCP 4.5, and the lowest to the river flow variation in the
Centre under scenario RCP 8.5.
Following the experts’ criteria, another weight factor (weight factor 2) was defined according to the potential
influence of variables on the physiology of organisms. The variable with the highest influence on the physiology
of marine organisms was current velocity, due to its relevance for the survival and recruitment of most larval
phases. The other variables, ranked in order of importance, were SST, plankton concentration, river flow, salin-
ity and pH. The average between the weight factor 1 and 2 was computed to produce a final weight factor to be
included in the vulnerability assessment (Table 2).
Bootstrap analysis. Bootstrap analyses were carried out to quantify the variability among the experts’
answers (SI6). The bootstrap analysis on the overall vulnerability showed that the assessment of more than 60
species obtained a result equal to the original assessment in more than 80% of the iterations. This indicates a
high coherence among the experts’ answers and that the vulnerability assessments are based on uniform criteria.
The result of the bootstrap analysis for the probability of distribution change was very similar, with more than
60 species obtaining a result equal to the original assessment in more than 80% of the iterations. The bootstrap
analysis on the data quality showed a higher dispersion of the criteria of the experts, with only 25 species achiev-
ing a result equal to the original assessment in more than 80% of the iterations.
Vulnerability assessments. The experts’ evaluations for each species are compiled in Supplementary SI4.
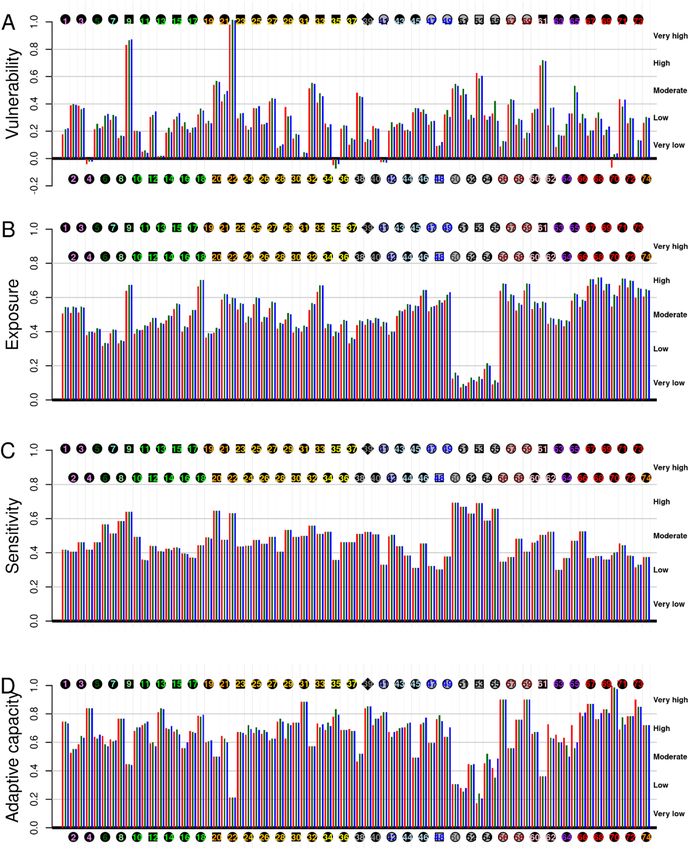
Vulnerability assessments showed important differences among species. Considering the assessment of the vul-
nerability under climate change scenario RCP 8.5 (see Supplementary Information 6 for results under climate
change scenario RCP 4.5), the vulnerability assessments ranged between ca. − 0.05 for species 35 (Macrorampho-
sus scolopax, the less vulnerable) and ca. + 0.95 for species 22 (Anguilla anguilla, the most vulnerable) (Fig. 2A).
During the assessment, only Anguilla anguilla and species 9 (Salmo salar) were ranked as very high, and species
53 and 61 (Squalus acanthias -only in the North and South- and Palinurus elephas) as high vulnerability. Eleven
species were classified as moderately vulnerable (20: Conger conger, 21: Dicentrarchus labrax, 27: Umbrina cir-
rosa, 32: Halobatrachus didactylus, 33: Cynoscion regalis, 38: Scophthalmus maximus, 50: Raja clavata, 51: Centro-
scymnus coelolepis, 55: Hexanchus griseus—only in the Centre, 57: Necora puber—only in the Centre and South,
65: Palaemon serratus—only in the Centre and South, and 71: Ensis siliqua—only in the North and South-.
The analysis of the vulnerability across regions showed the highest average vulnerability for the Centre region
(Fig. 3A–C; Table 3), with no clear pattern on the North–South axis. Considering the scenarios of climate change,
the overall vulnerability was found to be higher under climate change scenario RCP 8.5 than RCP 4.5 in the
North and Centre, while in the South overall vulnerability was slightly higher under climate change scenario
RCP 4.5 (Fig. 3D–F; Table 3). The exposure to environmental change followed the same pattern (Table 3), while
the other components of the vulnerability (S, and AC) showed no differences across regions or between climate
change scenarios (Table 3). The average estimates of the directional effects were negative in the three regions,
with an increasing gradation from the North to the South.
No general patterns were found in the overall vulnerability assessments considering the functional groups
under study, however, when analysing the components of the vulnerability separately (exposure, sensitivity, and
adaptive capacity), the functional groups behaved more as clusters (Fig. 2B–D). Considering the exposure to
environmental change, the group of large sharks and rays (species numbers 50–55) showed the lowest levels,
while, in general, invertebrates other than cephalopods (species numbers > 55) resulted to be more exposed than
cephalopods and fishes (compare the proportion of species classified as high and moderate exposure between
both groups of species in Fig. 2B). Considering the sensitivity to environmental change, the results were found
to be more or less opposite to the level of exposure, with medium bivalves (species numbers 66–73) showing the
higher values (Fig. 2C). Finally, the adaptive capacity was found to be more variable across species. In this case,
no significant differences were found between invertebrates and fishes, although the group of large sharks and
Scientific Reports | (2021) 11:2958 | https://doi.org/10.1038/s41598-021-82595-5 8
Vol:.(1234567890)www.nature.com/scientificreports/
Figure 2. Expert-based assessments of overall vulnerability, exposure, sensitivity, and adaptive capacity for the
74 species under study under climate change scenario RCP 8.5. Species are identified by the species number
as in Table 1, and functional groups are represented by the colour of the species number. For each assessment,
column colours represent the region (red: North, green: Centre, blue: South). The vulnerability and each of
its dimensions are classified in 5 bins (very low, low, moderate, high, and very high). The symbol of the points
represents the confidence of the vulnerability assessment obtained during the bootstrap analysis: circle (very
high), square (high), diamond (moderate).
Scientific Reports | (2021) 11:2958 | https://doi.org/10.1038/s41598-021-82595-5 9
Vol.:(0123456789)www.nature.com/scientificreports/
Figure 3. Relationship between overall vulnerability and directional effects for the species under study,
considering the three regions of Portugal (North, Centre, and South) and the two scenarios of climate change
(RCP 4.5 and RCP 8.5). The size of the points represents the confidence of the vulnerability assessment
according to the bootstrap analysis carried out.
rays were characterized by low to moderate adaptive capacities. The groups with the less variable inter-specific
adaptive capacities were the bivalves (overall very high adaptive capacity), and medium and small demersal fish
(species numbers between 23 and 37) with high adaptive capacity.
The assessment of the directional effects of climate change showed high inter-specific variability, with no
clear patterns found among functional groups (except for bivalves, for which overall negative directional effects
are expected) (Fig. 4A). In general, of the 74 assessments, 19 were positive in the North, 16 in the Centre, and
18 in the South, while 43 were negative in the North, 47 in the Centre, and 50 in the South. The strength of the
directional effects (especially the negative ones) was also evaluated to be higher in the South than in the North
and Centre.
Scientific Reports | (2021) 11:2958 | https://doi.org/10.1038/s41598-021-82595-5 10
Vol:.(1234567890)www.nature.com/scientificreports/
Region Vulnerability component RCP 4.5 RCP 8.5
Overall vulnerability 0.264 (0.186) 0.272 (0.186)
Exposure 0.461 (0.136) 0.469 (0.141)
North Sensitivity 0.463 (0.096) 0.463 (0.096)
Adaptive capacity 0.660 (0.159) 0.660 (0.159)
Directional effects − 0.123 (0.357)
Overall vulnerability 0.275 (0.186) 0.302 (0.186)
Exposure 0.475 (0.132) 0.502 (0.146)
Centre Sensitivity 0.463 (0.096) 0.463 (0.096)
Adaptive capacity 0.663 (0.159) 0.663 (0.159)
Directional effects − 0.136 (0.356)
Overall vulnerability 0.282 (0.184) 0.297 (0.185)
Exposure 0.482 (0.145) 0.497 (0.148)
South Sensitivity 0.463 (0.096) 0.463 (0.096)
Adaptive capacity 0.663 (0.157) 0.663 (0.157)
Directional effects − 0.164 (0.360)
Table 3. Average and standard deviation values of overall vulnerability, exposure, sensitivity and adaptive
capacity (in a scale of 0–1) and directional effects (in a scale of − 1 to 1) for each region and scenario of climate
change based on the 74 species under consideration.
Figure 4. Expert-based assessments of overall directional effects of climate change (A), and data quality for
the assessment of vulnerability (B). Species are identified by the species number, and functional groups are
represented by the colour of the species number in the square [see legend in (A)]. Geographic regions are
represented as in Fig. 2. The symbol of the points in (A) represents the confidence in the directional effects’
assessment obtained during the bootstrap analysis: circle (very high), square (high), diamond (moderate). In
(B), symbols represent the confidence in the bootstrap analysis on the vulnerability assessment. Note that these
assessments are common for climate change scenarios RCP 4.5 and RCP 8.5.
The quality of the data used for the assessments was, in general, high (Fig. 4B). A correlation between the
quality of the data and the confidence in the vulnerability assessment obtained through the bootstrap analysis
was observed (not shown).
Scientific Reports | (2021) 11:2958 | https://doi.org/10.1038/s41598-021-82595-5 11
Vol.:(0123456789)www.nature.com/scientificreports/
Figure 5. Potential for distribution change. Based on their PLD, adult mobility, egg spawning strategy,
latitudinal and temperature tolerance ranges (Eq. 3), the species were ranked for their ability to change their
distribution range. Colour fonts represent the confidence in the results for potential distribution change,
obtained during the bootstrap analysis: black (very high confidence), green (high confidence), and red
(moderate confidence).
The potential for distribution change grouped the species in five categories: very high potential (7 species),
high potential (28 species) moderate potential (20 species), low potential (13 species), and very low potential (3
species) (Fig. 5). Six of the seven species with very high potential for distribution change were pelagic fish species,
while the three species with very low potential were benthic or sessile crustaceans. The bootstrap analysis showed
high coherence among the experts’ votings, with only very high, high and moderate confidences obtained. The
species with very high distribution change potential and very high confidence based on the bootstrap analysis
were Sardinella spp., Engraulis encrasicolus, Thunnus thynnus, and Sarda sarda.
To better understand the overall vulnerability scores, the relationship between its different components
was evaluated. For each species, the relationship between the level of exposure and vulnerability, sensitivity
and adaptive capacity was estimated. The relationship between exposure and overall vulnerability was not sig-
nificant (p-value = 0.67; Fig. 6A), while the relationship between exposure and sensitivity to environmental
change was clearer and more negative (p.valuewww.nature.com/scientificreports/
Figure 6. Relationship between species exposure and (A) vulnerability, (B) sensitivity and (C) adaptive capacity
for the analysis carried out in the North region under climate change scenario RCP 8.5. Panel (D) shows the
relationship between the adaptive capacity and the overall vulnerability for the species under study. The size
of the points represents the confidence of the vulnerability assessment obtained during the bootstrap analysis.
Colour and symbol legend as in Fig. 3A.
palinurid decapods, which evolved extremely long planktonic larval periods), but also could give rise to correla-
tion among indicators. The issue of the number and correlation of indicators in vulnerability assessments is not
new28,48,49, but a consensus on the methodology (e.g., number of indicators, treatment of correlations, indicators
weighting) has not been reached y et50. Something similar happens when considering general r/k strategies as
indicators of vulnerability: while some works consider r-strategists as less vulnerable to climate change23, it has
been demonstrated that, under some circumstances, r-strategists could be more affected by climate c hange51. In
this study, including some, a priori, correlated indicators in the analysis does not seem to constitute a significant
problem because of the way the scores are averaged when calculating the value of the components of vulner-
ability (E, S, and AC).
A relevant aspect of the present work is the coupling between an expert-based vulnerability assessment
and the outputs of a physical-biogeochemical model to weight the exposure of species to the different physical
variables23. This approach allowed us to infer the vulnerability of the species in regards of two near-future cli-
mate change scenarios. Albeit high uncertainty on the evolution of upwelling systems under scenarios of climate
change has been acknowledged by the I PCC52, the outputs of the model point to an increase in the upwelling
pattern characterized by higher intensity of westward currents in the North and Centre, and higher intensity
of southward currents in the South coast (Table 2). This could explain the general enhanced productivity of
the plankton projected for the three regions and the decrease of average SST in the North. The consequences
at the biological scale of enhanced upwelling are yet poorly understood38,39, with likely positive effects by the
enrichment of surface waters with nutrients from the deep ocean, but also with potential negative effects related
to stronger currents that could wash away planktonic larvae, causing massive deaths and negatively affecting
recruitment to coastal p opulations40. The effects of increased temperature will affect many aspects of the organ-
isms’ biology and ecology. Higher temperature will shorten biological t imes53 implying that the growth and
development rates of organisms will be accelerated, not necessarily at equal velocities54. Temperature change
would also have consequences for egg s ize55 and mortality rates, in combination with hypoxia issues related to
Scientific Reports | (2021) 11:2958 | https://doi.org/10.1038/s41598-021-82595-5 13
Vol.:(0123456789)www.nature.com/scientificreports/
Figure 7. Distribution of species according to the vulnerability categories described by Foden et al.47. The
combination of the three components of vulnerability define three categories of vulnerability addressing specific
conservation implications. Area 1 “highly climate change vulnerable” comprises species with high or very high
E and S, and low or very low AC. Area 2 “potential adapters” comprises species with high or very high E, S, and
AC. Area 3 “potential persisters ”comprises species with high or very high E, and low or very low S and AC. Area
4 “high latent risk” comprises species with high or very high S, but low or very low E and AC.
increasing metabolic demand and lowering of dissolved o xygen56. Fecundity rates will also be affected as dem-
onstrated by a myriad of works studying the relationship between fish fecundity and temperature in fish and
invertebrates57. Furthermore, shortening biological times would imply that planktonic larvae and eggs would
have less time to disperse, negatively affecting the connectivity between populations. This, however, could be
compensated by a higher number of propagules if temperature would enhance the fecundity of females in a com-
plex balance between offspring number and offspring size41. Very likely, the final direction of the consequences
of increased temperature on the populations of marine organisms would be defined by local conditions (e.g.
currents exposure, eutrophication, topographic conditions, etc.)58,59 making it difficult to predict global final
population dynamics. It is also worth to mention that this study does not consider non-climate stressors that
could be already affecting the sensitivity and adaptive capacity of marine organisms (e.g., pollution, relevant land
use change, marine traffic and noise, appearance of invasive species, changing demand by consumers, etc.)60.
The two climate change scenarios considered in this work assume different pathways of CO2 emissions along
the XXI century to predict global warming increase of 1.8 °C (RCP 4.5) or 3.7 °C (RCP 8.5). To the date, histori-
cal total cumulative CO2 emissions are in closer agreement with scenario RCP 8.5, making it the most plausible
near to midterm scenario of global w arming61. In this scenario, overall environmental variability is expected to
be higher than under RCP 4.5 (Table 2), which in our vulnerability assessment translates into higher exposures
to climate change for marine organisms. A strong correlation between vulnerability and adaptive capacity was
found under both climate change scenarios (Fig. 6D and see Supplementary SI6 for RCP 4.5 results), which is,
probably, a consequence of the nature of the organisms inhabiting the Portuguese marine ecosystem. In temper-
ate ecosystems, species are subject to high annual environmental variability in relation to tropical or subtropical
ecosystems were conditions are more constant. This causes organisms from temperate systems to show high
plasticity and adaptive capacity, which also explains their overall low vulnerability to climate c hange62.
Of the 74 species analysed under scenario RCP 8.5, only two (Anguilla anguilla and Salmo salar) were ranked
as very high vulnerability, two (Squalus acanthias and Palinurus elephas) as high, and eleven as moderately vul-
nerable. In scenario RCP 4.5, results were slightly different and only Anguilla anguilla was ranked as very high,
Salmo salar as high, and five species as moderate (Supplementary SI6). High variability in the overall vulnerability
scores was found within the different functional groups, although they behaved more as clusters when evaluat-
ing the different components of the vulnerability (exposure, sensitivity, and adaptive capacity). On a regional
basis, the results from our analysis showed the highest ecological vulnerabilities in the Centre region, with no
clear North–South pattern. This variation was mostly driven by regional differences in the level of exposure to
climate change, as the other components of the vulnerability (sensitivity and adaptive capacity) were mostly the
same among regions (Table 3). This is because the available information on the ecology of the species does not
allow to allocate the tallies differentially among the bins of the indicators of sensitivity and adaptive capacity
when considering the different regions, while the level of exposure depends on the outputs of the physical-
biogeochemical model, which are region-specific.
Scientific Reports | (2021) 11:2958 | https://doi.org/10.1038/s41598-021-82595-5 14
Vol:.(1234567890)You can also read