Dynamic plant-soil microbe interactions: the neglected effect of soil conditioning time
←
→
Page content transcription
If your browser does not render page correctly, please read the page content below
Research

Dynamic plant–soil microbe interactions: the neglected effect of
soil conditioning time
Po-Ju Ke1,2            , Peter C. Zee3             and Tadashi Fukami1
1
Department of Biology, Stanford University, Stanford, CA 94305, USA; 2Department of Ecology & Evolutionary Biology, Princeton University, Princeton, NJ 08544, USA; 3Department of
Biology, University of Mississippi, University, MS 38677, USA

                                                          Summary
Authors for correspondence                                 Plant–soil feedback (PSF) may change in strength over the life of plant individuals as plants
Po-Ju Ke                                                  continue to modify the soil microbial community. However, the temporal variation in PSF is
Email: pke@princeton.edu
                                                          rarely quantified and its impacts on plant communities remain unknown.
Tadashi Fukami
                                                           Using a chronosequence reconstructed from annual aerial photographs of a coastal dune
Email: fukamit@stanford.edu                               ecosystem, we characterized > 20-yr changes in soil microbial communities associated with
                                                          individuals of the four dominant perennial species, one legume and three nonlegume. We also
Received: 6 May 2020                                      quantified the effects of soil biota on conspecific and heterospecific seedling performance in a
Accepted: 12 April 2021                                   glasshouse experiment that preserved soil properties of these individual plants. Additionally,
                                                          we used a general individual-based model to explore the potential consequences of tempo-
                                                          rally varying PSF on plant community assembly.
New Phytologist (2021) 231: 1546–1558
                                                           In all plant species, microbial communities changed with plant age. However, responses of
doi: 10.1111/nph.17420
                                                          plants to the turnover in microbial composition depended on the identity of the seedling
                                                          species: only the soil biota effect experienced by the nonlegume species became increasingly
Key words: aerial photographs,                            negative with longer soil conditioning. Model simulation suggested that temporal changes in
chronosequence, individual-based model,                   PSF could affect the transient dynamics of plant community assembly.
legume, microbial community, plant–soil
                                                           These results suggest that temporal variation in PSF over the life of individual plants should
feedback, sand dunes, space-for-time
substitution.                                             be considered to understand how PSF structures plant communities.

                                                                                            microbes (Hawkes et al., 2012; Bezemer et al., 2018; Dudenhöffer
Introduction
                                                                                            et al., 2018). Studies have shown that changes in the microbial
Plants often cause changes in the composition of the soil micro-                            community can proceed at different rates depending on host plant
bial community, which can then feed back to affect the growth of                            identity (Knelman et al., 2012; Chen et al., 2019; Hannula et al.,
neighboring plants or plant individuals that colonize the soil sub-                         2019). As a result, seedlings of the same species could face differ-
sequently, the process known as plant–soil feedback (PSF) (Bever                            ent microbial communities and experience different PSF
et al., 1997; Bever, 2003). Because plant species vary in their                             strengths, depending on the species identity of conditioning plants
effects on, and responses to, soil microbes, PSF can modify inter-                          and for how long they have modified the soil (Kardol et al., 2013b;
specific differences in plant performance, thereby affecting plant                          Peay, 2018). Moreover, plant responses to temporal changes in
community composition (Klironomos, 2002; Mangan et al.,                                     the microbial community may depend on the plant functional
2010; Eppinga et al., 2018). The strengths of these feedbacks are                           group. For example, studies have shown that legumes can be less
commonly assumed to be constant through time. Under this                                    sensitive to changes in soil properties by forming effective symbi-
assumption, most empirical studies quantify feedback strengths                              otic relationships with a range of ubiquitous rhizobia (Birnbaum
via short-term glasshouse experiments that are terminated at the                            et al., 2018; Png et al., 2019; but see Yang et al., 2020). However,
same time for all species (Kulmatiski & Kardol, 2008; Kardol                                few studies have quantified the changes in plant–soil microbe
et al., 2013a). However, given that plant individuals often arrive                          interactions with increasing soil conditioning length.
at different times and die at different ages in the field, understand-                         Two logistical challenges may explain the current paucity of
ing how feedback strengths vary over time can be critical for pre-                          relevant empirical work. First, preparing soils with different con-
dicting the consequences of PSF for plant community assembly.                               ditioning lengths for an experiment is labor-intensive and often
   The strength of plant–soil microbe interactions can vary tem-                            infeasible (Kardol et al., 2013a; Kulmatiski, 2018). Second, the
porally because of changes in the soil microbial community com-                             soil conditioning length in the field can only be quantified with
position with increasing time of soil conditioning (Lepinay et al.,                         coarse resolution due to uncertainty about the ages of individual
2018). This mechanism differs from previous studies, which typi-                            plants (e.g. Day et al., 2015; Speek et al., 2015). Moreover,
cally focused on ontogenetic changes in plant responses to soil                             although the plausible consequences of time-varying PSF for

1546 New Phytologist (2021) 231: 1546–1558                                                                                                              Ó 2021 The Authors
         www.newphytologist.com                                                                                            New Phytologist Ó 2021 New Phytologist Foundation
New
Phytologist Research 1547
plant communities can be studied theoretically, most models photographs) by comparing photographs across multiple years.
treat feedback strengths as time-independent parameters (e.g. Age estimates were used as proxies for soil conditioning length
Fukami & Nakajima, 2013; Teste et al., 2017; Ke & Wan, as the foredune undergoes primary succession starting from
2020). In this study, we overcome these challenges by using high- unconditioned bare sand. For the four dominant species, in
resolution aerial photographs of a coastal dune ecosystem that 2016 we selected individuals of different ages. In total, we
were taken annually from 1990 through 2017. These pho- selected 30 individuals of A. arenaria, 30 individuals of B. pilu-
tographs allowed us to estimate the age of individual plants and laris, 33 individuals of C. edulis, and 43 individuals of L.
use it as a proxy for soil conditioning length. By sampling soils arboreus. All individuals were selected to sample evenly along
from individual plants of different ages, we apply a chronose- the plant’s age span provided by the aerial photographs, which
quence approach to test the hypothesis that soil microbial com- ranged between 2 to 12 yr for L. arboreus and between 3 to 26
munities would vary across plant species and conditioning time. yr for the other three species. No spatial autocorrelation was
We then evaluate how changes in the soil community influenced evident for the age of selected individuals (Moran’s I,
the strength of their effects on plant performance in a glasshouse P ¼ 0:24; Mantel test, P ¼ 0:39). See Fig. 1 for a representa-
experiment that preserved plant age-specific soil properties. tive aerial photograph, the spatial distribution of selected indi-
Specifically, we test the hypothesis that the observed soil biota viduals, and representative examples of different age classes for
effects would vary with soil conditioning length and that the tem- each species.
poral patterns would differ among different plant species or func- To study how soil microbial communities varied with plant
tional groups (i.e. legume or not). Finally, to investigate potential age, in July 2016 we collected three soil samples beneath each
general consequences of time-varying PSF beyond our specific plant individual (i.e. at azimuth angles 0°, 120° and 240°; half
study system, we use an individual-based model to examine how way between the plant’s center and edge) in separate sterile 50-ml
temporal patterns of PSF may affect plant community assembly. Falcon tubes. We also collected soil samples from three randomly
selected juveniles (i.e. one sample per juvenile, which are individ-
uals that germinated within 1 yr and were too small to be visible
Materials and Methods
on the aerial photographs from the previous year) for three of the
four species (i.e. all but A. arenaria). Finally, a total of 13 soil
Study system
samples from randomly selected bare sand areas (i.e. no vegeta-
We conducted our study at the coastal foredunes of Bodega Bay, tion in a c. 3 m radius throughout the entire length of time of the
California, USA (38°190 N, 123°30 W), located within the UC aerial photographs) were collected across our field site (Fig. 1).
Davis Bodega Marine Reserve and the Sonoma Coast State All soil samples were stored at 4°C up to a week before being pro-
Beaches. This region experiences a Mediterranean climate, with cessed in the laboratory. Each soil sample was passed through a
an average annual temperature of 15.8°C and annual precipita- disposable sieve made out of 2-mm iron mesh (sterilized by soak-
tion of 760 mm, mostly occurring between October to April ing in 5% bleach for 30 s and then 95% ethanol for 30 s), and
(Barbour et al., 1973). The soils in our 400 m × 500 m study further homogenized thoroughly in separate sterile plastic bags.
area are predominantly sand, with a negligible amount of silt and The fungal and bacterial communities of the resulting 430 soil
clay (Kleinhesselink et al., 2014). The sandy top soils generally samples (i.e. 136 individuals × 3 samples + 3 species × 3 juve-
contain little organic matter and are fast draining, nitrogen-poor, niles + 13 bare sand samples) were characterized with DNA
and strongly alkaline (Barbour et al., 1973; McNeil & Cushman, sequencing.
2005; Lortie & Cushman, 2007). We focused on the four domi-
nant species of the foredune plant community, including the
DNA sequencing of fungal and bacterial communities
introduced grass Ammophila arenaria (Poaceae), the introduced
succulent dwarf-shrub Carpobrotus edulis (Aizoaceae), the native For each processed soil sample collected in July 2016, we
shrub Baccharis pilularis (Asteraceae), and the native nitrogen- extracted microbial DNA from 0.25 g of subsampled soil with
fixing leguminous shrub Lupinus arboreus (Fabaceae). The first the PowerSoil DNA Isolation Kit. We then PCR-amplified the
two species have fibrous root systems, with C. edulis having a bacterial 16S ribosomal DNA region and the fungal internal
shallower root system concentrated in the upper 50 cm of the soil transcribed spacer 1 region (ITS1) with specific primer pairs.
(D’Antonio & Mahall, 1991); the latter two species have well- Amplicon libraries were then normalized, pooled based on DNA
developed taproot systems. concentration, sequenced by the Illumina MiSeq sequencer, and
processed through a bioinformatic pipeline to obtain a rarefied
sample × operational taxonomic units (OTUs) matrix (see Sup-
Soil sampling
porting Information Methods S1 for detailed description of
We used a series of aerial photographs that were taken annually primer design and bioinformatic pipeline).
by Delta Geomatics Corporation and curated by the Bodega
Marine Reserve since 1990 (Danin et al., 1998). Since the fore-
Glasshouse experiment
dune vegetation has little vertical structure, we were able to
identify plant individuals to the species level and estimate their To examine how changes in the soil communities affect plant
age (i.e. identify the first year the individual appeared in the performance, we conducted a glasshouse experiment assessing
Ó 2021 The Authors New Phytologist (2021) 231: 1546–1558
New Phytologist Ó 2021 New Phytologist Foundation www.newphytologist.comNew
1548 Research Phytologist
all four species, we collected soils from 27 individuals (i.e. a ran-
dom subset of the previously sampled individuals) and three new
randomly selected juveniles. For each individual, we used a steril-
ized soil core sampler to collect 300 ml of soil from the top 15
cm, which were pooled together from three sampling positions
adjacent to the original sampling position in 2016 (100 ml from
each position). Soils collected from all 120 individuals (i.e. (27
individuals + 3 juveniles) × 4 species) were processed with the
same method as earlier and stored at 4°C before the glasshouse
experiment.
Our glasshouse experiment aimed at transplanting seedlings of
all four species in soils collected from the 120 plant individuals.
To this end, soils collected from different plant individuals were
kept separated throughout the experiment so that each soil main-
tained its age-specific properties (Rinella & Reinhart, 2018;
Peacher & Meiners, 2020). We performed the glasshouse experi-
ment in two separate rounds, which started in late August and
September 2017. The range and variance of soil conditioning
length were kept similar among the two experiment rounds,
which was achieved by sorting soil source individuals based on
their age and assigning every other individual along the age axis
to different rounds. Half of the soil volume (150 ml) collected
from each individual was autoclaved to create a sterilized treat-
ment (120°C for 60 min, sit overnight for 24 h, and another
120°C for 60 min), allowing us to assess the potential effects of
soil communities. Autoclaving was used as other approaches (e.g.
gamma irradiation) were not accessible, although autoclaving
might have changed soil physico-chemical properties and might
not have completely eliminated soil biota (Dietrich et al., 2020).
It would have been desirable to have soils collected from 60 indi-
viduals in each experimental round (i.e. 15 individuals for each
of the four species), but we had to discard soils collected from
nine individuals due to handling mistakes during the sterilization
process: six in the first round (i.e. soils from one individual of
A. arenaria, three individuals of C. edulis, and two individuals of
L. arboreus) and three in the second round (i.e. soils from two
individuals of B. pilularis and one individual of C. edulis). With
the two experiment rounds combined, our soil preparation step
created 222 unique soil environments: 108 for the first round
(i.e. (14 A. arenaria + 15 B. pilularis + 12 C. edulis + 13 L.
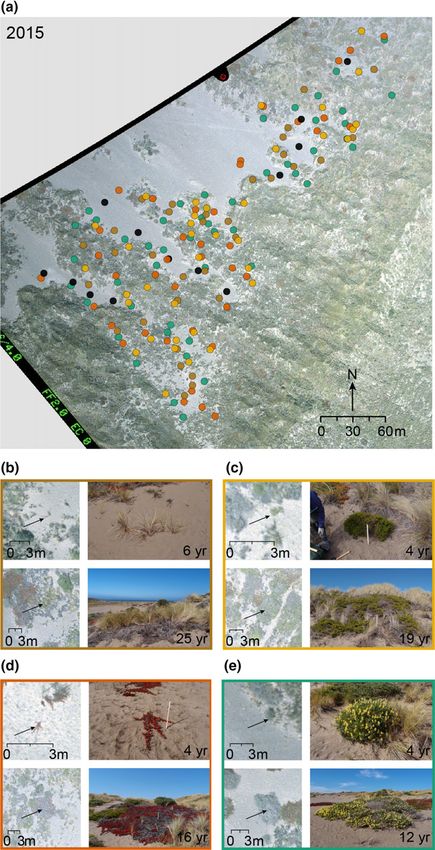
Fig. 1 Study area at Bodega Bay. (a) Aerial photograph taken in 2015,
arboreus) individuals × 2 sterilization treatments) and 114 for the
labeled with the location of selected plant individuals and bare sand second round (i.e. (15 A. arenaria + 13 B. pilularis + 14 C.
sampling locations. The four species are represented by different colors, edulis + 15 L. arboreus) individuals × 2 sterilization treatments).
following the color scheme in panels (b–e); bare sand sampling location Live and sterilized soil environments collected from the same
are in black. (b–e) Examples of young (upper row) and old (lower row) plant individual were always tested within the same experimental
individuals of the four dominant species. (b) Ammophila arenaria (brown);
(c) Baccharis pilularis (yellow); (d) Carpobrotus edulis (orange); (e)
round.
Lupinus arboreus (green). Left column of panels (b–e) are taken from the Seeds of the four species were surface-sterilized by soaking in
same 2015 aerial photograph, zoomed in on different selected plant 5% bleach for 30 s, 95% ethanol for 30 s, and rinsing them with
individuals (indicated with arrows); right columns of panels (b–e) are deionized water for 1 min. The sterilized seeds were spread
photographs of the focal individuals in the field in 2016. As individuals evenly onto germination trays filled with sterilized sand (1 : 1
arrived at different years in the past, they reach different ages at the year
of sampling (indicated at the bottom-right corner).
mixing of sterilized play sand and Lapis Lustre #2/12 sand
(Cemex) to mimic the soil particle distribution in the field), and
placed in a growth chamber (16 h : 8 h, light : dark, and tempera-
seedling performance in soils that differed in their host plant ture held at 16°C). After 2 wk, we transplanted the seedlings
species and conditioning length. In July 2017, we revisited the individually into 107-ml ‘cone-tainers’ pots (i.e. one seedling per
same plant individuals and collected soils for our experiment. For pot) filled with 80 ml of sterilized sand (prepared with the same
New Phytologist (2021) 231: 1546–1558 Ó 2021 The Authors
www.newphytologist.com New Phytologist Ó 2021 New Phytologist FoundationNew
Phytologist Research 1549
method as for germination) and added 20 ml of either live or composition were tested with permutational multivariate analysis
sterilized soil inoculum to the top. A relatively small volume of of variance (PERMANOVA with 999 permutations, Anderson,
soil inoculum was added to minimize the potential side effects of 2001). To identify the microbial taxonomic groups that drove
autoclaving on soil abiotic properties (Brinkman et al., 2010). the observed community pattern, we aggregated the microbial
Three of the four species were transplanted in both experimental communities to the family level and performed another NMDS
rounds, except B. pilularis, the germination rate of which was too ordination. For the fungal community, we further assigned
low for the second round. The final number of pots therefore OTUs to functional groups based on the FUNGuild database
deviated from our original full factorial design, with a total of (Nguyen et al., 2016) and performed linear regression to see how
774 pots: 432 from the first round (i.e. 54 soil source individu- the abundance of different functional groups changed with plant
als × 2 sterilization treatments × 4 species) and 342 from the age. The earlier-mentioned statistics with plant age as a predictor
second round (i.e. 57 soil source individuals × 2 sterilization were performed for each soil host species separately.
treatments × 3 species). In our glasshouse experiment, seedlings of the same plant species
Transplanted pots were randomly placed onto every other cell were paired based on the plant individual where field soils were col-
of 98 well trays (to avoid crowding) and were grown in the lected, with one seedling inoculated with live soil and the other
glasshouse for 12 wk (14 h : 10 h, light : dark with ambient tem- with sterilized soil from the same plant individual. As soils from
perature). To mimic precipitation regimes in the field, which was different individuals were not mixed (Rinella & Reinhart, 2018),
mainly fog during the summers, 30-s brief water spray with auto- we were able to evaluate the effects that the soil community from a
matic misting nozzles were applied every hour. Seedlings that k-yr-old individual of species j had on the seedling of species i as:
died within the first 10 d were replanted, and for seedlings that
!
died afterwards their live–sterilized soil pair were discarded. With B i,j k ,live
two rounds combined, data for 20 live–sterilized soil pairs were soil biota effecti,j k ¼ log10 ,
B i,j k ,sterilized
discarded due to seedling mortality: three seedlings of A. arenaria
(i.e. one in A. arenaria soil, one in B. pilularis soil, one in L.
arboreus soil), five seedlings of B. pilularis (i.e. two in A. arenaria where B i,j k ,live and B i,j k ,sterilized represent seedling biomass of
soil, one in B. pilularis soil, one in C. edulis soil, one in L. species i when grown in pots inoculated with either live or steril-
arboreus soil), nine seedlings of C. edulis (i.e. two in A. arenaria ized soil from a k-yr-old individual of species j, respectively. Since
soil, three in B. pilularis soil, two in C. edulis soil, two in L. autoclaving attempts to remove the whole soil community
arboreus soil), and three seedlings of L. arboreus (i.e. one in B. instead of targeting soil microbes, we will refer to this metric as
pilularis soil, one in C. edulis soil, one in L. arboreus soil). No soil biota effect (i.e. biotic feedback, sensu Semchenko et al.,
effect of soil conditioning length on seedling survival was found 2018). A positive (or negative) value means that the soil biota
(logistic regression, P = 0.39). After 12 wk, we harvested and associated with the k-yr-old individual of species j had a net bene-
oven-dried all plant tissues from each pot at 70°C for 96 h. The ficial (or detrimental) effect on the seedling of species i. The met-
resulting total dry biomass was weighed to assess the effects of soil ric represents conspecific soil biota effects when seedlings were
communities on plant performance. grown in soils collected from the same species (i.e. i = j), and it
represents heterospecific soil biota effects when soils collected
from different species were used (i.e. i ≠ j). Since the inocula used
Data analysis
in the two biomass measurements were collected from the same
We analyzed fungal and bacterial communities separately. To plant individual in the field, we obtained an age-specific biota
better match our microbial community data from soil samples to effect associated with the individual that conditioned the soil.
the soils used in our glasshouse experiment, we summed the We used two approaches to analyze the age-specific soil biota
OTU reads of the three samples that belonged to the same plant effects. First, we took the time-averaged value for each plant ×
individual. As a result, the following statistical analyses were per- soil host species combination (i.e. ignored the age information by
formed by viewing plant individuals as the unit of replication. To taking the temporal mean), which is the common approach when
examine how species richness of the microbial community varied field-conditioned soils were used but information of soil condi-
with plant age, we fitted linear, quadratic, and Monod functions tioning length not being available. For each of the four plant
with R package ‘NLME’ (Pinheiro et al., 2019) to model observed species, the effects of soil host species on the time-averaged soil
OTU richness as a function of plant age. Models were fitted for biota effect were tested by fitting generalized linear mixed models
each plant species separately, and the best model was selected (GLMMs, using R package ‘LME4’; Bates et al., 2015). We
based on their Akaike information criterion (AIC) with sample included the identity of soil host species as a fixed effect and
correction (AICc) values. To visualize compositional differences glasshouse round, when present, as a random effect (note that a
among microbial communities, we used nonmetric multidimen- separate model including glasshouse round as a fixed effect was
sional scaling (NMDS) to ordinate microbial communities based not significant, P = 0.478). An additional GLMM with the 16
on Bray–Curtis dissimilarity matrices with R packages ‘VEGAN’ plant × soil host species combinations as fixed effect and
(Oksanen et al., 2019) and ‘PHYLOSEQ’ (McMurdie & Holmes, glasshouse round as random effect was fitted to assess whether
2013). Effects of soil host species identity (i.e. the species that time-averaged soil biota effects were significantly different from
conditioned the soil) and plant age on microbial community zero (i.e. by offsetting the intercept). Post hoc group comparisons
Ó 2021 The Authors New Phytologist (2021) 231: 1546–1558
New Phytologist Ó 2021 New Phytologist Foundation www.newphytologist.comNew
1550 Research Phytologist
and compact letter display of pairwise comparisons were per- 2018; Chen et al., 2019), we allowed the microbial legacy effects
formed with R package ‘MULTCOMP’ (Hothorn et al., 2008). to be either positive or negative. The key distinction between our
The second approach took advantage of the age information model and previous studies is that microbial legacy effects in our
provided by the aerial photographs. Specifically, we visualized the model are age-dependent, i.e. the strength depends on the age of
age-specific soil biota effect on the temporal axis (i.e. soil condi- death of the previous established individual. See Methods S2 for
tioning length) and quantified its temporal trends by fitting full details of the simulation model.
GLMMs. The model included the age-specific biota effects as the For our simulation, we generated 10 patches for the regional
response variable, and plant species identity, soil host species species pool to colonize independently and one set of baseline
identity, soil conditioning length, and their pairwise interactions microbial legacy effects, which represent the microbial effects cre-
as fixed effects; glasshouse round was included as a random effect. ated by the previous individual if it died a year immediately after
We did not include the three-way interaction term as preliminary colonization. The microbial effects experienced by a new arriving
analysis suggested that it is insignificant (Table S1). We also fit- species depended on the previous individual’s age of death and
ted models using plant functional group (i.e. a dummy variable the temporal development pattern of microbial effects. We con-
indicating whether the plant species is a legume) instead of plant sidered five feedback scenarios: (1) no interaction, where plants
species identity as a predictor, and compared model performance do not create microbial effects; (2) constant, where microbial
based on AIC values. In our model, a significant interaction effects remain unchanged despite individuals becoming older; (3)
between plant species (or plant functional group) and soil condi- magnifying, where both positive and negative microbial effects
tioning length would indicate that the plant species identity (or intensify in strength as individuals become older (i.e. the longer
being a legume) affects how soil biota effects varied through time. the previous individual lived before it died, the stronger its impact
If a significant temporal trend was found, we dug further into the on the new individual); (4) decaying, where both positive and
pattern by fitting GLMMs with plant total biomass as the negative microbial effects attenuate in strength because mature
response variable, and soil host species identity, soil conditioning individuals support less pathogens and rely less on mutualists; and
length, sterilization treatment, and their interactions as fixed (5) bidirectionally varying, where both intensifying and attenuat-
effects. To ease interpretation, this three-way interaction model ing are possible. For each scenario, we simulated 20 replicated
was fitted separately for different plant species or different plant runs of community assembly, where 20 independently created
functional groups (i.e. legume or not). A significant interaction sets of species pool (each with 50 species) were allowed to colonize
between sterilization treatment and soil conditioning length the same set of 10 patches, using the same set of baseline micro-
would indicate that plant performance in live vs sterilized soils bial effects. We quantified beta diversity among the 10 patches for
followed different temporal trend, therefore creating time- each replicated run, which was measured as gamma diversity
varying soil biota effects. divided by mean alpha diversity, and compared temporal patterns
of beta diversity among different scenarios. All analyses and simu-
lations were performed in R v.3.3.1 (R Core Team, 2016).
Simulation model
Our empirical study measures temporal changes in plant–soil
Results
interactions in the Bodega Bay dune system, but we were also
interested in exploring potential consequences of temporally
Temporal patterns of microbial communities
varying PSF more broadly across plant communities. As a first
step towards general understanding of how the temporal changes Fungal community composition differed among plant species
in PSF strengths may affect plant community assembly, we used (Fig. S1a, PERMANOVA, R 2 ¼ 0:148, P < 0:001). Within each
an individual-based model modified from Fukami & Nakajima plant species, fungal composition varied with plant age (Fig. 2a–
(2011) (see also Fukami & Nakajima, 2013; Zee & Fukami, d, age effect for A. arenaria: R 2 ¼ 0:096; B. pilularis: R 2 ¼ 0:083;
2015; Fukami et al., 2017). The purpose of this simulation exer- C. edulis: R 2 ¼ 0:100; L. arboreus: R 2 ¼ 0:077; all P < 0:001),
cise was not to predict what may happen specifically in the becoming progressively different from bare sand communities
Bodega Bay dune system, but to investigate general possibilities with increasing conditioning time (fungal richness ceased to
of how different temporal changes in PSF strengths affect the increase further after a few years following plant colonization,
transient and steady states of plant community assembly. Fig. S2). Similar results were obtained for bacterial communities
The model consisted of species pools containing 50 plant (Figs 2e–h, S1b, S3; species effect: R 2 ¼ 0:126; age effect for A.
species (each with a different trait value) and patches consisting arenaria: R 2 ¼ 0:115; B. pilularis: R 2 ¼ 0:112; C. edulis:
of 1024 local sites (each with a different habitat condition). We R 2 ¼ 0:120; L. arboreus: R 2 ¼ 0:116; all P < 0:001). Figure S4
simulated immigration, reproduction, arrival, competition for shows qualitatively how different fungal families change over
establishment, and death of plant individuals. Competition for time. For example, the contribution of fungal families Trichoco-
establishment at empty sites is determined not only by the match maceae and Mycosphaerellaceae decreased towards the left-hand
between species’ trait values and local habitat conditions (i.e. side of Fig. S4a, indicating that their relative abundance
environmental filtering) but also by the soil microbial legacy decreased with longer soil conditioning length. Moreover, the
effects (i.e. PSF) created by the previously established plant fungal family Lasiosphaeriaceae increased in soils associated with
species. Following empirical evidence (e.g. Semchenko et al., L. arboreus (i.e. towards lower-left of Fig. S4a) whereas
New Phytologist (2021) 231: 1546–1558 Ó 2021 The Authors
www.newphytologist.com New Phytologist Ó 2021 New Phytologist FoundationNew
Phytologist Research 1551
A. arenaria B. pilularis C. edulis L. arboreus
(a) (b) (c) (d)
0.8 25 25 25 12
20 20 20 9
15 15 15 6
10 10 10
5 5 5 3
0 0 0 0
0.4
Fungi
0.0
-0.4
NMDS axis 2
-0.75 -0.50 -0.25 0.00 0.25 -0.75 -0.50 -0.25 0.00 0.25 -0.75 -0.50 -0.25 0.00 0.25 -0.75 -0.50 -0.25 0.00 0.25
(e) (f) (g) (h)
0.4
Bacteria
0.2
0.0
-0.2
-0.6 -0.3 0.0 0.3 -0.6 -0.3 0.0 0.3 -0.6 -0.3 0.0 0.3 -0.6 -0.3 0.0 0.3
NMDS axis 1
Fig. 2 Microbial community composition as a function of plant species and the age of plant individuals, visualized on a nonmetric multidimensional scaling
(NMDS) ordination plot. Fungal communities are shown in (a–d) and bacterial communities in (e–h). Each point represents the fungal or bacterial
community of one plant individual; open points that appeared in all panels represent fungal or bacterial communities associated with bare sand samples. In
each panel, samples from one of the four plant species are highlighted while those from the other three plant species are in gray. Fungal and bacterial
communities associated with the focal species are color-coded by individual plant age; purple to yellow represent the age gradient from young to old, with
species-specific minimum and maximum age. (a, e) Ammophila arenaria; (b, f) Baccharis pilularis; (c, g) Carpobrotus edulis; (d, h) Lupinus arboreus
associated fungal and bacterial communities, respectively. The color gradient are shared among panels that highlight the same focal species (i.e. each
column). See the same ordination plot but color-coded with species identity in Supporting Information Fig. S1.
Teratosphaeriaceae increased in the soils associated with the other Soil conditioning length significantly influenced the strength
three species (i.e. towards upper-left of Fig. S4a; see also Fig. S5 of soil biota effects when using either plant species or plant func-
for bacterial family patterns). tional group (i.e. legume or not) as the predictor (Table 1). The
model that best described temporal changes in soil biota effects
included legume, soil host species identity, soil conditioning
Temporal patterns of soil biota effects on plant
length, and their two-way interactions (Table S2). The temporal
performance
pattern of soil biota effects experienced by L. arboreus differed
By quantifying the time-averaged soil biota effects that each from that experienced by the three other plants (i.e. there was a
plant species experienced when grown in soils conditioned by significant interaction between soil conditioning length and plant
different soil host species, we found that the soil biota effects functional group, but not with soil host species nor plant species;
were positive for L. arboreus but negative for the other three Tables 1, S3). Based on these statistical results, in Fig. 4 we visu-
plants (Figs 3, S6). Most soil biota effects were significantly dif- alized the temporal pattern of soil biota effects by separating L.
ferent from zero (except when B. pilularis grown in soils from arboreus from the other three plant species. The soil biota effects
A. arenaria and L. arboreus; Fig. 3b), but the identity of the soil experienced by A. arenaria, B. pilularis and C. edulis became
host species had no effect on the soil biota effects that plants more negative with longer conditioning time (Fig. 4a; see also
experienced (soil host species effect insignificant for A. arenaria: Fig. S7), with the ratio of plant performance in live soils to that
F 3,101:06 ¼ 0:354, P ¼ 0:786; B. pilularis: F 3,44 ¼ 1:190, in sterilized soils decreasing 2.6% yr−1 (i.e. 1 100:0113 ; Table
P ¼ 0:324; marginally significant for C. edulis: S3). In contrast, the soil biota effects experienced by L. arboreus
F 3,95:216 ¼ 2:203, P ¼ 0:092; Fig. 3a–c). The only exception showed little temporal change (Fig. 4b; Table S3).
was L. arboreus, which grew best in soils from C. edulis individu- The temporal pattern for A. arenaria, B. pilularis, and C. edulis
als and worst in soils from A. arenaria individuals (soil host arose because plant performance slightly increased when grown
species effect: F 3,101:08 ¼ 3:492, P ¼ 0:018; Fig. 3d; see also in sterilized soils with longer conditioning history but decreased
Table 1 for significant interactions between plant species (or when grown in live soil with longer conditioning history (Fig. 4c;
plant functional group) and soil host species identity). see also Tables S4 and S5 for significant interaction terms
Ó 2021 The Authors New Phytologist (2021) 231: 1546–1558
New Phytologist Ó 2021 New Phytologist Foundation www.newphytologist.comNew
1552 Research Phytologist
(a) A. arenaria (b) B. pilularis
1.0 1.0
0.5 0.5
0.0 0.0
log10(live / sterilized) ratio for total dry biomass
28 27 26 27 12 14 11 12
a a
a a a a
* *
a
* * a
Fig. 3 Mean (SE) soil biota effects for each
−0.5 −0.5
* plant species in soils conditioned by different
* plants, neglecting the effect of soil
conditioning length. (a) Ammophila arenaria
(c) C. eduils (d) L. arboreus (brown); (b) Baccharis pilularis (yellow);
(c) Carpobrotus edulis (orange); (d) Lupinus
1.0 1.0
arboreus (green). The x-axis represents the
* plant species that conditioned the soil: A.
* c * arenaria (Aa), B. pilularis (Bp), C. edulis
bc
bc (Ce), and L. arboreus (La). The y-axis
0.5 0.5 *
b represents the soil biota effects, defined as
the log-ratio of plant total biomass in live soil
and sterilized soil, imposed by the soil host
29 27 25 27 species. Shaded bars represent conspecific
0.0 0.0
27 25 24 26
soil biota effects. Asterisks indicate soil biota
effects that are significantly different from
a a zero; daggers indicate marginal significance
a
†
* * (P < 0.1); different letters represent
−0.5 a −0.5
significant difference among the plant × soil
* host species combinations. The numbers in
the right corner of each bar indicate the
Aa Bp Ce La Aa Bp Ce La
number of data points included in the bar
Soil host species plot.
between soil conditioning length and sterilization treatment for orange line in Fig. 5a), and slowest in the bidirectionally varying
the three plant species). In contrast, the performance of L. scenario (Fig. 5f; green line in Fig. 5a).
arboreus did not show different temporal patterns between live
and sterilized soil (Fig. 4d; see also insignificant interaction terms
Discussion
in Tables S4 and S5 for L. arboreus).
Our data provide evidence that the strength of plant–soil microbe
interactions can depend on the duration of soil conditioning
Effects of temporally varying soil microbial effects on plant
(Table 1). We showed that microbial community composition
community assembly
became more and more different from that in bare sand (Figs 2,
Simulation results showed that plant communities converged in S4, S5), indicating a potential change in their functional compo-
all scenarios, i.e. beta diversity declined through time, as commu- sition and effects on plants (Fig. S8). However, plant response to
nities became dominated by a subset of species. Despite eventu- changes in the soil microbial community depended on the species
ally reaching similar beta diversity values, simulations ran under identity of the transplanted seedling (i.e. whether or not it was
different temporal development scenarios converged with differ- the legume, L. arboreus). In particular, only the soil biota effect
ent rates (Fig. 5a). Similar to a previous study (Fukami & Naka- experienced by nonlegume plants varied with soil conditioning
jima, 2013), beta diversity declined most rapidly when plants did length (Fig. 4a): the performance of nonlegume plants decreased
not create microbial legacies (Fig. 5b; light gray line in Fig. 5a), when grown in live soils collected from older soil source individu-
but was maintained at high levels and declined at slower rates if als, but slightly increased when grown in corresponding sterilized
plants created microbial legacies that maintained a constant soils (Fig. 4c; Tables S4, S5). The former may result from accu-
strength as individuals became older (Fig. 5c; black line in Fig. mulation of multiple generalist pathogens, whereas the latter may
5a). When the strength of microbial legacies varied depending on result from accumulation of organic matter and nutrients in soils
the previously established individual’s age of death, communities with longer conditioning length (Conser & Connor, 2009;
converged most rapidly in the decaying scenario (Fig. 5e; blue although we cannot rule out the possibility of a larger autoclave
line in Fig. 5a), followed by the magnifying scenario (Fig. 5d; side effect on soil abiotic properties in such soils). In contrast, it
New Phytologist (2021) 231: 1546–1558 Ó 2021 The Authors
www.newphytologist.com New Phytologist Ó 2021 New Phytologist FoundationNew
Phytologist Research 1553
Table 1 ANOVA table summarizing the effects of plant species (or plant functional group, i.e. legume or not), soil host species identity, soil conditioning
length, and their two-way interactions on the soil biota effects experienced by plants.
Sum Sq. Mean Sq. Num df Den df F P
Two-way interaction model with plant species as predictor
Plant species 9.3167 3.1056 3 336.43 31.706 < 0.0001
Soil host species 0.2415 0.0805 3 336.12 0.822 0.4825
Soil conditioning length 0.4475 0.4475 1 336.43 4.569 0.0333
Plant species × soil host species 2.7169 0.3019 9 336.02 3.082 0.0014
Plant species × soil conditioning length 0.6570 0.2190 3 336.05 2.236 0.0839a
Soil host species × soil conditioning length 0.1937 0.0646 3 336.11 0.659 0.5776
Two-way interaction model with legume as predictor
Legume 9.2414 9.2414 1 346.18 94.248 < 0.0001
Soil host species 0.3032 0.1011 3 346.1 1.031 0.3790
Soil conditioning length 0.6848 0.6848 1 346.49 6.984 0.0086
Legume × soil host species 1.9100 0.6367 3 346.01 6.493 0.0003
Legume × soil conditioning length 0.4823 0.4823 1 346 4.919 0.0272
Soil host species × soil conditioning length 0.1824 0.0608 3 346.12 0.620 0.6025
In the legume model, adding model terms with soil conditioning length increased the conditional R2 from 0.605 to 0.620. Bold typeface in the last column
indicates statistically significant terms (P < 0.05).
a
Marginally significant (P < 0.1).
appeared that only the presence/absence of soil biota mattered for PSF (but see Day et al., 2015; Speek et al., 2015). The impor-
L. arboreus (Fig. 4d; Kandlikar et al., 2021). We speculate that tance of soil conditioning length has also been studied in the con-
this is because legumes can form effective symbiotic relationships text of successive planting in agricultural systems, which
with a range of rhizobia (Birnbaum et al., 2018; Png et al., 2019), demonstrated intensifying negative microbial effects with increas-
or the relative abundance of their microbial partners did not vary ing rounds of planting (Mazzola, 1999; Packer & Clay, 2004).
significantly through time. Future studies can more formally test Recent studies have generalized the traditional focus of single
the effects of plant functional groups on the temporal pattern of species to consider multiple rounds of soil conditioning by differ-
plant–soil microbe interactions by including multiple species in ent species, showing that the order of species conditioning the
each functional group. soil explained a large part of plant performance variability (Wubs
We focused on the temporal changes in plant–soil microbe & Bezemer, 2017). Our results show that the negative soil biota
interactions during the conditioning phase. Previous studies on effects experienced by the two invasive plants may aggravate
the temporal dynamics of PSF have mostly focused on changes within a few years in the field (Fig. 4a; Table S3), which may
during the response phase (i.e. monitoring its strengths across dif- indicate a decreasing degree of enemy release as shown in other
ferent plant ontogenetic stages; Hawkes et al., 2012; Bezemer studies (Beckstead & Parker, 2003; de la Peña et al., 2010).
et al., 2018; Dudenhöffer et al., 2018). For example, Hawkes Recognizing that plant–soil microbe interactions are more
et al. (2012) conducted a 19-month-long experiment and quanti- dynamic than generally assumed can be useful when studying their
fied PSF at four different time steps as the planted seedling effects on plant community recovery after disturbance. Some dis-
matures. Their result suggested that the effects of soil microbes turbance, such as severe wildfire, kills all individuals, whereas other
on native plants became more negative through time (see also forms of disturbance cause higher mortality for specific age classes
Bezemer et al., 2018; Dudenhöffer et al., 2018). As seedlings (Sousa, 1984). For example, insect herbivore outbreak may cause
mature, they not only drive continuous turnover in the microbial plant juveniles to suffer higher mortality, whereas windthrow may
composition (Husband et al., 2002; Meaden et al., 2016; Din- have a more significant direct impact on large adults (Sousa,
nage et al., 2019), but their sensitivity to soil microbes may also 1984). Different types of disturbances thus terminate soil condi-
change (Reinhart et al., 2010; Ke et al., 2015). Experiments like tioning at various stages, leaving behind different microbial lega-
ours can disentangle the underlying mechanisms and quantify cies that could alter recovery trajectories. Other studies have also
the effects of microbial turnover during the conditioning phase. shown that PSF affects restoration (Wubs et al., 2016, 2019) and
The relationship between soil conditioning length and feed- information on how plant–soil microbe interactions change
back strength has been investigated in the context of plant inva- through time can also help design restoration projects. At our field
sion. These studies have quantified how the PSF strength site, we found that the two invasive species performed worse in
experienced by the invading species changes after multiple gener- soils with longer conditioning history. This result suggests that
ations, focusing on how the benefit of escaping host-specific soil removing old individuals may be an effective restoration strategy
pathogens in their native range attenuates with their resident time since the soil legacies that they leave behind are more detrimental
(Diaz et al., 2010; Dostál et al., 2013; Day et al., 2015; Speek for propagules from nearby nonnative individuals to regenerate.
et al., 2015). For example, Diaz et al. (2010) found that nonna- Our study was conducted in a sand dune ecosystem where
tive plant species that became established in New Zealand for a individual plants are often spatially separated from one another,
longer time (e.g. hundreds of years) experienced stronger negative providing the unique opportunity to demonstrate the importance
Ó 2021 The Authors New Phytologist (2021) 231: 1546–1558
New Phytologist Ó 2021 New Phytologist Foundation www.newphytologist.comNew
1554 Research Phytologist
(a) Non-legume plants (b) Legume
log10(live / sterilized) ratio for t otal dry biomass
1.2 1.2
0.6 0.6
Soil source
A. arenaria
0 0 B. pilularis
C. edulis
L. arboreus
−0.6 −0.6
−1.2 −1.2
(c) (d)
2.5
2.0 3.0
log10(t otal dry biomass)
Soil source
A. arenaria
1.5 B. pilularis
2.0
C. edulis
L. arboreus
1.0
1.0
Treatment
Live
0.5 Sterilized
0
0
0 5 10 15 20 25 0 5 10 15 20 25
Soil conditioning length (yr)
Fig. 4 Temporal trends of the effects of soil biota on plant seedling performance. Temporal trend of soil biota effects, defined as the log10-ratio of plant
total biomass in live soil and sterilized soil, for (a) nonlegume plants (i.e. Ammophila arenaria, Baccharis pilularis, and Carpobrotus edulis) and (b) legume
(i.e. Lupinus arboreus). For these two panels, each point represents the soil biota effects generated by soils collected from one plant individual, with the soil
host’s species identity indicated by the color and shape: A. arenaria (brown circles), B. pilularis (yellow squares), C. edulis (orange diamonds), and L.
arboreus (green triangles); the gray dotted line indicates no soil biota effect (see also Supporting Information Fig. S7 where the species identity of the
transplanted seedling is indicated by the inner color of each point). The black line in (a) represents how the soil biota effects experienced by nonlegume
plants vary with soil conditioning length (x-axis), and the colored horizontal lines in (b) represents how the soil biota effects experienced by L. arboreus
vary with the species identity of soil source individuals (see Tables 1, S3 for statistical results). Panels (c) and (d) show temporal trends of plant total dry
biomass for nonlegume plants and legume, respectively. For these two panels, the x-axis shows the soil conditioning length and the y-axis shows the log10-
transformed total dry biomass. Each point represents the growth performance of one plant seedling, growing in either live (red) or sterilized (blue) soils,
and point shapes represent the species identity of soil source individuals. For visualization purpose, the fitted lines here are from a statistical model that uses
log10 total biomass as the response variable, and soil conditioning length, sterilization treatment, and their interaction as predictors. In (c), we show the
significant interaction between soil conditioning length and the sterilization treatment, whereas in (d) we only show the effects of the sterilization
treatment as the soil conditioning length term was not significant (Table S5; see also Table S4). Note the different scales on the y-axis in (c, d). In (b, d),
dashed lines were used to indicate insignificant interaction term between soil conditioning length and sterilization treatment for L. arboreus (Table S5).
New Phytologist (2021) 231: 1546–1558 Ó 2021 The Authors
www.newphytologist.com New Phytologist Ó 2021 New Phytologist FoundationNew
Phytologist Research 1555
(a) (b) No interaction
1.5
1
8 0.5
1 10
(c) Constant
1.5
1
6 0.5
Feedback strength
1 10
beta-diversity
(d) Magnifying
1.5
1
4 0.5
1 10
(e) Decaying
1.5
1
2 0.5
1 10
(f) Bidirectional
1.5
1
0 0.5
50 100 1900 1 10
Time Plant age
Fig. 5 Simulated community convergence patterns under different temporal development scenarios of the underlying plant–soil microbe interactions. (a)
Temporal trends of beta diversity (mean SE, n = 20) among the 10 simulated patches for five different plant–soil microbe interaction scenarios. (b–f)
Schematic diagrams of the five different scenarios in (a), demonstrating how the interaction strength changes with the age of the conditioning individual.
(b) No plant–soil microbe interactions (light gray); (c) plant–soil microbe interactions that are independent to plant age (black); (d) magnifying interaction
strengths that intensify to their biological extremes with increasing plant age (orange); (e) decaying interaction strengths that attenuate to one with
increasing plant age (blue); (f) bidirectionally varying interaction strengths that either intensify or attenuate with increasing plant age (green). See
Supporting Information Methods S2 for detailed model description.
of soil conditioning length for different species. In many other successional stage and PSF strength can facilitate plant species
systems, however, plant roots may be more intermingled and dif- turnover (Kardol et al., 2006; Middleton & Bever, 2012; Bauer
ferent plant species co-culture the local soil community (Wubs & et al., 2015). In nature, local soils may vary spatially in how long
Bezemer, 2018). Understanding the temporal development of they have been conditioned as plant individuals often arrive at
PSF in these systems is of importance because plants may easily different timings and die at different ages (Kardol et al., 2013b;
encounter patches with different conditioning length as their Peay, 2018). If the duration of soil conditioning affects PSF
roots explore nearby soil (Hendriks et al., 2015a). One can use strength, as shown in our study, heterogeneity in soil condition-
glasshouse experiments with various conditioning duration to ing length may weaken the correlation between PSF strength and
isolate the effects of soil conditioning length for different plant– plant successional stage and create complex PSF that delay com-
soil pairs (Lepinay et al., 2018; though we note that glasshouse munity convergence (Fig. 5; Fukami & Nakajima, 2013). These
conditioning may occur at a shorter timescale due to more con- implications suggest that future theoretical models should incor-
fined soil volume). Future studies can then develop methods to porate the different temporal aspects of PSF when studying their
calculate the overall soil biota effects on a focal individual based effects on plant community assembly (Kardol et al., 2013a; Ke &
on its root system distribution (Hendriks et al., 2015b). Miki, 2015; Ke & Levine, 2021).
Our general individual-based model provides an opportunity
to broaden our perspective of temporally dynamic PSF beyond
Conclusion
the specific system. The simulation exercise suggested that plant
communities assembled under different temporal development We have shown here that plant–soil microbe interaction strengths
patterns of PSF could exhibit various transient dynamics and can vary depending on how long the previous plant individual
converge at different rates (Fig. 5). Without soil microbes, has conditioned the soil, illustrating the importance of interac-
species’ competitiveness in our model solely depends on environ- tion timing in determining species interaction strength (Kardol
mental filtering (i.e. the match between species’ trait value and et al., 2013b; Peay, 2018). Our results indicate that the length of
local habitat condition). However, species’ competitiveness is soil conditioning can influence the estimated strength of plant–
modified when plants create microbial legacies, and a more soil interactions for a majority of dominant plant species in a sys-
heterogeneous PSF scenario (e.g. more complicated temporal tem, highlighting the long-term time dependency of plant–soil
changes) can delay community convergence by preventing the interactions. By treating the temporal dynamics of plant and
immediate dominance of the species with the best fit trait. Previ- microbial communities as a crucial component of PSF (e.g.
ous studies suggested that a positive correlation between plant Chung et al., 2019; in ’t Zandt et al., 2021), it should be possible
Ó 2021 The Authors New Phytologist (2021) 231: 1546–1558
New Phytologist Ó 2021 New Phytologist Foundation www.newphytologist.comNew
1556 Research Phytologist
to more properly place experimental results in a natural context Bezemer TM, Jing J, Bakx-Schotman JMT, Bijleveld EJ. 2018. Plant
to better predict how soil microbes influence plant community competition alters the temporal dynamics of plant–soil feedbacks. Journal of
Ecology 106: 2287–2300.
assembly. Birnbaum C, Bissett A, Teste FP, Laliberté E. 2018. Symbiotic N2-fixer
community composition, but not diversity, shifts in nodules of a single host
legume across a 2-million-year dune chronosequence. Microbial Ecology 76:
Acknowledgements 1009–1020.
The authors thank staff members at the Bodega Marine Labora- Brinkman EP, van der Putten WH, Ej B, Verhoeven KJF. 2010. Plant–soil
feedback: experimental approaches, statistical analyses and ecological
tory and Sonoma State Park, in particular Kitty Brown, Jackie interpretations. Journal of Ecology 98: 1063–1073.
Sones, and Brendan O’Neil for logistical support; Hirokazu Toju Chen L, Swenson NG, Ji N, Mi X, Ren H, Guo L, Ma K. 2019. Differential soil
for providing bioinformatics scripts; Manpreet Dhami and Nora fungus accumulation and density dependence of trees in a subtropical forest.
Dunkirk for their assistance with sequencing; Callie Chappell, Science 366: 124–128.
Nancy Chang, Suchana Costa, Marion Donald, Jasmine Gilliam, Chung YA, Collins SL, Rudgers JA. 2019. Connecting plant–soil feedbacks to
long-term stability in a desert grassland. Ecology 100: e02756.
Nicholas Hendershot, Ben LeRoy, Michelle Li, Priscilla San Conser C, Connor EF. 2009. Assessing the residual effects of Carpobrotus edulis
Juan, Kaoru Tsuji, and Anna Verwillow for assistance in the field invasion, implications for restoration. Biological Invasions 11: 349–358.
and in the laboratory; Chun-Wei Chang and Feng-Hsun Chang Danin A, Rae S, Barbour M, Jurjavcic N, Connors P, Uhlinger E. 1998. Early
for statistical consulting; Peter Adler, Erin Mordecai, Kabir Peay, primary succession on dunes at Bodega Head. Madrono 45: 101–109.
and members of the community ecology group at Stanford D’Antonio CM, Mahall BE. 1991. Root profiles and competition between the
invasive, exotic perennial, Carpobrotus edulis, and two native shrub species in
University for comments. P-JK was supported by Stanford California coastal scrub. American Journal of Botany 78: 885–894.
University and the Studying Abroad Scholarship from the Min- Day NJ, Dunfield KE, Antunes PM. 2015. Temporal dynamics of plant–soil
istry of Education, Taiwan. feedback and root-associated fungal communities over 100 years of invasion by
a non-native plant. Journal of Ecology 103: 1557–1569.
Dietrich P, Cesarz S, Eisenhauer N, Roscher C. 2020. Effects of steam
Author contributions sterilization on soil abiotic and biotic properties. Soil Organisms 92: 99–108.
Diez JM, Dickie I, Edwards G, Hulme PE, Sullivan JJ, Duncan RP 2010.
P-JK and TF conceived the study; P-JK led the field, laboratory, Negative soil feedbacks accumulate over time for non-native plant species.
and glasshouse work; P-JK and PCZ performed the simulation; Ecology Letters 13: 803–809.
P-JK wrote the first draft of the manuscript and all authors con- Dinnage R, Simonsen AK, Barrett LG, Cardillo M, Raisbeck-Brown N, Thrall
tributed to editing the manuscript. PH, Prober SM. 2019. Larger plants promote a greater diversity of symbiotic
nitrogen-fixing soil bacteria associated with an Australian endemic legume.
Journal of Ecology 107: 977–991.
ORCID Dostál P, Müllerová J, Pyšek P, Pergl J, Klinerová T. 2013. The impact of an
invasive plant changes over time. Ecology Letters 16: 1277–1284.
Tadashi Fukami https://orcid.org/0000-0001-5654-4785 Dudenhöffer J, Ebeling A, Klein A, Wagg C, Farrer E. 2018. Beyond biomass:
Po-Ju Ke https://orcid.org/0000-0002-8371-7984 soil feedbacks are transient over plant life stages and alter fitness. Journal of
Ecology 106: 230–241.
Peter C. Zee https://orcid.org/0000-0003-2594-9602 Eppinga MB, Baudena M, Johnson DJ, Jiang J, Mack KML, Strand AE, Bever
JD. 2018. Frequency-dependent feedback constrains plant community
coexistence. Nature Ecology & Evolution 2: 1403–1407.
Data availability Fukami T, Nakajima M. 2011. Community assembly: alternative stable states or
All primary data and computer scripts for the individual-based alternative transient states? Ecology Letters 14: 973–984.
Fukami T, Nakajima M. 2013. Complex plant–soil interactions enhance plant
model are deposited on Dryad, https://doi.org/10.5061/dryad. species diversity by delaying community convergence. Journal of Ecology 101:
tmpg4f4zd. 316–324.
Fukami T, Nakajima M, Fortunel C, Fine PVA, Baraloto C, Russo SE, Peay
KG. 2017. Geographical variation in community divergence: insights from
References tropical forest monodominance by ectomycorrhizal trees. The American
Anderson MJ. 2001. A new method for non-parametric multivariate analysis of Naturalist 190: S105–S122.
variance. Austral Ecology 26: 32–46. Hannula SE, Kielak AM, Steinauer K, Huberty M, Jongen R, De Long JR,
Barbour MG, Craig RB, Drysdale FR, Ghiselin MT. 1973. Coastal ecology: Heinen R, Bezemer TM. 2019. Time after time: temporal variation in the
Bodega Head. Berkeley, CA, USA: University of California Press. effects of grass and forb species on soil bacterial and fungal communities. mBio
Bates D, Mächler M, Bolker B, Walker S. 2015. Fitting linear mixed-effects 10: e02635-19.
models using lme4. Journal of Statistical Software 67: 1–48. Hawkes CV, Kivlin SN, Du J, Eviner VT. 2012. The temporal development and
Bauer JT, Mack KML, Bever JD. 2015. Plant–soil feedbacks as drivers of additivity of plant–soil feedback in perennial grasses. Plant and Soil 369: 141–
succession: evidence from remnant and restored tallgrass prairies. Ecosphere 6: 150.
art158. Hendriks M, Visser EJW, Visschers IGS, Aarts BHJ, de Caluwe H, Smit-
Beckstead J, Parker IM. 2003. Invasiveness of Ammophila arenaria: release from Tiekstra AE, van der Putten WH, de Kroon H, Mommer L. 2015a. Root
soil-borne pathogens? Ecology 84: 2824–2831. responses of grassland species to spatial heterogeneity of plant–soil feedback.
Bever JD. 2003. Soil community feedback and the coexistence of competitors: Functional Ecology 29: 177–186.
conceptual frameworks and empirical tests. New Phytologist 157: 465–473. Hendriks M, Ravenek JM, Smit-Tiekstra AE, van der Paauw JW, de Caluwe H,
Bever JD, Westover KM, Antonovics J. 1997. Incorporating the soil community van der Putten WH, de Kroon H, Mommer L. 2015b. Spatial heterogeneity
into plant population dynamics: the utility of the feedback approach. Journal of of plant–soil feedback affects root interactions and interspecific competition.
Ecology 85: 561–573. New Phytologist 207: 830–840.
New Phytologist (2021) 231: 1546–1558 Ó 2021 The Authors
www.newphytologist.com New Phytologist Ó 2021 New Phytologist FoundationYou can also read