2020 Community Needs Assessment - skylinecap.org - Approved by Skyline CAP, Inc. Board of Directors: February 25, 2020
←
→
Page content transcription
If your browser does not render page correctly, please read the page content below
skylinecap.org

                                                         2020
                                              Community Needs
                                                  Assessment

Approved by Skyline CAP, Inc. Board of Directors: February 25, 2020
SKYLINE CAP, INC.
COMMUNITY NEEDS ASSESSMENT 2020

OUR VISION:
All people within the Skyline CAP service area will have access to
education, housing, economic opportunities and services necessary to
become self-sufficient.

OUR MISSION:
To strengthen our communities by improving the lives of those in need
through actions promoting self-sufficiency. We seek to eliminate the
impact of poverty by focusing on education, housing stability and
economic opportunities.
Table of Contents
Executive Summary....................................................................................................................................... 1
   Conclusions by the Board.......................................................................................................................... 1
Purpose of Report ......................................................................................................................................... 4
   Report Area ............................................................................................................................................... 4
   Target Population ..................................................................................................................................... 4
Agency and Client Overview ......................................................................................................................... 4
   Head Start ................................................................................................................................................. 5
   Healthy Families ........................................................................................................................................ 5
   Project Discovery ...................................................................................................................................... 5
   Housing Programs ..................................................................................................................................... 5
Demographic Data ........................................................................................................................................ 7
   Population ................................................................................................................................................. 7
       Population Growth by County – All Service Areas ................................................................................ 7
       Population Growth by Age .................................................................................................................... 7
       Population by Race and Ethnicity ......................................................................................................... 9
   Income .................................................................................................................................................... 10
       Median Household Income ................................................................................................................. 11
   Poverty .................................................................................................................................................... 11
       Federal Poverty Guidelines – 2019 ..................................................................................................... 11
       Poverty All Ages .................................................................................................................................. 12
       Family Poverty..................................................................................................................................... 12
       Children in Poverty.............................................................................................................................. 13
       Seniors in Poverty ............................................................................................................................... 14
   Financial Health....................................................................................................................................... 14
       Estimates of Household Wealth and Financial Access........................................................................ 14
       What It Takes to Raise a Family .......................................................................................................... 15
   Summary ................................................................................................................................................. 15
Housing ....................................................................................................................................................... 16
   Fair Market Rent ..................................................................................................................................... 16
   Affordable Rent ....................................................................................................................................... 16
   Senior Housing - Our Aging Population .................................................................................................. 18
   Housing Units .......................................................................................................................................... 19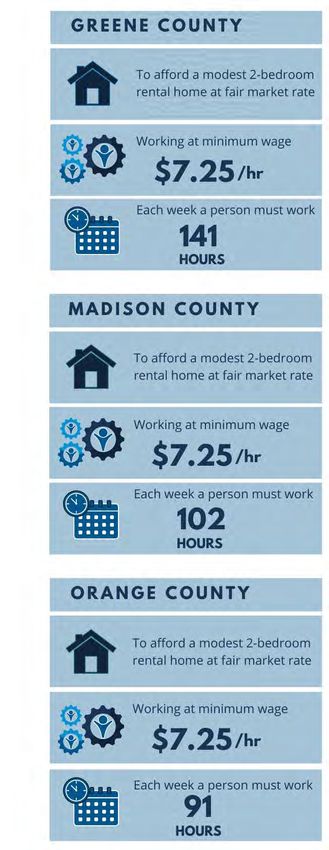
Housing Age ............................................................................................................................................ 20
       New Housing Starts – Building Permits............................................................................................... 20
   Foreclosures ............................................................................................................................................ 21
       Foreclosure Rates: January 2020 ........................................................................................................ 21
   Evictions .................................................................................................................................................. 21
       Eviction Rates ...................................................................................................................................... 22
   Homelessness ......................................................................................................................................... 22
Education .................................................................................................................................................... 23
   Graduation and Drop-Out Rates ............................................................................................................. 23
   Educational Attainment .......................................................................................................................... 24
Health & Wellness....................................................................................................................................... 25
   2019 County Health Rankings ................................................................................................................. 25
   Nutrition.................................................................................................................................................. 26
       Supplemental Nutrition Assistance Program (SNAP) .......................................................................... 26
       Free/Reduced Lunch ........................................................................................................................... 26
       Food Insecurity.................................................................................................................................... 27
Economic Data ............................................................................................................................................ 28
   Employment ............................................................................................................................................ 28
       Top 10 Employers by County .............................................................................................................. 28
   Unemployment ....................................................................................................................................... 28
Transportation ............................................................................................................................................ 28
   Commuting Patterns ............................................................................................................................... 29
   Travel Time.............................................................................................................................................. 29
Broadband Access ....................................................................................................................................... 30
IDENTIFYING COMMUNITY NEEDS.............................................................................................................. 31
   Community Partner / Community Member Surveys .............................................................................. 31
       Support for children ............................................................................................................................ 31
       Housing ............................................................................................................................................... 31
       Adult employment/education ............................................................................................................ 31
       Household budget/expense ................................................................................................................ 31
       Seniors................................................................................................................................................. 31
       Emergency services ............................................................................................................................. 31
       Skyline CAP programs ......................................................................................................................... 31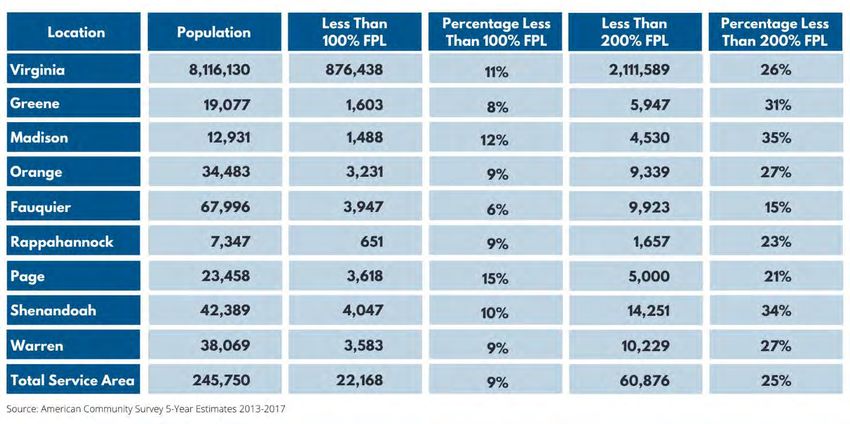
Individuals Living in Poverty.................................................................................................................... 32
       Employment ........................................................................................................................................ 32
       Adult Education................................................................................................................................... 32
       Housing ............................................................................................................................................... 32
       Nutritional ........................................................................................................................................... 32
       Financial .............................................................................................................................................. 32
       Transportation .................................................................................................................................... 32
       Childcare ............................................................................................................................................. 32
       Emergency Services ............................................................................................................................ 32
       Healthcare/Dental............................................................................................................................... 32
       Seniors................................................................................................................................................. 32
   Key Informant Interviews........................................................................................................................ 33
Community Resources ................................................................................................................................ 34
   Greene County ........................................................................................................................................ 34
       Local Government ............................................................................................................................... 34
       Emergency Services & Public Safety ................................................................................................... 34
       Medical Services.................................................................................................................................. 34
       Education ............................................................................................................................................ 34
       Child Care ............................................................................................................................................ 35
       Public Housing..................................................................................................................................... 35
       Senior Services .................................................................................................................................... 35
       Social Service Providers ...................................................................................................................... 35
       Utilities ................................................................................................................................................ 36
       Transportation .................................................................................................................................... 36
       Public Library....................................................................................................................................... 36
       Parks & Recreation .............................................................................................................................. 37
   Madison County ...................................................................................................................................... 37
       Local Government ............................................................................................................................... 37
       Emergency Services & Public Safety ................................................................................................... 37
       Medical Services.................................................................................................................................. 37
       Education ............................................................................................................................................ 37
       Child Care (licensed) ........................................................................................................................... 38
       Public Housing..................................................................................................................................... 38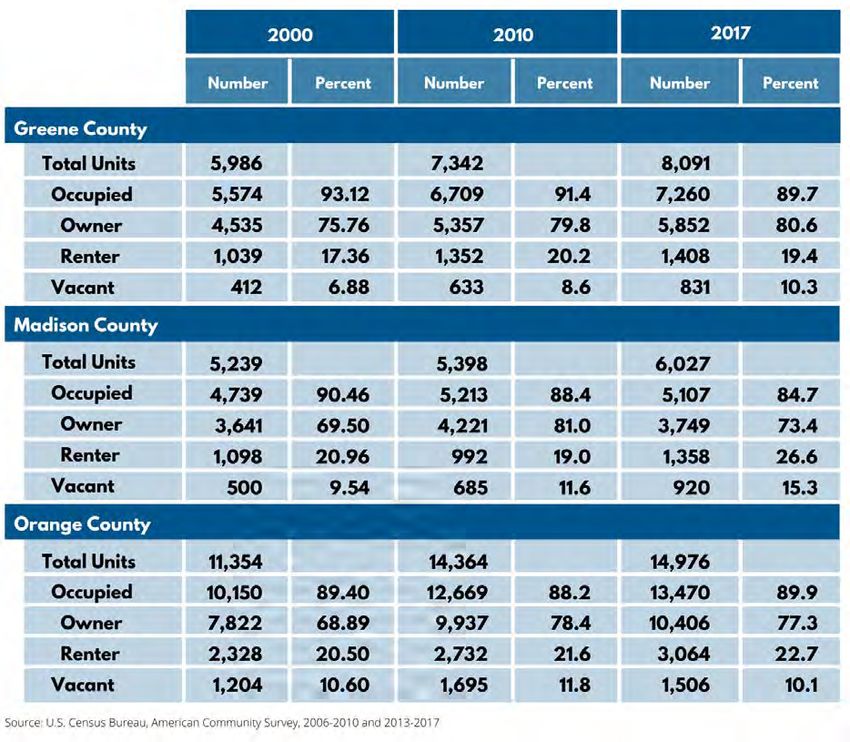
Senior Services .................................................................................................................................... 38
       Social Service Providers ...................................................................................................................... 38
       Utilities ................................................................................................................................................ 39
       Transportation .................................................................................................................................... 39
       Public Library....................................................................................................................................... 39
       Parks & Recreation .............................................................................................................................. 39
   Orange County ........................................................................................................................................ 40
       Local Government ............................................................................................................................... 40
       Emergency Services & Public Safety ................................................................................................... 40
       Medical Services.................................................................................................................................. 40
       Education ............................................................................................................................................ 40
       Child Care (licensed) ........................................................................................................................... 41
       Public Housing..................................................................................................................................... 41
       Senior Services .................................................................................................................................... 41
       Social Services ..................................................................................................................................... 42
       Utilities ................................................................................................................................................ 43
       Transportation .................................................................................................................................... 43
       Public Library....................................................................................................................................... 43
       Parks and Recreation .......................................................................................................................... 43
References .................................................................................................................................................. 44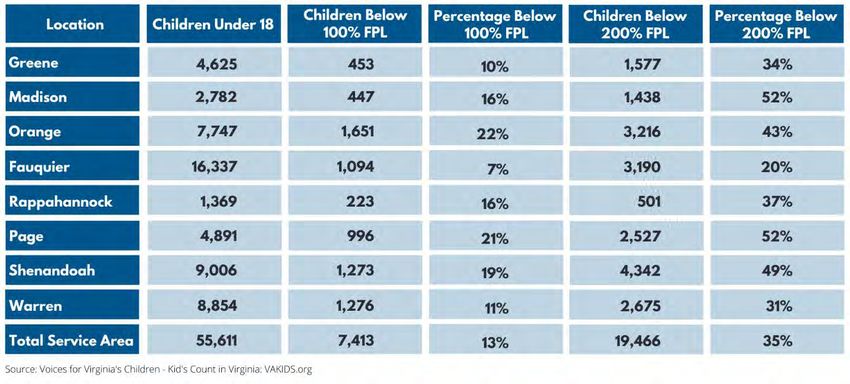
Executive Summary
Skyline CAP is a nonprofit community action agency (CAA) designated by the Governor of the
Commonwealth of Virginia and approved by the localities it serves to provide resources that combat
poverty. Incorporated in 1990, the agency offers education and housing programs designed to empower
families and individuals to become self-sufficient. A designated CAA for Greene, Madison and Orange
counties located in central Virginia, Skyline CAP extends some of its programs to the counties of
Fauquier, Page, Rappahannock, Shenandoah and Warren.

Skyline performs a comprehensive needs assessment every three years to determine the underlying
causes and conditions of poverty within the communities we serve and identify available resources to
address the unmet needs of the communities’ most vulnerable residents. The assessment helps
determine the agency’s priorities, guiding the development and implementation of programs and
services, organizational improvements and allocation of resources with the purpose of lifting families
and communities out of poverty.

The assessment includes both qualitative and quantitative data derived through research, surveys,
meetings and interviews. Community partners and members, including Skyline CAP’s Board of Directors
and employees, received electronic surveys asking them to provide informed opinions based on their
experience, either personally or professionally, as to the needs they believe are most important. In
addition, staff and members conducted in-person surveys in Greene, Madison and Orange counties to
hear directly from those who experience the daily struggle associated with living in poverty.

Other tools used include focus group meetings and key informant interviews with officials who work
daily helping people in need in the community. The value of using these tools is that one can dig deeper
in an effort to uncover why a particular need exists. For example, seniors in the community identified
transportation as a top need. However, there are resources available to address transportation for
seniors, so why does it continue to be identified as a top need? Through discussions, it was determined
that the organizations providing the resource are unable to create schedules that provide timely access
to medical appointments without excess wait time on both the front and back end. Why is that?
Organizations like FAMS (Foothills Area Mobility Systems) indicate that they are having difficulty
attracting drivers. Again, we must ask why this is the case. Ultimately, it was uncovered that potential
drivers are concerned about liability should something happen to a senior during transport and they are,
therefore, unwilling to volunteer to help.

Conclusions by the Board
The Board of Directors at Skyline CAP reviewed the results of information compiled as part of the needs
assessment process. The Board concluded that the following areas are both causes and conditions of
poverty, and data included in this report supports the continuation of Skyline CAP’s programs to address
the associated needs in its service area.

                                                                                                         1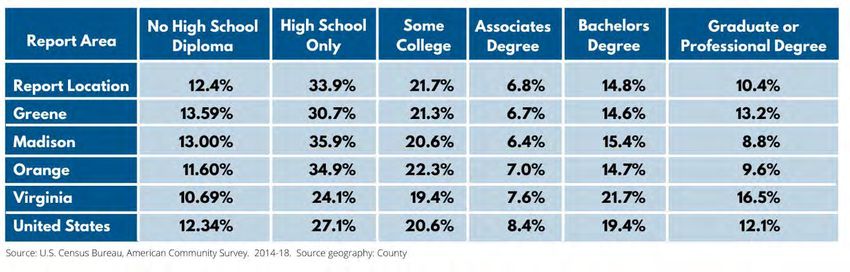
I.      Employment

           Employment services that support entrance to the workforce, job stability and career
           advancement are priorities in Skyline CAP’s service area. Services needed include help
           writing resumes and developing strong interview skills, apprenticeships and on-the-job
           training. These services are needed to support employment at the top of a person’s skillset
           and contribute to the development of financial security. A key area of need is child day care
           and, in some cases, evening child care for those attending college courses at night.

    II.    Housing

           Safe, affordable housing is necessary for a stable home environment. Services to support
           this need include rental assistance, home repairs for accessibility and safety, counseling
           services to maintain a budget or prevent foreclosure, and low-cost income-based rental
           housing.

   III.    Education

           Opportunities for education that focus on our most vulnerable residents. Areas of need
           include more affordable options for daycare.

   IV.     Financial Capability

           Programs that increase financial capability through knowledge and skills training, including
           basic money management and financial literacy skills, to help families and individuals better
           manage resources and work toward achieving economic security.

Skyline CAP offers the following programs and services to address the needs as identified and reported
later in this report:

Employment is a priority need in Skyline’s service area. Employment concerns include workforce
services to help in obtaining employment, including completing applications and writing resumes as
well as preparing for a job interview. Additional needs concern increasing job skills through
apprenticeships and on-the job training in support of job stability and career advancement.

Skyline CAP currently offers a youth job skills training opportunity for an area college student.
Beyond this, Skyline does not offer specific services to address other employment issues cited.
However, other services offered, specifically housing programs, provide for stability in support
of entering the workforce. Skyline also offers referral services to other social service providers
in and near our service area.
Safe, affordable housing for renters and homeowners, including education and counseling to
help ensure a stable home environment.
Housing Choice Voucher (rental assistance) – a federal housing program to assist low-income
families, the elderly and the disabled to afford decent, safe, and sanitary housing in the private
market. The program covers a portion of the voucher holder’s rent expense, freeing up funds to
cover other necessities such as food and/or medicine.

                                                                                                         2
Housing Counseling – as a HUD-approved housing counseling agency, Skyline CAP helps clients
with matters related to obtaining or maintaining rental housing, including understanding their
rights as a tenant. Working one-on-one with clients and through group counseling and
workshops, Housing Counselors promote stable housing and prevent homelessness by
providing ongoing budget counseling and service referrals.
Affordable Rental Housing – income-based rental property for low-income families and
individuals.
Emergency Home Repair – for owner-occupied dwellings in need of basic health and safety
repairs, with priority given to seniors and persons with disabilities.
First-Time Homebuyer – a program offered in Greene County to provide affordable single-
family homes for purchase to workforce families.
Opportunities for education that focus on our most vulnerable residents, including more affordable
options for daycare.

Head Start – a free preschool program for 3 and 4-year old children from income-eligible
families that focusing on preparing children for kindergarten and providing services to their
families to improve their capacity to be self-sufficient.
Healthy Families – a voluntary home visit program designed to assist families and their children
from birth to age 5. With a focus on enhancing child welfare, health and development, the
program equips families with tools and resources to help them create strong, lifelong
relationships with their children.
Project Discovery – educational outreach to public school students in Madison and Orange
counties that focuses on helping students overcome issues that might otherwise prevent them
from graduating high school.
Basic money management and financial literacy skills to help increase the capacity to set and meet
goals as a means toward achieving economic security.

Financial Skills Training – in both group workshops and one-on-one sessions, counselors help
individuals and families develop financial goals and a spending plan to help them achieve the
goals.
Foreclosure Prevention Counseling – HUD-certified counselors serve as mediators between homeowners
and their lenders to arrange for mortgage modifications or payment changes in order to prevent
foreclosure. Clients are required to work with counselors to develop and maintain budgets.

Homebuyer Preparedness – Counselors educate clients about the basics of purchasing a home,
help them evaluate their financial readiness, and refer them to additional resources when they
are prepared to purchase a home.

                                                                                                     3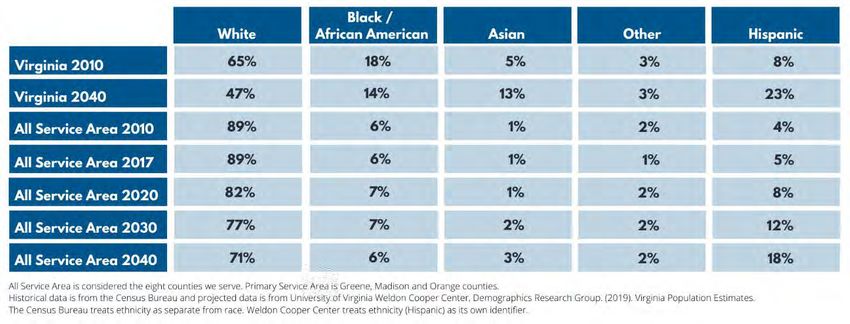
Renter Skills Training – In both group workshops and one-on-one sessions, counselors provide
renters with the basic skills and knowledge they need to be responsible renters.

Purpose of Report
Regular assessment of needs and resources at the community level is the foundation of
Community Action and serves to ensure that programs and services are responsive to
community needs. Skyline CAP conducts a comprehensive community needs assessment of the
geographic service areas we serve every three years. This practice generates a vital
management and leadership tool used to inform our programming, which is also intended to be
an available resource to the communities we serve.

Report Area
Data collected is based on Skyline CAP’s primary service area of Greene, Madison and Orange
counties.

Target Population
As a community action agency, Skyline is focused on assisting income-eligible individuals and
households as defined and benchmarked by the Federal Poverty Level Guidelines (FPL) each
year (see index). However, as a social service provider and community builder, we are aware
that there are needs in the community that affect families and individuals who are not
considered to be low-income; consequently, Skyline has programming that is not specifically
tied to the FPL. For example, we have housing programs that can benefit those defined by the
U. S. Department of Housing and Urban Development (HUD) as low-income, which includes
families and individuals living at 50 to 80 percent of the Area Median Income (AMI) (see index).
Improving the economic vitality of the community, more holistically, benefits everyone.

Agency and Client Overview
Skyline CAP is the designated community action agency providing comprehensive services for
low-income families in our primary service area of Greene, Madison and Orange counties.
Additional services are also provided in five additional counties. The table below maps our
geographic reach by program.

                                                                                               4
Head Start
Head Start is a free preschool program for three and four-year-old children from income-
eligible families that helps prepare them for kindergarten by helping them develop cognitively,
socially, emotionally, and physically in a positive learning environment. The program is also
designed to provide services to the families to improve their capacity to be self-sufficient.
Skyline CAP operates 10 Head Start classrooms, four in Greene and Madison counties and six in
the counties of Page, Shenandoah and Warren. The Orange County Head Start program is
operated by Orange County Public Schools.
Healthy Families
Launched in 2018, Skyline CAP’s Healthy Families program is designed to assist families and
their children from birth to age 5. This voluntary home visit program focuses on enhancing child
welfare, health and development, and equips families with tools and resources to help them
create strong, lifelong relationships with their children.
Skyline CAP offers its Healthy Families program in the counties of Fauquier, Madison, Orange
and Rappahannock.
Project Discovery
Skyline CAP’s Project Discovery program provides educational outreach to public school
students, focusing on helping them overcome issues that might otherwise prevent them from
graduating from high school. Students are also provided with resources and opportunities to
explore options for life after high school.
Skyline CAP operates its Project Discovery program in Madison and Orange counties.
Housing Programs
Skyline CAP offers several programs related to provide safe, affordable housing is a main focus
for Skyline’s housing programs and services.
Housing Choice Voucher Program – In partnership with the Virginia Housing Development
Authority (VHDA), this program provides a tenant-based voucher that allows households to rent
housing where they desire if the home meets certain health and safety codes as determined by
the U.S. Department of Housing and Urban Development (HUD). The voucher pays a rental
subsidy and the tenant pays the remainder. Eligibility is primarily based on income. Seniors and
persons with disabilities are given preference. Households must certify their income every year
for continued program participation.
Affordable Rental Housing – Income-eligible individuals and families may apply to live at a
reduced rent in properties owned by Skyline CAP in Madison and Greene counties. Qualified
incomes may not exceed 50 percent of the fair market rent.
Counseling – as a HUD-approved housing counseling agency, Skyline CAP helps clients with
matters related to obtaining or maintaining rental housing, including understanding their rights
5as a tenant. Working one-on-one with clients and through group counseling and workshops,
Housing Counselors promote stable housing and prevent homelessness by providing ongoing
budget counseling and service referrals.
Emergency Home Repairs – Home repair services are available for owner-occupied dwellings in
need of basic health and safety repairs including plumbing, electrical, safety and accessibility
(wheelchair ramps). Priority is given to seniors and persons with disabilities.
First-Time Homebuyer – a program to provide affordable single-family homes for purchase to
workforce families. This program is currently offered in Greene County only.
6Demographic Data
Population
In the eight counties served by Skyline CAP, population growth over the next 20 years is
projected to be strong, increasing approximately 18 percent from 2017 to 2040. This is slightly
below the statewide growth projection of 20 percent. Growth in Greene County will be the
most robust as it absorbs the overflow from the Charlottesville area. The counties of Madison,
Page, and Rappahannock will see little growth.
There is no identifiable shift in the population projection during this time frame between
gender with males at 49 percent and females at 51 percent.
Population Growth by County – All Service Areas
Population Growth by Age
An evaluation of the data collected reveals that the greatest demographic shift will be in the
elderly population. In Virginia, during the period 2010 to 2017, the elderly population of 65+
grew 30 percent, and an additional 51 percent growth is projected by 2040. The 65+ cohort is
showing strong growth (>20%) in all counties except for Rappahannock (7%) and Shenandoah
(17%).
In our primary service area, the 65+ cohort increased 25 percent over the last seven years, and
the projection for 2040 is an additional 58 percent (see table below). In our primary service
area, youth (0-19) population growth was flat over the past seven years and is projected to
grow 22 percent by 2040. In the 20-64 age range, population grew three percent over the past
seven years, and this demographic is projected to grow an additional nine percent by 2040.
However, Madison County is projected to see a decline in this age group. Today, in our primary
7service area, about one in five are 65+. By 2040, the projection takes that ratio to one in four.
This shift in age, and the role(s) Skyline may need to fill, will require evaluation.
It should be noted that population growth in Madison County may present a different set of
challenges. The growth for the 0-19 age group shows seven percent growth from 2017 through
2040, but when reviewed from 2010 through 2040 it is flat. Regardless, if the age cohort of 20-
64 is representative of taxpayers, and the cohorts of 0-19 and 65+ are the more service
intensive, Madison County may face a different set of problems than Orange and Greene.
8Population by Race and Ethnicity
According to the U.S. Census Bureau, by 2040 the racial makeup of the nation will shift, and for
the first time non-Hispanic whites will make up just less than half of the population. This trend
will be apparent in Virginia as well. The Hispanic population will grow from eight percent to
approximately 23 percent, an increase of 15 percent, or almost one in four people. This trend
will also be apparent in our areas of service, growing from four percent to 18 percent of the
total population. By 2040, almost one in five people living in our service area will be Hispanic.
This shift may require enhanced cultural understanding and potentially a need for additional
multilingual capacity.
9Income
Throughout the United States, the general trend for the past 50 years has been very slow
income growth at the lower income levels and stronger growth at the higher income levels. This
has created a tiering effect within our economy and a loss of economic mobility. It has become
increasingly difficult for low-income families to develop wealth, send children to college, buy
homes, etc. It is a topic of great public policy discussion. The table below illustrates these
national trends representing household income by quintile. Each quintile represents one-fifth of
the population. The bottom two quintiles (5th quintile: 0 to 20 percent and 4th quintile: 21
percent to 40 percent) show very little, if any, household income growth over the past 50 years.
Household mean income at the 5th quintile is $13,775; for the 4th quintile it is $37,293; and
$63,572 for the middle quintile.
Source: advisorperspectives.com
10Median Household Income
The table to the right compares the
median household income and per capita
income for counties in Skyline CAP’s
service area as well as state and national.
Poverty
The Federal Poverty Level (FPL) is a
measure of income used by the U.S.
government to determine who is eligible for federal subsidies, programs and benefits. The
Department of Health and Human Services updates the poverty guidelines each January. The
FPL is used as a benchmark across the federal government. For example, SNAP (Supplemental
Nutrition Assistance Program) eligibility occurs at 133 percent of FPL and below. The Affordable
Care Act used FPL to benchmark income levels and insurance subsidies. Free and reduced
school meals are benchmarked from the FPL guidelines. There is a rough correlation between
HUD subsidy levels for fair market rent and the Housing Choice Voucher Program and for HOME
Funds. The table below shows FPL up to 200 percent for a household of six.
Federal Poverty Guidelines – 2019
11Poverty All Ages
The number of individuals living in poverty in our service area is 22,168 (9%) at or below 100
percent of FPL, and 60,876 (25%) at or below 200 percent of FPL. This is slightly below the state
levels of 11 percent and 26 percent. Living below 200 percent of FPL is difficult. Unless there is a
significant change in public and/or fiscal policy, or a significant change in the local economy
through a new and large employer, there is no reason to think there will be a change in the
local poverty numbers.
Family Poverty
A total of 4,130 families are reported to be in poverty in the total area served by Skyline CAP, which
encompasses eight counties. Of that total, more than half were single parent households in which the
householder is female.
12Children in Poverty
Poverty amongst children also remains high. In Virginia, seven percent of all children are at or
below the 100 percent FPL, and 33 percent are at 200 percent of FPL or lower. In our service
areas there are 3,537 children living below 100 percent FPL and 19,145 below 200 percent.
Important subsidy programs discontinue at different levels of FPL. For example, SNAP eligibility
stops at 133 percent of FPL.
Children Under 18 Living in Poverty
Newborns in Poverty
Data available shows
newborns in our
service area continue
to be born into low-
income households as
show in the table
below.
Historical trends show
families with children
in poverty will remain a
primary concern.
13Seniors in Poverty
According to the American
Community Survey (ACS) 5-year
data, an average of 5.0% of
people ages 65 and older lived
in a state of poverty. The
poverty rate is less than the
national average of 9.3%.
Financial Health
In 2019, Prosperity Now reported that 40 percent of U.S. households are liquid-asset poor. In other
words, should they lose their source of income, these families do not have enough money saved to
cover basic expenses for three months. According to a report from Children and Youth Services Review,
nearly two-thirds of American children live in families that lack sufficient funds to get them through a
crisis. This is more likely in families with young parents who are less educated or not working. Children
of single mothers also were at higher risk of asset poverty. When a family lacks assets, they have no
savings to fall back on in times of crisis. This applies to about half of all households in our service area.
A step to improve financial health is savings and banking. As reflected in the table below, just under five
percent of the population in each county in our service area is either unbanked or underbanked. This
number is relatively consistent with our last needs assessment conducted in 2017. The underbanked are
those who have a bank account but also rely on other sources for money orders, check-cashing services,
payday loans, etc., putting themselves at risk for extra fees, inflated finance charges and predatory
lenders who target the poor and less educated as well as people in crisis and needing immediate cash.
Estimates of Household Wealth and Financial Access
14Those living in poverty struggle to meet their needs and often have nothing left to save. All their
earnings are used to merely exist. Compounding the problem is the danger of losing public assistance if
they are able to save and accumulate a cushion. The incentive to save and plan ahead is lost.
What It Takes to Raise a Family
This visual aid represents the average monthly
expenses for a single parent with two children
living in Skyline CAP’s service area next to the
average monthly earnings. The gap between
income and expenses causes many families to
struggle, making them vulnerable to predatory
loan makers (payday loans).
Key programs that help working families,
including refundable tax credits, Medicaid, and
SNAP, can reduce or eliminate the gap between
earnings and living costs.
Skyline CAP’s financial skills counseling and
workshops aim to make our clients
knowledgeable about their finances and give
them the tools to enable them to budget their
money to avoid pitfalls.
Summary
There is nothing in the demographic data suggesting any relief for those in lower-income
groups. Without a significant change in public and/or fiscal policy, or a significant change in the
local economy, there is no reason to think there will be a change in the local low-income
numbers. Demographic shifts toward the elderly and Hispanic population could have an impact
on the services needed in our areas of service.
15Housing
In Virginia, 46 percent of low-income households are cost burdened, due in part to a significant lack of
affordable rental homes. These households spend more than half of their income on housing, which
means they then must sacrifice other family needs and, in some cases, experience eviction.
Skyline CAP is the administrator of VHDA’s housing choice voucher (HCV)program in our service area.
Through this program, a household may rent a unit at a cost that does not exceed the fair market rent
(FMR) as established by HUD. (See table below.) Households pay no more than 30 percent of their
income toward rent, while the voucher pays the remaining balance directly to the landlord. With a lack
of funds as well as suitable housing stock available in Skyline’s service area, the program has a significant
waiting list.
Fair Market Rent
Affordable Rent
Affordable rent is defined by the guideline that the amount paid in rent and utilities should not be more
than 30 percent of a household’s total earnings. Using this guideline, the chart below details the hourly
wage needed to afford a two-bedroom home at the fair market rent amount. Note: figures assume an
individual works 40 hours per week for 52 weeks each year.
16The estimated average renter wage is an average
of the hourly amount earned by all renters. The
affordable rent per household is determined
using the average hourly earnings amount and
the 30 percent guideline.
As an example, a single mother with one child
living in Greene County who earns a wage of
$8.91 per hour should not pay more than $484
per month for a two-bedroom home.
Considering the fair market rental rate for a two-
bedroom home is $1,325 in Greene County, it is
unlikely that she will be able to find affordable
housing. It is also of interest that a single mother
earning $8.91 per hour makes more than the FPL
and, therefore, she is not eligible for assistance.
As a result, she will struggle to make ends meet.
The infographics to the right reflect the actual
number of hours a person making minimum
wage would have to work in order to be able to
afford a modest two-bedroom rental unit in each
of the counties in Skyline's service area.
In addition to the average rates for the three-
county service area, the affordable rent and
annual income amounts for individuals earning
the state minimum wage amount have been
provided.
17Senior Housing - Our Aging Population
A growing trend in the U.S. associated with seniors is the desire to age in place, defined by the U.S.
Centers for Disease Control and Prevention as “the ability to live in one’s own home and community
safely, independently and comfortably, regardless of age, income or ability level.” According to an AARP
(American Association of Retired Persons) survey, about 90 percent of seniors living in America desire to
live in their homes for as long as possible.
Aging in place is important to seniors because it provides a sense of control over daily routines, activities
and other day-to-day decisions and improves their quality of life which, in turn, improves their physical
health. There is emotional value associated with aging in place as a person’s home may provide a sense
of refuge and comfort as well as a sense of security and familiarity. Conversely, there is an emotional toll
associated with having to leave one’s home and move to a care facility, oftentimes leading to
depression. Perhaps not surprisingly, it is believed that aging in place reduces the risk of illness due to
decreased exposure to bacterial and viral infections whereas people living in health facilities are more
often exposed to these risks. While there may be costs associated with aging in place, like repairs and
modifications to the home and the potential need for in-home care, the costs are typically less
expensive than living in a facility.
Population growth by age in our service area reveals a significant demographic shift in the elderly
population between 2010 and 2017, with the 65+ cohort growing by 39 percent in Greene County and
20 percent in Orange County during this time period. This growth has likely contributed to the increase
in applications for our emergency home repair services, which is expected to increase further still, with
growth in the 65+ cohort projected to grow 105 percent in Greene County and 52 percent in Orange
County by the year 2040.
18Housing Units
Homeownership in rural areas is typically higher than the rest of the country. The same is true for
Skyline CAP’s service area. While renter occupancy as a percentage of total occupied homes has
remained relatively steady in Greene and Orange counties since the last census, Madison has
experienced growth of nearly 37 percent.
19Housing Age
New housing starts in Skyline CAP’s service area have increased over the last few years resulting in a
lower median age overall. With fewer housing starts, Madison County’s housing stock remains older
than that of Greene and Orange counties where growth is more robust.
New Housing Starts – Building Permits
20Foreclosures
Foreclosures occur when a bank repossesses a home because the owner has stopped making payments.
Overall, foreclosure rates in Skyline’s service area have dropped consistently since 2010 when there
were 810 families who lost their homes to foreclosure. Currently, both Orange and Greene are trending
higher than both the state and national rates, while Madison is level with state rates.
Foreclosure Rates: January 2020
Evictions
When tenants fail to pay their rent, they are at risk of being evicted by their landlord. While there are
other reasons that might lead a landlord to evict a tenant, most evictions are a result of missing rent
payments. Too often, this happens when a family spends more than 30 percent of their income on
housing costs and an unanticipated expense – a medical bill, car repairs – places them in a position
where they are unable to cover all their expenses.
While housing costs have steadily increased, incomes for most Americans have remained stagnant, and
there has been no increase in housing assistance to meet the needs of poor renting families. According
to the Eviction Lab, assistance is available to only one in four Americans who qualify.
Those with the highest risk of eviction include poor women – especially women of color – and domestic
violence victims and families with children. Very often, families lose their possessions and the stress can
result in poor performance, putting their jobs at risk. Eviction can be particularly traumatizing for
children because the home represents both psychological and physical security. Losing this sense of
security can lead to physical and mental health problems and poor performance in school.
The most recent data on evictions in our service area is 2016 when the eviction rate was reported to be
2.20 percent, less than half the rate of the state of Virginia but on par with the nation overall.
21Eviction Rates
Homelessness
According to the U.S. Department of Housing and Urban Development, a person who lacks a fixed,
regular, and adequate nighttime residence is considered homeless. Rural areas tend to have higher rates
of unsheltered homeless due to the lack of services and shelters. In Skyline CAP’s service area, families
seeking shelter are referred to organizations in the community. Among those options are Barbara’s
House in Madison, shelters in Charlottesville, Culpeper and Harrisonburg, and various church
organizations that open their facilities overnight.
22Education
The period from birth through third grade is the most important period of learning in a child’s life. Being
able to read proficiently by third grad will set a child on a path to lifelong learning. In contract,
deficiencies will cause the child to struggle as learning and comprehension depends on the ability to
read text. According to a study by the Annie E. Casey Foundation, children are learning to read through
the end of third grade. Once they enter fourth grade, however, that are reading to learn.
Skyline CAP’s Head Start program addresses some of the need for early childhood education in our
service area, specifically Greene and Madison counties. Orange County Public Schools offers Head Start
in Orange County.
With few opportunities for additional learning, children in our service area are at a disadvantage. Most
programs are not available until the child has entered third grade.
Graduation and Drop-Out Rates
According to the Alliance for Excellent Education, “individuals who drop out of high school are far more
likely to spend their lives periodically unemployed, on government assistance, or cycling in and out of
the prison system.” Addressing drop-out rates and ensuring a complete high school education will lead
to better employment opportunities and increase the likelihood that an individual will contribute to the
local economy.
Skyline CAP’s Project Discovery program provides educational outreach to public school students in
Madison and Orange counties focused on helping students overcome issues that might otherwise
prevent them from graduating high school. Students are also provided with resources and opportunities
to explore options for life after high school.
23Educational Attainment
Studies show that quality of life is linked to educational attainment. Lifestyles are healthier and
participation in societal activities such as volunteerism and voting increases with the level of an
individual’s education. Society benefits as well through economic growth and stability.
Educational attainment in Skyline CAP’s service area is shown in the table below.
Of the Skyline CAP clients who provided information regarding their educational attainment,
approximately 36 percent achieved a high school diploma only. Nearly half did not complete high school.
Only 15 percent obtained some level of post-secondary education.
Of the households seeking services and assistance from Skyline CAP, 35 percent have levels of income at
100 percent or below the poverty level, reflecting a likely correlation to lack of education. Training
programs are needed to help the unemployed as well as the underemployed find meaningful
employment and boost earnings, which could include on-the-job training and apprenticeships. Help with
writing resumes and interview techniques, job search and placement would also improve employment
prospects.
24Health & Wellness
2019 County Health Rankings
The County Health Rankings Report is designed to help counties understand what influences the health
of residents and how long they might live. The rankings look at a variety of measures that affect the
future health of communities, such as high school graduation rates, access to healthy foods, rates of
smoking, obesity, and teen births. This chart reflects the 2019 comparisons of Skyline CAP’s service area
as ranked amongst Virginia’s 134 counties.
25Nutrition
Supplemental Nutrition Assistance Program (SNAP)
The Supplemental Nutrition Assistance Program (SNAP) assists income-eligible households with
purchasing nutritious food. One in four children in the United States live in families participating in
SNAP. The health benefits of SNAP are many:
improved child health, improved caregiver
health and increased food security for
families and children. In addition, families
participating in SNAP are in a better position
to pay for medical expenses and still be able
to cover food, rent and utilities.
Free/Reduced Lunch
A student from a family that is SNAP eligible
is automatically eligible for free or reduced-
price lunches at school through the National
School Lunch Program. Students from
families with incomes at or below 130
percent of the federal poverty level (FPL) are
eligible for free meals. Families with incomes
between 130 percent and 185 percent of the
FPL are eligible for reduced-price meals.
It is important to understand the impact of poverty and hunger on a student’s capacity to learn.
Teachers interacting with students on a daily basis are in a position to recognize signs of hunger and to
help the student and family find assistance.
26Food Insecurity
According to Feeding America, one in 10 people in Virginia struggles with hunger. Termed food
insecurity, families and individuals do not have reliable access to enough affordable, nutritious food. The
chart below reflects food insecurity in Skyline CAP’s service area:
Low Income and Low Food Access
Low food access is defined as living more than one-half mile from the nearest supermarket, supercenter,
or large grocery store.
There are a number of resources available in our service area to help reduce hunger. In Orange County,
BRAFB provides a mobile food pantry to enhance existing resources by providing access to underserved
areas. In Madison County, representatives from nonprofit and faith organizations are also working
together with BRAFB to address food insecurity in Madison and nearby Culpeper County. Dubbed
MUNCH (Madison United for Nutrition and Community Health), the group will also sponsor the
distribution of Senior Food Boxes through BRAFB’s Reach Program. The Madison Senior Center recently
started a similar distribution to its members to provide nutritional food on days when the center is not
open.
27Economic Data
Employment
Top 10 Employers by County
Unemployment
Unemployment rates in our service area are below state
and national levels. Statistics do not reflect, however,
the underemployed, defined as highly skilled workers in
low-paying and/or low-skill jobs as well as part-time
workers who would prefer to be employed full-time.
Stable, gainful, full-time employment is the most
positive component for alleviating poverty. Training
programs are needed to help both the unemployed and
the underemployed find meaningful employment and
boost earnings, which could include on-the-job training
and apprenticeships. Help with writing resumes and
interview techniques, job search and placement would
also improve employment prospects.
Transportation
Transportation options are a hurdle for residents in rural areas, and those living in Skyline CAP’s service
area are no exception. Public transportation options are limited and not suited to reliable travel to and
from work each day. Therefore, in rural areas, residents typically provide their own transportation.
Unfortunately, people living in poverty do not always have the means to buy a vehicle. Of the residents
surveyed, more than 30 percent reported that they do not have enough money to buy or make a down
payment on a vehicle, nearly 17 percent shared that they have poor credit and are unable to get a loan,
and 20 percent reported that they don’t have enough money to cover the expense of maintain a vehicle,
28You can also read