Exploring the Effects of Safety Climate on Worker's Safety Behavior in Subway Operation - MDPI
←
→
Page content transcription
If your browser does not render page correctly, please read the page content below
sustainability

Article
Exploring the Effects of Safety Climate on Worker’s
Safety Behavior in Subway Operation
Yongliang Deng 1,2 , Haolun Guo 1, *, Miaomiao Meng 1 , Ying Zhang 1 and Shuangshuang Pei 1
 1    School of Mechanics and Civil Engineering, China University of Mining and Technology,
      Xuzhou 221116, China; dylcumt@cumt.edu.cn (Y.D.); TS19030175P32ME@cumt.edu.cn (M.M.);
      TS19030226P31@cumt.edu.cn (Y.Z.); Peiss0827@cumt.edu.cn (S.P.)
 2    Research Center for Digitalized Construction and Knowledge Engineering, China University of Mining and
      Technology, Xuzhou 221116, China
 *    Correspondence: TS19030134P31@cumt.edu.cn

 Received: 15 September 2020; Accepted: 30 September 2020; Published: 9 October 2020

 Abstract: The safety climate is becoming more and more important in the processes of subway
 operation safety management due to various accidents. The research objective of this study is to
 explore the effects of safety climate and personal factors on safety behavior in subway operation.
 First, a conceptual model is developed based on the literature review and expert experience. Then,
 data are collected from 352 workers in the Xuzhou subway operation company by questionnaire
 survey. Third, the structural equation model is employed to do model analysis based on SPSS
 and AMOS, and the final model is achieved through a serious of model tests and modification.
 At last, the quantitative effect of safety climate on worker’s safety behavior in subway operation is
 obtained and analyzed. The results show that the descending order of total influence effect of safety
 climate on safety behavior is safety attitude (0.36), safety communication (0.265), safety policy (0.238),
 safety education and training (0.1), management commitment (0.099), and safety participation (0.073),
 respectively. The total influence effects of mediator variables (safety awareness and safety ability) are
 0.242 and 0.194, respectively. This study would be beneficial by offering recommendations in regard
 to worker’s safety behavior to raise the safety level in subway operation.

 Keywords: subway operation; safety climate; safety behavior; structural equation model;
 public transportation

1. Introduction
      In the last few decades, the effects of safety climate on worker’s safety behavior have attracted
the interests of many researchers in various industries [1–3]. Because of the different perspectives
of researchers, the results of these studies have differed. Some researchers indicated that there is an
existing direct relationship between safety climate and safety behavior, while other researchers argued
that the relations should be mediated by other variables [4]. Due to the diverse behavior characteristics
and influence factors in different industries, their quantitative relations must be somewhat different.
      As the lifeblood of urban development, public transportation is related to urban development and
residents’ lives. Compared with other modes of transportation, public transportation plays a positive
role in improving efficiency, saving resources, and reducing pollution. Cartenì et al. [5] mentioned
that the e-Mobility Bus, as an environmentally friendly and powerful energy-saving system, plays an
important role in sustainable urban transportation. Ko and Oh [6] pointed out that wireless charging
trams overcome the shortcomings of traditional trams. Wireless charging electric trams can be powered
remotely from wireless charging infrastructure on the railway and can store the remaining electricity
in the battery. Macioszek et al. [7] indicated that the bicycle sharing system is an effective tool to

Sustainability 2020, 12, 8310; doi:10.3390/su12208310                      www.mdpi.com/journal/sustainability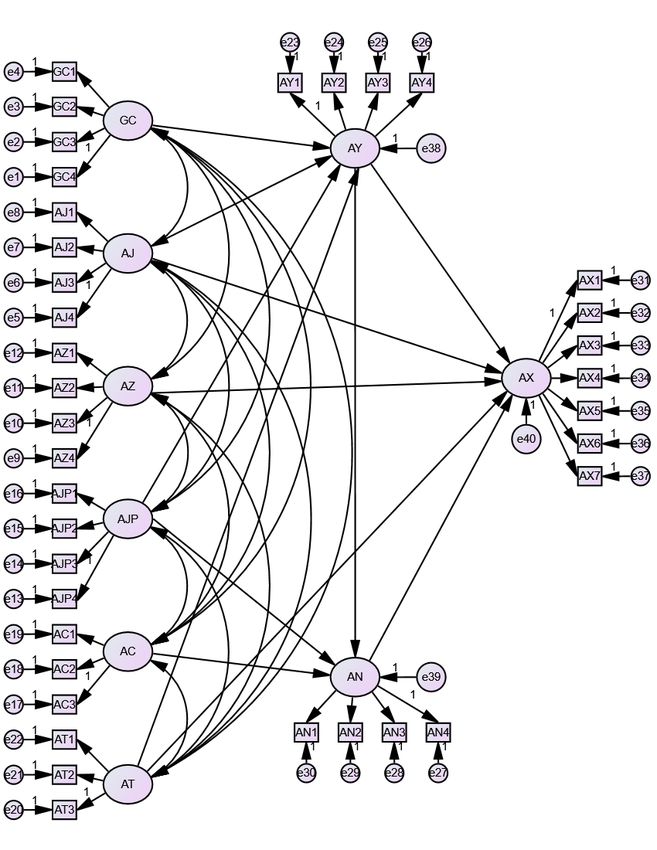
Sustainability 2020, 12, 8310                                                                        2 of 23

promote various modes of transportation and can be used as an element to improve the sustainable
transportation of cities. It brings great advantages in effectively reducing traffic congestion and using
urban space. In many cities around the world, people tend to establish Park and Ride Systems in the
suburbs, which enable users to combine personal transportation with public transportation, thereby
helping to reduce the number of cars entering the city center [8]. Corazza et al. [9] believe that in urban
transportation, local railways can not only solve the pollution problem of the urban environment,
but also provide a larger capacity of transportation methods to solve the city’s growing transportation
demand. After the opening of the subway, due to its advantage of speed and rapidity compared
with other means of transportation, it has attracted many passengers to transfer from other means of
transportation to the subway.
      The subway is an important part of urban public transport system in large cities. According to the
statistical data provided by China’s Ministry of Construction, up to 1 June 2020, 41 cities in total have
been approved to construct subway systems by China’s central government. Of those cities, 27 subway
systems have been put into operation with a total length of approximately 4000 km. In addition,
there are still several other cities who have submitted their application to the central government.
Owing to the nature of business and social significance of the subway system, its operation safety
involves many issues, such as staff safety, passengers’ safety, and the quality of the train service.
Notwithstanding continuous improvements in subway operation that have been made with time,
injuries and accidents occur in daily operation from time to time [10]. Safety and the steady operation
of the subway system heavily relies on committed staff of the operations division working around the
clock performing numerous running and maintenance activities. Unfortunately, Heinrich [11] indicated
that approximate 88% of the preventable accidents were triggered by unsafe behavior. In reality,
human error and unsafe behavior are critical causes of various accidents [12]. Similarly, human
behavior exerts a tremendous impact on the reliability and safety of subway operation. For instance,
owing to the errors of personnel operation, which were non-compliance with safety procedures,
two trains collided on 27 September 2011, in Shanghai, resulting in 284 citizens injured and severe
social influence. On 17 September 2019, eight passengers were injured when a train suddenly derailed
tens of meters in front of the station while approaching Hung Hom station.
      Unsafe behaviors of worker and passenger are one of the key predisposing factors of subway
accidents. In China, most of the subway systems have been suffering from high intensity of operation
due to the large volume of passengers [13]. Under such context, unsafe behaviors from staff and
passenger can hardly be prevented or even held back, giving rise to personal, financial, and social costs
at irregular intervals. From a recent study of Wan et al. [14], 65% of the subway operation incidents
from 2002 to 2012 were caused by unsafe passenger behaviors. Within that category, suicide is the
most typical unsafe behavior and has been given much attention [15,16]. There are also variety kinds
of unsafe behaviors regarding staff, such as exceeding speed limit, violation scheduling, management
deficiency, and poor maintenance, to name a few. For example, the accident that occurred in Beijing
subway on 5 July 2011, was triggered by the unsafe behavior of maintenance staff, and a similar accident
occurred at Line 10, Shenzhen Subway, on 27 August 2019. Zhang et al. [17] grouped precursors to
subway accidents into three categories, including human factors, equipment factors, and environmental
factors. The statistical analysis of three factors came to the conclusion that unsafe behavior is an
important direct cause of operation accidents.
      For the purpose of preventing subway accidents, one of the key issues is to acknowledge how
to eliminate unsafe behavior and promote safe behavior. Kyriakidis et al. [18] indicated that a better
safety climate with commitment and involvement is appropriate to reduce subway accidents caused
by human failure based on precursor analysis. Yuting chen et al. [19] indicated that safety climate
not only affected workers’ safety performance but also indirectly affected their psychological stress.
To our knowledge, there is no systematic study which has explored the effect of safety climate on
worker’s safety behavior in subway operation. The mechanisms of safety climate’s influence on
worker’s safety behavior is little known in subway operation. Additionally, its specific dimensions
Sustainability 2020, 12, 8310 3 of 23
also need further exploration. Hence, from the perspective of improving subway operation safety,
identifying and quantifying the effect of the safety climate on safety behavior is of great significance due
to practical necessity. Furthermore, targeted measures and regulations can be established to promote
safety behavior during daily work. Within such a background, an empirical study is implemented to
establish and validate a conceptual model of the effects of safety climate on worker’ safety behavior in
subway operation.
The rest of this paper is organized as follows. In Section 2, a literature review is presented on
safety climate and safety behavior, which contributes to the production of the theoretical basis for
developing the conceptual model. The structural equation model and data collection are expatiated in
Section 3. Subsequently, the results are displayed and a discussion of findings, potential contributions,
limitations, and suggestions is provided. In the end, the conclusions of this study are summarized
and analyzed.
2. Literature Review
2.1. Safety Climate
Zohar [20] originally developed the concept of safety climate, and constructed a 40-item measure
of organizational safety climate. Indicated by Zohar, safety climate could be utilized as a powerful tool
for understanding safety behavior. The definition of safety climate was introduced by Neal and Griffin
as “individual perceptions of policies, procedures, and practices relating to safety in the workplace”.
Petitta believes that safety climate is defined as a manifestation of these beliefs, principles and policies
in workplace practices and behaviors. Following this definition, safety climate could be deemed as a
current reflection of underlying safety culture [21–23]. Various studies were carried out to investigate
the influencing factors of safety climate, along with establishing numerous assessment instruments.
Nevertheless, in different industries, the influencing factors of safety climate are not in agreement, and
sometimes they would be contradictory [24,25]. In spite of inconsistencies, it had been empirically
proven that safety climate could have a significant impact on safety-related behaviors across various
industries [26–31]. The general conclusion would be that workers representing workplaces with a more
positive safety climate demonstrate higher levels of hazard recognition and safety risk perception, and
the better the safety climate, the less the unsafe behaviors and related accidents. For instance, empirical
evidence supported this conclusion in construction industry [32,33]. Li et al. [34] result show that
six SCDs (workers’ self-perception of safety, workers’ involvement in safety, co-workers’ interaction,
safety environment, safety management involvement, and safety personnel support) were significantly
important to the safety climate of the construction teams.
The importance of safety climate has been widely accepted. For measuring safety climate, a number
of key factors encompassing safety commitment, safety policy, safety training, and social support were
employed in various studies. Among those factors, safety commitment for management should be the
most fundamental one. Only when perceiving high commitments on safety made by senior managers
would the supervisors and workers show their increasing willingness to enhance the safety level to cater
to the safety management expectations. The majority of existing safety climate measures place either
direct or indirect emphasis on leader safety commitment [35]. The influence of management safety
commitment on safety outcomes was explored and uncovered in some research [36,37]. Safety policy
can be seen as the surface manifestation of belief and value concerning operation safety in company. It is
primarily about compliance with safety training, safety procedure, safety resource, and safety feedback.
DeJoy et al. [38] indicated that safety policy plays an important role in safety climate. Safety training
refers to vocational education and training in order to improve personal safety knowledge and skills.
It is one of the important parts of safety climate while analyzing the relationship between safety
performance and safety climate [39]. Social support, referring to safety support from coworkers and
supervisors, was believed to be a crucial factor at the microscopic group level. The importance of social
support consisted in the fact that the interactions among colleagues had an outstanding contributionSustainability 2020, 12, 8310 4 of 23
to work behavior [29]. Social support has been demonstrated to encourage safety communication
and safety performance to some extent [40,41]. Pressure from production could lead to a lower
priority on safety determined by managers and staff, under which some basic safety activities might be
ignored. Furthermore, production pressure could result in unsafe behaviors for the sake of fulfilling
the required works and avoiding possible adverse consequences [36]. Han et al. [42] pointed out
that perceived production pressure could bring about a degradation of safety management and an
increase in accident rate. In addition, safety knowledge and safety motivation were also key factors.
Campbell et al. [43] indicated that there are three determinants in work performance, including
declarative knowledge, procedural knowledge, and motivation. Subsequently, declarative knowledge
and procedural knowledge are gradually combined as safety knowledge in order to explain safety
behavior. Christian et al. [44] indicated that safety motivation and safety knowledge were strongly
related to safety performance.
From the above analysis, safety climate involves a wide range of factors, and the study of safety
climate in different industries also occupy an increasingly important significance. The safety climate
not only affects the safety performance of the enterprise, but also is closely related to the working
environment and safety condition of the enterprise. The security climate has proven to have a positive
and pervasive impact on a range of security outcomes at the individual and overall level [45].
2.2. Safety Behavior
Safety behavior refers to all behaviors in which people obey the work rules and can protect
themselves, tools, equipment, and other materials in the event of a safety accident. Research about
safety behavior has mainly paid attention to specific behaviors or actions exhibited by employees.
From the perspective of organizations, safety behavior is regarded as compliance actions with safety
policies and procedures, for instance, using protective facilities correctly and reducing exposures to
potential hazards. Habitual noncompliance behaviors against safety procedures and policies may make
the whole operating system vulnerable to failure, and it can be regarded as a root cause of incidents or
accidents. Some subsequent studies related to safety behaviors supported this point of view. Hofmann
and Stetzer [46] found that both the individual and group-level variables are associated with unsafe
behaviors, and safety climate and unsafe behaviors were associated with actual accidents in American
chemical processing plants, which suggested that exploring the mechanism of unsafe behavior was
most essential to reducing noncompliance and enforce safety management. Griffin and Neal [47]
classified safety-related behaviors into two kinds, namely safety compliant behaviors and safety
participation behaviors. The first behavior was used to describe “the core safety activities that need to
be carried out by individuals to maintain workplace safety”, while the second one was deemed as
“may not directly contribute to workplace safety, but do help to develop an environment that supports
safety”. Safety compliance describes adherence to core safety activities that must be carried out by
individuals to maintain a safe workplace. Safety participation, with its voluntary nature, usually
refers to safety behavior that extend normal requirements [48]. Based on the organization’s rules
and regulations, if an employee lacks safety participation, then the organization cannot punish the
employee. If an employee takes safety actions, then no distinct rules and regulations are implemented
for rewarding such behavior. That is, safety participation cannot be directly recognized through formal
procedures [49].
A study by Neal and Griffin [50] supported the fact that staff would like to allocate effort to
some discretional safety activities when perceiving safe working climate. A series of safety policies,
rules, procedures, standards, regulations, and specific criteria within an organization or system were
crucial to gain better safety outcomes, and safety initiative also played an important role at individual
level [51]. Baysari et al. [52] concluded that violations occur regularly in the rail industry, and the
majority of unsafe behaviors are caused by a slip in attention associated with decreased alertness and
physical fatigue. Langford et al. [53] provided a novel model to analyze safety behavior in bicycle
riding based on GPS data, and four types of unsafe behavior were evaluated, including wrong waySustainability 2020, 12, 8310 5 of 23
riding, speed, compliance with traffic signals, and compliance with stop signs. It is supposed that
this method could be extended to any kind of road user or vehicle. Aryee et al. [54] pointed out that
safety initiative will lead to actions that minimize the occurrence of safety-related events and injuries.
For example, promotion focus will motivate safety initiatives such as putting pressure on management
to take steps to improve safety conditions, which will minimize the frequency of safety related events
or near misses.
The importance of safety behavior has been recognized in the daily safety management. To improve
the level of safety production, we must improve the unsafe behavior of employees. Human beings are
the most active factor in safety production. The human factor is the main reason for the occurrence and
prevention of safety accidents. Choi et al. [55] concluded that improving employees’ willingness to
comply with management norms is an effective way to improve employees’ safety behavior. According
to the conclusion of the comprehensive model, Guo et al. [36] suggest combining the strategies of
“safety organization”, “safety group”, and “safety worker” to reduce the unsafe behavior on the
construction site.
2.3. Conceptual Model
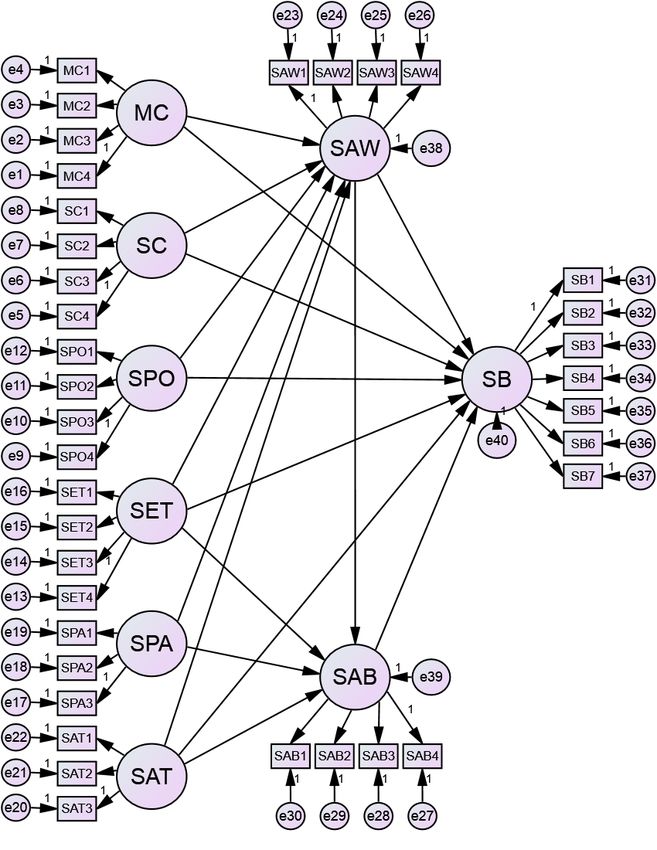
Based on existing research and the actual situation of subway operations, a conceptual model was
established as shown in Figure 1. It contains a series of hypotheses, which can be introduced as follows.
Hypothesis 1a: Management commitment (MC) has a direct positive impact on safety awareness (SAW).
Hypothesis 1b: Management commitment (MC) has a direct positive impact on safety behavior (SB).
Hypothesis 2a: Safety communication (SC) has a direct positive influence on safety awareness (SAW).
Hypothesis 2b: Safety communication (SC) has a direct and positive influence on safety behavior (SB).
Hypothesis 3a: Safety policy (SPO) has a direct and positive influence on safety awareness (SAW).
Hypothesis 3b: Safety policy (SPO) has a direct and positive influence on safety behavior (SB).
Hypothesis 4a: Safety education and training (SET) have a direct positive influence on safety awarenes s (SAW).
Hypothesis 4b: Safety education and training (SET) have a direct positive impact on safety behavior (SB).
Hypothesis 4c: Safety education and training (SET) have a direct positive influence on safety ability (SAB).
Hypothesis 5a: Safety participation (SPA) has a direct and positive influence on safety awareness (SAW).
Hypothesis 5b: Safety participation (SPA) has a direct and positive influence on safety ability (SAB).
Hypothesis 6a: Safety attitude (SAT) has a direct and positive influence on safety awareness (SAW).
Hypothesis 6b: Safety attitude (SAT) has a direct and positive influence on safety behavior (SB).
Hypothesis 6c: Safety attitude (SAT) has a direct positive influence on safety ability (SAB).
Hypothesis 7a: Safety awareness (SAW) has a direct positive influence on safety ability (SAB).
Hypothesis 7b: Safety awareness (SAW) has a direct positive influence on safety behavior (SB).
Hypothesis 8: Safety ability (SAB) has a direct and positive influence on safety behavior (SB).Sustainability 2020, 12, 8310 6 of 23
Sustainability 2020, 12, 8310 6 of 24
MC
SAW
SC
SPO
SB
SET
SPA
SAB
SAT
Figure1.1.The
Figure Theconceptual
conceptualmodel.
model.
In addition,
In addition, the item
item measures
measuresof ofmodel
modelconstructs
constructsare
aredisplayed
displayed in in
Table 1. The
Table substance
1. The and
substance
content
and of the
content majority
of the majorityof the 39 questions
of the 39 questions hashas
been adopted
been from
adopted the the
from existing questionnaires
existing of Al-
questionnaires of
Refaie [56],
Al-Refaie Guo
[56], Guoet et
al.al.
[36], Neal
[36], Nealetetal.al.[12],
[12],Vinodkumar
Vinodkumarand andBhasi
Bhasi[57],
[57],Vredenburgh Zohar [20],
Vredenburgh [58], Zohar [20],
andaavariety
and varietyof ofrelated
relatedreports.
reports.The
Theitemsitemsin inthis
thisdraft
draftquestionnaire
questionnairehadhadbeenbeendiscussed
discussedwith
withsafety
safety
expertsand
experts andsenior
seniormanagers
managersto toensure
ensuretheir theirvalidity.
validity.Then,
Then,aapilot
pilotstudy
studywas wasperformed
performedininorder
ordertoto
gain feedback and clarify these
gain feedback and clarify these items. items.
Table1.1.Safety
Table Safetyclimate,
climate,intermediate
intermediatevariable
variableand
andsafety
safetybehavior
behaviorscale.
scale.
Dimensions Serial Serial Number Item
Dimensions MC1
Item
Leaders attach importance to safety rules and regulations
Number
Leaders are willing to put money into providing safety equipment or
MC2
Management Commitment
MC1 Leaders attach importance to safety safety insurance
rules and regulations
(MC) MC3 Leaders often make safety speeches or hold safety meetings
Leaders are willing toleaders
The put money intomeasures
take active providing safetythe
to correct equipment or safety
problems caused by
Management MC2 MC4
unsafe conditions
SC1 insurance
Safety issues are often discussed among colleagues
Commitment SC2 You often discuss work safety issues with your direct supervisor
MC3 Leaders often make safety speeches or hold safety meetings
Safety Communication
(MC) You have reported or reported to your supervisor on site safety concerns
SC3
(SC) The leaders take active measures to correct and the
problems
problems caused by unsafe
MC4 SC4 You are often notified of safety-related information in a timely manner
The unit can make the conditions
quick response to the safety related question, the
SC5a
safety inspection will result in feedback to you
SC1 SPO1 Safety The
issues
unitare
hasoften discussed
formulated among
the quite perfectcolleagues
safety system standard
SC2 The revised safety operating rules of the unit will not be too old and
SPO2You often discuss work safety issues with your direct supervisor
Safety Policy
Safety cumbersome, not in line with the actual work
(SPO) You have reported or reported
SPO3 to earnestly
The unit has your supervisor
implemented on site safetyreward
the safety concerns
and and
Communicati SC3 punishment measures
You can see a fileproblems
or identification of the safe job specification at
on SPO4
your workplace
SC4 You are often notified of safety-related information in a timely manner
(SC)
The unit can make the quick response to the safety related question, the safety
SC5a
inspection will result in feedback to you
Safety Policy SPO1 The unit has formulated the quite perfect safety system standardSustainability 2020, 12, 8310 7 of 23
Table 1. Cont.
Dimensions Serial Number Item
SET1 The unit regularly organizes safety education and training
The safety education and training can improve the safety operation level
SET2
Safety Education of the staff
and training The safety education and training can improve the safety knowledge of
(SET) SET3 the staff (such as understanding the rules and regulations of the unit,
emergency skills, etc.)
Unit Safety Training Assessment and evaluation of scientific and
SET4
reasonable way, not a mere formality
Your opinion will be consulted when the company formulates the revised
SPA1
safety regulations
SPA2 You are often involved in company safety related activities or meetings
Safety Participation
Your suggestions for improving safety are encouraged and
(SPA) SPA3
implemented regularly
You act like a manager, alerting and stopping your colleagues to
SPA4a
unsafe behavior
SAT1 Job Safety is not just the responsibility of the leader or supervisor
The occurrence of safety accidents is accidental, random,
Safety Attitude SAT2
and uncontrollable
(SAT)
There are safety rules that you don’t have to follow if you do your
SAT3
job right
SAW1 During work, you are always careful
SAW2 You changed your “to be safe” mindset to “I want to be safe. “
Safety Awareness SAW3 Even with a lot of experience, you can be cautious at work
(SAW) You’ll learn in advance how to deal with any emergencies you may
SAW4
encounter at work
SAB1 You have sufficient experience in what you do
You have a relatively rich theoretical knowledge, able to deal with
SAB2
Safety Ability problems in the work
(SAB) You have a strong technical capability, adequate to meet the challenges of
SAB3
the work
SAB4 You prefer to study, to work in the new problems will be actively explored
SB1 During work, you strictly adhere to the safe operating procedures
SB2 At work, you strictly abide by safety rules and regulations
SB3 At work, you use safety protection equipment in a standard way
At work, you do not enter dangerous areas that are not within the scope
Safety Behavior SB4
of your work
(SB)
Before work, you will carefully check the equipment and the safety
SB5
environment around
SB6 You will not be tired at work
During working, you do not ignore safety warning signs and safety
SB7
operation signs
3. Methodology
3.1. Structural Equation Model
Structural equation model (SEM) is a powerful method to analyze and evaluate the causal relations
based on statistic data and reasonable hypotheses [59–62]. There are two key points in SEM, one is
using a series of regression equations to represent the causal processes, the other is modelling the
structural relations pictorially to conceptualize the theory [56]. Relation hypothesis is the indispensable
basis and guarantee for establishing a structural equation model. The hypothesized model could be
tested in systematical analysis to judge to what extent it is matched with the statistical data.
The general procedures of applying SEM are as follows. First, according to existing knowledge
and theories, a structural model of the relationships among identified variables is established based on
hypothesis. Secondly, an investigation is implemented to gain the data of observed variables. Third,
SEM is employed to verify the reliability and validity of the proposed model. Fourth, the final model
is achieved by modifying the proposed model based on path analysis. At last, the results are obtained
by calculating the final model.Sustainability 2020, 12, 8310 8 of 23
3.2. Data Collection
Questionnaire survey is one of the most popular approaches to collecting specific data, which is
particularly applicable for cases in which direct data could not be obtained. In this research, the data
collection was implemented in the manner of a two-stage process to keep its effectiveness.
Taking into account the good cooperation between the Xuzhou Metro Corporation and the China
University of Mining and Technology, the subjects of this questionnaire are mainly subway operators
of the Xuzhou Metro, that is, those who are or have been engaged in relevant subway operations and
other staff with operational safety management. In order to make the scope of the study wider and
draw more general conclusions, the questionnaire does not provide options for positions to ensure
data are collected for senior and middle managers and workers at the grass-roots level. This research
questionnaire is divided into three parts: the first part is the introduction, so that the survey subjects
understand the significance and content of the survey; the second part is to understand the basic
situation of the survey subjects, including the gender, age, length of service, and education; the third
part is the main part of the questionnaire, which includes the safety climate scale, the intermediary
variable scale, and the safety behavior scale.
This questionnaire uses the Likert 5-point scoring method, divided into the forward question and
the reverse question; among the positive questions, “strongly agree”, “agree”, “general”, “disagree”,
and “strongly disagree” correspond to 1, 2, 3, 4, and 5 points respectively. In contrast, in this
questionnaire, the second and third questions about safety attitude are reverse questions.
In this study, 450 samples were distributed and 422 samples were collected. The recovery rate of
the questionnaire was 93.8%. After removing the invalid questionnaires, such as incomplete answers
and identical answers, there were valid questionnaires 352, and the effective rate was 83.4%.
4. Results
4.1. Demographic Characteristics
In Table 2, the demographic characteristics of attendees are presented. As can be seen from Table 2,
the age distribution of the respondents is mainly 21–30 years old and 31–40 years old in terms of age,
while about half of them have worked for more than five years; the distribution of junior college,
bachelor’s degree and master’s degree is more average. From the demographic characteristics of the
sample, it can be seen that its variables are more in line with the actual situation, meet the sample
requirements for this survey, and avoid the accidental factors caused by a single sample, which gives
this study more universal and practical significance.
Table 2. Demographic characteristics of attendees.
Variables Type Frequency Percentage
Male 301 85.5%
Gender
Female 51 14.5%
21~30 168 47.7%
31~40 129 36.6%
Age
41~50 41 11.7%
51~ 14 4.0%
1~3 100 28.4%
3~5 60 17.0%
Working years
5~7 35 10.0%
7~ 157 44.6%
College and below 109 31.0 %
Education University 166 47.2%
Master and above 77 21.8%Sustainability 2020, 12, 8310 9 of 23
4.2. Reliability Test
There are four methods to measure reliability: test–retest coefficient, parallel-forms Coefficient,
spit-half reliability and Cronbach’s a. Cronbach’s alpha (α) coefficient is powerful for testing the
data reliability [63]. Cronbach’s alpha (α) coefficient is currently the most commonly used method of
reliability analysis, which can handle multiple scoring measurements and overcome the shortcomings
of the partial split-half method and can be used in conjunction with exploratory factor analysis.
Therefore, the Cronbach’s alpha (α) coefficient is used in this paper.
In general, when the coefficient is greater than 0.7, it means that the new scale is better, and there
is no need to adjust the measuring tools; when the coefficient is higher than 0.8, or even higher
than 0.9, it is in a very ideal state. We used statistical analysis software SPSS to further analyze the
data. The values of Cronbach’s α were calculated by SPSS 24.0, and the CITC (Corrected Item Total
Correlation) and reliability analyses of the safety climate, mediator variables, and safety behavior are
shown in Table 3.
Table 3. CITC and reliability analysis.
Latent Variable Items CITC Monomial α α Overall Cronbach’s α
MC1 0.778 0.855
MC2 0.789 0.850
Management Commitment (MC) 0.892
MC3 0.760 0.861
MC4 0.721 0.876
SC1 0.634 0.864
SC2 0.729 0.842
Safety Communication (SC) SC3 0.724 0.843 0.875
SC4 0.729 0.842
SC5 0.702 0.848
SPO1 0.706 0.786
SPO2 0.658 0.805
Safety Policy 0.841
SPO3 0.655 0.814 0.942
SPO4 0.696 0.789
SET1 0.680 0.824
SET2 0.772 0.788
Safety Education and Training 0.854
SET3 0.794 0.776
SET4 0.614 0.879
SPA1 0.749 0.819
SPA2 0.781 0.805
Safety Participation 0.867
SPA3 0.834 0.782
SPA4 0.526 0.899
SAT1 0.597 0.704
Safety Attitude SAT2 0.545 0.759 0.772
SAT3 0.683 0.609
SA1 0.663 0.787
SA2 0.667 0.787
Safety Awareness 0.831
SA3 0.698 0.770
SA4 0.621 0.804
0.867
SAB1 0.668 0.784
SAB2 0.705 0.766
Safety Ability 0.831
SAB3 0.705 0.765
SAB4 0.564 0.829
SB1 0.669 0.883
SB2 0.655 0.886
SB3 0.742 0.875
Safety Behavior SB4 0.732 0.876 0.895 0.895
SB5 0.719 0.877
SB6 0.703 0.880
SB7 0.664 0.884Sustainability 2020, 12, 8310 10 of 23
It can be seen from the above table that the CITC values of each initial scale are all greater than 0.5
and each value is greater than 0.7, which satisfies the related critical value condition and indicates that
each initial total scale and subscale has good consistency and stability.
4.3. Exploratory Factor Analysis
Exploratory factor analysis (EFA) is one of the most commonly used methods to test the validity
of structure. It is a technique to explore the basic structure of multivariable and deal with multivariate
dimensionality reduction, which is used to identify potential factors in potential structures. In this
study, in order to avoid using the original data repeatedly, 150 samples were randomly selected,
and EFA was implemented with SPSS 24.0 software. The Kaiser–Meyer–Olkin (KMO) and Bartlett’s
sphericity tests were used to determine the correlation between the potential conformations. It is
generally believed that exploratory factor analysis is appropriate when KMO is greater than 0.6 and
the significance probability of Bartlett sphere test is less than 0.001 Sig. In exploratory factor analysis,
if the item factor load of the latent variable is greater than 0.5, the scale has good convergence validity.
The item factor load of the latent variable was less than 0.5 in the other variables, which indicated that
the latent variable had good discriminant validity. Exploratory factor analysis was used to verify the
validity of the scale.
Firstly, the exploratory factors of safety climate were analyzed. SPSS 24.0 was used for exploratory
factor analysis of the safety climate scale. KMO and Bartlett’s tests of sphericity were performed on the
24 items of the safety climate. As shown in Table 4, KMO is suitable for factor analysis. The probability
of significance of the χ2 statistic is close to 0, less than 1%, indicating the data is relevant and meets
the criteria.
Table 4. Safety climate’s KMO and Bartlett test.
KMO 0.896
Approximate chi-square 2728.548
Bartlett‘s test of sphericity df 276
Significance probability 0.000
The factor extraction method was principal component analysis, and the rotation method was
the maximum variance method. All factors with characteristic value greater than 1 were extracted.
Six factors were obtained by orthogonal rotation. The characteristic roots were 11.029, 2.191, 1.549,
1374, 1.115, and 1.004, respectively, and the cumulative variance interpretation rate was 76.092%.
By analyzing the items of measurement of different factors, it is proved that it is reasonable to
divide the dimension of safety into management commitment, safety communication, safety policy,
safety education and training, safety participation, and safety attitude.
Table 5 is the rotating composition matrix of the six factors. First, the items with factor loading
less than 0.5 were checked and deleted under the principal component, so SC5 and SPA4 were deleted.
After eliminating the items with small factor loads and those that do not conform to the preset
dimensions, a total of 22 items remained.Sustainability 2020, 12, 8310 11 of 23
Table 5. Rotating composition matrix of safety climate.
Compositions
Items
1 2 3 4 5 6
SPO4 0.750 0.174 0.038 0.229 0.292 0.275
SPO1 0.749 0.255 0.126 0.156 0.090 0.201
SPO2 0.739 0.117 0.125 0.099 0.006 0.158
SPO3 0.707 0.230 0.283 0.056 0.211 0.116
SC5 0.661 0.251 0.155 0.304 0.392 0.091
MC2 0.188 0.819 0.242 0.189 0.145 0.113
MC3 0.148 0.816 0.118 0.242 0.250 0.066
MC1 0.275 0.806 0.011 0.148 0.135 0.161
MC4 0.268 0.710 0.281 0.108 0.117 0.184
SPA1 0.190 0.170 0.848 0.224 0.081 0.025
SPA2 0.133 0.153 0.835 0.213 0.223 0.029
SPA3 0.202 0.180 0.798 0.176 0.315 0.049
SET2 0.134 0.143 0.225 0.807 0.266 0.199
SET3 0.119 0.205 0.219 0.806 0.285 0.163
SET1 0.250 0.317 0.172 0.727 0.135 0.091
SET4 0.343 0.128 0.421 0.553 0.150 0.104
SC3 0.208 0.169 0.129 0.253 0.754 0.080
SC2 0.279 0.239 0.393 0.222 0.617 −0.019
SC1 0.331 0.309 0.193 0.272 0.601 0.143
SPA4 −0.024 0.072 0.424 0.195 0.600 0.322
SC4 0.505 0.346 0.208 0.142 0.529 0.139
SAT3 0.163 0.204 −0.053 0.080 0.202 0.833
SAT2 0.313 0.118 −0.032 0.098 0.191 0.787
SAT1 0.156 0.085 0.204 0.200 −0.082 0.762
Secondly, exploratory factor analysis of intermediate variables was carried out. KMO and
Bartlett‘s test of sphericity were performed on eight items of the intermediary variable (safety
awareness, safety ability). As shown in Table 6, KMO is suitable for factor analysis. The probability
of significance of the χ2 statistic is “0.000”, less than 1%, indicating the data is relevant and meets
the criteria.
Table 6. Intermediate variable’s KMO and Bartlett test.
KMO 0.875
Approximate chi-square 600.524
Bartlett‘s test of sphericity df 28
Significance probability 0.000
SPSS24.0 was used to carry out exploratory factor analysis on the medium variable scale.
The method of factor extraction was principal component analysis, and the method of rotation was the
maximum variance method. All factors with eigenvalues greater than 1 were extracted. The eigenvalues
of the two factors were 4.407 and 1.251, respectively, and the cumulative variance interpretation rate
was 70.729%. By analyzing the measurement items of different factors, it is proved that it is reasonable
to set safety awareness and safety ability as intermediary variables.
Table 7 is the composition matrix after the medium variable is rotated. From the data in the table,
it can be seen that eight items of measurement are well distributed under two principal component
factors without cross-loading. Moreover, the factor load of each item under single factor is greater
than 0.5, which indicates that the data of the item under other factors are all less than 0.5, the results
showed that the data of items in the scale had good validity.Sustainability 2020, 12, 8310 12 of 23
Table 7. Composition matrix after rotation of intermediate variable.
Compositions
Items
1 2
SAW4 0.878 0.101
SAW3 0.809 0.210
SAW2 0.773 0.344
SAW1 0.721 0.381
SAB4 0.115 0.884
SAB2 0.221 0.818
SAB1 0.300 0.787
SAB3 0.403 0.644
Finally, the exploratory factor analysis of safety behavior was carried out. KMO and Bartlett‘s
test of sphericity were performed on the seven items of safety behavior. As shown in Table 8, KMO is
suitable for factor analysis. The probability of significance of the χ2 statistic is “0.000”, less than 1%,
indicating the data is relevant and meets the criteria.
Table 8. Safe behavior’s KMO and Bartlett test.
KMO 0.900
Approximate chi-square 514.608
Bartlett‘s test of sphericity df 21
Significance probability 0.000
SPSS24.0 was used for exploratory factor analysis of the safety behavior scale. The factor extraction
method was principal component analysis, and the rotation method was the maximum variance method.
All factors with characteristic value greater than 1 were extracted. Only one factor can be obtained by
orthogonal rotation, the characteristic root is 4.266, and the cumulative variance interpretation rate is
60.939%. It is in accordance with the preset dimension, which proves the rationality of the scale setting.
Table 9 is the composition matrix after the rotation of the safe behavior. From the data in the table,
it can be seen that the factor loads of each item of the seven measurement items are all over 0.5 under
one principal component factor, which indicates that the item setting is more suitable, and all items
may be retained.
Table 9. Composition matrix of safety behavior.
Compositions
Items
1
SB2 0.836
SB3 0.820
SB1 0.815
SB5 0.769
SB4 0.752
SB7 0.738
SB6 0.728
4.4. Confirmatory Factor Analysis
The remaining 202 questionnaires without the deleted items were used to do confirmatory factor
analysis (CFA) using Amos software 24.0 in this study. According to the conceptual model and EFA
results, a structural equation model could be established to measure the effect of safety climate on
worker’s safety behavior in subway operation, as depicted in Figure 2. The observed variable isSustainability 2020, 12, 8310 13 of 23
represented as a rectangle, the latent construct is represented as an oval, and the residual is represented
as round.
Sustainability Moreover,
2020, the arrow between latent constructs represents the influence relationship.
12, 8310 14 of 24
Figure 2. The structural equation model.
Figure 2. The structural equation model.
Further, chi-square, root mean square error of approximation (RMSEA), goodness-of-fit (GFI),
Further,
Tucker Lewis chi-square,
index (TLI),rootandmean square errorroot
standardized of approximation (RMSEA),
mean residual (SRMR) aregoodness-of-fit
employed to judge (GFI),the
Tucker
goodness-of-fit of data. In addition, the average fitting index (IFI), comparative fitting index the
Lewis index (TLI), and standardized root mean residual (SRMR) are employed to judge (CFI),
goodness-of-fit
and frugality of data. In addition,
adjustment index (PGFI,the average
PCFI) can fitting index
be used (IFI), comparative
as auxiliary fitting index (CFI),
discrimination.
and frugality adjustment
Convergent index
validity (PGFI,
of the modelPCFI)
can can be used asthrough
be estimated auxiliary discrimination.
factor loading, composite reliability
Convergent validity of the model can be estimated
(CR), and average variance extracted (AVE). As a good rule of thumb, through factor loading, composite
standardized reliability
factor loadings
(CR), and average variance extracted (AVE). As a good rule of thumb, standardized
should be greater than or equal to 0.50 due to statistical significance. The minimum thresholds of CR factor loadings
should be greater
and AVE are 0.7than
and or equal
0.5, to 0.50 due to statistical significance. The minimum thresholds of CR
respectively.
and AVE are 0.7 and 0.5, respectively.
4.4.1. Confirmatory Factor Analysis of Safe Climate
4.4.1. Confirmatory Factor Analysis of Safe Climate
(1) Construct validity of safety climate
(1)Using
Construct validity of
the software safety climate
Amos24.0, the safety climate was analyzed by confirmatory factor analysis
(CFA) to analyze its construct validity.
Using the software Amos24.0, the safety According
climate to was
the relevant
analyzed criteria in Table 10, factor
by confirmatory the fitting degree
analysis
of the
(CFA) to safety
analyze climate model validity.
its construct is good, and all meet
According tothe
thecorresponding
relevant criteriastandards.
in Table 10, the fitting degree
of the safety climate model is good, and all meet the corresponding standards.
Table 10. Fit index of safety climate structure validity.
Fit Index 2 / df RMR RMSEA GFI TLI IFI CFI PGFI PCFI
Fitness threshold 0.9 >0.9 >0.5 >0.5
model 2.121 0.043 0.075 0.840 0.900 0.918 0.916 0.644 0.770
(2) Convergent validity of safety climateSustainability 2020, 12, 8310 14 of 23
Table 10. Fit index of safety climate structure validity.
Fit Index χ2 /df RMR RMSEA GFI TLI IFI CFI PGFI PCFI
Fitness threshold 0.9 >0.9 >0.5 >0.5
model 2.121 0.043 0.075 0.840 0.900 0.918 0.916 0.644 0.770
(2) Convergent validity of safety climate
As shown in Table 11, in the causal path, the absolute values of all path coefficients CR were
greater than the reference value criterion of 0.7, and P < 0.05, indicating that a significant test had
been passed.
Table 11. Fit Index of convergence validity of safety climate.
Path Estimate CR AVE
MC4 ← MC 0.786
MC3 ← MC 0.793
0.886 0.660
MC2 ← MC 0.823
MC1 ← MC 0.845
SC4 ← SC 0.756
SC3 ← SC 0.822
0.842 0.574
SC2 ← SC 0.814
SC1 ← SC 0.621
SPO4 ← SPO 0.732
SPO3 ← SPO 0.724
0.845 0.577
SPO2 ← SPO 0.802
SPO1 ← SPO 0.777
SET4 ← SET 0.681
SET3 ← SET 0.857
0.862 0.611
SET2 ← SET 0.830
SET1 ← SET 0.747
SPA3 ← SPA 0.910
SPA2 ← SPA 0.814 0.892 0.734
SPA1 ← SPA 0.843
SAT3 ← SAT 0.818
SAT2 ← SAT 0.635 0.753 0.507
SAT1 ← SAT 0.670
(3) Discriminant validity of safety climate
According to Table 12, there is a significant correlation among the dimensions (P < 0.01), and the
correlation coefficient is less than the square root of AVE, which means there is a certain correlation
among the latent variables, and there is a certain degree of differentiation between them. Therefore,
the discriminant validity of this scale is ideal. The diagonal in the table is the AVE value.
Table 12. Fit index of safety climate discrimination validity.
MC SC SPO SET SPA SAT
MC 0.660
SC 0.595 0.574
SPO 0.676 0.694 0.577
SET 0.557 0.535 0.754 0.611
SPA 0.487 0.713 0.616 0.614 0.734
SAT 0.419 0.395 0.513 0.420 0.263 0.507
Square root of AVE 0.812 0.758 0.760 0.782 0.857 0.712
4.4.2. Confirmatory Factor Analysis of Intermediate Variable
(1) Construct validity of Intermediate variableSustainability 2020, 12, 8310 15 of 23
As shown in Table 13, the χ2 /d f value of the mediating variable is 2.090, the values of rand
RMSEA are all less than 0.08, the indexes of GFI, TLI, IFI, and CFI are all more than 0.9, and the values
of PGFI and PCFI are also more than 0.5. The results show that the data fitting degree of the medium
variable is good and meets the critical value requirement of each index.
Table 13. Fit index of intermediate variable structure validity.
Fit Index χ2 /df RMR RMSEA GFI TLI IFI CFI PGFI PCFI
Fitness threshold 0.9 >0.9 >0.5 >0.5
model 2.090 0.018 0.074 0.953 0.951 0.967 0.967 0.503 0.656
(2) Convergent validity of intermediate variable
As shown in Table 14, the absolute value of the path coefficient CR is above 0.8, while the AVE
value is above 0.6, and all the indexes are above the critical value. The results show that the validity
of the questionnaire data of safety awareness and safety ability is ideal, and the fitting degree of the
model of safety awareness and safety ability is good.
Table 14. Fit index of convergence validity of intermediate variable.
Path Estimate CR AVE
SAW4 ← SAW 0.684
SAW3 ← SAW 0.804
0.814 0.524
SAW2 ← SAW 0.707
SAW1 ← SAW 0.695
SAB4 ← SAB 0.586
SAB3 ← SAB 0.781
0.822 0.539
SAB2 ← SAB 0.823
SAB1 ← SAB 0.725
(3) Discriminant validity of intermediate variable
According to Table 15, there is a significant correlation between safety awareness and safety ability
(P < 0.01), and the correlation coefficient between them is less than the square root of AVE; that is to
say, there is a certain correlation between two intermediate variables, and there is a certain degree of
distinction between them. Therefore, the discriminant validity of this scale is ideal.
Table 15. Fit index of intermediate variable discrimination validity.
SAW SAB
SAW 0.524
SAB 0.664 0.539
Square root of Ave 0.724 0.734
4.4.3. Confirmatory Factor Analysis of Safety Behavior
(1) Construct validity of safety behavior
As shown in Table 16, the χ2 /d f value of safety behavior is 1.565, the RMR value and RMSEA
value are less than 0.08, the GFI, TLI, IFI, and CFI are all more than 0.9, and PCFI is also more than 0.5.
Although PGFI is less than 0.5, its value of 0.485 is close to 0.5. The results show that the data fitting
degree of safety behavior is good and meets the critical value requirements of each index.Sustainability 2020, 12, 8310 16 of 23
Table 16. Fit index of safety behavior structure validity.
Fit Index χ2 /df RMR RMSEA GFI TLI IFI CFI PGFI PCFI
Fitness threshold 0.9 >0.9 >0.5 >0.5
model 1.565 0.009 0.053 0.971 0.983 0.989 0.989 0.485 0.659
(2) Convergent validity of safety behavior
As shown in Table 17, the absolute value of path coefficient CR between safety behaviors is
0.899, and the AVE
Sustainability 2020, value
12, 8310 is 0.561. This indicates that the convergence validity of
17 safety
of 24 behavior
questionnaire data is ideal, and the fitting degree of safety behavior model is good.
(2) Convergent validity of safety behavior
Table17,
As shown in Table 17.theFit index value
absolute of convergence validity
of path coefficient CRof safetysafety
between behavior.
behaviors is 0.899,
and the AVE value is 0.561. This indicates that the convergence validity of safety behavior
questionnaire data is ideal, andPath Estimate
the fitting degree of safety CR is good.
behavior model AVE
SB7 ← SB 0.735
Table 17. Fit index of convergence validity of safety behavior.
SB6 ← SB 0.724
SB5 ←Path Estimate 0.803
SB CR AVE
SB4 SB7← ← SB SB 0.735 0.780 0.899 0.561
SB3 SB6← ← SB SB 0.724 0.775
SB2 SB5← ← SB SB 0.803 0.690
SB1 SB4← ← SB SB 0.780 0.728 0.899 0.561
SB3 ← SB 0.775
SB2 ← SB 0.690
4.5. Model Modification SB1 ← SB 0.728
According the evaluation results, the SEM meets the corresponding requirements. Then, the
4.5. Model Modification
SEM can be optimized by path analysis, which can test the aforementioned hypotheses. The critical
According the evaluation results, the SEM meets the corresponding requirements. Then, the
ratio is used
SEM canto do path analysis
be optimized by pathin this study.
analysis, which Critical ratio
can test the is the ratiohypotheses.
aforementioned betweenThe thecritical
parameter value
and the ratio
standard error of the parameter, and it should be greater than 1.96 if P is
is used to do path analysis in this study. Critical ratio is the ratio between the parameter value less than 0.05.
Model modification can be executed by deleting the non-significant paths P
and the standard error of the parameter, and it should be greater than 1.96 if is less than 0.05.
one at a time. The path with
Model modification can be executed by deleting the non-significant paths one at a time. The path
lowest value of critical ratio should be regarded as the first candidate for deletion [57]. Following this
with lowest value of critical ratio should be regarded as the first candidate for deletion [57]. Following
trimming procedure,
this the finalthe
trimming procedure, model can be
final model canobtained,
be obtained,as asshown
shown ininFigure
Figure
3. 3.
Figure 3. The final model.
Figure 3. The final model.Sustainability 2020, 12, 8310 17 of 23
As shown in Table 18, this is the path analysis for the final model. The path coefficient of CR can
be found by observation. The absolute value is between 2.049 and 3.843, which is much larger than the
reference standard of 1.96. The standard error (SE) of each path coefficient was significantly reduced,
and all passed the significance test. The “***” in the table means the P value is too small to be shown.
Table 18. Path analysis.
Path Nonstandard Coefficient Standard Coefficient SE CR p
MC → SAW 0.203 0.300 0.041 4.918 ***
SC → SAW 0.180 0.239 0.050 3.612 ***
SET → SAW 0.108 0.143 0.045 2.404 0.016
SAT → SAW 0.353 0.417 0.047 7.444 ***
SET → SAB 0.154 0.233 0.050 3.083 0.002
SPA → SAB 0.162 0.320 0.033 4.930 ***
SAW → SAB 0.298 0.341 0.062 4.776 ***
SC → SB 0.114 0.186 0.038 2.977 0.003
SPO → SB 0.153 0.238 0.039 3.957 ***
SAT → SB 0.154 0.223 0.040 3.831 ***
SAB → SB 0.213 0.228 0.048 4.428 ***
SAW → SB 0.205 0.251 0.065 3.130 0.002
As shown in Table 19, the bootstrap mediator effect test is standardized. The intermediate
effect of the model was tested by the bootstrap program in the structural equation model. Using the
repeated random sampling method, 1000 bootstrap samples were sampled from the data (N = 352),
an approximate sampling distribution was generated, and the 90% confidence interval of the mediating
effect was estimated by the 5th percentile and 95th percentile. It is obvious that the confidence interval
of the data does not include 0, which indicates that the mediating effect is statistically significant.
Table 19. Standardized bootstrap intermediate effect test.
Bias-Corrected 90%CI Percentile 90%CI
Path Estimate SE
Lower Upper p Lower Upper p
MC → SAW 0.300 0.079 0.106 0.294 0.002 0.109 0.299 0.002
SC → SAW 0.239 0.080 0.077 0.275 0.004 0.079 0.276 0.004
SET → SAW 0.143 0.076 0.013 0.212 0.067 0.009 0.206 0.081
SAT → SAW 0.417 0.065 0.248 0.450 0.003 0.255 0.455 0.002
SET → SAB 0.233 0.090 0.065 0.264 0.003 0.052 0.254 0.005
SPA → SAB 0.320 0.067 0.100 0.226 0.002 0.099 0.226 0.002
SAW → SAB 0.341 0.074 0.172 0.415 0.003 0.179 0.422 0.002
SC → SB 0.186 0.087 0.034 0.220 0.030 0.034 0.221 0.030
SPO → SB 0.238 0.072 0.072 0.240 0.004 0.072 0.241 0.004
SAT → SB 0.223 0.074 0.067 0.251 0.007 0.071 0.253 0.005
SAB → SB 0.228 0.054 0.129 0.302 0.001 0.125 0.295 0.002
SAW → SB 0.251 0.117 0.042 0.358 0.048 0.038 0.355 0.051
4.6. Running Results of Final Model
The standardized path coefficient among latent constructs in final model can be obtained by
calculation, as shown in Figure 4.Sustainability 2020, 12, 8310 19 of 24
4.6. Running Results of Final Model
Sustainability 2020, 12, 8310 18 of 23
The standardized path coefficient among latent constructs in final model can be obtained by
calculation, as shown in Figure 4.
MC 0.300
SAW
0.239
SC
0.186 0.251
SPO 0.238
0.143 SB
SET 0.341
0.233
0.228
SPA 0.320
0.417 SAB
0.223
SAT
Figure
Figure 4. The
4. The standardized
standardized path
path coefficient
coefficient in final
in final model.
model.
5. Discussion
5. Discussion
5.1. Discussion of Findings
5.1. Discussion of Findings
The influence effects among latent constructs can be divided into three kinds, including direct
The influence effects among latent constructs can be divided into three kinds, including direct
influence effect, indirect influence effect, and total influence effect. The direct influence effect is the
influence effect, indirect influence effect, and total influence effect. The direct influence effect is the
direct effect of the causal variable on the resulting variable; it is measured by the path coefficient.
direct effect of the causal variable on the resulting variable; it is measured by the path coefficient. The
The indirect effect is the indirect effect of the causal variable on the resulting variable by influencing
indirect effect is the indirect effect of the causal variable on the resulting variable by influencing the
the mediator variables. The total influence effect is the sum of the direct influence effect and indirect
mediator variables. The total influence effect is the sum of the direct influence effect and indirect
influence effect, and it can comprehensively reflect the influence effect of each latent construct on
influence effect, and it can comprehensively reflect the influence effect of each latent construct on
safety behavior. The direct, indirect, and total influence effect among latent constructs are expatiated in
safety behavior. The direct, indirect, and total influence effect among latent constructs are expatiated
Table 20. The descending order of total influence effect of safety climate on safety behavior is SAT,
in Table 20. The descending order of total influence effect of safety climate on safety behavior is SAT,
SC, SPO, SET, MC, and SPA, and the values of total influence effect are 0.360, 0.265, 0.238, 0.100, 0.099,
SC, SPO, SET, MC, and SPA, and the values of total influence effect are 0.360, 0.265, 0.238, 0.100, 0.099,
and 0.073, respectively. In addition, the total influence effects of SAW and SAB are 0.329 and 0.228,
and 0.073, respectively. In addition, the total influence effects of SAW and SAB are 0.329 and 0.228,
respectively. The SET, MC, and SPA have the lowest impact on safety behavior. It can be explained
respectively. The SET, MC, and SPA have the lowest impact on safety behavior. It can be explained
that SPA, MC, and SET only bring indirect impact to safety behavior by promoting safety awareness
that SPA, MC, and SET only bring indirect impact to safety behavior by promoting safety awareness
and improving safety ability. However, the indirect influence is far less than direct influence according
and improving safety ability. However, the indirect influence is far less than direct influence
to the computation rule. This is why SET, MC, and SPA have a low impact on safety behavior.
according to the computation rule. This is why SET, MC, and SPA have a low impact on safety
behavior. Table 20. The influence effect among latent constructs.
Table 20.SAW SAB constructs.
The influence effect among latent SB
Latent Constructs
Direct Indirect Total Direct Indirect Total Direct Indirect Total
SAW SAB SB
MC
latent constructs 0.300 0.300 0.102 0.102 0.099 0.099
SC Direct
0.239 Indirect Total
0.239 Direct Indirect
0.081 Total
0.081 Direct
0.186 Indirect
0.079 Total
0.265
SPO 0.238 0.238
MCSET 0.300
0.143 0.300
0.143 0.233 0.102
0.049 0.102
0.282 0.099
0.100 0.099
0.100
SCSPA 0.239 0.239 0.320 0.081 0.320
0.081 0.186 0.073
0.079 0.073
0.265
SAT 0.417 0.417 0.142 0.142 0.223 0.137 0.360
SPOSAW 0.341 0.341 0.238
0.251 0.078 0.238
0.329
SAB 0.228 0.228
SET 0.143 0.143 0.233 0.049 0.282 0.100 0.100You can also read