A Case Study of Facial Emotion Classification Using Affdex - MDPI
←
→
Page content transcription
If your browser does not render page correctly, please read the page content below

sensors
Article
A Case Study of Facial Emotion Classification
Using Affdex
Martin Magdin * , L’ubomír Benko                and Štefan Koprda
 Department of Informatics, Constantine the Philosopher University in Nitra, Tr. A. Hlinku 1, 949 74 Nitra,
 Slovakia; lbenko@ukf.sk (L.B.); skoprda@ukf.sk (Š.K.)
 * Correspondence: mmagdin@ukf.sk

 Received: 26 February 2019; Accepted: 5 May 2019; Published: 9 May 2019

 Abstract: This paper focuses on the analysis of reactions captured by the face analysis system.
 The experiment was conducted on a sample of 50 university students. Each student was shown
 100 random images and the student´s reaction to every image was recorded. The recorded reactions
 were subsequently compared to the reaction of the image that was expected. The results of the
 experiment have shown several imperfections of the face analysis system. The system has difficulties
 classifying expressions and cannot detect and identify inner emotions that a person may experience
 when shown the image. Face analysis systems can only detect emotions that are expressed externally
 on a face by physiological changes in certain parts of the face.

 Keywords: face analysis system; emotions; valence; facial expression analysis

1. Introduction
      Nowadays, face analysis systems are widely used in various areas of life and the educational
process is one of them. Face analysis systems are commonly used by researchers to help eliminate the
problematic parts of the learning process, to understand the learner’s inner state of mind and to help
the learner overcome potential stressful conditions of their studies [1,2]. Face tracking, an extraction of
a specific area of interest and subsequent classification, must be run in real time so that researchers
may work with the actual data. This way, it is possible to obtain relevant results, and with feedback,
it is possible to interfere with the course of the educational process. The findings may be applied
and any errors, which might be indicated by negative feelings resulting in an emotional state of the
learner removed.
      The localization methods and techniques, subsequent face detection in space, the extraction of a
specific area of interest and the classification of emotional states have made significant progress in
recent years. At present, these techniques are successfully applied in various devices, such as digital
cameras, or software applications, e.g., facial recognition on the Facebook social network. However,
current classifiers have a drawback. The classifiers learn based upon instructed and thus artificial
displays of emotion in the majority of cases. There were many databases created in the past where such
expressions are included (such as Jaffe, Caltech Faces 1999 Database, BaoDataBase, YALE). As it was
shown in the last five years [3,4], this approach was incorrect. Instructed facial expressions, which were
meant to characterize a given emotional state, represent an exaggerated situation (an unrealistically
high level of a given emotion), and thus the resulting success rate of these classifiers has reached ca.
90%. Due to this reason, additional techniques for obtaining facial datasets were created. These would
reflect genuine emotional states [5]. Despite all that, it is still not clear, whether current systems can
capture real feelings and classify specific emotional states. According to Ekman, classification instead
of capturing only exaggerates expressions from escalated situations.

Sensors 2019, 19, 2140; doi:10.3390/s19092140                                     www.mdpi.com/journal/sensors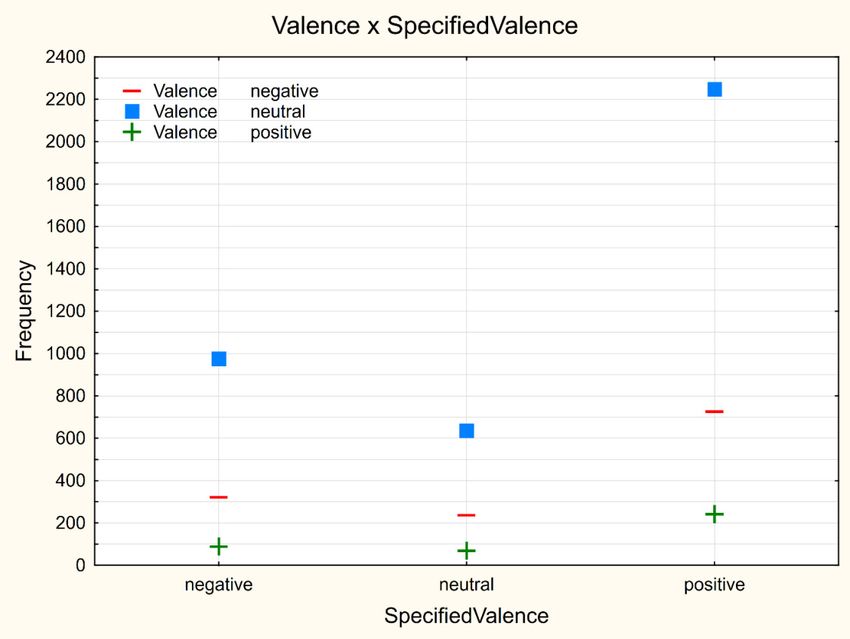
Sensors 2019, 19, 2140                                                                                2 of 17

     An experiment carried out using Affectiva’s Affdex SDK is presented in this paper. This SDK
is one of the most widely used face analysis systems. The aim of the experiment is to analyze face
analysis systems with a focus on evaluating the results of the system compared to the expected
student responses.
     The rest of the paper is structured as follows. Section 2 contains the survey of existing face analysis
systems in the context of their historical development. This point of view is crucial because both
the determination of the emotional state and the development of face analysis systems took place
simultaneously. Section 3 describes the methodology and the motivation for the experiment as well
as the input conditions and the hypothesis of the experiment. Section 4 deals with the results of the
experiment and its analysis. Furthermore, discussion and conclusions are offered in the last section.

2. Related Work
      The issue of recognition and determination of human emotions has been an important research
area ever since the time of Charles Darwin who was the first one to point out the link between
evoked emotional states and the characteristic expressions of the human face. Darwin’s theory has
been confirmed by several different studies over subsequent decades [6–11]. Darwin assumed that
emotional expressions are multimodal behavioral patterns of an individual, and thus formed his own
detailed descriptions of more than 40 emotional states [12]. Over the last century, several different
models for emotion classifications, ranging from universally experienced basic emotions to unique
and complex ones were psychologically defined. Two of the models researched in the field of emotion
recognition [13–16] have been predominantly used in the last decade: the basic classification of six
emotional states by Ekman [17] and Russel’s circumplex model of emotions [18].
      Contrary to Ekman’s classification, Russel’s model is not as strictly separated and indicates that
the emotional states of an individual are dynamic multimodal patterns of behavior. For example,
the expression of fear on the face consists of the widening of the pupils while contracting the muscles
around the mouth. On the other hand, the expression of joy on the face consists of the reduction in
pupil movement and concurrent substantial change in the shape of muscles around the mouth. Russel’s
circumplex model assumes that under certain conditions, there may be an overlap of some features that
could uniquely classify a given type of emotion (for example, happiness and surprise; fear and sadness,
etc.). However, many authors have recently indicated that in order to classify various emotional states,
it is necessary to recognize the fact that emotions allow such expressions primarily through changes
in physiological processes [19,20]. Various approaches [21,22] that were able to detect responses to
relevant conditions of individuals, such as behavior, physiological and empirical components [23]
were proposed due to these changes.
      Current face analysis systems, which are able to determine the emotional state of an individual
from the facial expressions analysis, operate in three basic phases, as defined by Kanade [24]:

1.    Face detection phase,
2.    Feature extraction,
3.    Classification of emotions according to the selected model.

      Interest in this area dates to the 1960s when Bledsoe, Helen Chan, and Charles Bisson created the
first face recognition algorithm [25–28]. Their approach and technique were later used by Goldstein,
Harmon, and Lesk for the facial feature extraction phase [29].
      The first fully-functional system was implemented by Kanade in 1973 [24]. The algorithm was able
to automatically evaluate 16 different facial parameters by comparing extractions obtained using the
computer with extractions delivered by a man. However, the system performed a correct identification
with a success rate in the range of only 45%–75%.
      Over the years, several detection methods emerged that also could have been applied in the
next stages of the recognition process. In 2002, Yang introduced a classification [30], mostly used by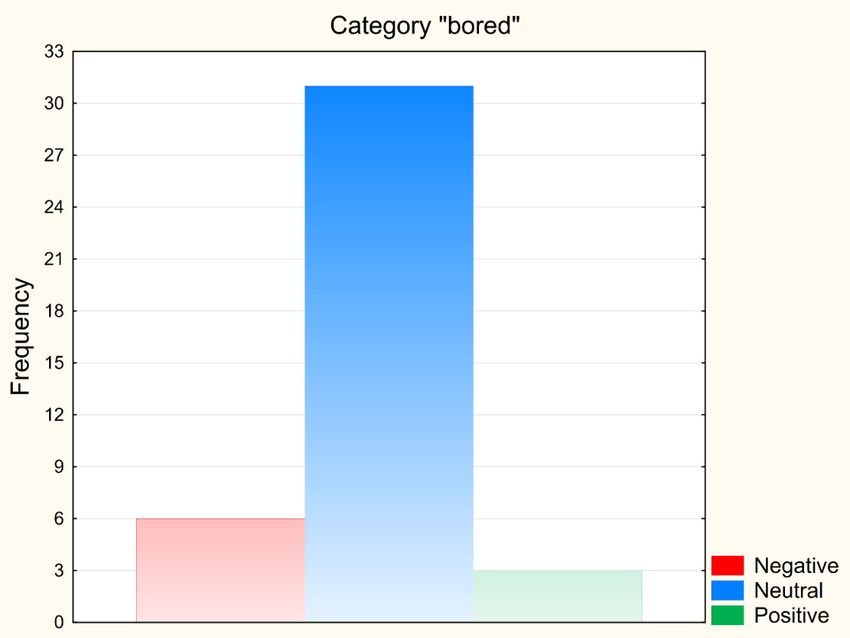
Sensors 2019, 19, 2140                                                                              3 of 17

many other authors, consisting of knowledge-based methods, feature invariant approaches, template
matching methods, and appearance-based methods.
      A number of different algorithms for knowledge methods were proposed by Yang and Huang [31];
Kotropoulos and Pitas [32]; Zhang and Lenders [33]. The research of feature invariant approaches was
carried out by Vezhnevets et al. [34]. Lakshmi and Kulkarni [35] used skin color to improve detection
accuracy in combination with the grayscale edge of the input image. Ghimire and Lee [36] and
Chavhan et al. [37] proposed a new algorithm that used improved image input (by use of histogram
or snap technique) in the pre-processing of the image and a combination of skin color and edge
information to improve face detection rate, as well as verifying individual candidates - feature points
on the face (nose, eyes, mouth).
      Among the oldest methods based on template matching is the algorithm proposed by
Sakai et al. [38]. This algorithm used several sub-templates for the eyes, nose, mouth, and face
to create an exact face model. Later, different templates using predefined patterns were designed
by researchers [39–42]. Wang and Tan [43] suggested a procedure using an ellipse as a template for
describing the face and its parts that proved to be ineffective over time due to different dimensions of a
face, gaze fixations or a potential face rotation during the detection.
      Appearance-based methods are derived from template matching methods but to identify and
recognize individual interest areas, a statistical analysis or machine learning (support vector machine),
which is indicative of the extraction and classification phases is used. Given a large amount of data
that is necessary to be processed for these methods, a common approach is to reduce the dimensions
of the detected area (dimensionality reduction), thereby achieving higher computational efficiency
and higher success rate of the detection itself. Among these methods, the most prominent techniques
are AdaBoost (Viola-Jones detector) algorithm, S-AdaBoost algorithm [44], FloatBoost algorithm [45],
hidden mark model, Bayes classification, support vector machines (SVM), and neural networks.
      The correct division of basic extraction methods is not uniform to this day. Most of them are used
in areas other than face recognition. All these techniques may be used either in the extraction phase or
in the classification phase. At the beginning of the 1990s, the first division of these methods appeared
using these algorithms and techniques [46,47]. This division contained five basic techniques:

1.    principal component analysis,
2.    neural network-based methods,
3.    active shape modeling,
4.    active appearance model,
5.    Gabor wavelet.

      A considerate amount of research was conducted on the application of Gabor wavelets, or Gabor
filters [48,49]. Coefficients are the output of using the Gabor filters, and they are used to describe
the emotion by changes of the individual facial features, for example, the change in the position of
the eyebrows, mouth, cheekbones, etc. Application of these coefficients results in the creation of
multi-point masks [50] consisting of action points. This action points form together a system called the
geometric model. However, these geometric models are expressions of an ideal case of a human face.
      In the case of the active shape model (ASM), the feature points are constantly compared with the
real physical state of an individual and thus describe the actual areas as closely as possible. ASM was
first used in 1988 [51] and later, this model, based on the so-called "snakes" (generically active facial
features), was improved by Yuille [52], Wang [53], and Yoo [54].
      The classification of emotions is the final phase of the automatic analysis of the emotions from
extracted features. However, the algorithms used in the classification are commonly applied in the
previous two phases as well.
      A typical example is the hidden Markov model (HMM), which represents the statistical model,
the formal basis for the creation of probabilistic models. HMM is most commonly represented as a
simple dynamic Bayesian network and can be used in all three phases of the recognition process [55].
Sensors 2019, 19, 2140 4 of 17
Rajakumari [56] applied HMM in a classification of the emotional states by measuring the distance
between the eyebrow and the iris. They classified the emotional state of anger, fear, happiness,
and disgust by measuring the distance.
Similarly to HMM, neural networks may be used in all three phases of the recognition process.
An example of the use of neural networks in the detection phase may be the method proposed
by Rowley et al. [57]. Training a neural network makes it possible to achieve a very successful
classification [58].
Wang et al. [59] proposed a Bayesian scene-prior-based deep learning model focused on extracting
features from the background scenes. The authors used Bayesian ideas to train the scene model based
on a labeled face dataset. The novel approach transforms a face image into new face images by referring
to the given face with the learnt scene dictionary.
The support vector machine (SVM) method has been used since 1995 in various areas of
detection and classification [60,61]. SVM represents a linear classification algorithm which geometrical
interpretation can be understood as a search for an ideal hyperplane that separates the attributes of
two different categories [62,63].
Despite the many methods and techniques that have been developed over the last 40 years,
the current SDK for fully automated face analysis systems are still not immune to the following
influences [64]:
• the facial position and the incorrect angle of the scanning device where certain parts of the face
may be out of focus (for example, part of the mouth or nose, eye, etc.),
• incorrect face and sensor distance causing loss of facial features information,
• illumination of the scene,
• smaller obstacles that temporarily cover a certain part of the face (for example, long hair), which can
cause a partial loss of the information or act as a disturbing element,
• accessories and additional features such as glasses, mustache, etc. Since these elements are
often permanent features characterizing a face, it is necessary to include these elements in the
eventual detection,
• ethnicity, age, sex, appearance, and other attributes, by which the faces of various people differ.
The statements of Rizvi et al. [64] are also confirmed by Wu et al. [65] who state that race (ethnicity)
should be included among the basic and key attributes of facial analysis. The issue with automatic face
analysis is that traditional machine learning methods deal with race classification only in combination
with two separate steps: extracting artificially designed features and training the right classifier with
these features. According to Wu et al. [65], there are other ways to eliminate these issues.
Face recognition in images is one of the most challenging research issues in tracking systems
(or also as part of an access system) because of different problems [66]. Among these problems are
various non-standard poses or expressions using extracted the facial parts. A simple lighting change
can be often enough to lead to an incorrect classification. Thus, the robustness of the recognition
method relies heavily on the strength of the extracted functions and the ability to handle both face and
low-quality images.
In terms of computational power is the reduction in data and function in the face recognition
process essential and the researchers have recently been focused on the use of modern neural networks
for automated analysis [67].
Nowadays, the above-mentioned impacts are dealt with by novel approaches to increase the
overall classification success. Therefore, facial expression recognition (FER) is important for the
transition from the instructed (stimuli) or laboratory-controlled expression to real face expression.
The deep learning techniques (deep neural networks) removed various problems as illumination,
head pose and identity bias. The ability to learn robust features from the raw face image makes deep
convolutional neural networks (DCNNs) attractive for face recognition.Sensors 2019, 19, 2140 5 of 17
The usage of deep learning is currently really wide. Despite the fact that it is possible to gather a
great amount of data and information from sensors, the data are often not possible to process or use.
Rapidly developing areas of deep learning and predictive analysis have started to play a key role in
healthcare development and research to understand patients’ feelings and needs if they are bedridden
and are unable to communicate with the doctor in a standard way [68,69].
In this way, deep learning can be successfully used, for example, for the quantitative analysis of
polio. Polio, also known as Bell’s palsy, is the most common type of facial polio. The facial polio causes
loss of muscle control in the affected areas, which represents not only face deformity but especially
facial expression dysfunction and thus the inability of most current algorithms to capture the patient’s
true emotions. According to the findings of Hsu et al. [70], current approaches to the automatic
detection of polio in childhood take into account in the most cases manual functions, resulting in
incorrect classification of patients’ emotional status.
Wang et al. [71] apply a completely novel approach that is based not only on face detection but
also on sensors. The authors created an emotion-based algorithm based on eye movement information
by collecting and analyzing eye-tracking and eye movement sensing. Specifically, the authors extracted
time-frequency motion functions of the eyes by first applying a short-term Fourier transformation to
raw multi-channel eye-tracking signals. Consequently, in order to integrate time-domain movements in
time (i.e., saccade duration, fixation duration and pupil diameter), two fusion function strategies were
investigated: function-level fusion (FLF) and decision-level fusion (DLF). Recognition experiments
were also performed according to three emotional states: positive, neutral, and negative. The average
accuracy, however, is 88.64% (FLF method) and 88.35% (DLF method).
Therefore, current methods in this area focus on deep learning and so-called emotional computing.
A study focused on emotional computing [72] is one of them. Results of the research are currently used
in home appliances or the automotive industry [73]. Chaitchotchuang et al. [74] used Markov chains
to classify only two emotional states (negative/positive). This way, the authors created an emotional
probability that simulates a dynamic process of spontaneous transfer of an emotional state. This method
offers a novel approach to study the emotional state classification such as emotional calculation and
the emotion automation generation theory. According to Kyung-Ah et al. [75], the introduction of the
mathematical model is the key feature of human-computer interaction to the current SDK focused
on face analysis and classification of emotional states. The aim of the mathematical model is to help
the psychologists better understand, determine correctly, and express the essence of natural emotion,
especially in the decision-making process.
Out of the many available mathematical models, apart from the Markov chains, the deep learning
model (DLM) is currently the most interesting. It is mainly due to the model’s ability to overcome
the disadvantages of traditional algorithms [72]. Deep learning offers the most powerful option of
machine learning in the case of hierarchical models which are used in many aspects of our lives (speech
recognition, pattern recognition or computer vision). In principle, deep learning models are designed
as convolutional neural networks (CNNs) that are mainly used in the second and the third phases of
the recognition process, for the extraction and subsequent classification. The new CNN architecture for
facial expression recognition was proposed by Kuo et al. [76]. Their solution in the frame-to-sequence
approach successfully exploits temporal information and it improves the accuracies on the public
benchmarking databases.
In the case of the extraction (for example, restricted Boltzmann machines), DLM offers a reduction
of computational complexity and overall acceleration from the point of computational view while
maintaining sufficiently good input results for the classification [77]. Thus, restricted Boltzmann
machines and CNN are becoming powerful pre-coding techniques in deep learning for the use of
classification [78–80]. In the case of using the deep learning methods, such as the deep belief network,
it is possible to discover a very small error in the classification of emotional states (1.14%–1.96%) [72].
The issue with DLM that are a part of the current SDK is, despite the small error rate in classification,Sensors 2019, 19, 2140 6 of 17
the inability to capture and correctly classify the change of emotional state, for example, in the
decision-making process of a person if the reaction time is very short [3].
However, Bazrafkan et al. [81] showed that the issue of deep neural networks (DNN) in the
classification phase is the accuracy that is significantly lower when the network is trained with one
database and tested with another database.
Bahreini et al. [82] are developing a novel software for a correct recognition and classification
of emotional states. The software offers to recognize the emotion from the image files or uploaded
video files. It can use real-time data from a webcamera and classify the so-called subtle emotional
facial expressions. It uses the FURIA algorithm for unordered induction of fuzzy rules. This algorithm
makes it possible to timely detect and return appropriate feedback based on the facial expressions.
The success rate of the algorithm is 83.2%.
Shan Li and Weihong Deng [83] deal with the major issue of the FER in classical categorical model
(e.g., Ekman) that widely uses the definition of the prototypical expressions. This definition includes
only very small portion of specific categories and cannot mark the real problems of expressive human
behaviors in real time interactions.
According to Samadiani et al. [84], although laboratory FERs achieve very high accuracy
(approximately 97%), the issue is the technical transfer from the lab to real application where
the authors face a large barrier with very low accuracy (around 50%).
Based on the results of Rizvi et al. [64], the aim of the introduced research was to verify the
reliability of the most commonly used SDK—Affectiva’s Affdex SDK. Other frequently used face
analysis systems operate on the similar principle (e.g., FACET, Eyeris EmoVu, InSight SDK). Based on
this, for the aim of the experiment was chosen the Affdex module. Also, the Affdex module offers its
application for testing in the academic environment.
3. Materials and Methods
The aim of the experiment was to analyze the face analysis system with a focus on evaluating the
results of the system in comparison to the expected student responses.
In most cases, two basic ways of performing face analysis for the learning process are used:
1. using a camera to capture all the students’ faces at the same time,
2. using multiple cameras, each capturing only one student’s face at the time.
The first approach is highly dependent on a computational performance. The second approach
is also dependent on the amount of hardware used, as each student whose face would be analyzed
would have to have their own separate camera.
The experiment was designed with the intention of identifying and removing errors in the learning
process while understanding students’ inner state of mind during the learning process or helping them
overcome stressful learning conditions. The performed experiment should confirm or invalidate the
eligibility of the face analysis system in the learning process. Based on this, the following hypotheses
were established:
1. It is assumed that emotional facial expressions (facial emotions) can be correctly identified and
classified using the Ekman’s classification and the selected face analysis system.
2. It is assumed that the subconscious reaction to the positive or negative emotional states correlates
with the facial expressions (facial emotions) that are recognizable by the face analysis system.
In the experiment, 50 participants were examined, representing a standard sample of first-year
university students at the age 18–19 years who agreed to participate in the experiment during the term.
The students have given consent to scan their faces before performing the experiment. The consent was
in accordance with the current GDPR standards. The very faces of the students were not important for
the experiment, so they were not stored.Sensors 2019, 19, 2140 7 of 17
There were a 100 random images shown to every student. Then, their reactions to the image
were recorded. Images changed automatically with a timeout of five seconds. From the psychological
point of view, images were meant to induce positive or negative emotional states [85]. The NAPS
standardized image database [86] was used for this experiment where the images were rated (positive,
negative or neutral rate for each image). Emotional facial expressions identified by the selected face
analysis software Affdex should correlate with the subconscious response of the participant to the
image displayed.
The selected software Affdex by Affectiva (in collaboration with iMotions) is currently one of the
most used SDKs for classifying emotional states. Affdex uses the facial action coding system (FACS),
a complex and widely used objective taxonomy for coding facial behavior. The Affdex system for
automated facial coding has four main components [87]:
1. face and facial landmark detection,
2. face texture feature extraction,
3. facial action classification,
4. emotion expression modeling.
A histogram of oriented gradient (HOG) is used to process the input (captured) camera feed.
This step also extracts the needed areas of interest. A SVM trained on 10,000 images of faces from all
over the world is applied to the input, which determines a score of 0–100. The classification of the
emotional state itself is realized according to Ekman’s classification. However, Affdex includes an
additional state—contempt. The classification uses the EMFACS standard coding system [88], based on
the original Ekman coding system FACS [89], with emotional expressions getting a score of 0–100,
where 0 is a missing expression, 100 is a fully-present expression.
The valence parameter (pleasantness of the emotion) has been used to determine whether a
subconscious reaction in relation to a positive or negative emotional state correlates with the emotional
expressions in the face that are recognizable by the Affdex face analysis system. Valence is used in
emotions to determine the positive or negative emotional state. It is not an emotion but a component
of emotion that represents the subjective pleasantness of a psychological state.
The use of valence makes it possible to characterize and categorize specific emotional states,
such as anger and disgust (negative valence) or joy, surprise (positive valence) [5]. Images from the
NAPS standardized database were assigned appropriate valence by an expert (−1 for the negative
state, 0 for the neutral state, 1 for the positive state), resulting in the specified valence. The Affdex
system also includes the ability to measure valence.
4. Results
The experiment was carried out on a sample of 50 first-year university students. Every student was
gradually shown 100 images from a database consisting of a total of 899 images from a standardized
NAPS database. Related images were categorized for better evaluation. There were 93 categories of
images (such as a lake, sport, building, injury, fire, boredom, depression, etc.). Each image was assigned
its specified emotion valence– positive (1), neutral (0) or negative (−1). Images were displayed at random
order and the students’ responses (emotions) were recorded using Affdex software. Then, values for
seven emotions were recorded in the log file: joy, fear, disgust, sadness, anger, surprise, and contempt.
At the same time, a student’s valence value for the given image was recorded, which represented a
positive, neutral or negative emotional state response to the shown image. The emotion values ranged
from 0–100, representing a percentage (the sum of all recorded emotions and neutral emotion was
100%). Valence ranged from −100 to 100, where the positive value represented a positive emotional state
response, the negative value represented a negative emotional state response, and zero represented
a neutral emotional response. After obtaining the data, the preparation of data consisted mainly of
the transformation of variables (categorization of valence variable and transformation of variables
representing individual emotions) and removing the measurements recorded before displaying theSensors 2019, 19, 2140 8 of 17
first image. The log file contained 5547 records after data pre-processing. Each record represented a
recorded student’s response for a specific image.
At first, the recorded response of the emotional state for each image with the specified (expected)
image response was compared. Evaluation of the obtained data was performed by statistical processing
using the Chi-square test and the contingency coefficients. The only assumption of validity of the
Chi-square test is that the expected counts are greater than or equal to five. This condition was met in
all cases. The degree of statistical dependence between qualitative features was judged based on the
contingency coefficient C, and Cramér’s V. Values close to zero indicate a weak dependence and values
approaching one represent a strong dependence [90]. In the case of specified valence and observed
valence, a trivial degree of dependence was identified, and statistically significant differences were not
found between individual emotions (Table 1).
Table 1. Crosstabulations: Valence x Specified Valence.
Valence\Specified Valence Negative Neutral Positive
322 238 727
Negative
23.23% 25.21% 22.60%
975 636 2248
Neutral
70.35% 67.37% 69.88%
89 70 242
Positive
6.42% 7.42% 7.52%
P 1386 944 3217
100% 100% 100%
Pearson Chi-square = 4.647288; df = 4; p = 0.32544
Con. Coef. C 0.0289327
Cramér’s V 0.0204671
Based upon these findings, it can be said that using Affdex software, it wasn’t possible to recognize
correct emotional states from facial expressions. By comparing the observed valence value with a
specified valence, a match of only 21.64% cases was observed. In most cases, a positive reaction was
expected (almost 58% of displayed images were with predicted positive reaction). On the contrary,
the least number of displayed images had a predicted neutral response (about 17%). As shown in the
plot (Figure 1), for each predicted emotion a different reaction was recorded by Affdex. In the case of
predicted positive and negative reactions of displayed images, a neutral response prevailed. Only in
the case of predicted neutral reactions, the recorded reaction matched the prediction. The observed
students showed mainly a neutral reaction (in almost 70% of cases), in contrast, the least observed was
a positive reaction (only 7% of cases). The negative reaction showed a relatively close ratio of expected
and observed reactions (25% of expected vs. 23% observed). However, in this case, there were negative
reactions observed mostly in cases where a positive response was expected. This might have been
caused either by the wrong classification of displayed images (images that were expected positive
reaction caused a neutral or negative reaction) or by the inaccurate evaluation of emotion expressed by
a student.
Since individual images were categorized in advance and in most cases, the categories represented
either positive, neutral or negative reactions, it was decided to analyze the connection between
categories and recorded reactions of the students. For all three categories and observed responses
(valence) a small degree of dependence was identified, but only for neutral response categories,
a statistically significant difference was demonstrated at 95% significance (p < 0.05) (Tables 2–4).contrast, the least observed was a positive reaction (only 7% of cases). The negative reaction showed
a relatively close ratio of expected and observed reactions (25% of expected vs. 23% observed).
However, in this case, there were negative reactions observed mostly in cases where a positive
response was expected. This might have been caused either by the wrong classification of displayed
images (images
Sensors 2019, 19, 2140that were expected positive reaction caused a neutral or negative reaction) or by the
9 of 17
inaccurate evaluation of emotion expressed by a student.
Figure
Figure 1.
1. Interaction
Interaction plot:
plot: Valence
Valence vs.
vs. SpecifiedValence.
SpecifiedValence.
Table 2. Degree of dependence for negative specified valence.
Negative Specified Valence
Pearson Chi-square = 84.17117; df = 66; p = 0.06515
Con. Coef. C 0.2392752
Cramér’s V 0.1742549
Table 3. Degree of dependence for neutral specified valence.
Neutral Specified Valence
Pearson Chi-square = 68.07593; df = 50; p = 0.04537
Con. Coef. C 0.2593524
Cramér’s V 0.1898872
Table 4. Degree of dependence for positive specified valence.
Positive Specified Valence
Pearson Chi-square = 105.8141; df = 102; p = 0.37815
Con. Coef. C 0.1784509
Cramér’s V 0.1282423
The highest degree of match in the neutral reaction categories was achieved for the “bored”
category (Figure 2).Positive specified valence
Pearson Chi-square = 105.8141; df = 102; p = 0.37815
Con. Coef. C 0.1784509
Cramér’s V 0.1282423
SensorsThe
2019,highest
degree of match in the neutral reaction categories was achieved for the "bored"
19, 2140 10 of 17
category (Figure 2).
Figure
Sensors 2019, 19, x FOR 2. The
PEER frequency of recorded reactions for the neutral category “bored”.
REVIEW “bored“. 10 of 16
Inthe
In thecase
caseofofthe
the category
category evaluation,
evaluation, only
only the the categories
categories withwith at least
at least 10 displayed
10 displayed imagesimages
were
were taken
taken into account.
into account. The The
"bored"“bored” category
category reached
reached a 77.5%
a 77.5% success
success rate,
rate, sosothetheexpected
expected neutral
neutral
response was
response was seen
seen in
in 31
31 out
out ofof 40
40 shown
shown images.
images. AsAs an
an example
example ofof used
used images
images we we chose
chose an
an image
image
from this category,
from this category, for which the recorded
the recorded reactions were neutral in all six of its showings, as was the
six of its showings, as was the
expected reaction
expected reaction (Figure
(Figure 3).
3).
Figure
Figure3.3.Illustration
Illustrationof
ofthe
theimage
imagerepresenting
representingthe
the”bored“
“bored”category.
category.
The next
The next step
step was
was aa comparison
comparison of of recorded
recorded and
and expected
expected individual
individual emotions. Based on
emotions. Based on aa
simple separation
simple separation to
to positive
positive and
and negative
negative emotions,
emotions, aa new
new variable
variable was
was created.
created. This
This variable
variable was
was
transformed to either positive, neutral or negative reaction, depending on the recorded
transformed to either positive, neutral or negative reaction, depending on the recorded emotions. emotions.
When the
When the share
share of
of positive
positive emotions
emotions (joy
(joy and
and surprise)
surprise) prevailed,
prevailed, the
the response
response for
for the
the image
image was
was
classified as
classified aspositive.
positive.When
When thethe
share of negative
share emotions
of negative (fear, disgust,
emotions sadness,sadness,
(fear, disgust, anger, and contempt)
anger, and
contempt) prevailed, the response for the image was classified as negative. If neither positive nor
negative emotions prevailed, the response for the image was classified as neutral. Although Affdex
does not log neutral responses, the sum of all the emotions equals to 100% and it was trivial to
calculate the neutral response for every record. In the case of specified valence and the reaction
based on observed expressions (Emotion Valence) a trivial rate of dependence was shown and noSensors 2019, 19, 2140 11 of 17
prevailed, the response for the image was classified as negative. If neither positive nor negative
emotions prevailed, the response for the image was classified as neutral. Although Affdex does not
log neutral responses, the sum of all the emotions equals to 100% and it was trivial to calculate the
neutral response for every record. In the case of specified valence and the reaction based on observed
expressions (Emotion Valence) a trivial rate of dependence was shown and no statistically significant
differences were demonstrated (Table 5).
Table 5. Crosstabulations: Emotion Valence x Specified Valence.
Emotion Valence\Specified Valence Negative Neutral Positive
39 37 105
Negative
2.81% 3.92% 3.26%
1316 886 3032
Neutral
94.95% 93.86% 94.25%
31 21 80
Positive
2.24% 2.22% 2.49%
P 1386 944 3217
100% 100% 100%
Pearson Chi-square = 2.554037; df = 4; p = 0.63499
Con. Coef. C 0.0214528
Cramér’s V 0.0151729
Based on the results (Table 5), it was not possible to properly recognize the emotional expressions
of the face or the other seven recorded emotions using Affdex software. Comparison of these emotions
with specified valence showed a match in only 18.12% of cases. Compared to the recorded observed
valence, the expected classification of the examined images by the students even decreased. As
it can be seen from the results obtained (Table 5), up to 94% of all the evaluated reactions were
neutral. No significant shares for positive and negative emotions (positive emotions = 3%, negative
emotions = 2%) were recorded. Based on these results, it could be argued that students did not show
enough emotions during the experiment, and therefore Affdex software evaluated their response as a
neutral emotion.
5. Discussion
In the experiment, it was assumed that the positive (or negative) images evoke positive (or negative)
face reactions, as psychologists understand emotions as conscious feelings relating to relevant events,
external or internal environment and are associated with specific physiological activation [23,91,92].
Emotions are not only inseparable from decision making, but even the decision making is also an
emotional process, because it can trigger a multitude of (mostly negative) emotions [93].
It can be said, that overall, Affdex can achieve acceptable accuracy for standardized images of
instructed vs. natural facial expressions, but performs worse for more natural facial expressions.
Currently applied methods and techniques for automated analysis of facial expressions generate
probability-like measures for different basic emotions and therefore, the classifiers are trained with
databases of prototypical facial expressions. For this reason, these tools reach high success rates of the
overall classification when used on prototypical facial expressions [94,95].
This problem that in the case of classifying emotional states, is directly related to the current face
analysis systems, has recently been reported by several researchers [3,4]. According to Stöckli [3],
methods of solutions of individual phases of recognition process and classification by Affdex itself is
standardized but can hinder the generalizations of obtained results. Affdex, as well as other current
SDKs, classifies prototypical facial expressions that are unusual in real situations. Therefore, accuracy
measures can be inflated. Even though the methods and techniques currently applied in individual
SDKs, over the last 20 years, have been improved in terms of algorithmic complexity and the success
rate of classification grew as well, the issues plaguing these systems since the 1970s have persisted.Sensors 2019, 19, 2140 12 of 17
According to the study conducted by Stöckli [3], problems such as varying camera angles and changing
head poses are being solved. Improvements in the analysis of non-posed faces and the sensitivity of
measuring subtle changes in facial expressions and the discrimination of more difficult expressions
and expression intensity are expected [87,96].
Current SDKs, supporting fully automated facial analysis often neglect to consider cultural and
contextual aspects that can be required to correctly classify the expressed emotional states [97,98].
In real life, emotional facial expressions are not instructed nor uniform but reflect various aspects and
are a combination of individual basic emotions [99].
It can be agreed with Abramson et al. [4] that emotional states need to be studied in a complex
way. According to the authors [4], emotional states, such as anger, manifest themselves in a person’s
brain. Therefore, one of the methods to solve the issues of the current face analysis system is the use of
multiple techniques at the same time.
Over the last two decades, special attention has been paid to the automatic recognition of emotions
through the extracted areas of the human face. However, there is a growing demand for biometric
systems and human-machine interaction where facial recognition and emotional intensity play a vital
role [100].
Various biometric sensors (GSR, HR, EEG, and others) can reveal a specific aspect of human
cognition, emotion, and behavior. Depending on the research question, it can be therefore considered to
combine face analysis using webcam and eye tracking sensors with two or more additional biosensors
to gain meaningful insights into the dynamics of attention, emotion, and motivation.
6. Conclusions
The results of the experiment show a low success rate of recognition of students’ emotions.
Students were shown 100 images that were randomly selected from the standardized database NAPS.
The results can be interpreted in two ways. The low success rate may have been caused by improper
inclusion of images into the expected reactions. The specified valence of images may have been skewed
by the subjective reaction of the expert. That may have caused the deviation, which resulted in low
concordance when comparing students’ reactions with expected reaction on a given image. To mitigate
the expert’s subjectivity, it can be recommended to use multiple experts from various areas of expertise
(psychology, pedagogy, etc.) to set the specified valence. By averaging these values, it would be
possible to achieve an optimal specified valence, which would not have the issue of the subjective
influence of an expert.
The second interpretation is that the cause of the low success rate may have been caused by
insufficient reactions of students on the given images. The students may have not expressed their
emotions explicitly enough and it is possible that the Affdex software evaluated their emotional
response as neutral. A solution to this problem might be the use of multiple biometric sensors,
which could help correctly evaluate the emotional response of participants.
Future work could be focused on optimizing specified valence determination using multiple
experts and involving multiple biometric sensors in the process of capturing participant’s responses.
The expected result is an increase in the overall success rate of emotion and reaction recognition.
Consequently, it would be possible to more accurately analyze students’ responses during the classes,
which could lead to optimization of the study content.
The future experiments would contain a subjective evaluation of the images of the participants.
During this evaluation, it would be possible to measure the reaction time for activating the appropriate
button that would represent a positive or a negative emotional state to the shown image. Neutral
emotional status would be recorded if the participant would not push any button. Experiments
would be based on the psychological aspect, as images evoke positive or negative emotional states in
humans [85]. It can be assumed that the subjective image evaluation (using the button) would correlate
with the specified image rating similar to this realized experiment. It would be interesting to measureSensors 2019, 19, 2140 13 of 17
the reaction time to analyze whether there is a difference in time when deciding between a positive
and a negative reaction in response to an emotional state.
Author Contributions: M.M. and Š.K. conceived and designed the experiment. M.M. performed the experiment.
L.B. analyzed the experimental data. The manuscript was written and approved to submit by all authors.
Acknowledgments: The research leading to these results has received funding from the operational program
Research and Innovation for the project Fake news on the Internet - identification, content analysis, emotions
(code: NFP313010T527) co-financed by the European Regional Development Fund and was supported by the
grant project KEGA no. 036UKF-4/2019 Adaptation of the learning process using sensor networks and the Internet
of Things.
Conflicts of Interest: The authors declare no conflict of interest.
References
1. Bahreini, K.; Nadolski, R.; Westera, W. FILTWAM—A framework for online affective computing in serious
games. Procedia Comput. Sci. 2012, 15, 45–52. [CrossRef]
2. Meikleham, A.; Hugo, R. Understanding informal feedback to improve online course design. Eur. J. Eng.
Educ. 2018, 1–18. [CrossRef]
3. Stöckli, S.; Schulte-Mecklenbeck, M.; Borer, S.; Samson, A.C. Facial expression analysis with AFFDEX and
FACET: A validation study. Behav. Res. Methods 2018, 50, 1446–1460. [CrossRef] [PubMed]
4. Abramson, L.; Marom, I.; Petranker, R.; Aviezer, H. Is fear in your head? A comparison of instructed and
real-life expressions of emotion in the face and body. Emotion 2017, 17, 557–565. [CrossRef] [PubMed]
5. IMotions Facial Expression Analysis. Available online: https://imotions.com/facial-expressions (accessed on
12 December 2018).
6. Ekman, P.; Sorenson, E.R.; Friesen, W. V pan-cultural elements in facial displays of emotion. Science 1969,
164, 86–88. [CrossRef]
7. Ekman, P.; Friesen, W.V. Constants across cultures in the face and emotion. J. Pers. Soc. Psychol. 1971, 17,
124–129. [CrossRef]
8. Matsumoto, D.; Assar, M. The effects of language on judgments of universal facial expressions of emotion.
J. Nonverbal Behav. 1992, 16, 85–99. [CrossRef]
9. Matsumoto, D.; Yoo, S.H.; Fontaine, J. Mapping expressive differences around the world. J. Cross Cult.
Psychol. 2008, 39, 55–74. [CrossRef]
10. Røysamb, E.; Nes, R.B.; Czajkowski, N.O.; Vassend, O. Genetics, personality and wellbeing. A twin study of
traits, facets and life satisfaction. Sci. Rep. 2018, 8, 12298. [CrossRef]
11. Songa, G.; Slabbinck, H.; Vermeir, I. How do implicit/explicit attitudes and emotional reactions to sustainable
logo relate? A neurophysiological study. Food Qual. Prefer. 2019, 71, 485–496. [CrossRef]
12. Keltner, D. Born to Be Good: The Science of a Meaningful Life; WW Norton & Company: New York, NY,
USA, 2009.
13. Lövheim, H. A new three-dimensional model for emotions and monoamine neurotransmitters. Med. Hypotheses
2012, 78, 341–348. [CrossRef]
14. Weiner, B. A cognitive (attribution)-emotion-action model of motivated behavior: An analysis of judgments
of help-giving. J. Pers. Soc. Psychol. 1980, 39, 186–200. [CrossRef]
15. Plutchik, R. Emotion, a Psychoevolutionary Synthesis; Harper & Row: New York, NY, USA, 1980;
ISBN 0060452358.
16. Wundt, W.M. Outlines of Psychology (Classic Reprint); Fb&c Limited: London, UK, 2017; ISBN 9780331795738.
17. Ekman, P. Facial expressions of emotion: New findings, new questions. Psychol. Sci. 1992, 3, 34–38.
[CrossRef]
18. Russell, J.A. A circumplex model of affect. J. Pers. Soc. Psychol. 1980, 39, 1161–1178. [CrossRef]
19. Oveis, C.; Horberg, E.J.; Keltner, D. Compassion, pride, and social intuitions of self-other similarity. J. Pers.
Soc. Psychol. 2010, 98, 618–630. [CrossRef]
20. Goetz, J.L.; Keltner, D.; Simon-Thomas, E. Compassion: An evolutionary analysis and empirical review.
Psychol. Bull. 2010, 136, 351–374. [CrossRef]Sensors 2019, 19, 2140 14 of 17
21. Ayata, D.; Yaslan, Y.; Kamasak, M. Emotion recognition via galvanic skin response:
Comparison of machine learning algorithms and feature extraction methods. Available
online: https://go.galegroup.com/ps/anonymous?id=GALE%7CA508361308&sid=googleScholar&v=2.1
&it=r&linkaccess=abs&issn=13030914&p=AONE&sw=w (accessed on 11 December 2018).
22. Shimmer Measuring Emotion: Reactions to Media. Available online: https://www.shimmersensing.com/ass
ets/images/content/case-study-files/Emotional_Response_27July2015.pdf (accessed on 11 December 2018).
23. Clore, G.L.; Ortony, A. Appraisal theories: How cognition shapes affect into emotion. In Handbook of Emotions,
3rd ed.; The Guilford Press: New York, NY, USA, 2008; pp. 628–642, ISBN 1-59385-650-4 (Hardcover);
978-1-59385-650-2 (Hardcover).
24. Kanade, T. Picture Processing System by Computer Complex and Recognition of Human Faces. Ph.D. Thesis,
Kyoto University, Kyoto, Japan, 1973.
25. Bledsoe, W.W. The Model Method in Facial Recognition; Panoramic Research, Inc.: Palo Alto, CA, USA, 1964.
26. Chan, H.; Bledsoe, W.W. A Man-Machine Facial Recognition System: Some Preliminary Results; Panoramic
Research, Inc.: Palo Alto, CA, USA, 1965.
27. Bledsoe, W.W. Some results on multicategory pattern recognition. J. ACM 1966, 13, 304–316. [CrossRef]
28. Bledsoe, W.W. Semiautomatic Facial Recognition; Stanford Research Institute: Menlo Park, CA, USA, 1968.
29. Goldstein, A.J.; Harmon, L.D.; Lesk, A.B. Identification of human faces. Proc. IEEE 1971, 59, 748–760.
[CrossRef]
30. Yang, M.-H.; Kriegman, D.J.; Ahuja, N. Detecting faces in images: A survey. IEEE Trans. Pattern Anal. Mach.
Intell. 2002, 24, 34–58. [CrossRef]
31. Yang, G.; Huang, T.S. Human face detection in a complex background. Pattern Recognit. 1994, 27, 53–63.
[CrossRef]
32. Kotropoulos, C.; Pitas, I. Rule-based face detection in frontal views. In Proceedings of the 1997 IEEE
International Conference on Acoustics, Speech, and Signal Processing, Munich, Germany, 21–24 April 1997.
33. Zhang, L.; Lenders, P. Knowledge-based eye detection for human face recognition. In Proceedings of the
KES’2000. Fourth International Conference on Knowledge-Based Intelligent Engineering Systems and Allied
Technologies. Proceedings (Cat. No.00TH8516), Brighton, UK, 30 August–1 September 2000.
34. Vezhnevets, V.; Sazonov, V.; Andreeva, A. A Survey on pixel-based skin color detection techniques. Proc. Graph.
2003, 6, 85–92.
35. Lakshmi, H.C.V.; PatilKulakarni, S. Segmentation algorithm for multiple face detection for color images with
skin tone regions. In Proceedings of the 2010 International Conference on Signal Acquisition and Processing,
Bangalore, India, 9–10 February 2010.
36. Ghimire, D.; Lee, J. A robust face detection method based on skin color and edges. J. Inf. Process. Syst. 2013,
9, 141–156. [CrossRef]
37. Chavhan, A.; Chavan, S.; Dahe, S.; Chibhade, S. A neural network approach for real time emotion recognition.
IJARCCE 2015, 4, 259–263. [CrossRef]
38. Sakai, T.; Nagao, M.; Fujibayashi, S. Line extraction and pattern detection in a photograph. Pattern Recognit.
1969, 1, 233–248. [CrossRef]
39. Chow, G.; Li, X. Towards a system for automatic facial feature detection. Pattern Recognit. 1993, 26, 1739–1755.
[CrossRef]
40. Li, X.; Roeder, N. Face contour extraction from front-view images. Pattern Recognit. 1995, 28, 1167–1179.
[CrossRef]
41. Jeng, S.-H.; Liao, H.-Y.; Liu, Y.-T.; Chern, M.-Y. An efficient approach for facial feature detection using
geometrical face model. In Proceedings of the 13th International Conference on Pattern Recognition, Vienna,
Austria, 25–29 August 1996.
42. Kwon, Y.H.; da Vitoria Lobo, N. Face detection using templates. In Proceedings of the 12th International
Conference on Pattern Recognition, Jerusalem, Israel, 9–13 October 1994.
43. Wang, J.; Tan, T. A new face detection method based on shape information. Pattern Recognit. Lett. 2000, 21,
463–471. [CrossRef]
44. Jiang, J.L.; Loe, K.-F. S-adaboost and pattern detection in complex environment. In Proceedings of the 2003
IEEE Computer Society Conference on Computer Vision and Pattern Recognition, Madison, WI, USA, 18–20
June 2003.Sensors 2019, 19, 2140 15 of 17
45. Li, S.Z.; Zhang, Z. FloatBoost learning and statistical face detection. IEEE Trans. Pattern Anal. Mach. Intell.
2004, 26, 1112–1123. [CrossRef]
46. Sirovich, L.; Kirby, M. Low-dimensional procedure for the characterization of human faces. J. Opt. Soc. Am.
A 1987, 4, 519–524. [CrossRef]
47. Turk, M.; Pentland, A. Eigenfaces for recognition. J. Cogn. Neurosci. 1991, 3, 71–86. [CrossRef]
48. Jin, Y.; Ruan, Q.Q. Face recognition using gabor-based improved supervised locality preserving projections.
Comput. Inform. 2012, 28, 81–95.
49. Tian, Y.; Kanade, T.; Cohn, J.F. Eye-State Action Unit Detection by Gabor Wavelets; Springer: Berlin/Heidelberg,
Germany, 2000; pp. 143–150.
50. Gneushev, A.N. Construction and optimization of a texture-geometric model of a face image in the space of
basic Gabor functions. J. Comput. Syst. Sci. Int. 2007, 46, 418–428. [CrossRef]
51. Kass, M.; Witkin, A.; Terzopoulos, D. Snakes: Active contour models. Int. J. Comput. Vis. 1988, 1, 321–331.
[CrossRef]
52. Yuille, A.L.; Hallinan, P.W.; Cohen, D.S. Feature extraction from faces using deformable templates. Int. J.
Comput. Vis. 1992, 8, 99–111. [CrossRef]
53. Wang, Q.; Xie, L.; Zhu, B.; Yang, T.; Zheng, Y. Facial features extraction based on active shape model.
J. Multimed. 2013, 8, 6. [CrossRef]
54. Yoo, S.-H.; Oh, S.-K.; Pedrycz, W. Optimized face recognition algorithm using radial basis function neural
networks and its practical applications. Neural Netw. 2015, 69, 111–125. [CrossRef]
55. Surace, L.; Patacchiola, M.; Sönmez, E.B.; Spataro, W.; Cangelosi, A. Emotion recognition in the wild using
deep neural networks and bayesian classifiers. arXiv 2017, arXiv:1709.03820.
56. Rajakumari, B.; Senthamarai Selvi, N. HCI and eye tracking: Emotion recognition using hidden markov
model. Int. J. Comput. Sci. Eng. Technol. 2015, 6, 90–93.
57. Rowley, H.A.; Baluja, S.; Kanade, T. Neural network-based face detection. IEEE Trans. Pattern Anal. Mach.
Intell. 1998, 20, 23–38. [CrossRef]
58. Bahreini, K.; Nadolski, R.; Westera, W. Towards multimodal emotion recognition in e-learning environments.
Interact. Learn. Environ. 2016, 24, 590–605. [CrossRef]
59. Wang, H.; Song, W.; Liu, W.; Song, N.; Wang, Y.; Pan, H.; Wang, H.; Song, W.; Liu, W.; Song, N.; et al.
A Bayesian scene-prior-based deep network model for face verification. Sensors 2018, 18, 1906. [CrossRef]
60. Cortes, C.; Vapnik, V. Support-vector networks. Mach. Learn. 1995, 20, 273–297. [CrossRef]
61. Burges, C.J.C.; Scholkopf, B. Improving the Accuracy and Speed of Support Vector Machines; MIT Press: Cambridge,
MA, USA, 1997.
62. Rajesh, K.M.; Naveenkumar, M. A robust method for face recognition and face emotion detection system
using support vector machines. In Proceedings of the 2016 International Conference on Electrical, Electronics,
Communication, Computer and Optimization Techniques (ICEECCOT), Mysuru, India, 9–10 December 2016;
pp. 1–5.
63. Chen, R.; Zhou, Y.; Qian, Y. Emotion Recognition Using Support Vector Machine and Deep Neural Network;
Springer: Singapore, 2018; pp. 122–131, ISBN 978-981-10-8110-1.
64. Rizvi, Q.M.; Agrawal, B.G.; Beg, R. A review on face detection methods. J. Manag. Dev. Inf. Technol. 2011,
11, 0–11.
65. Wu, X.; Yuan, P.; Wang, T.; Gao, D.; Cai, Y. Race Classification from Face using Deep Convolutional Neural
Networks. In Proceedings of the 2018 3rd International Conference on Advanced Robotics and Mechatronics
(ICARM), Singapore, 18–20 July 2018; pp. 1–6.
66. Zafar, U.; Ghafoor, M.; Zia, T.; Ahmed, G.; Latif, A.; Malik, K.R.; Sharif, A.M. Face recognition with Bayesian
convolutional networks for robust surveillance systems. EURASIP J. Image Video Process. 2019, 2019, 10.
[CrossRef]
67. Abuzneid, M.; Mahmood, A. Improving human face recognition using deep learning based image registration
and multi-classifier approaches. In Proceedings of the 2018 IEEE/ACS 15th International Conference on
Computer Systems and Applications (AICCSA), Aqaba, Jordan, 28 Ocober–1 November 2018; pp. 1–2.
68. Muniasamy, A.; Tabassam, S.; Hussain, M.A.; Sultana, H.; Muniasamy, V.; Bhatnagar, R. Deep learning for
predictive analytics in healthcare. In The International Conference on Advanced Machine Learning Technologies
and Applications (AMLTA2019); Springer: Cham, Switzerland, 2019; pp. 32–42.You can also read