Dopamine Regulates Two Classes of Primate Prefrontal Neurons That Represent Sensory Signals
←
→
Page content transcription
If your browser does not render page correctly, please read the page content below
13724 • The Journal of Neuroscience, August 21, 2013 • 33(34):13724 –13734

Behavioral/Cognitive

Dopamine Regulates Two Classes of Primate Prefrontal
Neurons That Represent Sensory Signals
Simon N. Jacob,* Torben Ott,* and Andreas Nieder
Animal Physiology, Institute of Neurobiology, University of Tübingen, D-72076 Tübingen, Germany

The lateral prefrontal cortex (PFC), a hub of higher-level cognitive processing, is strongly modulated by midbrain dopamine (DA)
neurons. The cellular mechanisms have been comprehensively studied in the context of short-term memory, but little is known about how
DA regulates sensory inputs to PFC that precede and give rise to such memory activity. By preparing recipient cortical circuits for
incoming signals, DA could be a powerful determinant of downstream cognitive processing. Here, we tested the hypothesis that prefron-
tal DA regulates the representation of sensory signals that are required for perceptual decisions. In rhesus monkeys trained to report the
presence or absence of visual stimuli at varying levels of contrast, we simultaneously recorded extracellular single-unit activity and
applied DA to the immediate vicinity of the neurons by micro-iontophoresis. We found that DA modulation of prefrontal neurons is not
uniform but tailored to specialized neuronal classes. In one population of neurons, DA suppressed activity with high temporal precision
but preserved signal/noise ratio. Neurons in this group had short visual response latencies and comprised all recorded narrow-spiking,
putative interneurons. In a distinct population, DA increased excitability and enhanced signal/noise ratio by reducing response variabil-
ity. These neurons had longer visual response latencies and were composed exclusively of broad-spiking, putative pyramidal neurons. By
gating sensory inputs to PFC and subsequently strengthening the representation of sensory signals, DA might play an important role in
shaping how the PFC initiates appropriate behavior in response to changes in the sensory environment.

Introduction                                                                                                            stimuli in working memory (Brozoski et al., 1979). Much of what
All neuronal systems are subject to neuromodulation, which can                                                          is known about the mechanisms of DA action in PFC stems from
profoundly alter the properties of target circuits (Marder, 2012).                                                      electrophysiological studies on memory-related activity, i.e., in
The primate lateral prefrontal cortex (PFC), a hub of higher-level                                                      the absence of sensory stimulation (Williams and Goldman-
cognitive functioning (Fuster, 2008; Bongard and Nieder, 2010;                                                          Rakic, 1995). In rhesus monkeys engaged in a spatial working
Eiselt and Nieder, 2013), receives particularly strong projections                                                      memory task, PFC neurons active in the delay period of the task
from dopamine (DA) neurons in the midbrain (Williams and                                                                showed improved tuning to preferred remembered locations
Goldman-Rakic, 1998; Björklund and Dunnett, 2007). DA neu-                                                             when stimulated with DA receptor agonists (Vijayraghavan et al.,
rons fire phasic bursts of action potentials with short latencies of                                                    2007). Therefore, it is believed that the principal function of DA
100 –150 ms in response to behaviorally relevant sensory events                                                         in PFC is to strengthen mental representations (Arnsten, 2011).
(Schultz, 1998; Matsumoto and Hikosaka, 2009). Therefore, it                                                                In contrast, little is known about how DA modulates prefron-
has been suggested that DA could prepare its higher-order target                                                        tal sensory signals that precede and give rise to such sustained
areas for the processing of incoming signals (Redgrave and Gur-                                                         activity. Anecdotal evidence indicates that visual stimuli used to
ney, 2006; de Lafuente and Romo, 2011). How might DA influ-                                                             cue a target to be remembered are also influenced by DA (Sawa-
ence recipient prefrontal neurons to control information relayed                                                        guchi et al., 1990; Williams and Goldman-Rakic, 1995), but
to this important cortical structure?                                                                                   quantitative analysis and an in-depth investigation of the cellular
    Prefrontal DA regulates many frontal lobe functions, such as                                                        mechanisms are lacking. Because phasic DA activity that is time-
set-shifting and behavioral flexibility (Floresco et al., 2006), asso-                                                  locked to relevant sensory stimuli seems particularly suited to
ciation learning (Puig and Miller, 2012), and the maintenance of                                                        regulate the representation of these shorter-lived signals, it has
                                                                                                                        been proposed that DA might serve as a gating signal that controls
Received Jan. 16, 2013; revised June 10, 2013; accepted July 9, 2013.                                                   inputs to PFC (Servan-Schreiber et al., 1990; D’Ardenne et al.,
   Author contributions: S.N.J. and A.N. designed research; S.N.J. and T.O. performed research; S.N.J. and T.O.         2012). By assigning salience to prefrontal sensory inputs, phasic
analyzed data; S.N.J., T.O., and A.N. wrote the paper.                                                                  DA could strongly influence subsequent cognitive processing in
   This work was supported by grants from the German Research Foundation [S.N.J. (Grant JA 1999/1-1) and A.N.
(Grant NI 618/2-1)]. We thank A. Thiele for technical assistance with electrode fabrication and iontophoresis, K.
                                                                                                                        PFC. Visual signals, for example, are passed through lower-level
Merten for help with animal training and data analysis, and S. Hage and C. Zielinski for comments on this manuscript.   cortical areas in a feedforward manner and reach the PFC within
   *S.N.J. and T.O. contributed equally to this work.                                                                   100 –150 ms (Thorpe and Fabre-Thorpe, 2001). The PFC collects
   The authors declare no competing financial interests.                                                                this sensory information to form subjective judgments, such as
   Correspondence should be addressed to Dr. Simon N. Jacob, Department of Psychiatry and Psychotherapy,
Charité Berlin, Charitéplatz 1, 10117 Berlin, Germany. E-mail: simon.jacob@charite.de.
                                                                                                                        regarding the presence or absence of sensory stimulation (de La-
   DOI:10.1523/JNEUROSCI.0210-13.2013                                                                                   fuente and Romo, 2006). Recent electrophysiological studies
Copyright © 2013 the authors 0270-6474/13/3313724-11$15.00/0                                                            have demonstrated that the physical intensity of tactile and visual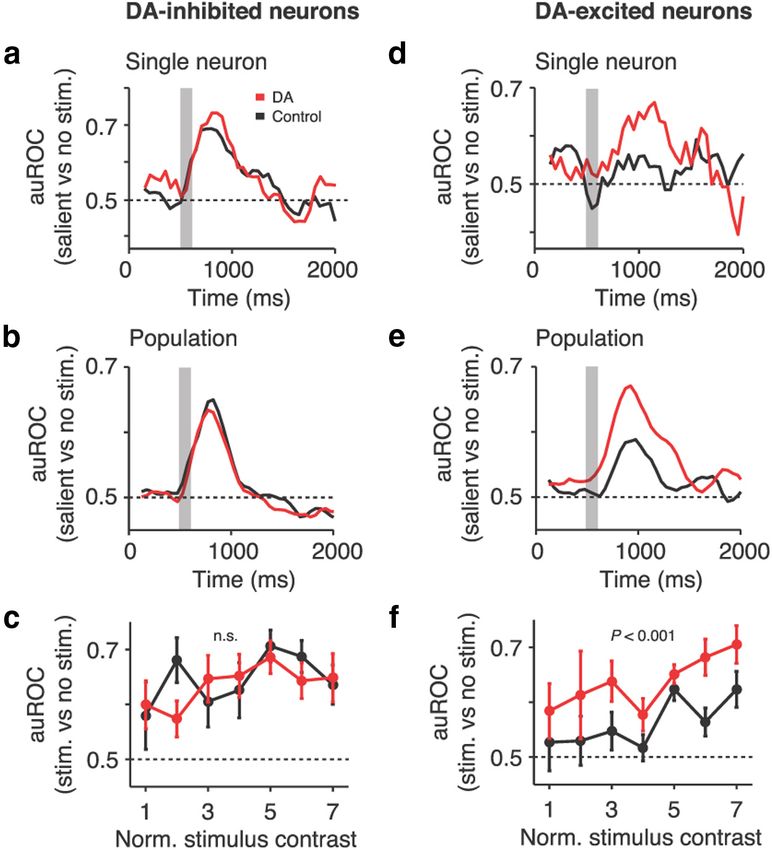
Jacob, Ott et al. • Prefrontal Dopamine Regulates Sensory Signals                                          J. Neurosci., August 21, 2013 • 33(34):13724 –13734 • 13725

stimuli is represented in single neurons of the primate PFC along-             Iontophoresis
side their perceived intensity, i.e., the animal’s subjective experi-          DA was applied iontophoretically (MVCS iontophoresis system; npi
ence of a stimulus (de Lafuente and Romo, 2005; Merten and                     electronic) using custom-made tungsten-in-glass electrodes flanked by
Nieder, 2012, 2013).                                                           two pipettes each (Thiele et al., 2006). Electrode impedances were 1–3
                                                                               M⍀ (measured at 500 Hz; Omega Tip Z; World Precision Instruments).
   Here, we investigate in trained rhesus monkeys how DA con-
                                                                               Pipette resistances depended on the pipette opening diameter, drug, and
trols the prefrontal representation of such brief sensory stimuli              solvent used. Typical resistances were 15–50 M⍀ (full range, 15–150 M⍀).
that must be detected by the animals (Merten and Nieder, 2012,                 Pilot in vitro experiments (DA iontophoresis into NaCl, concentrations
2013). We found that DA strengthens visual signals by modulat-                 quantified by HPLC) determined the smallest holding current that en-
ing activity in two distinct classes of neurons. Our results suggest           sured good retention without accumulation of dead space and thus al-
that prefrontal DA may play an important role in determining                   lowed for rapid delivery of DA after switching to ejection currents.
how the PFC orchestrates behavioral responses triggered by sen-                Retention currents were ⫺7 to ⫺10 nA. Ejection currents for DA (200 mM in
sory events.                                                                   double-distilled water, pH 4.0 with HCl; Sigma-Aldrich) were ⫹25–100
                                                                               nA (median, ⫹50 nA). Control experiments with 0.9% NaCl, pH 7, used
                                                                               ⫹50 nA. Ejection currents were chosen to match the values reported to
Materials and Methods                                                          be maximally effective, i.e., in the peak range of the inverted-U function
Surgical procedures                                                            (Sawaguchi, 2001; Vijayraghavan et al., 2007). DA currents were varied
Two male rhesus monkeys (Macaca mulatta) were implanted with a tita-           only during experiments to determine whether the ratio of inhibition/
nium head post and one recording chamber centered over the principal           excitation depended on the applied concentration. Otherwise, we did not
sulcus of the lateral PFC, anterior to the frontal eye fields (right hemi-     attempt to investigate dosage effects.
sphere in monkey H, right and left hemispheres consecutively in monkey            One pipette per electrode was filled with DA solution, and the other
M). Surgery was conducted using aseptic techniques under general anes-         contained 0.9% NaCl. Electrode impedance and pipette resistance were
thesia. Structural magnetic resonance imaging was performed before             measured after each recording session. DA was applied continuously for
implantation to locate anatomical landmarks. All experimental proce-           12–15 min, depending on the number of trials completed correctly by the
dures were in accordance with the guidelines for animal experimentation        animal. The first block was always the control condition. Given the fast
approved by the local authority, the Regierungspräsidium Tübingen.            DA application verified by HPLC (see above), we did not automatically
                                                                               exclude data at the current switching points.
Behavioral protocol
Task. The monkeys were trained to report the presence or absence of
visual objects flashed at varying contrast levels centered on their percep-    Data analyses
tual threshold. The animals initiated each experimental trial by grasping      Data analysis was performed with MATLAB (Mathworks). None of the
a lever and fixating a central fixation target (fixation period). After 500    reported analyses depended on the exact choice of trials to include or
ms, a stimulus was displayed for 100 ms in half of the trials (stimulus        time windows to analyze. Repeating analyses with a different choice of
period). In the other half, no stimulus was shown. Both trial types were       parameters yielded comparable results.
randomly intermixed. After the delay period (2700 ms), a colored rule             Excitability modulation. Neurons stimulated with DA were excluded
cue instructed the monkey how to respond. If a stimulus was presented,         from additional analysis if their baseline (fixation period) discharge rates
a red square cue required the monkey to release the lever within 1000 ms       were ⬍1 Hz in the control or DA phase. Baseline firing rates of each
to receive a fluid reward, whereas a blue cue indicated to the monkey to       neuron were pooled for the control condition and the DA condition and
keep holding the lever for 1200 ms. The rule applied in the inverse way if     compared with a rank-sum test (Mann–Whitney U test). If the median
no stimulus was presented.                                                     firing rate in the DA condition was significantly ( p ⬍ 0.05, two-sided
   CORTEX software (National Institute of Mental Health, Bethesda,             test) larger than in the control condition, the neuron was classified as
MD) was used for experimental control and behavioral data acquisition.         excited, and if the median was lower, the neuron was classified as inhib-
The animals maintained fixation throughout the fixation, stimulus, and         ited by DA.
delay periods within 1.75° of visual angle of the central fixation target         Receiver operating characteristic analyses. Neuronal coding strength
(ISCAN).                                                                       was quantified using receiver operating characteristic (ROC) analysis
   Visual stimuli. The stimulus consisted of a gray object (4° of visual       (Green and Swets, 1966). The area under the ROC curve (auROC) is a
angle in diameter) presented at seven levels of contrast close to perceptual   nonparametric measure of the discriminability of two distributions. It
threshold, determined individually for each animal (monkey H: 7.3, 8.7,        denotes the probability with which an ideal observer can tell apart a
10.6, 11.6, 19.9, 24.9, and 28.0%; monkey M: 9.1, 9.8, 11.8, 12.5, 14.7,       meaningful signal from a noisy background. Values of 0.5 indicate no
16.7, and 17.4%), measured with an LS-100 luminance meter (Konica              separation, and values of 1 signal perfect discriminability. The auROC
Minolta). The shape of the object was chosen randomly from a set of two        takes into account both the difference between distribution means as well
objects: hexagon and circle for monkey H; cross and rhomboid for mon-          as their widths and is therefore a more suitable indicator of signal quality
key M. The area of the object was kept constant to maintain the same           than other, simpler measures of signal/noise ratio (Servan-Schreiber et
visual contrast across different shapes.                                       al., 1990; Parker and Newsome, 1998; Herrero et al., 2008).
   Visual contrasts were determined for each animal individually to yield         Stimulus-responsive neurons. A two-way ANOVA was calculated with
approximately the same data points on the psychometric curve. To pool          main factors stimulus contrast (salient/absent) and iontophoresis condi-
data for analysis, visual contrasts were normalized to an ordinal scale of     tion (control/DA) using firing rates after stimulus presentation (300 ms
1–7 (1 corresponding to the lowest and 7 to the highest stimulus contrast      time window aligned to the individual response latency of the neuron; see
presented to each animal, regardless of the actual physical intensity).        below), including correct trials only. Neurons with a significant stimulus
Salient stimuli analyzed in Figures 3 and 5 denote the three highest con-      main effect ( p ⬍ 0.05) were classified as stimulus responsive. Salient
trasts (5–7).                                                                  stimulation was defined as the three highest visual contrasts.
                                                                                  Except for the analysis in Figure 7b (see below), visual response laten-
Electrophysiology                                                              cies were calculated using sliding ROC analysis with a window size of
In each recording session, up to three electrodes (see below, Iontopho-        50 ms, step of 1 ms. For each window, we calculated the auROC by
resis) were inserted transdurally using a modified electrical microdrive       comparing the firing rates between correct salient stimulus trials (hits)
(NAN Instruments). Neurons were recorded at random; no attempt was             and correct absent stimulus trials (correct rejections). To test whether the
made to preselect neurons according to particular response properties.         auROC was significantly different from 0.5, bootstrapping was used to
Signal acquisition, amplification, filtering, and digitalization were ac-      construct 999 resamples by randomly sampling the data with replace-
complished with the MAP system (Plexon). Waveform separation was               ment and maintaining the original number of trials per condition. The
performed offline (Offline Sorter; Plexon).                                    latency of a neuron was defined as the time after stimulus onset but no
13726 • J. Neurosci., August 21, 2013 • 33(34):13724 –13734 Jacob, Ott et al. • Prefrontal Dopamine Regulates Sensory Signals
later than 500 ms, when the auROC exceeded the 95% confidence inter- line firing rate (FR) was expressed as FR ⫽ A ⫻ (1 ⫺ exp(⫺x/tau)), where
val of the bootstrapped data for 50 consecutive windows. The response A is the estimated amplitude and tau the parameter fitted using nonlinear
latency was determined separately for the control and DA conditions. If least squares. The population time course was calculated by averaging the
no value could be determined, a default latency corresponding to the normalized baseline discharge rates from all trials recorded within 6 min
median response latency of all neurons in the respective condition was before and after switching to DA application using bins of 5 s and
used (228 and 217 ms for the control and DA conditions, respectively). smoothed with a Gaussian kernel (width of 10 s, step of 5 s).
The choice of these parameters ensured that the analysis window (see Extracellular action potential waveforms. Recorded single units were
below, Neuronal signal metrics) covered the stimulus response in all categorized into narrow-spiking (NS) and broad-spiking (BS) neurons,
neurons. i.e., putative interneurons and pyramidal cells, using a linear classifier
To directly compare visual response latencies between the population (k-means, k ⫽ 2, squared Euclidean distance) (Diester and Nieder, 2008).
of inhibited and excited stimulus encoding neurons (see Fig. 7b), re- For each single unit, the template waveform was extracted with the
sponse latency was defined as two consecutive significant auROC values Plexon Offline sorter. Only neurons with a downward voltage deflection
using a window size of 50 ms, step of 10 ms. This choice of parameters followed by an upward peak were included. Units with a minimum out-
was more sensitive to the actual onset of the stimulus response so that side 200 – 400 s or a maximum before 300 s after reaching the initial
latencies were reliably determined in all stimulus neurons (i.e., no default threshold were excluded (n ⫽ 3 of 60 units). Waveforms were normal-
latencies were used). ized by their difference between maximum and minimum voltage deflec-
For single-cell spike density histograms, the average firing rate in sa- tion and aligned to their minimum. Units in the cluster with the smaller
lient trials and trials without visual stimulation (correct trials only) was mean spike width constituted the population of NS neurons, and units in
smoothed with a Gaussian kernel (bin width of 150 ms, step of 1 ms). For the cluster with the larger mean spike width constituted the BS neurons.
the population responses, activity was normalized, averaged, and Interdependence between modulation type (excited or inhibited by DA)
smoothed with the same Gaussian kernel. Responses were normalized by and waveform type was tested with Fisher’s exact test.
subtracting the mean baseline firing rate in the control condition and
dividing by the SD of the baseline firing rates in the control condition. Results
Stimulus responses calculated using sliding ROC analysis (window To determine how DA regulates sensory signals in PFC, we pre-
size of 300 ms, step of 50 ms) quantified the discriminability between sented brief flashes of visual stimuli at varying contrasts to two
the firing rate distributions of correct salient trials and correct rejec- rhesus macaque monkeys (Macaca mulatta). The animals were
tion trials. trained to detect the stimuli and report their subjective percep-
Neuronal signal metrics. All analyses were performed using data from a
tual judgment about the presence or absence of visual stimulation
300 ms window aligned to individual visual response latencies. This en-
sured that stimulus responses were adequately captured in all neurons.
(Merten and Nieder, 2012) (Fig. 1a). The rule-based task design
To distinguish between additive and multiplicative operations, the dif- ensured that neuronal activity in the delay period after the stim-
ference between the mean firing rate in hit trials and correct rejections ulus was free of preparatory motor signals. While the monkeys
was divided by the mean baseline firing rate for all (normalized) contrasts performed this task, we recorded single units from the lateral
and both iontophoresis conditions (Vijayraghavan et al., 2007). Neuro- PFC. During recordings, trial blocks without pharmacological
metric curves were determined by calculating the auROC between dis- manipulation (control) alternated with blocks in which DA was
charge rates in hit trials and correct rejections for all (normalized) visual applied to the vicinity of the recorded cells by micro-iontophoresis
contrasts. Neuronal variability was quantified by the Fano factor (FF), (Fig. 1b). As expected, we did not observe changes in the monkeys’
i.e., the ratio of trial-by-trial spike count variance and mean spike count behavior as a consequence of micro-iontophoretic drug application
(Churchland et al., 2010). (Fig. 1c,d), because transmitter application with this method is very
To determine whether DA modulated a signal metric, multiple linear
focal (Herz et al., 1969).
regression analysis was applied to the population data (Merten and Nie-
der, 2012). Linear functions were fitted to the factors normalized visual
contrast and iontophoresis condition (control and DA) using the model Two classes of DA-sensitive prefrontal neurons
for the signal metric ( S): S ⫽ a_0 ⫹ a_stim ⫻ STIM ⫹ a_ion ⫻ ION, We recorded 110 neurons that entered the analysis (60 neurons
where a_stim and a_ion are the coefficients that quantify the signal met- from monkey M, 50 neurons from monkey H). Application of
ric dependence on the normalized stimulus contrast (STIM) and the DA influenced the excitability of prefrontal neurons. We com-
iontophoresis condition (ION). To assess DA effects on the analyzed pared fixation period activity in the control condition with the
signal metric, p values for the factor iontophoresis condition were used DA condition (rank-sum test, p ⬍ 0.05; Fig. 2a). DA suppressed
(t statistics for the coefficient a_ion). discharge rates in 32 neurons (DA-inhibited neurons; single-
DA modulation of neuronal variability was also quantified by multiple neuron example in Fig. 2b). Activity increased in 28 neurons
linear regression analysis. Linear functions were fitted to the relationship
(DA-excited neurons; single-neuron example in Fig. 2c). Dis-
between mean spike count of each contrast and neuron (COUNT) and
variance of the spike count of each contrast and neuron (VAR) separately
charge rates were unaffected in 50 neurons (DA-unmodulated
for each iontophoresis condition (ION), i.e., control and DA. An inter- neurons; data not shown). The changes in excitability were inde-
action term was included to analyze changes in the slope of the linear pendent of the iontophoretically applied DA dosage. The propor-
functions induced by DA (VAR ⫻ ION). The model term was COUNT ⫽ tion of DA-inhibited to DA-excited neurons was not altered
a_0 ⫹ a_var ⫻ VAR ⫹ a_ion ⫻ ION ⫹ a_int ⫻ VAR ⫻ ION. p values for when the cell counts were determined separately for lower
the interaction term a_int were used to assess DA effects on neuronal (⫹25–50 nA) and higher (⫹75–100 nA) ejection currents (23:22
variability. versus 9:6, respectively; Fisher’s exact test, p ⫽ 0.8). None of the
Kinetics of excitability. Exponential functions were fitted to the baseline physiological parameters analyzed in the following changed in
firing rates of all trials recorded within 6 min of switching to the ejection DA-unmodulated cells. This indicates that the effects reported
current (temporal resolution of one trial, i.e., one data point per 5 s). for DA-excited and DA-inhibited neurons were not the result of
Neurons with bad fits (e.g., fitted parameters out of bounds; n ⫽ 1
nonspecific electrical currents.
inhibited cell, n ⫽ 4 excited cells) were excluded from additional analysis.
If several DA phases were recorded, baseline firing rates were aligned to Inhibitory and excitatory DA effects showed different time
all instances of switching to the ejection current and averaged using bins courses in the two groups of neurons. In a representative inhib-
of 5 s. The amplitude of DA modulation was estimated by the mean ited neuron, DA-mediated suppression of spiking activity was
baseline firing rate in the first or second half of the DA condition for fast and reversed equally rapidly (Fig. 2b). In a typical excited
inhibited and excited neurons, respectively. The time course of the base- neuron, DA caused much slower, undulating changes in firing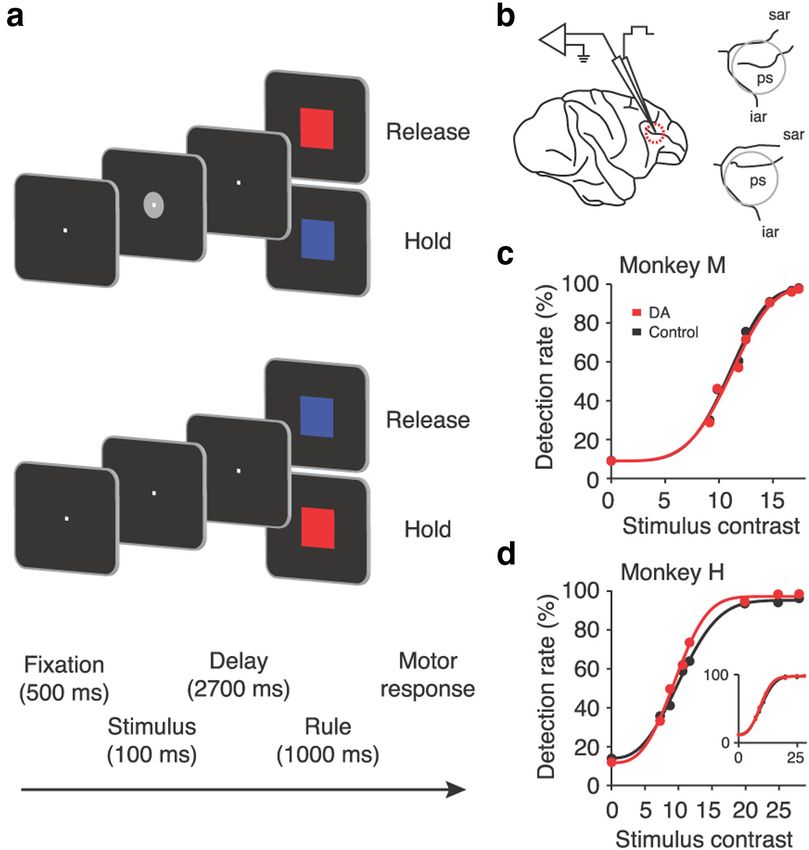
Jacob, Ott et al. • Prefrontal Dopamine Regulates Sensory Signals J. Neurosci., August 21, 2013 • 33(34):13724 –13734 • 13727
trasts; two-way ANOVA with main effects
stimulus (salient/absent) and experimental
condition (control/DA), main effect of
stimulus, p ⬍ 0.05; Fig. 2a]. A representa-
tive DA-inhibited neuron encoded salient
visual stimuli with a clear increase in ac-
tivity in both the control (Fig. 3a) and DA
(Fig. 3b) conditions. Inhibitory DA effects
were reversible and subsided when DA ap-
plication was discontinued (Fig. 3c). In
contrast, the stimulus response was mar-
ginal in an example DA-excited neuron
(Fig. 3d) but increased markedly after DA
was applied (Fig. 3e). Again, these changes
were clearly reversible (Fig. 3f ).
These single-cell effects were verified at
the population level. Across all DA-
inhibited cells, DA induced an offset in
activity but preserved the spike rate differ-
ence between trials with salient stimuli
and no stimulation (Fig. 3g,h). However,
DA-excited neurons increased stimulus
coding based on spike rate differences be-
tween trials with salient and absent stim-
uli (Fig. 3i,j).
We further characterized how DA
modulated neuronal excitability. For all
contrast levels and neurons, we normal-
ized the stimulus-evoked change in firing
rate (⌬Rs; difference between mean activ-
Figure 1. Behavioral protocol and electrophysiological recordings with micro-iontophoresis. a, Stimulus detection task requir- ity in trials with and without visual stim-
ing the monkeys to report whether a visual stimulus had been presented. A visual stimulus of varying contrast levels was flashed
ulation, calculated in a 300 ms window
for 100 ms in 50% of trials (top). In the other 50%, a blank screen was shown (bottom). b, Left, Lateral view of a rhesus monkey
brain depicting the location of extracellular neuronal recording and DA iontophoresis in the principal sulcus region of the PFC. Right,
after stimulus presentation) to baseline
Anatomical reconstruction of the recording locations in monkey M (top) and monkey H (bottom). c, Psychometric curves with activity in the fixation period. Data are
Weibull fits for monkey M (n ⫽ 31 sessions). Data for control and DA conditions were pooled across sessions. d, Conventions as in presented separately for DA-inhibited
c for monkey H (n ⫽ 26 sessions). The slight difference in performance between control and DA trials in monkey H was attributable and DA-excited neurons in both ionto-
to decreased performance at the start of each session (“warm-up” phenomenon; always the control condition) and not the result phoresis conditions (Fig. 4a,b). In DA-
of DA application. The inset shows psychometric curves for monkey H with the first 5 min (⬃5%) of each session omitted. ps, inhibited cells, DA subtracted response
Principal sulcus; sar, superior arcuate sulcus; iar, inferior arcuate sulcus. levels: the normalized ⌬Rs increased after
DA application, i.e., the firing rate differ-
rates (Fig. 2c). These effects were confirmed at the population ence between trials with and without stimulation was retained at
level (Fig. 2d,e): inhibition was precisely time-locked to DA ap- lower baseline firing rates (multiple linear regression, factor ion-
plication, whereas DA-mediated excitation reached maximum tophoresis condition, p ⬍ 0.01; Fig. 4a). In DA-excited cells, DA
levels only much later. The rate of change in excitability after DA increased gain: there was no change in normalized ⌬Rs with DA,
application was quantified by fitting exponential curves to the i.e., the firing rate difference increased in proportion to the base-
temporal profile of neuronal activity. The distribution of time line (multiple linear regression, factor iontophoresis condition,
constants suggested categorical differences in the rate of change p ⫽ 0.5; Fig. 4b).
rather than a gradual transition [mean time constants of 8.9 ⫾
2.1 s (median, 3.7 s) and 221.9 ⫾ 37.1 s (median, 190 s) for Prefrontal DA enhances visual coding strength in
DA-inhibited and DA-excited neurons, respectively; rank-sum excited neurons
test, p ⬍ 0.001; Figure 2f,g]. Control experiments with NaCl ap- We quantified the capacity of the neurons to discriminate be-
plication verified that the rapid reduction in excitability was ab- tween present and absent visual stimulation, i.e., their coding
sent during this sham condition and thus not the result of positive strength or signal/noise ratio. We compared spike rates in these
ejection currents (n ⫽ 13 neurons; Fisher’s exact test comparing two conditions by calculating the auROC derived from signal
with DA condition, p ⬍ 0.05). detection theory (Green and Swets, 1966). auROC values of 0.5
indicate no discriminability, and values of 1 indicate signal per-
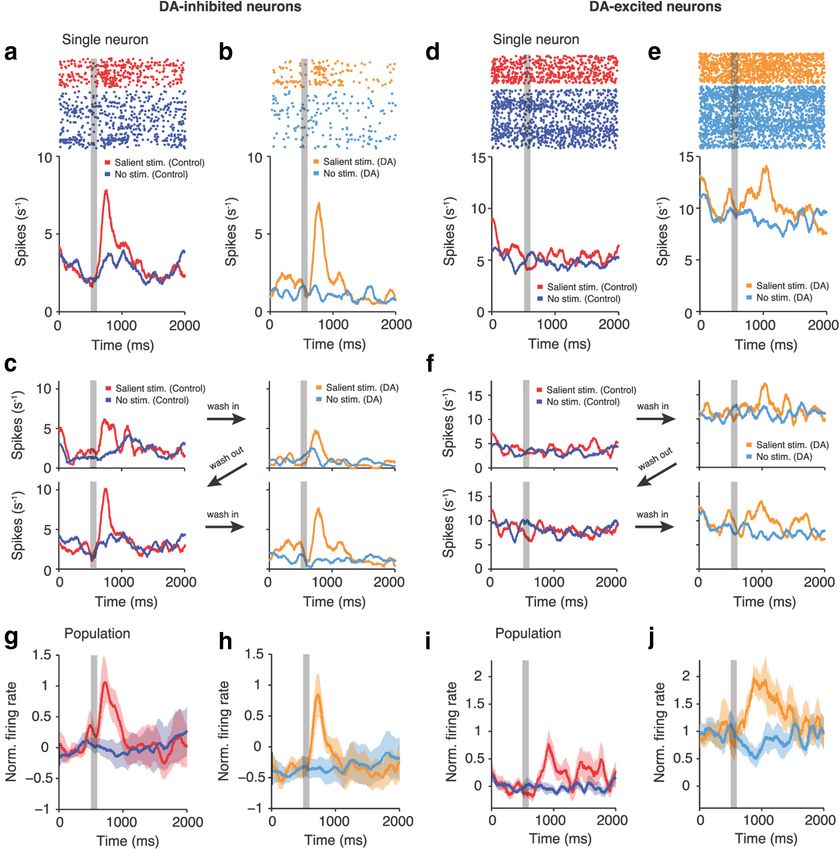
Neuron-class-specific modulation of visual responses by DA fect discriminability. For the representative DA-inhibited neuron
We hypothesized that the categorical changes in excitability from Figure 3, a and b, auROC values increased considerably
might reflect differences in how sensory information is repre- after the presentation of salient stimuli, but they were unaffected
sented in these groups of neurons and how it is modulated by DA. by DA application (Fig. 5a). These time courses were confirmed
Forty-four percent (n ⫽ 14), 36% (n ⫽ 10), and 34% (n ⫽ 17) of in the population of DA-inhibited neurons (Fig. 5b). DA did not
DA-inhibited, DA-excited, and DA-unmodulated neurons, re- induce systematic changes in auROC values in this class of cells
spectively, responded to salient visual stimuli [highest three con- (seven neurons increased, seven neurons decreased; mean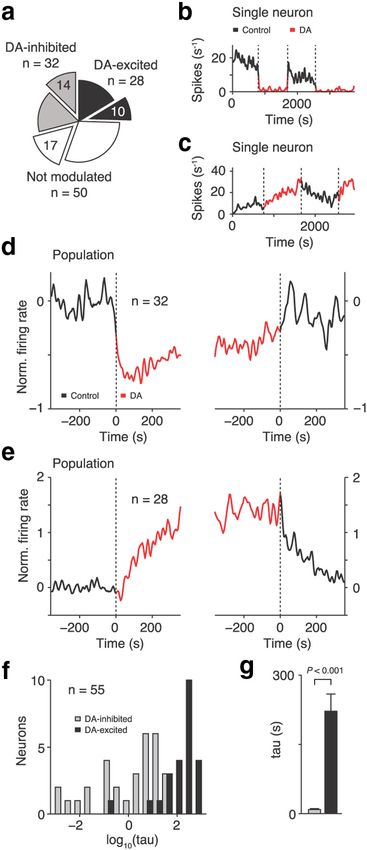
13728 • J. Neurosci., August 21, 2013 • 33(34):13724 –13734                                                                 Jacob, Ott et al. • Prefrontal Dopamine Regulates Sensory Signals

                                                                                                    very consistent across all DA-excited single cells (eight neurons
                                                                                                    increased, one neuron unchanged, one neuron decreased; mean
                                                                                                    ⌬auROC pooled across contrasts, ⫹0.0748 ⫾ 0.0258; signed-
                                                                                                    rank test, p ⬍ 0.05). Mean population auROC values, separated
                                                                                                    into individual contrasts, increased as a function of stimulus con-
                                                                                                    trast and were significantly higher with DA compared with the
                                                                                                    control condition (multiple linear regression; factor contrast,
                                                                                                    p ⬍ 0.001; factor iontophoresis condition; p ⬍ 0.001; Fig. 5f ). No
                                                                                                    changes were induced by DA in DA-unmodulated neurons (mul-
                                                                                                    tiple linear regression; factor contrast, p ⬍ 0.001; factor ionto-
                                                                                                    phoresis condition; p ⫽ 0.14; data not shown). These results
                                                                                                    demonstrate that prefrontal DA does not uniformly modify vi-
                                                                                                    sual coding strength but selectively enhances the capacity to dis-
                                                                                                    criminate stimuli from background in the class of DA-excited
                                                                                                    neurons.

                                                                                                    Prefrontal DA reduces neuronal variability in
                                                                                                    excited neurons
                                                                                                    To investigate which mechanisms could give rise to the strength-
                                                                                                    ening of cortical processing by DA, we determined whether a
                                                                                                    reduction in neuronal noise (discharge rate variability; Shadlen
                                                                                                    and Newsome, 1998) might be a contributing factor as hypothe-
                                                                                                    sized frequently (Winterer and Weinberger, 2004; Durstewitz
                                                                                                    and Seamans, 2008; Rolls et al., 2008). To do so, we analyzed the
                                                                                                    correlation between mean spike counts after stimulus presenta-
                                                                                                    tion (correct trials) and spike count variance across trials for all
                                                                                                    neurons in a given class. For quasi-Poisson spiking processes, the
                                                                                                    data should cluster along the first diagonal (McAdams and
                                                                                                    Maunsell, 1999). This was the case for DA-inhibited neurons
                                                                                                    under both control and DA conditions (multiple linear regres-
                                                                                                    sion, interaction term, p ⫽ 0.64; Fig. 6a). On a single-cell level, no
                                                                                                    systematic DA effects on response variability were observed as
                                                                                                    measured by FF (spike count variance divided by mean; seven
                                                                                                    neurons increased, seven neurons decreased; mean ⌬FF pooled
                                                                                                    across contrasts, ⫺0.1498 ⫾ 0.1709; signed-rank test, p ⫽ 0.63).
                                                                                                    Mean population FFs for each contrast were unchanged in
                                                                                                    DA-inhibited neurons after application of DA (multiple linear
                                                                                                    regression; factor iontophoresis condition, p ⫽ 0.31; Fig. 6b).
                                                                                                        In contrast to the findings for DA-inhibited neurons, trial-to-
Figure 2. Kinetics of DA modulation in inhibited and excited neurons. a, Total number of            trial variability decreased significantly in DA-excited neurons un-
neurons excited, inhibited, or not modulated by DA together with number of stimulus coding          der the influence of DA (multiple linear regression, interaction
neurons in each group (blown out pie sections). b– e, Time courses of responses to DA. Baseline     term, p ⬍ 0.01; Fig. 6c). The FF reduction was consistent across
(fixation period) firing rates of an example DA-inhibited (b) and DA-excited (c) neuron stimu-
                                                                                                    single cells (eight neurons decreased, two neurons increased;
lated repeatedly with DA over the course of ⬃1 h. Population mean baseline activity of
DA-inhibited (d) and DA-excited (e) neurons aligned to onset (left) and termination (right) of
                                                                                                    mean ⌬FF pooled across contrasts, ⫺0.391 ⫾ 0.1931; signed-
DA application. Inhibition by DA was fast, whereas excitation by DA occurred on longer time-        rank test, p ⬍ 0.05). Mean population FFs, separated into indi-
scales. f, Frequency distribution of time constants (tau) of exponential fits to single-cell data   vidual contrasts, were significantly reduced by DA compared
(baseline activity aligned to DA onset). Five neurons with bad fits were excluded and are not       with the control condition (multiple linear regression, factor ion-
shown (see Materials and Methods). g, Mean time constants in the two classes of DA-sensitive        tophoresis condition; p ⬍ 0.05; Fig. 6d). No changes were in-
neurons. Error bars indicate SEM across neurons.                                                    duced in DA-unmodulated neurons (multiple linear regression;
                                                                                                    factor iontophoresis condition; p ⫽ 1.0; data not shown). Thus,
⌬auROC pooled across contrasts, ⫺0.0102 ⫾ 0.0143; signed-                                           DA rendered prefrontal processing more reliable by reducing
rank test, p ⫽ 0.5). Mean population auROC values for individual                                    noise at the level of DA-excited neurons.
stimuli tended to increase as a function of stimulus contrast and
did not change when DA was applied (multiple linear regression;                                     Inhibition and excitation control distinct prefrontal
factor contrast, p ⫽ 0.12; factor iontophoresis condition; p ⫽ 0.6;                                 processing stages
Fig. 5c). Thus, DA did not affect visual coding strength in                                         To further characterize the two DA-responsive neuron classes, we
DA-inhibited neurons.                                                                               analyzed the extracellular action potential waveforms of the cells.
    In contrast, DA significantly improved the stimulus coding                                      Electrophysiological recordings have suggested that longer wave-
quality of DA-excited neurons. Figure 5d shows the time course                                      forms might be primarily associated with pyramidal cells (BS
of the example DA-excited cell from Figure 3, d and e. Stimulus-                                    neurons), whereas shorter waveforms could be more typical of
evoked auROC values increased in this neuron under the influ-                                       interneurons (NS neurons) (Henze et al., 2000; Diester and Nie-
ence of DA. This time course was confirmed in the population of                                     der, 2008; Hussar and Pasternak, 2009; Vigneswaran et al., 2011).
DA-excited neurons (Fig. 5e). The increase in auROC values was                                      We calculated the average normalized waveform for each single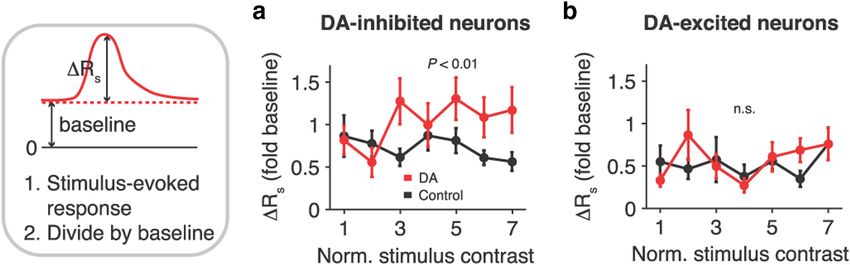
Jacob, Ott et al. • Prefrontal Dopamine Regulates Sensory Signals                                                                             J. Neurosci., August 21, 2013 • 33(34):13724 –13734 • 13729

Figure 3. DA modulation of prefrontal visual signals is neuron-class specific. a, b, Responses of an example DA-inhibited neuron to salient (highest 3 contrasts) and absent visual stimuli in the
control (a) and DA (b) conditions. Activity is aligned to the start of a trial (fixation period). The gray shaded area marks the stimulus presentation. Top, Dot raster plot; bottom, spike density histogram.
Visual coding is preserved at shifted response levels. c, Sequence of control and DA periods in the same example DA-inhibited neuron. DA-mediated effects are reversible. d–f, Conventions as in a– c
for an example DA-excited neuron. Visual responses are enhanced by DA. g, h, Population mean responses of DA-inhibited neurons in control (g) and DA (h) trials. i, j, Conventions as in g and h, for
DA-excited neurons. Shaded areas in g–j indicate SEM across neurons.

Figure 4. Subtraction and multiplication of activity in DA-inhibited and DA-excited neurons. a, Stimulus-evoked change in firing rate normalized to baseline activity in the fixation period,
computed as shown by schematic on the left, for DA-inhibited neurons under control and DA conditions. Shifts to larger values indicate that DA offsets activity (additive operation), i.e., the firing rate
difference is retained at lower baseline firing rates (subtraction). The animals’ perceptual threshold (on the rising slope of the psychometric function; Fig. 1c,d) corresponds to normalized stimulus
contrasts 1– 4. b, Conventions as in a for DA-excited neurons. Superimposed curves indicate that DA increases gain (multiplicative operation), i.e., the firing rate difference increases in proportion
to baseline firing rates. Error bars indicate SEM across neurons.
13730 • J. Neurosci., August 21, 2013 • 33(34):13724 –13734                                                               Jacob, Ott et al. • Prefrontal Dopamine Regulates Sensory Signals

neuron and used a linear classifier to ob-
jectively separate BS from NS cells. BS and
NS waveforms were distributed differ-
ently in the classes of DA-excited and
DA-inhibited neurons (Fisher’s exact test,
p ⬍ 0.05; Fig. 7a). All stimulus-encoding
DA-excited cells were BS neurons (puta-
tive pyramidal neurons, n ⫽ 10). In con-
trast, there were equal numbers of BS and
NS cells (putative interneurons) in the
class of stimulus-responsive DA-inhibited
neurons (n ⫽ 7 each). Thus, in the group
of DA-inhibited neurons, there were
more putative interneurons than to be ex-
pected by their frequency in neocortex
(20 –30%; Markram et al., 2004), and
there were significantly more putative py-
ramidal cells in the class of DA-excited
neurons. Interestingly, all stimulus en-
coding putative interneurons that were
responsive to DA were inhibited (n ⫽ 7).
The same pattern was found when all DA-
responsive neurons were analyzed (DA-
excited neurons: 22 BS, 3 NS; DA-
inhibited neurons: 17 BS, 15 NS; p ⬍
0.01). In accord with the strongly biased
distribution of putative interneurons to-
ward DA-inhibited cells, baseline firing
rates under control conditions were
higher in this group of neurons compared
with DA-excited cells, although the differ-
ence did not reach significance (8.3 ⫾ 1.4 Figure 5. Prefrontal DA enhances visual coding in excited neurons. a, Sliding window analysis of visual coding strength (auROC
vs 5.4 ⫾ 0.8 spikes/s for DA-inhibited and values for salient vs absent visual stimulation) for the example DA-inhibited neuron from Figure 3, a and b, in correct control and
DA-excited neurons, respectively; rank- DA trials. Data are aligned to the start of a trial (fixation period). The gray shaded area marks the stimulus presentation. b,
sum test, p ⫽ 0.13). In the instances in Population mean auROC time course of DA-inhibited neurons in correct control and DA trials. c, Population mean auROC values of
which multiple DA-modulated neurons DA-inhibited neurons for individual contrasts in correct control and DA trials. DA does not change coding strength in the population
were recorded at the same electrode (12 of of DA-inhibited neurons. d–f, Conventions as in a– c for the example DA-excited neuron from Figure 3, d and e (d) and the
                                                  population of DA-excited neurons (e, f ). DA strengthens visual coding in the class of DA-excited neurons. Error bars indicate SEM
45 electrodes), we more often recorded across neurons.
cells from the same class than from differ-
ent classes (eight vs four electrodes, respec-
                                                                                   ation from zero could suggest that absent stimulation was not
tively). These results support the notion that DA-mediated changes
                                                                                   encoded as a “default” condition (i.e., a continuation of baseline
in excitability were characteristic of distinct neuronal populations.
                                                                                   activity; to be expected for sensory-driven neurons) but instead
    We finally explored whether DA-inhibited and DA-excited
                                                                                   actively in a potentially more advanced processing step. In DA-
neurons might be involved at different stages of prefrontal sen-
                                                                                   inhibited neurons, there were no significant differences between
sory processing. Under control conditions, prefrontal neurons
                                                                                   baseline activity and activity after the omission of a stimulus in
that were inhibited by DA encoded visual signals significantly
                                                                                   either control or DA conditions (signed-rank test, p ⫽ 0.39 and
earlier than DA-excited neurons (mean stimulus response la-
                                                                                   p ⫽ 0.54, respectively; signed-rank test for difference between
tency, 165 ⫾ 18 and 261 ⫾ 27 ms for DA-inhibited and DA-
                                                                                   control and DA conditions, p ⫽ 0.95; Fig. 7d, left). However, in
excited neurons, respectively; rank-sum test, p ⬍ 0.05; Fig. 7b; see
                                                                                   DA-excited neurons, DA application disclosed a deflection from
also Figs. 3g,i, 5b,e). DA-inhibited neurons were driven more
                                                                                   baseline in trials without visual stimulation that was not evident
strongly by sensory input: under control conditions, visual cod-
                                                                                   under control conditions (signed-rank test, p ⫽ 0.19 and p ⬍
ing strength was higher in this population compared with DA-
                                                                                   0.01, for control and DA conditions, respectively; signed-rank
excited cells across all contrasts (multiple linear regression; factor
                                                                                   test for difference between control and DA conditions, p ⬍ 0.01;
neuron class, p ⬍ 0.001; Fig. 7c).
                                                                                   Fig. 7d, right). This result suggests that the absence of visual stim-
    Closer inspection of the population spike density histograms
                                                                                   ulation was represented differently in the two DA-responsive
of DA-excited neurons revealed that activity after omission of a
                                                                                   neuron classes.
stimulus was not a simple continuation of activity in the fixation
period when DA had been applied (Fig. 3, compare i, j). To ex-
amine whether DA-excited neurons represented not just physical                     Discussion
stimulus intensity but possibly a processing stage more remote                     We report here that DA regulates the representation of sensory
from sensory input, we compared baseline activity in the fixation                  information in the primate PFC. We found that prefrontal DA
period with firing rates in trials without stimulation, calculated in              affects two distinct neuronal populations involved in visual cod-
the same 300 ms analysis window as previously (Fig. 7d). A devi-                   ing. DA controlled neurons with short visual response latencies
Jacob, Ott et al. • Prefrontal Dopamine Regulates Sensory Signals J. Neurosci., August 21, 2013 • 33(34):13724 –13734 • 13731
PFC might constitute an important path-
way to fine-tune and facilitate down-
stream processing.
DA could also filter distracting, non-
preferred signals by modulating neu-
rotransmission at the dendritic arbor of
input layer neurons (“gating”) (Durst-
ewitz et al., 2000; Gao et al., 2003). Neu-
rons extracting behaviorally relevant
information from a multitude of compet-
ing signals would necessarily show tem-
porally precise modulation. Given their
rapid responsiveness to DA (Fig. 2f,g),
DA-inhibited neurons would be ideal re-
cipients of the phasic signals, e.g., predic-
tion errors, DA neurons relay to the PFC
(Redgrave et al., 2008). With a mean stim-
ulus response latency of 165 ms (Fig. 7b),
these cells closely follow the discharge of
midbrain DA neurons that typically oc-
curs between 100 and 150 ms (Dommett
et al., 2005; de Lafuente and Romo, 2012).
Therefore, DA-inhibited neurons are
maximally active at peak extracellular DA
concentrations (Schultz, 2007). Thus, DA
might reinforce or block signals reaching
Figure 6. Prefrontal DA reduces response variability in excited neurons. a, Mean spike count after stimulus presentation versus the PFC and segregate important from
spike count variance across trials for DA-inhibited neurons. Each data point represents one neuron and stimulus contrast. Straight distracting information (Servan-
lines indicate fits to data. b, FFs (spike count variance divided by mean) for all stimulus contrasts in DA-inhibited cells. No changes Schreiber et al., 1990; D’Ardenne et al.,
in response variability are observed after DA application. c, d, Conventions as in a and b for DA-excited neurons. The slope of the 2012). Interestingly, we found that all pu-
fitted line is significantly smaller in DA trials compared with control conditions. DA reduces response variability across all contrasts
tative interneurons were inhibited by DA
in DA-excited cells. Error bars indicate SEM across neurons.
(Fig. 7a). Interneurons are thought to play
an important role in the control of infor-
mation flow in cortex (Constantinidis et
by suppressing neuronal activity. In neurons with longer re- al., 2002) and would constitute an ideal target for rapid gating by
sponse latencies, DA acted as an excitatory modulator and DA.
strengthened the representation of visual inputs. At present, the cellular mechanisms by which DA could me-
diate fast inhibition are unclear (Seamans and Yang, 2004). In-
Modes of operation hibitory DA effects are generally reported on longer timescales as
Inhibition was implemented principally in the form of a subtrac- a result of technical constraints, such as bath application of do-
tive shift in response levels [additive operation (Silver, 2010); paminergic drugs. It is also conceivable that the applied DA binds
Figs. 3g,h, 4a], whereas excitation in the second population re- to non-dopaminergic receptors, such as adrenergic receptors, es-
sulted from an increase in gain [multiplicative operation (Silver, pecially at higher concentrations. Iontophoresis is nonquantita-
2010); Figs. 3i,j, 4b]. In the rodent visual cortex, subtraction is tive and generally does not provide reliable assessments of the
induced by dendrite-targeting interneurons, whereas soma- drug concentrations reaching individual neurons. Therefore, ad-
targeting interneurons regulate gain (Wilson et al., 2012). In vitro ditional experiments are required to resolve the issue of pharma-
experiments in the ferret PFC have demonstrated that these cological specificity as well as to determine whether the observed
classes of interneurons are modulated by DA (Gao et al., 2003). decrease in excitability is indeed the result of phasic, time-locked
Thus, DA would subtract activity by modulating dendrites and signaling or generated by longer-lasting mechanisms.
increase gain by controlling the soma (Yang and Seamans, 1996). In behaving nonhuman primates, neuronal inhibition has
Our results now suggest that subtraction and multiplication by been identified as an important mechanism by which DA affects
DA target not the same prefrontal neuron but instead early and prefrontal signal processing. DA suppresses neuronal activity in
late, possibly functionally specialized, processing stages, respectively spatially tuned prefrontal neurons engaged in memory-guided
(Fig. 7). saccade tasks and enhances tuning for the remembered saccade
target location (“sculpting inhibition”; Williams and Goldman-
DA-inhibited neurons Rakic, 1995; Vijayraghavan et al., 2007; Arnsten, 2011). Because
Control over sensory inputs by inhibition and subtraction of subtraction sharpens stimulus selectivity, i.e., tuning (Wilson et
response levels offers a major computational advantage, namely al., 2012), we propose that the spatially tuned cells described
response normalization (Carandini and Heeger, 2012). Inhibitory previously belong to the class of DA-inhibited neurons identified
conductances can adaptively rescale the input of a neuron to here. Although the ROC measures we used are well suited for
match its dynamic range (Mitchell and Silver, 2003) and there- analyzing binary yes–no, e.g., stimulus present–absent decisions
fore maximize information transmission (Brenner et al., 2000; (Green and Swets, 1966), we did not detect an increase in signal/
Fairhall et al., 2001). Our data indicate that DA afferents to the noise ratio as defined by the auROC in DA-inhibited neurons13732 • J. Neurosci., August 21, 2013 • 33(34):13724 –13734 Jacob, Ott et al. • Prefrontal Dopamine Regulates Sensory Signals
Figure 7. DA modulates distinct prefrontal processing stages. a, Normalized average waveforms of stimulus-encoding DA-inhibited and DA-excited neurons. All DA-excited cells were BS neurons,
and NS neurons were all inhibited by DA. b, Visual response latencies of DA-inhibited and DA-excited neurons under control conditions. DA-inhibited neurons encode visual signals significantly
earlier. c, Visual coding strength of DA-inhibited and DA-excited neurons under control conditions (auROC values comparing firing rates between trials with and without visual stimulation).
DA-inhibited neurons are driven more strongly by visual stimulation across all contrast levels. d, Normalized difference between baseline activity in the fixation period and activity after omission of
a stimulus. Firing rates were identical in DA-inhibited neurons in both control and DA trials. In DA-excited neurons, absence of visual stimulation induced a deflection from baseline when DA had been
applied. Error bars indicate SEM across neurons.
(Fig. 5a– c). Other response characteristics that are not ade- pression of activity could reflect, for example, an anticipatory
quately captured by signal detection theory, e.g., sharpening of response and contributed to the improved discriminability of
tuning curves, might nevertheless create advantages for cortical stimulus and background in these neurons. In any case, it sug-
processing. We also considered the possibility that inhibited neu- gests that DA-excited neurons were not truthful encoders of the
rons were the result of higher intrinsic DA tone and excited neu- physical properties of visual stimuli but might constitute an ad-
rons were subject to lower DA levels. However, this is unlikely ditional step in the goal-directed evaluation of sensory signals.
because the ratio of inhibition to excitation was independent of Although application of transmitters with micro-iontophoresis is
iontophoretic DA dosage, and we did not observe more inhibited very focal (Herz et al., 1969; Hupé et al., 1999), we cannot exclude
neurons at higher DA currents. More experiments tapping differ- that the slower response kinetics in DA-excited neurons were
ent behavioral demands are needed to determine whether the attributable to the fact that DA had to diffuse to a different cor-
benefits conveyed by DA-induced inhibition lie primarily in res- tical layer before indirectly taking effect on this class of cells.
caling and gating inputs to PFC or whether DA can also affect Another possibility is that DA-excited neurons are modulated
signal strength per se at this stage. not by phasic DA but by tonic transmitter release. Compared
with DA neuron bursting, little is known about the function of
DA-excited neurons tonic DA signaling (Floresco et al., 2003). It is thought to reflect
In DA-excited neurons, stimulus responses increased in propor- increased activity in populations of DA neurons and causes an
tion to baseline activity, indicating a multiplicative increase in elevation mainly of extrasynaptic transmitter. Tonic extracellular
gain (Servan-Schreiber et al., 1990; Thurley et al., 2008; Figs. 3i,j, DA levels do not reach the high levels found in the synaptic cleft
4b). Although the strength of sensory inputs was unchanged in and might modulate primarily high-affinity extrasynaptic DA re-
DA-inhibited neurons, DA selectively increased signal/noise ra- ceptors on presynaptic terminals (Grace et al., 2007). We pres-
tio in excited cells (Fig. 5d–f ). In addition, stimuli were encoded ently do not know the cellular receptors that are involved in
more reliably because trial-to-trial variability dropped (Fig. 6c,d). generating the effects reported here. Therefore, additional studies
All three effects closely resemble changes in visual signals ob- will have to address whether DA-excited neurons differ from
served in visual cortex when attention is allocated in a top-down DA-inhibited cells, for example, in their modulation by the two
manner (McAdams and Maunsell, 1999; Mitchell et al., 2007; DA receptor families found in PFC, the D1R and D2R, or other
Noudoost and Moore, 2011a). In other words, prefrontal DA catecholamine receptors (Seamans and Yang, 2004; Wang et al.,
may act as a pharmacological spotlight, directing “attention” to- 2004; Noudoost and Moore, 2011a). Differences in the cellular
ward relevant sensory inputs and enhancing their representation and molecular composition of prefrontal DA-sensitive neurons
at the level of DA-excited neurons (Brunel and Wang, 2001; Nou- could allow for targeted modulation of specific cortical signals by
doost and Moore, 2011b). Interestingly, DA-induced excitation DA (Noudoost and Moore, 2011b). For example, in the frontal
occurred on considerably longer timescales than inhibition (Fig. eye fields, behavioral effects of DA on attentional processing de-
2f,g). Therefore, it is unlikely that the amplification of stimulus pend on whether injections were made in supragranular or infra-
coding could be controlled on a trial-by-trial basis in these neu- granular layers that are characterized by distinct DA receptor
rons. DA-excited neurons might not serve the purpose of a flex- profiles (Noudoost and Moore, 2011a). We now find that DA-
ible, rapidly responsive gate for sensory signals but instead reflect sensitive neurons in more anterior lateral PFC are heterogeneous
a later processing stage more remote from early sensory inputs. In with regard to the sensory information they carry and how they
support of this idea, our analysis of extracellular waveforms did are modulated by DA. Adding to previous studies, our experi-
not reveal any putative interneurons in this group of cells but ments suggest that the timing and strength of DA neurotransmis-
exclusively putative pyramidal neurons (Fig. 7a). Also, DA- sion could have a strong influence on how this modulatory signal
excited neurons processed visual inputs almost 100 ms later than is received and processed in PFC.
DA-inhibited neurons (Fig. 7b). They were driven less strongly by
visual stimuli (Fig. 7c) and encoded absent stimulation actively Implications for mental diseases
by a deflection in baseline firing instead of passively as a default DA is strongly linked to neuropsychiatric diseases that involve the
condition like DA-inhibited neurons (Fig. 7d). This transient de- frontal lobes, such as attention-deficit hyperactivity disorder orJacob, Ott et al. • Prefrontal Dopamine Regulates Sensory Signals J. Neurosci., August 21, 2013 • 33(34):13724 –13734 • 13733
schizophrenia (Arnsten, 2011). By strengthening sensory inputs, neuron classes in abstract numerical categorization. J Neurosci 28:
prefrontal DA could be a critical factor in resolving ambiguous 7737–7747. CrossRef Medline
Dommett E, Coizet V, Blaha CD, Martindale J, Lefebvre V, Walton N, May-
sensory events or maintaining the focus of attention. It is tempt-
hew JE, Overton PG, Redgrave P (2005) How visual stimuli activate
ing to speculate that the observed DA effects could help safeguard dopaminergic neurons at short latency. Science 307:1476 –1479. CrossRef
the healthy mind, e.g., from hallucinations and intrusions of Medline
thought that are characteristic of these mental diseases (Winterer Durstewitz D, Seamans JK (2008) The dual-state theory of prefrontal cortex
and Weinberger, 2004; Rolls et al., 2008; Fletcher and Frith, dopamine function with relevance to catechol-o-methyltransferase geno-
2009). For example, it is frequently hypothesized that the symp- types and schizophrenia. Biol Psychiatry 64:739 –749. CrossRef Medline
tom relief conveyed by antipsychotic drugs targeting the DA sys- Durstewitz D, Seamans JK, Sejnowski TJ (2000) Dopamine-mediated stabi-
lization of delay-period activity in a network model of prefrontal cortex.
tem, in particular the D2R, results from the fact that they decrease
J Neurophysiol 83:1733–1750. Medline
noise in prefrontal circuits (Winterer and Weinberger, 2004; Eiselt AK, Nieder A (2013) Representation of abstract quantitative rules ap-
Rolls et al., 2008). Our experiments now provide evidence on a plied to spatial and numerical magnitudes in primate prefrontal cortex.
cellular level that DA indeed controls neuronal variability in the J Neurosci 33:7526 –7534. CrossRef Medline
primate brain. Fairhall AL, Lewen GD, Bialek W, de Ruyter Van Steveninck RR (2001)
In conclusion, we have demonstrated that DA neuromodula- Efficiency and ambiguity in an adaptive neural code. Nature 412:787–792.
tion in PFC is not uniform but tailored to functionally specialized CrossRef Medline
Fletcher PC, Frith CD (2009) Perceiving is believing: a Bayesian approach to
neurons in the prefrontal processing stream (Arnsten et al.,
explaining the positive symptoms of schizophrenia. Nat Rev Neurosci
2012). By controlling sensory inputs to the PFC, DA could be a 10:48 –58. CrossRef Medline
powerful determinant of how the primate brain uses these signals Floresco SB, West AR, Ash B, Moore H, Grace AA (2003) Afferent modula-
to generate intelligent behavior in interactions with its sensory tion of dopamine neuron firing differentially regulates tonic and phasic
environment. dopamine transmission. Nat Neurosci 6:968 –973. CrossRef Medline
Floresco SB, Magyar O, Ghods-Sharifi S, Vexelman C, Tse MT (2006) Mul-
tiple dopamine receptor subtypes in the medial prefrontal cortex of the rat
References regulate set-shifting. Neuropsychopharmacology 31:297–309. CrossRef
Arnsten AF (2011) Catecholamine influences on dorsolateral prefrontal Medline
cortical networks. Biol Psychiatry 69:e89 – e99. CrossRef Medline
Fuster JM (2008) The prefrontal cortex, Ed 4. London: Academic.
Arnsten AF, Wang MJ, Paspalas CD (2012) Neuromodulation of thought:
Gao WJ, Wang Y, Goldman-Rakic PS (2003) Dopamine modulation of
flexibilities and vulnerabilities in prefrontal cortical network synapses.
perisomatic and peridendritic inhibition in prefrontal cortex. J Neurosci
Neuron 76:223–239. CrossRef Medline
23:1622–1630. Medline
Björklund A, Dunnett SB (2007) Dopamine neuron systems in the brain: an
Grace AA, Floresco SB, Goto Y, Lodge DJ (2007) Regulation of firing of
update. Trends Neurosci 30:194 –202. CrossRef Medline
dopaminergic neurons and control of goal-directed behaviors. Trends
Bongard S, Nieder A (2010) Basic mathematical rules are encoded by pri-
Neurosci 30:220 –227. CrossRef Medline
mate prefrontal cortex neurons. Proc Natl Acad Sci U S A 107:2277–2282.
Green DM, Swets JA (1966) Signal detection theory and psychophysics.
CrossRef Medline
New York: Wiley.
Brenner N, Bialek W, de Ruyter van Steveninck R (2000) Adaptive rescaling
Henze DA, Borhegyi Z, Csicsvari J, Mamiya A, Harris KD, Buzsáki G (2000)
maximizes information transmission. Neuron 26:695–702. CrossRef
Intracellular features predicted by extracellular recordings in the hip-
Medline
pocampus in vivo. J Neurophysiol 84:390 – 400. Medline
Brozoski TJ, Brown RM, Rosvold HE, Goldman PS (1979) Cognitive deficit
caused by regional depletion of dopamine in prefrontal cortex of rhesus Herrero JL, Roberts MJ, Delicato LS, Gieselmann MA, Dayan P, Thiele A
monkey. Science 205:929 –932. CrossRef Medline (2008) Acetylcholine contributes through muscarinic receptors to atten-
Brunel N, Wang XJ (2001) Effects of neuromodulation in a cortical network tional modulation in V1. Nature 454:1110 –1114. CrossRef Medline
model of object working memory dominated by recurrent inhibition. Herz A, Zieglgänsberger W, Färber G (1969) Microelectrophoretic studies
J Comput Neurosci 11:63– 85. CrossRef Medline concerning the spread of glutamic acid and GABA in brain tissue. Exp
Carandini M, Heeger DJ (2012) Normalization as a canonical neural com- Brain Res 9:221–235. Medline
putation. Nat Rev Neurosci 13:51– 62. CrossRef Medline Hupé JM, Chouvet G, Bullier J (1999) Spatial and temporal parameters of
Churchland MM, Yu BM, Cunningham JP, Sugrue LP, Cohen MR, Corrado cortical inactivation by GABA. J Neurosci Methods 86:129 –143. CrossRef
GS, Newsome WT, Clark AM, Hosseini P, Scott BB, Bradley DC, Smith Medline
MA, Kohn A, Movshon JA, Armstrong KM, Moore T, Chang SW, Snyder Hussar CR, Pasternak T (2009) Flexibility of sensory representations in pre-
LH, Lisberger SG, Priebe NJ, et al. (2010) Stimulus onset quenches neu- frontal cortex depends on cell type. Neuron 64:730 –743. CrossRef
ral variability: a widespread cortical phenomenon. Nat Neurosci 13:369 – Medline
378. CrossRef Medline Marder E (2012) Neuromodulation of neuronal circuits: back to the future.
Constantinidis C, Williams GV, Goldman-Rakic PS (2002) A role for inhi- Neuron 76:1–11. CrossRef Medline
bition in shaping the temporal flow of information in prefrontal cortex. Markram H, Toledo-Rodriguez M, Wang Y, Gupta A, Silberberg G, Wu C
Nat Neurosci 5:175–180. CrossRef Medline (2004) Interneurons of the neocortical inhibitory system. Nat Rev Neu-
D’Ardenne K, Eshel N, Luka J, Lenartowicz A, Nystrom LE, Cohen JD (2012) rosci 5:793– 807. CrossRef Medline
Role of prefrontal cortex and the midbrain dopamine system in working Matsumoto M, Hikosaka O (2009) Two types of dopamine neuron dis-
memory updating. Proc Natl Acad Sci U S A 109:19900 –19909. CrossRef tinctly convey positive and negative motivational signals. Nature 459:
Medline 837– 841. CrossRef Medline
de Lafuente V, Romo R (2005) Neuronal correlates of subjective sensory McAdams CJ, Maunsell JH (1999) Effects of attention on the reliability of
experience. Nat Neurosci 8:1698 –1703. CrossRef Medline individual neurons in monkey visual cortex. Neuron 23:765–773.
de Lafuente V, Romo R (2006) Neural correlate of subjective sensory expe- CrossRef Medline
rience gradually builds up across cortical areas. Proc Natl Acad Sci U S A Merten K, Nieder A (2012) Active encoding of decisions about stimulus
103:14266 –14271. CrossRef Medline absence in primate prefrontal cortex neurons. Proc Natl Acad Sci U S A
de Lafuente V, Romo R (2011) Dopamine neurons code subjective sensory 109:6289 – 6294. CrossRef Medline
experience and uncertainty of perceptual decisions. Proc Natl Acad Sci Merten K, Nieder A (2013) Comparison of abstract decision encoding in the
U S A 108:19767–19771. CrossRef Medline monkey prefrontal cortex, the presupplementary and cingulate motor
de Lafuente V, Romo R (2012) Dopaminergic activity coincides with stim- areas. J Neurophysiol 110:19 –32. CrossRef Medline
ulus detection by the frontal lobe. Neuroscience 218:181–184. CrossRef Mitchell JF, Sundberg KA, Reynolds JH (2007) Differential attention-
Medline dependent response modulation across cell classes in macaque visual area
Diester I, Nieder A (2008) Complementary contributions of prefrontal V4. Neuron 55:131–141. CrossRef MedlineYou can also read