Morphological characterization of HVC projection neurons in the zebra finch (Taeniopygia guttata)
←
→
Page content transcription
If your browser does not render page correctly, please read the page content below
Received: 20 December 2017      |   Revised: 17 February 2018   |    Accepted: 26 February 2018

DOI: 10.1002/cne.24437

RESEARCH ARTICLE

Morphological characterization of HVC projection neurons in
the zebra finch (Taeniopygia guttata)

Sam E. Benezra1,2 | Rajeevan T. Narayanan3,4 | Robert Egger1,2,4 |
Marcel Oberlaender3,4 | Michael A. Long1,2

1
  NYU Neuroscience Institute and
Department of Otolaryngology, New York
                                                    Abstract
University Langone Medical Center, New              Singing behavior in the adult male zebra finch is dependent upon the activity of a cortical region
York City, New York                                 known as HVC (proper name). The vast majority of HVC projection neurons send primary axons to
2
 Center for Neural Science, New York                either the downstream premotor nucleus RA (robust nucleus of the arcopallium, or primary motor
University, New York City, New York
                                                    cortex) or Area X (basal ganglia), which play important roles in song production or song learning,
3
 Max Planck Group: In Silico Brain Sciences,
                                                    respectively. In addition to these long-range outputs, HVC neurons also send local axon collaterals
Center of Advanced European Studies and
Research, Bonn, Germany                             throughout that nucleus. Despite their implications for a range of circuit models, these local proc-
4
 Computational Neuroanatomy Group, Max              esses have never been completely reconstructed. Here, we use in vivo single-neuron Neurobiotin
Planck Institute for Biological Cybernetics,        fills to examine 40 projection neurons across 31 birds with somatic positions distributed across
 €bingen, Germany
Tu
                                                    HVC. We show that HVC(RA) and HVC(X) neurons have categorically distinct dendritic fields. Addi-

Correspondence                                      tionally, these cell classes send axon collaterals that are either restricted to a small portion of HVC
Michael A. Long, NYU Neuroscience                   (“local neurons”) or broadly distributed throughout the entire nucleus (“broadcast neurons”). Over-
Institute and Department of                         all, these processes within HVC offer a structural basis for significant local processing underlying
Otolaryngology, New York University
                                                    behaviorally relevant population activity.
Langone Health, 435 E. 30th St., SB 1206,
New York, NY 10016-6402.
Email: mlong@med.nyu.edu                            KEYWORDS
                                                    axon collaterals, premotor, sequence generation, songbird, vocal production
Funding information
NIH, Grant/Award Number: R01NS075044;
European Research Council, Grant/Award
Number: 633428

1 | INTRODUCTION                                                                        Nordeen, 1990), but the role of these neurons in the production and
                                                                                        maintenance of adult song is less well understood (Scharff et al., 2000).
The HVC nucleus of the zebra finch telencephalon is a crucial link in                   During singing, both HVC projection neuron types exhibit sparse bursts
the song production pathway, sending descending projections from the                    that form sequences of activity at the network level, with different
forebrain to the brainstem and ultimately driving muscles important for                 neurons precisely active at different moments throughout the song
vocal production (Bottjer, Glaessner, & Arnold, 1985; Goller & Cooper,                  (Hahnloser, Kozhevnikov, & Fee, 2002; Hamaguchi, Tschida, Yoon,
2004; Nottebohm, Kelley, & Paton, 1982; Nottebohm, Stokes, & Leon-                      Donald, & Mooney, 2014; Kozhevnikov & Fee, 2007; Long, Jin, & Fee,
ard, 1976; Wild, 1993). Within that region, the premotor cell popula-                   2010; Lynch, Okubo, Hanuschkin, Hahnloser, & Fee, 2016; Picardo
tion that projects to the downstream motor cortical region RA (robust                   et al., 2016; Vallentin & Long, 2015). The importance of local process-
nucleus of the arcopallium) are referred to as HVC(RA) neurons. Addi-                   ing within HVC for the generation of these neural sequences remains
tionally, another group of cells (HVC(X) neurons) project to the avian                  controversial, in part because the structure of circuits within HVC are
basal ganglia (Dutar, Vu, & Perkel, 1998; Kubota & Taniguchi, 1998;                     only partially understood (Kornfeld et al., 2017; Kosche, Vallentin, &
Mooney, 2000). HVC(X) neurons are thought to be critical for song                       Long, 2015; Mooney & Prather, 2005; Stauffer et al., 2012).
acquisition during development (Scharff, Kirn, Grossman, Macklis, &                          A major gap in our knowledge of HVC function stems from an
Nottebohm, 2000; Scharff & Nottebohm, 1991; Sohrabji, Nordeen, &                        incomplete picture of the local wiring within that nucleus, especially
                                                                                        with respect to the axon collaterals of excitatory projection neurons.
Sam E. Benezra and Rajeevan T. Narayanan contributed equally to this study.             These local processes have been shown to form interconnections

J Comp Neurol. 2018;526:1673–1689.                                  wileyonlinelibrary.com/journal/cne                       V
                                                                                                                             C 2018 Wiley Periodicals, Inc.   |   1673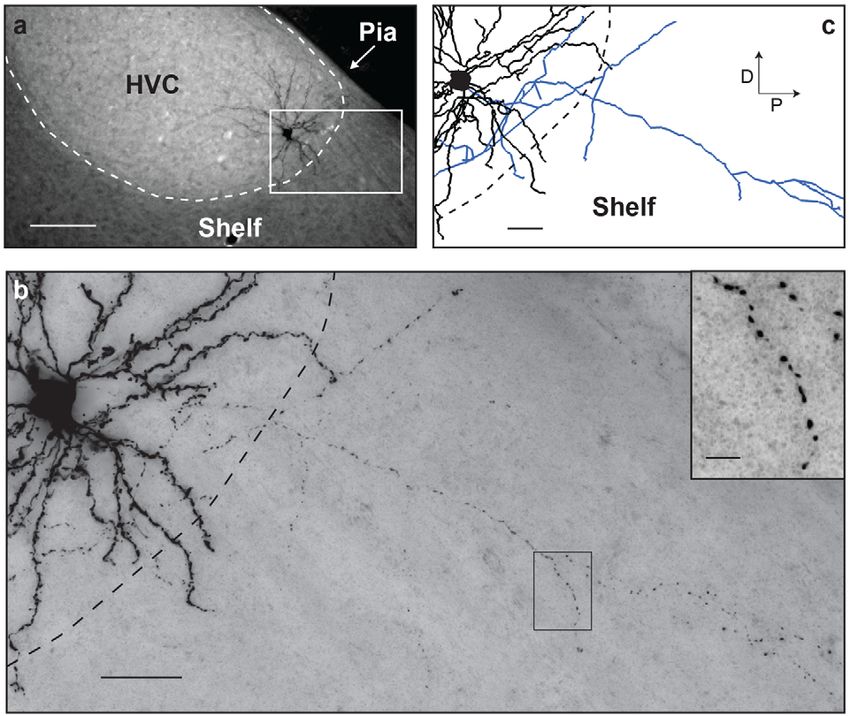
1674   |                                                                                                                                 BENEZRA    ET AL.

within HVC (Kornfeld et al., 2017; Kosche et al., 2015; Mooney &               (MOM, Sutter Instrument Company, Novato, CA), and a small pipette
Prather, 2005) and have been strongly implicated in the generation of          access hole was drilled in the cover glass adjacent to this region. In
sequences of neural activity (Galvis, Wu, Hyson, Johnson, & Bertram,           each animal, one to two cells were targeted under two-photon guid-
2017; Gibb, Gentner, & Abarbanel, 2009; Hanuschkin, Diesmann, &                ance and loaded with 3% Neurobiotin (Vector Labs, Burlingame, CA) in
Morrison, 2011; Jin, 2009; Long et al., 2010). Although the basic mor-         150 mM K-Gluconate using a glass electrode (4–6 MX) in a juxtacellu-
phological characteristics of HVC neurons have been investigated               lar configuration by applying 250 ms current pulses (2–15 nA; 2 Hz) for
through bulk labeling (Benton, Cardin, & DeVoogd, 1998; Fortune &              10 min (Kornfeld et al., 2017; Narayanan et al., 2014; Pinault, 1996).
Margoliash, 1995; Nixdorf, Davis, & DeVoogd, 1989; Vates, Broome,              Pipettes were visualized by adding 40 mM of Alexa 488 (Invitrogen) to
Mello, & Nottebohm, 1996; Yip, Miller-Sims, & Bottjer, 2012) or par-           the internal solution. The activity of HVC(RA) and HVC(X) neurons was
tially reconstructed single-cell fills (Dutar et al., 1998; Katz & Gurney,     monitored during the fill process using a Multiclamp 700B amplifier
1981; Mooney, 2000), surprisingly little is known about their anatomy          (Molecular Devices). Successful Neurobiotin loading was often accom-
because these reconstructions were incomplete. To better understand            panied by transfer of the Alexa fluorophore into the cell body, provid-
the impact of single neurons within the circuit, we generated the first        ing visual confirmation. Following single-cell dye injection, the pipette
complete reconstructions of HVC projection neuron morphology                   was slowly withdrawn from the cell and removed from the brain. Kwik-
through in vivo single-cell labeling and cell tracing within the entire vol-   Cast (World Precision Instruments, Sarasota, FL) was then applied over
ume of HVC. From these reconstructions, we characterize dendritic              the exposed tissue and the animal was removed from anesthesia.
morphology of individual neurons as well as a wide range of projection
patterns of axon collaterals that extend throughout the volume of that
                                                                               2.4 | Histological procedures
structure. Both HVC(RA) and HVC(X) neurons have significant local axo-
nal projections, whose projection patterns form a basis for local pro-         After 1–3 hr following the completion of juxtacellular filling, birds were
cessing within this sequence-generating cortical circuit.                      anesthetized with pentobarbital sodium and perfused transcardially
                                                                               with 4% w/v paraformaldehyde (EMS, Hatfield, PA). Brains were
2 | MATERIALS AND METHODS                                                      removed from the skull using a surgical scoop, immersed in 4% parafor-
                                                                               maldehyde for 3–5 days to achieve thorough fixation, and incubated in
2.1 | Animals                                                                  phosphate buffer for an additional 1–3 days to decrease endogenous
                                                                               peroxidase activity. To prepare sections, the brain was cut along the
We used adult (>90 days post hatch) male zebra finches that were
                                                                               midline, mounted on the sagittal surface with cyanoacrylate, and stabi-
obtained from an outside breeder and maintained in a temperature- and
                                                                               lized with 3% agarose. Parasagittal sections (100 mm thickness) of HVC
humidity-controlled environment with a 12/12 hr light/dark schedule. All
                                                                               were cut using a vibratome (Leica VT1000S). Slices were washed five
animal maintenance and experimental procedures were performed
                                                                               times with phosphate buffer and treated with 3% H2O2 to further
according to the guidelines established by the Institutional Animal Care
                                                                               reduce endogenous peroxidase activity. Slices were then immersed
and Use Committee at the New York University Langone Medical
                                                                               overnight at 48C in a solution containing avidin/biotin complexes and
Center.
                                                                               0.5% Triton X-100 in phosphate buffer (Vector Labs and Sigma-Aldrich,
                                                                               St. Louis, MO respectively) to tag the Neurobiotin with peroxidase
2.2 | Surgery
                                                                               complex. On the following day, slices were washed five times with
To conduct two-photon guided cell labeling, we employed a previously           phosphate buffer and then immersed in a solution containing 2.3 mM
described in vivo microscopy preparation (Kornfeld et al., 2017). Briefly,     diaminobenzidine (DAB, Sigma-Aldrich) and 0.01% H2O2 in phosphate
animals were anesthetized with 1–3% isoflurane in oxygen, and a retro-         buffer to label processes containing Neurobiotin. Slices were then
grade dextran tracer conjugated to tetramethylrhodamine (fluoro-Ruby,          washed and mounted on slides with Vectashield (Vector Labs) or
MW: 10,000; Invitrogen, Carlsbad, CA) was injected into either RA or           Mowiol (Sigma-Aldrich) mounting medium.
Area X. To gain optical access to HVC, a craniotomy (1 mm 3 1 mm)
was prepared using stereotaxic coordinates, the dura was removed,              2.5 | Post-histological imaging and reconstruction
and a cover glass (#0 thickness, Warner Instruments, Hamden, CT) was
                                                                               A full description of our imaging and reconstruction procedures was
implanted over the exposed brain with dental acrylic (Cooralite Dental
                                                                               published previously (Kornfeld et al., 2017). Only well-filled HVC(RA)
MFG, Diamond Springs, CA). A small metal head plate with two tapped
                                                                               neurons were selected for reconstruction, specifically those in which
holes was implanted at the anterior part of the skull using dental acrylic
                                                                               the soma, dendrite, and axon were all labeled without interruptions and
to enable head fixation during two-photon imaging.
                                                                               with clearly labeled dendritic spines and presynaptic boutons. The cells
                                                                               that passed these criteria were imaged using light microscopy with a
2.3 | Two-photon guided cell labeling
                                                                               custom-designed high-resolution mosaic/optical-sectioning brightfield
All cell fills were conducted while the animal was anesthetized (1-3%          microscope system (Oberlaender, Bruno, Sakmann, & Broser, 2007;
isoflurane in oxygen). On the day of the experiment, a region of dense         Oberlaender et al., 2009). Neuronal branches in each histological sec-
retrograde labeling in HVC was defined using two-photon microscopy             tion were reconstructed in 3D using NeuroMorph (Oberlaender et al.,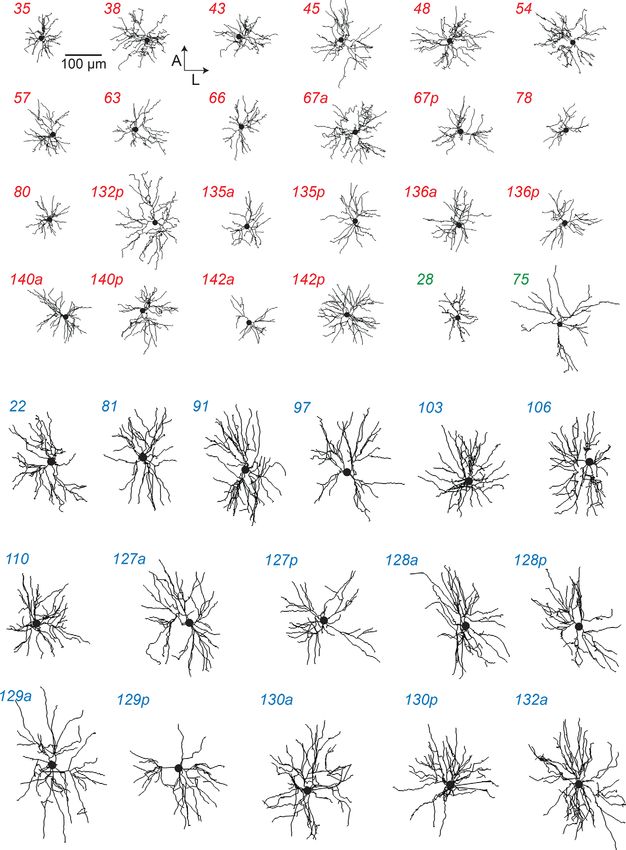
BENEZRA   ET AL.                                                                                                                                |     1675

2007). Reconstructions were performed without prior knowledge                 principal axis and the sagittal plane, as defined by the brain sections,
about the projection target (apart from the descending axon), and             and rotated all aligned neuron morphologies accordingly (i.e., by 28.58).
branches were designated as belonging to axons or dendrites based on          For visualization purposes, we computed an average HVC boundary
the presence of boutons or spines, respectively. Automated tracing            surface. We sampled all aligned HVC boundary surfaces every 50 mm
results from each histological section were manually proof-edited using       along the average extent of the first principal axis, and in 108 steps,
FilamentEditor (Dercksen, Hege, & Oberlaender, 2014), a custom-               computed the average location of these samples, and generated a
designed program based on Amira visualization software (FEI-Visualiza-        closed boundary surface by 3D Delaunay triangulation.
tion Sciences Group). The NeuroMorph and FilamentEditor tools ena-
ble tracings that are independent of the experience of the human              2.7 | Quantification of spatial parameters of dendrites
operator, with an interobserver variability of 20 mm per 1 mm axonal         and axons
length (Dercksen et al., 2014).
                                                                              For the following analyses, all axonal processes outside the boundaries
                                                                              of HVC were excluded. Total dendritic and axonal lengths were meas-
2.6 | Visualization and analysis of reconstructions
                                                                              ured using the FilamentEditor in Amira. “Primary branches” (Table 1)
Light micrographs were captured using the microscope described in the         refer to the number of dendritic branches that emanate directly from
previous section or a Zeiss AxioObserver Inverted SK-2. All visual ren-       the cell body. Branch nodes are bifurcation points along the dendrite or
derings of reconstructed dendrites and axons were generated in Amira.         axon and were quantified using the FilamentEditor in Amira. One-
Polar plots were generated by computing the total axonal length in 208        dimensional spatial extent of dendrites and axons was quantified in
angular bins centered on the soma of each neuron reconstruction.              Amira, first by aligning the soma to the origin, then computing length in
    To generate an average HVC reference frame, we first manually             10 or 50 mm voxels for dendrites and axons, respectively, and plotting
traced HVC contours of all animals used in this study using microscope        the distribution along the three principal axes. The radial dendritic
images (AX70, 103 objective UPlanFl) of the fluorescence of retro-            extent was defined as the length of all dendrite segments in 1-mm thick
gradely labeled HVC projection neurons in all sagittal sections contain-      concentric shells centered on the soma. HVC innervation proportion
ing HVC. Contours were aligned across sections by spacing them 100            was computed for each cell by first replacing the line segments describ-
mm apart along the mediolateral axis and aligning by translations and         ing its axonal arbor by 100 mm radius tubes (i.e., reflecting the minimal
rotations in the sagittal plane using traced neuron morphology, blood         average radius of potential postsynaptic projection neurons) (Table 1),
vessels, and the brain surface as references. The aligned HVC contours        yielding a closed surface (tube surface). The volume of the tube surface
were then used to compute a closed surface by 3D Delaunay triangula-          within the boundaries of HVC was measured and was divided by the
tion and defined as the HVC boundary surface. Next, we computed the           total volume of HVC in that animal. This yielded a number between 0
center of mass and the three principal axes of the HVC boundary sur-          and 1 (HVC innervation proportion), which roughly reflects the fraction
face of each animal and aligned the boundary surfaces of all animals          of HVC projection neurons whose dendritic fields are intersected by
using these coordinates and orientations. The extent of the HVC               the axon. Differences in morphological properties between HVC(RA)
boundary surface along the three principal axes was defined as follows:       and HVC(X) neurons were assessed using the Wilcoxon rank-sum test.
for the first and second principal axes (i.e., the long axis, corresponding
approximately to the mediolateral axis, and the medium axis, corre-
                                                                              2.8 | Clustering of neurons based on dendritic and
sponding approximately to the anterior–posterior axis), the boundary
                                                                              axonal projection patterns
surface was intersected with a plane centered on the center of mass
and the plane normal defined by the direction of the third principal axis     To determine whether HVC projection neurons form morphologically
(i.e., the shortest axis, corresponding approximately to the dorsal–ven-      defined clusters, we extracted parameters describing the 3D projection
tral axis). The maximum extent of the resulting intersection contour          patterns of their dendrites and axons within HVC. For clustering of
was then computed along the first and second principal axis, respec-          dendrites, we used four parameters: the 90% dendritic extent along
tively. For the third principal axis, the boundary surface was intersected    the mediolateral and anterior–posterior axes within HVC, the 90%
with a plane defined by the center of mass and the first principal axis.      radial dendritic extent, and the total dendritic length. For clustering of
Finally, each neuron morphology was translated and rotated according          axons, we used four parameters: the 90% axonal extent along the
to the center of mass and principal axes of the corresponding HVC             mediolateral and anterior–posterior axes within HVC, the HVC innerva-
boundary surface in the same animal, and variability in the extent of         tion proportion, and the total axonal length beyond 200 mm distance
HVC along the three axes was minimized by scaling the neuron mor-             from the soma. Computing the 90% extent as opposed to the full
phology linearly along each dimension according to the difference of          extent made this analysis less sensitive to sparse outlier processes.
the individual HVC boundary surface and the average extent along                  Clustering of all neurons using dendrite and axon parameters
each axis. Finally, we transformed all aligned neuron morphologies to a       occurred separately. We used the OPTICS algorithm (Ankerst, Breunig,
coordinate system aligned with the anterior–posterior and mediolateral        Kriegel, & Sander, 1999; Oberlaender et al., 2012) to sort all neurons
axes of the bird brain (Guest, Seetharama, Wendel, Strick, & Ober-            based on their mutual proximity in 4D feature space. This allowed iden-
laender, 2017). We measured the average angle between the first               tifying groups of neurons forming regions of high density in feature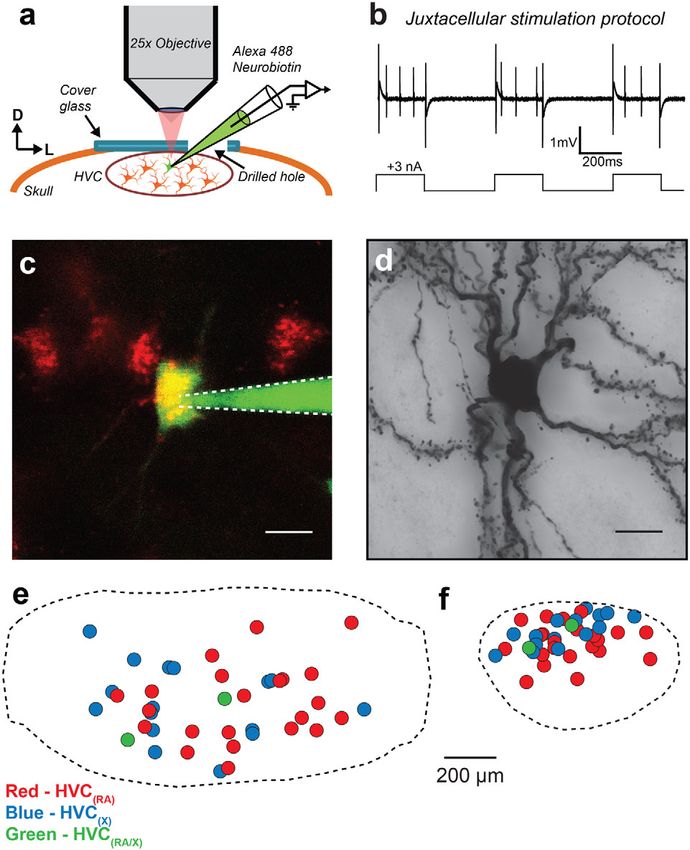
1676    |                                                                                                                         BENEZRA    ET AL.

T AB LE 1   Features of HVC projection neuron dendrites. Statistical differences were assessed using the Wilcoxon rank-sum test

                     Proj.     90% M-L        90% A-P         90% D-V        90% radial     Path length    Primary      Branch       Dendrite
 ID                  target    extent (lm)    extent (lm)     extent (lm)    extent (lm)    (mm)           branches     nodes        cluster

 35                  RA        60             90              90             68             2.78           5            35           Small

 38                  RA        120            100             110            88             4.27           7            53           Small

 43                  RA        110            70              110            82             3.15           5            55           Small

 45                  RA        140            130             110            102            4.00           6            44           Small

 48                  RA        130            100             90             85             4.53           7            52           Small

 54                  RA        120            120             120            98             4.84           5            58           Small

 57                  RA        80             100             90             80             2.88           4            39           Small

 63                  RA        110            90              130            98             2.72           3            37           Small

 66                  RA        80             110             120            84             2.72           6            30           Small

 67a                 RA        110            110             70             84             4.64           5            70           Small

 67p                 RA        110            80              70             78             2.68           6            32           Small

 78                  RA        80             70              100            70             1.56           8            20           Small

 80                  RA        60             70              100            68             2.31           5            37           Small

 132p                RA        120            180             110            122            4.86           4            40           Large

 135a                RA        70             100             100            77             2.32           4            29           Small

 135p                RA        80             120             110            87             2.45           4            38           Small

 136a                RA        90             120             100            89             3.15           6            42           Small

 136p                RA        110            100             50             72             2.18           5            38           Small

 140a                RA        100            100             110            88             3.07           6            40           Small

 140p                RA        100            110             120            92             4.30           3            53           Small

 142a                RA        90             80              60             66             1.35           4            20           Small

 142p                RA        110            100             70             81             4.27           8            69           Small

 AVG 6 SD                      99 6 22        102 6 24        97 6 21        85 6 13        3.23 6 1.06    5.3 6 1.4    42 6 13

 22                  X         160            190             160            134            4.99           4            47           Large

 81                  X         110            190             180            137            5.61           12           23           Large

 91                  X         120            220             120            130            7.09           5            64           Large

 97                  X         150            240             160            152            4.95           6            47           Large

 103                 X         130            190             180            129            7.12           10           67           Large

 106                 X         140            210             110            131            6.04           7            56           Large

 110                 X         140            150             160            123            5.59           6            49           Large

 127a                X         160            210             170            144            6.34           4            52           Large

 127p                X         160            160             150            135            4.36           7            30           Large

 128a                X         140            220             150            140            5.80           5            60           Large

 128p                X         160            200             130            133            4.52           4            60           Large

 129a                X         160            260             140            153            5.54           6            49           Large

 129p                X         180            210             100            131            3.86           4            37           Large

 130a                X         170            220             160            150            7.23           11           59           Large

 130p                X         170            180             160            130            7.88           4            83           Large

 132a                X         190            220             150            147            8.15           10           87           Large
                                                                                                                                    (Continues)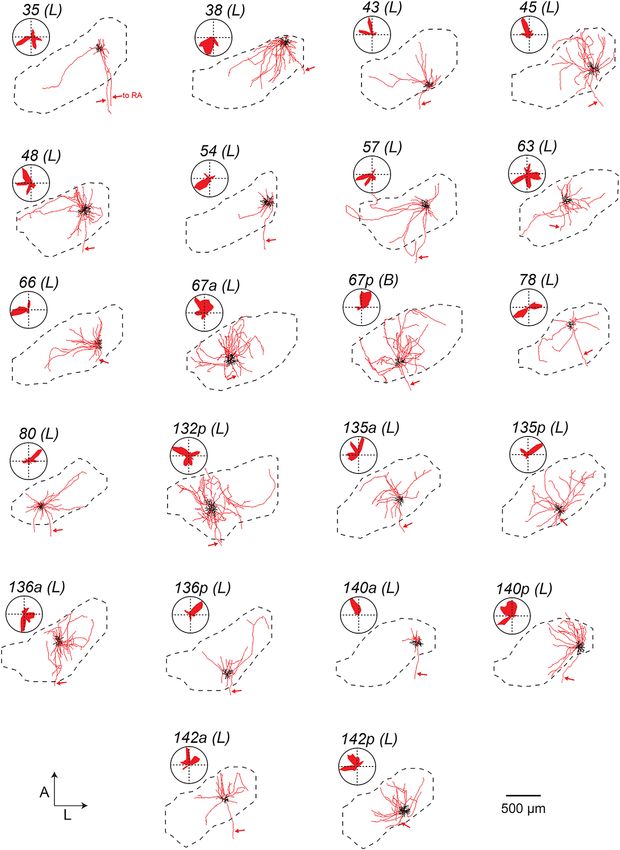
BENEZRA ET AL. | 1677
T AB LE 1 (Continued)
Proj. 90% M-L 90% A-P 90% D-V 90% radial Path length Primary Branch Dendrite
ID target extent (lm) extent (lm) extent (lm) extent (lm) (mm) branches nodes cluster
AVG 6 SD 153 6 21 204 6 28 149 6 23 137 6 9 5.94 6 1.27 6.6 6 2.7 54 6 17
RA vs. X 1.7 3 1026 2.7 3 1027 4.9 3 1026 2.1 3 1027 2.4 3 1026 0.25 0.03
p-value
28 RA/X 60 100 90 71 2.01 4 25 Small
75 RA/X 170 150 180 142 2.83 7 28 Large
Small AVG 6 SD 96 6 23 99 6 17 96 6 21 82 6 10 3.10 6 1.03 5.3 6 1.4 42 6 14
Large AVG 6 SD 152 6 22 200 6 30 148 6 25 137 6 9 5.71 6 1.42 6.4 6 2.6 52 6 17
27 28 26 28 26
Small vs. Large 7.0 3 10 6.7 3 10 3.1 3 10 7.8 3 10 2.4 3 10 0.27 0.06
p-value
space, which we identified as putative clusters. Neurons with low- in these neurons, enabling their identification. A single axon branch
mutual proximity to neurons in these putative clusters were labeled as leading from HVC to RA often exited the posterior boundary of HVC
“ambiguous.” We decided to assign these “ambiguous” neurons to one (Figure 2a,e), while an axon branch from an HVC(X) neuron (Figure 2b,f)
of the two putative clusters based on their distance to the center of took a more variable path, exiting from the anterior, medial, or ventral
the two clusters, while accounting for potentially different variability
within each cluster (Narayanan et al., 2015; Rojas-Piloni et al., 2017).
Specifically, we defined the distance of neuron i to cluster k as:
rffiffiffiffiffiffiffiffiffiffiffiffiffiffiffiffiffiffiffiffiffiffiffiffiffiffiffiffiffiffiffiffiffiffiffiffiffiffiffiffiffiffiffiffiffiffi
T
di;k 5 ~ fi 2l~ C21 ~
k k k fi 2l~
Here, ~
fi is the 4D feature vector of neuron i, l~k is the mean feature
vector of cluster k, and Ck21 is the inverse of the covariance matrix of
cluster k. Hence, because we identified two putative clusters for each
parameter set using the OPTICS algorithm, two distance values (i.e.,
one for each cluster) were computed for each “ambiguous” neuron. We
then assigned each “ambiguous” neuron to the cluster with the smallest
distance without requiring a predetermined cutoff distance.
3 | RESULTS
To characterize the properties of local processes of HVC projection
neurons, we conducted single-cell Neurobiotin fills (Narayanan et al.,
2014; Pinault, 1996) in vivo under two-photon guidance (Figure 1a–c;
see Materials and Methods). In a total of 81 birds, we attempted to fill
59 HVC(RA) neurons and 34 HVC(X) neurons. Following histological
processing and imaging (Figure 1d), we selected only the neurons
whose dendrites and axons were completely and darkly labeled, a data
set acquired from 31 birds and including 22 HVC(RA) neurons, 16
HVC(X) neurons, and 2 neurons projecting to both regions (Kittelberger, FIGURE 1 Two-photon guided single-cell filling. (a) In vivo imaging
2002). In this data set, we include 13 HVC(RA) neurons and 2 HVC(RA/X) preparation for targeted cell fills. HVC(RA) or HVC(X) neurons are
targeted under visual guidance through a cover glass implanted
neurons that were previously analyzed as part of a separate anatomical
over HVC. (b) In a juxtacellular configuration, positive current
study (Kornfeld et al., 2017). As a population, the somata of the tar- pulses are used to fill neurons with Neurobiotin, often eliciting
geted cells spanned most of the mediolateral and rostrocaudal extent spikes. (c) Example image of a cell being filled with Alexa 488 and
of HVC (Figure 1e). In contrast, their dorsal–ventral distribution was Neurobiotin in vivo. (d) Brightfield micrograph of the filled neuron
in (c) after histological processing. Scale bars: 10 lm. (e) Relative
biased toward superficial neurons, due to limitations on imaging depth
locations of 40 reconstructed somata mapped onto an average HVC
in our tissue (Figure 1f). For each neuron, we fully reconstructed all
reference frame such that the long axis of HVC is defined along the
local processes including dendrites and axon collaterals (Figure 2). horizontal. (f) An orthogonal view perpendicular to the long axis of
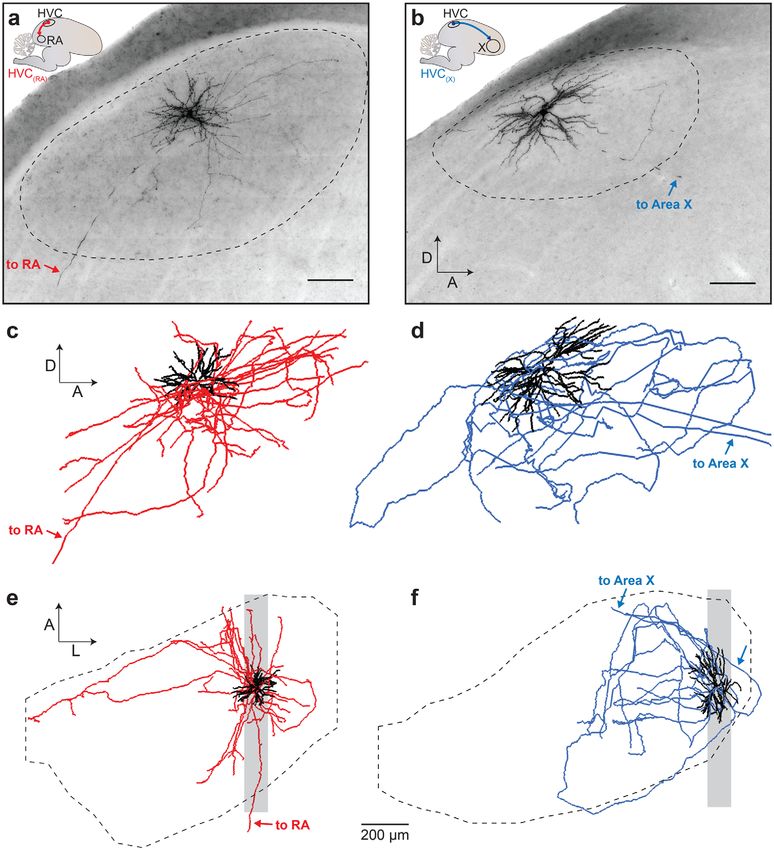
Long-range projections leading to RA and/or Area X were clearly visible HVC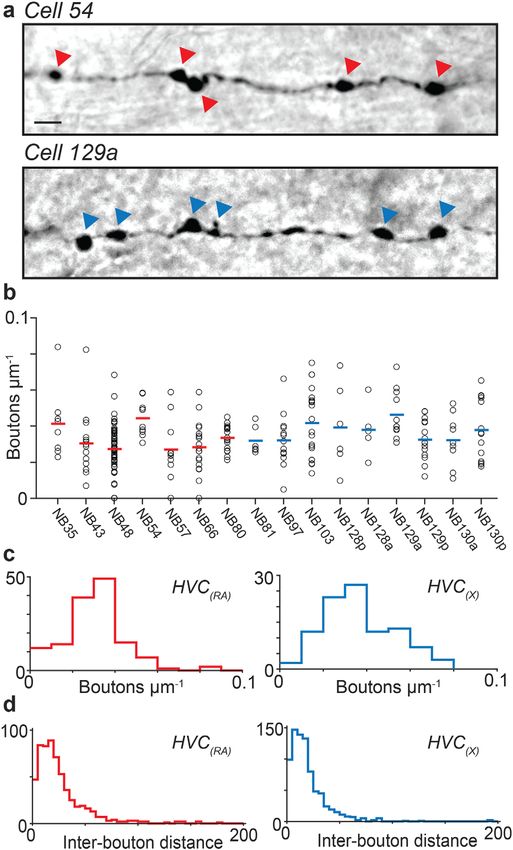
1678   |                                                                                                                             BENEZRA   ET AL.

FIGURE 2     Anatomical reconstruction of HVC projection neurons. (a, b) Micrographs show a projection of 100 lm sagittal sections of a
DAB-stained HVC(RA) neuron (a) and HVC(X) neuron (b). Scale bars: 100 lm. (c, d) Complete reconstructions of the above neurons shown in
the sagittal plane. Scale of reconstructions is matched with micrographs in (a, b). (e, f) Same cells as in (c) and (d), shown in the horizontal
plane. Shaded region marks the area shown in the micrographs (a, b). Dendrites are represented with black lines, and axons are either red
(HVC(RA)) or blue (HVC(X)). Dotted lines mark HVC boundaries in (a, b, e, f). Arrows indicate descending axons

boundary (Fortune & Margoliash, 1995). Additionally, three cells in our    order to better understand the spatial extent of synaptic inputs that
data set (one HVC(RA) and two HVC(X) neurons) sent two descending          could arrive onto each cell type. Dendrites were similar in shape within
axon branches originating from the same hillock to the downstream          a cell type, with dendritic arbors consistently more compact in HVC(RA)
nucleus.                                                                   neurons than in HVC(X) neurons (Figure 3). We went on to quantify
                                                                           and compare the morphological properties of HVC(RA) and HVC(X) den-
                                                                           drites in several ways. First, to measure the span of dendrites, we
3.1 | HVC(RA) and HVC(X) neurons have distinct
                                                                           quantified and plotted the 1D spatial extent of each arbor along the
dendritic morphologies
                                                                           mediolateral, rostrocaudal, and dorsoventral axes (Table 1 and Figure
Our approach enables us to visualize and reconstruct all neuronal proc-    4a,b). We found that averaging across the population, HVC(X) dendrites
esses of individual cells throughout the entire volume of HVC, thus        have a 1.5-fold greater span than HVC(RA) dendrites in the mediolateral
avoiding any possible bias associated with analyzing partial reconstruc-   and dorsoventral axes, and a 2-fold greater span in the rostrocaudal
tions (Dutar et al., 1998; Fortune & Margoliash, 1995; Mooney, 2000).      axis. Across the population, HVC(RA) dendrites have a similar span in all
Our first step was to examine the dendrites of projection neurons in       three axes, lending to a spherical shape, while HVC(X) dendrites are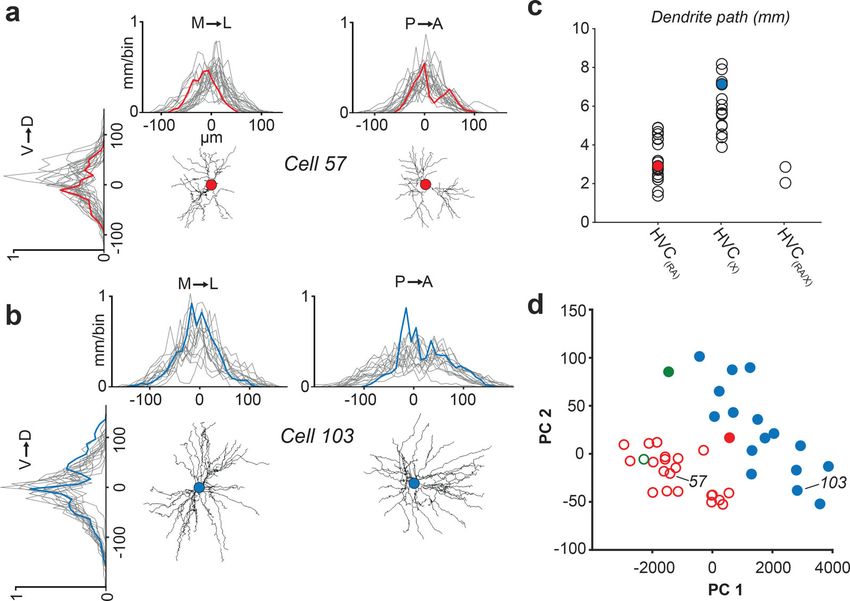
BENEZRA   ET AL.                                                                                                                            |   1679

FIGURE 3   Dendrites of HVC projection neurons. Each panel shows the dendrite of an HVC(RA) (red), HVC(RA/X) (green) or HVC(X) (blue)
neuron projected on the horizontal plane. All HVC(RA) neurons are designated as “small” with the exception of 132p, and all HVC(X) neurons
were designated as “large” (see Figure 4 and Materials and Methods). One HVC(RA/X) neuron each fell into the “small” and “large” categories

slightly more elongated in the rostrocaudal axis (Table 1, Figure 4). We   used a density-based cluster algorithm (Ankerst et al., 1999) to deter-
also measured total dendritic length of each cell and found that HVC(X)    mine whether cells could be assigned to discrete groups (Oberlaender
dendrites on average have almost a 2-fold greater length than HVC(RA)      et al., 2012). Our analysis yielded two morphological categories, which
dendrites (Table 1, Figure 4c). Averaging across the population, HVC(X)    appeared as distinct clusters in a principal component analysis (Figure
dendrites gave rise to an average of one more primary branches than        4d). One cluster consisted primarily of neurons with large dendritic
HVC(RA) dendrites. The complexity of the dendritic arbor, as measured      fields, as measured by their radial extent, the extent across the three
by the correlation between total path length and number of branch          principal axes of HVC, and total path length (Table 1), and we hence
nodes, was similar across all neurons (r 5 .78, p < 1026).                 referred to neurons in this cluster as “large.” The “large” cluster con-
    Our next step was to determine whether we could morphologically        tained all HVC(X) neurons (see also Figure 3). HVC(RA) neurons—with
classify dendrites based on their spatial properties. We defined four      one exception—were part of the remaining cluster, which we termed
parameters (total dendritic length, 90% extent along the mediolateral      “small,” due to their compact dendritic span (Figure 3 and Table 1). In
and anterior–posterior axis, and 90% radial extent, Figure 4a–c) and       addition, one HVC(RA/X) neuron was assigned to each cluster.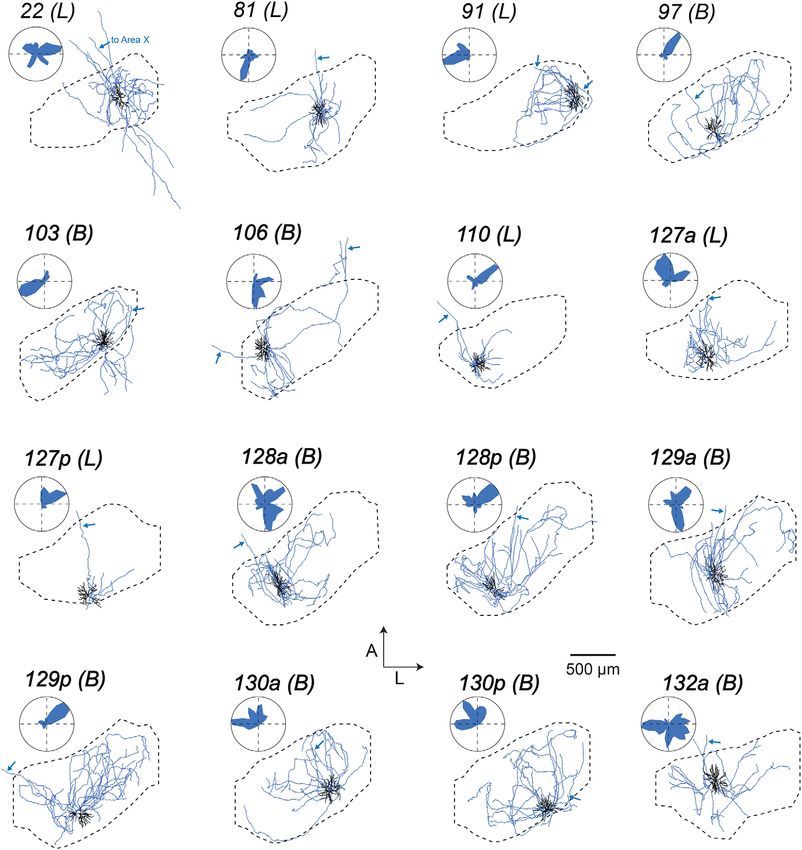
1680   |                                                                                                                                BENEZRA    ET AL.

FIGURE 4     Spatial properties of HVC(RA) and HVC(X) dendrites. (a, b) One dimensional profile of dendritic length along three axes for
HVC(RA) (a) and HVC(X) (b) neurons. Red and blue traces are from example neurons, grey traces are from all remaining individual neurons
from each group in our data set. The center of each plot (0 mm) denotes soma location. (c) Total dendritic path length organized by
projection target. Filled circles represent examples from (a) and (b). (d) The first two principal components of four spatial parameters of
dendrites. The two clusters as designated using the OPTICS algorithm (see Materials and Methods) are represented by closed circles and
open circles; red—HVC(RA); blue—HVC(X); green—HVC(RA/X)

3.2 | Bouton morphology of local projections in HVC                        HVC(RA) and HVC(X) neurons. In nearly all cells, collaterals were com-
                                                                           pletely confined within the borders of HVC, even in cases where the
After examining the dendritic structure of HVC projection neurons, we
                                                                           soma was close to the edge of the nucleus (e.g., Figure 6, Cell 38). In
shifted our focus to potential presynaptic partners by examining local
                                                                           two HVC(X) neurons, however, collateral branches extended outside of
axonal boutons. Our first step was to assess the distribution of boutons
                                                                           HVC and terminated 500 mm rostral and caudal to the boundary of the
along these wires, which correlate with the presence of presynaptic ter-
                                                                           nucleus, into HVC shelf (Kelley & Nottebohm, 1979). Cell 22 sent
minals (Kornfeld et al., 2017). Local collaterals of both HVC(RA) and
                                                                           7.2 mm of collaterals into rostral and caudal shelf, and Cell 103 sent
HVC(X) neurons were lined with prominent swellings, which were readily
                                                                           4.5 mm of collaterals into caudal shelf (Figures 7 and 9). A general feature
visible along DAB-stained collaterals (Figure 5a). We manually counted
                                                                           of both projection types is that their local collaterals appeared to fill the
boutons along collateral branches of 7 HVC(RA) and 9 HVC(X) neurons and
                                                                           dorsoventral extent of the nucleus. In the horizontal plane, however, an
computed the bouton density of each branch (number of boutons/length
                                                                           axon forming several collaterals emanated from the soma at distinctive
of axon; Figure 5b). Across all branches, HVC(RA) and HVC(X) neurons had
                                                                           orientations along the mediolateral and rostrocaudal axes (Figures 6–8).
similar bouton densities (HVC(RA): 32 6 2 boutons/mm; HVC(X): 36 6 2
                                                                           Across the population, we did not observe a clear bias toward a particular
boutons/mm, mean 6 SEM; Figure 5c), suggesting that they form connec-
                                                                           orientation relative to the soma. As with the dendrites, we observed
tions with other neurons in HVC at similar frequencies. We previously
                                                                           almost a 2-fold greater total axon length of HVC(X) neurons compared
reported that the density of boutons did not vary with soma distance in
                                                                           with HVC(RA) neurons, and the span of HVC(X) collaterals was larger along
HVC(RA) neurons (Kornfeld et al., 2017) and found the same to be true
                                                                           all measured dimensions (M-L, D-V, A-P) (Table 2).
for HVC(X) neurons (Pearson’s correlation r 5 –.20; p 5 .11). However,
                                                                               Our next step was to determine if, like the dendrites, axon collater-
boutons from both projection types appeared to sometimes be clustered
                                                                           als of HVC projection neurons could be organized into distinct morpho-
(Figure 5a), which was further evident from nonuniform spatial distribu-
                                                                           logical categories. We again focused specifically on parameters that
tions of boutons within an axon (Figure 5d).
                                                                           describe the spatial properties of these projections and their innerva-
                                                                           tion of HVC. For each cell, we quantified and plotted the 1D spatial
3.3 | Two categories of local axonal innervation
                                                                           extent of the axon along the three principal axes (Table 2 and Figure
Once we confirmed that boutons are prevalent along collaterals, we         10a,b). We chose to exclude dorsoventral extent from our sorting analy-
moved on to examine and compare the structure of collaterals of            sis, as this parameter was relatively consistent from cell to cell (Table 2).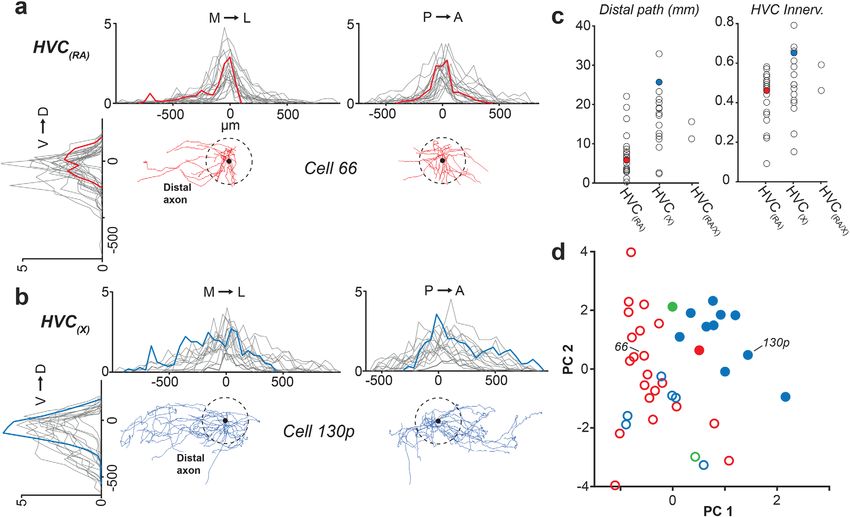
BENEZRA   ET AL.                                                                                                                                 |   1681

                                                                               HVC innervation ratio, p 5 .01). In contrast to the dendrites, we found
                                                                               that “local” and “broadcast” neurons were not as strictly associated with
                                                                               projection type: the “local” group consisted of 21 HVC(RA), 6 HVC(X), and
                                                                               1 HVC(RA/X), whereas the “broadcast” group consisted of 1 HVC(RA), 10
                                                                               HVC(X), and 1 HVC(RA/X) (Figures 6–8). Therefore, 6 out of 16 HVC(X)
                                                                               neurons have similar axon morphologies to HVC(RA) neurons in terms of
                                                                               their spatial distribution within HVC, whereas 10 HVC(X) neurons exhibit
                                                                               distinctly broader projections that innervate a larger volume of HVC. To
                                                                               visualize and compare how “local” and “broadcast” neurons innervate
                                                                               HVC, we mapped the axons of three example neurons in each category
                                                                               onto an average geometrical reference frame (see Materials and Meth-
                                                                               ods; Figure 11a,b). “Broadcast” axons occupy a relatively large volume
                                                                               and span most of the mediolateral and rostrocaudal extent of HVC,
                                                                               whereas the “local” axons are more spatially confined and occupy a
                                                                               smaller volume in the nucleus (Figure 11c,d, Table 2).

                                                                               4 | DISCUSSION

                                                                               We used in vivo two-photon guided single cell labeling to acquire a
                                                                               data set of 40 HVC projection neurons to examine the projection pat-
                                                                               terns of their dendrites and local axon collaterals in three dimensions.
                                                                               This data set contains the first complete reconstructions of local proc-
                                                                               esses across the entire volume of HVC. By characterizing these mor-
                                                                               phological properties in detail, we have gained insight into the impact
                                                                               of individual neurons on the circuits involved in the acquisition and
                                                                               production of a well-characterized complex sensorimotor behavior.

FIGURE 5      Bouton density of HVC(RA) and HVC(X) collaterals. (a)            4.1 | Two-photon targeted cell labeling
Example micrographs of HVC(RA) (top) and HVC(X) (bottom) axon
                                                                               Our approach of using in vivo microscopy to assist cell targeting/filling
collaterals. Scale bar: 5 mm. Arrowheads mark the location of
boutons. (b) Bouton densities from 170 branches in 7 HVC(RA)                   enabled several experimental advantages. First, we were able to choose
neurons and 95 branches in 9 HVC(X) neurons. Mean density for                  the cells we targeted based on their projection type by injecting a fluo-
each cell is shown as red and blue horizontal line, respectively. (c,          rescent retrograde tracer in either RA or Area X. Furthermore, by
d) Histograms showing bouton densities for all branches (c) as well            observing the field of retrogradely labeled neurons, we were able to
as inter-bouton distance (d) for each cell type from (b)
                                                                               target cells in specific regions of HVC, which made it easier to generate
                                                                               a data set that spanned the mediolateral and rostrocaudal extent of the

We quantified distal axonal length (>200 lm Euclidean distance from            nucleus. Second, the visualized approach helped to direct the tip of the
soma), previously shown to preferentially target other projection neurons      electrode during the process of cell filling, which was especially useful
(Kornfeld et al., 2017) as a measure of broad axonal innervation, and          when targeting HVC(RA) neurons, which have relatively small somata
used this as our third parameter (Figure 10c, left). Finally, for our fourth   (7–10 mm diameter). Third, we were able to monitor the flow of inter-
parameter, we computed an HVC innervation proportion for each cell             nal solution from the pipette tip throughout the experiment, ensuring
(see Materials and Methods), which reflects the upper bound proportion         that it was not clogged before attempting to inject Neurobiotin. One
of neurons in HVC whose dendritic fields overlap with the axonal field         limitation to this approach is that our fills are biased toward neurons in
(Figure 10c, right). The cluster algorithm yielded two clusters distin-        the dorsal half of HVC, as dextran-labeled neurons were only visible up
guished by the span of their axonal fields, leading to morphological cate-     to 400 mm ventral from the surface, and the ventral-most boundary
gories that we refer to as “local” and “broadcast” neurons (Figure 10d and     of HVC extends 550 mm ventral. It is possible that neurons closer to
Table 2). “Broadcast” neurons had a higher extent along all principal axes     the ventral boundary send collaterals dorsally, mirroring what we
than “local” neurons (M-L: 1.6-fold higher; A-P: 1.5-fold higher; D-V: 1.3-    observe from cells in our data set, however, we cannot rule out the
fold higher; p < .005 in all cases), 1.9-fold more path length within HVC      possibility that the collaterals of ventral neurons exhibit different pro-
(p 5 1.0 3 1024), and innervated a larger fraction of HVC (1.4-fold higher     jection patterns altogether.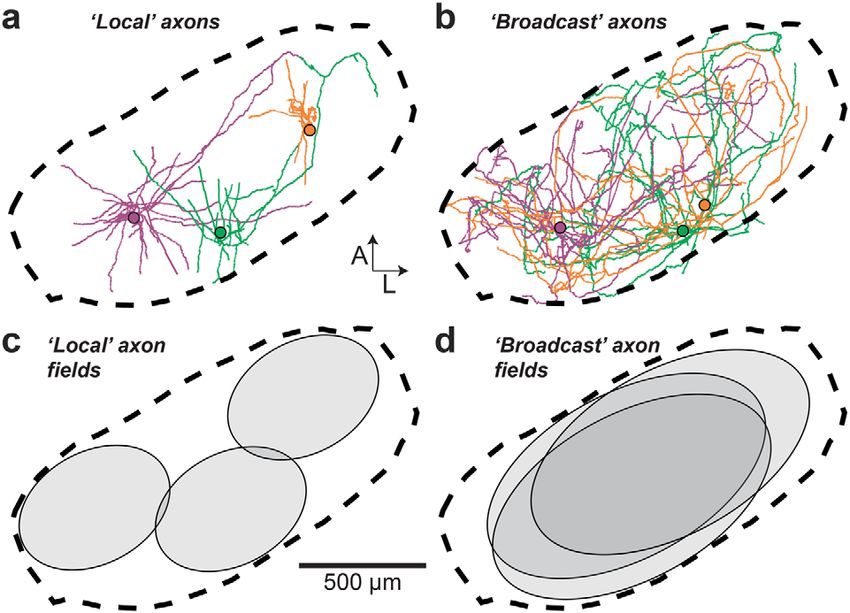
1682   |                                                                                                                          BENEZRA   ET AL.

FIGURE 6    Local processes of HVC(RA) neurons. Each panel shows the dendrite (black) and local axons (red) of all HVC(RA) neurons
projected on the horizontal plane and its position within HVC with accompanying polar plots quantifying axonal distribution. Arrows mark
descending axons to RA. “Local” (L) and “broadcast” (B) designations given in parentheses (see Figure 11 and Materials and Methods)

4.2 | HVC(RA) neurons: Functional implications for                       2016; Picardo et al., 2016). Several models have been proposed to
sequence generation                                                      explain how HVC(RA) premotor sequences are generated during singing.
                                                                         In one class of models, precisely timed bursts are the direct result of
The primary function of HVC(RA) neurons is to provide premotor com-      connectivity between HVC(RA) neurons, which have been proposed to
mands to the song production pathway (Nottebohm et al., 1976). Dur-      form a feed-forward network (Long et al., 2010). An alternative model
ing singing, the majority of HVC(RA) neurons are sparsely active at      suggests that sequential activity may be generated by a distributed net-
moments that are highly stereotyped across song renditions (Hahnloser    work involving structures outside HVC, where precisely timed bursts
et al., 2002). Different HVC(RA) neurons are often active at different   during song are driven by thalamic afferents onto HVC(RA) neurons
time points, forming a sparse sequence that spans the entirety of the    rather than local connections within the nucleus (Hamaguchi, Tanaka,
song (Hahnloser et al., 2002; Kozhevnikov & Fee, 2007; Lynch et al.,     & Mooney, 2016).
BENEZRA ET AL. | 1683
FIGURE 7 Local processes of HVC(X) neurons. Each panel shows the dendrite (black) and local axons (blue) of all HVC(X) neurons projected
on the horizontal plane and its position within HVC with accompanying polar plots quantifying axonal distribution. Arrows mark descending
axon to Area X. “Local” (L) and “broadcast” (B) designations given in parentheses (see Figure 11 and Materials and Methods)
Our current findings provide an anatomical basis for local excita- (Armstrong & Abarbanel, 2016; Gibb et al., 2009). In a previous study,
tory connectivity that may play an important functional role within using an electron microscopic approach capable of revealing the iden-
HVC. We show that nearly all 22 HVC(RA) cells have elaborate axon col- tity of postsynaptic partners of HVC(RA) neurons, we found that 17% of
laterals that exclusively innervate HVC and likely make many connec-
tions, as supported by the prevalence of putative presynaptic terminals.
We were able to estimate the total boutons per HVC(RA) cell by multi-
plying the axonal length and bouton density. We find that, on average,
an HVC(RA) neuron forms 401 6 52 boutons. Given that there are
40,000 HVC(RA) neurons (Walton, Pariser, & Nottebohm, 2012;
Wang, Hurley, Pytte, & Kirn, 2002), we estimate that the entire popula-
tion of HVC(RA) neurons forms 16 million local boutons, suggesting a
significant impact on network activity in HVC during song production.
To better understand the role of intrinsic HVC circuitry, we must
first establish the postsynaptic partners of the HVC(RA) neurons, which FIGURE 8 Local processes of HVC(RA/X) neurons. Each panel
cannot be determined through the light microscopic approach used in shows the dendrite (black) and local axons (green) of both HVC(RA/
X) neurons projected on the horizontal plane and its position within
this study. Paired recordings in vitro have found sparse evidence for
HVC with accompanying polar plots quantifying axonal distribution.
HVC(RA)-HVC(RA) connections (Kosche et al., 2015; Mooney & Prather,
Arrows mark descending axons to RA and Area X. “Local” (L) and
2005), motivating a number of alternative models in which disynaptic “broadcast” (B) designations given in parentheses (see Figure 11
inhibition within HVC is sufficient to generate song-related sequences and Materials and Methods)1684 | BENEZRA ET AL.
premotor neurons across the extent of HVC. As a result, the differen-
ces observed following perturbation may result from other factors,
such as the specific downstream targets of these neurons within RA,
for instance. Additionally, functional observations (Stauffer et al., 2012)
as well as perturbation studies (Poole, Markowitz, & Gardner, 2012;
Stauffer et al., 2012) have suggested an anterior–posterior bias in the
wiring of HVC. In our data set, axonal collaterals sometimes send signif-
icant projections in the mediolateral direction (e.g., Figure 6), indicating
the existence of long-range connectivity across the long axis of HVC.
Future studies using more precise methods to monitor and perturb
these long-range axonal collaterals may hold the key to understanding
their role.
4.3 | HVC(X) neurons: Local processing of basal-ganglia
projecting neurons within HVC
FIGURE 9 HVC(X) dendrites and collaterals can extend into HVC HVC(X) neurons project to the avian basal ganglia and are primarily
shelf. (a) Fluorescent micrograph of a sagittal section of Cell 103. involved in delivering an efference copy of motor activity to the
Scale bar: 100 mm. (b) Brightfield micrograph of the area indicated anterior forebrain pathway. Although HVC(X) neurons are essential
with a white rectangle in (a). Inset shows a high magnification for song learning (Scharff & Nottebohm, 1991; Sohrabji et al., 1990),
image from the boxed region. Scale bars: 25 mm and 5 mm (inset).
their role in adult song production is less clear (Scharff et al., 2000).
(c) Reconstructed dendrite (black) and axon collaterals (blue) from
the boxed region in (a). Scale bar: 25 mm Our study suggests four potentially new roles for the HVC(X) net-
work. First, the possibility exists that HVC(X) neurons may have an
synapses made by HVC(RA) axons form connections onto other HVC(RA) impact on vocal production in adult zebra finches, given the fact that
neurons (Kornfeld et al., 2017) and that the total density of these con- HVC(X) neurons have such an extensive network of axon collaterals
nections is 75 synapses/mm (Kornfeld et al., 2017). With this data in HVC. Considering the average total axon collateral length and
set, we update our previous estimate (Kornfeld et al., 2017) for the bouton density of HVC(X) neurons, we estimate that on average, an
average axonal length of HVC(RA) collaterals (13.31 6 1.44 mm mean 6 HVC(X) neuron forms 755 6 91 boutons. There are 10,000 HVC(X)
SEM) by including data from an additional nine neurons. We now esti- neurons in the nucleus (Walton et al., 2012), so the population of
mate that each individual HVC(RA) neuron forms 170 6 18 synapses HVC(X) neurons may form 7.5 million boutons in HVC. Given that
onto other HVC(RA) neurons, which suggests that the synaptic connec- HVC(X) neurons display activity patterns similar to HVC(RA) neurons
tions exist to allow for the possibility that this feed-forward circuit during song production (Hahnloser et al., 2002; Long et al., 2010;
architecture could enable the generation of song-related sequences Vallentin & Long, 2015) and may form many connections with
within HVC. The total number of synaptic partners remains elusive, HVC(RA) neurons, despite a paucity of such interconnections having
because little is known about the relative number of connections made been observed in earlier studies (Mooney & Prather, 2005), future
between a given pair of HVC(RA) neurons (Kornfeld et al., 2017). work is needed to determine whether HVC(X) neurons play a role in
Additionally, in our previous study, we observed that HVC(RA)- the premotor patterns leading to the generation of singing behavior.
HVC(RA) connections often occurred in the portions of the axons that Second, we find that HVC(X) neurons can exist either as “local” or
were distant from the soma. This regional specialization, coupled with “broadcast” neurons. Future functional measurements of these neu-
the relatively compact nature of HVC(RA) axonal field, places specific rons during singing combined with anatomical reconstructions could
spatial bounds on the location of HVC(RA) postsynaptic partners—proxi- potentially shed light on the roles of different morphological classes
mal axons are not likely to form robust HVC(RA)-HVC(RA) synapses and in song production. Third, we found a subpopulation of HVC(X) neu-
axons often do not reach across the entire span of the nucleus. Fur- rons that innervate a region adjacent to HVC, known as HVC shelf
thermore, we find that collaterals of both HVC(RA) and HVC(X) neurons (Kelley & Nottebohm, 1979). HVC shelf is an auditory region that
are heterogeneously biased in orientation with respect to their soma, receives input from field L (Fortune & Margoliash, 1995; C. V. Mello,
suggesting that excitatory signals during singing propagate without a Vates, Okuhata, & Nottebohm, 1998; Vates et al., 1996), which is the
bias toward a particular axis in HVC. primary forebrain relay for pathways originating in the auditory thal-
Our results are also relevant in light of previous data suggesting amus (Bonke, Bonke, & Scheich, 1979; Fortune & Margoliash, 1992;
that HVC is composed of multiple processing centers with distinct Karten, 1968). Therefore, the HVC(X)-to-shelf synapse could be
behavioral roles. In these studies, microlesions to specific subregions of transmitting motor-related signals to the auditory system, similar to a
HVC led to selective deficits in song structure (Basista et al., 2014; Gal- recently characterized population of HVC neurons projecting to Ava-
vis et al., 2017). Despite these compelling findings, we were unable to lanche (Roberts et al., 2017). Fourth, two HVC neurons send long-
see differences between the anatomical properties of individual range projections to both X and RA. Such dual projectors have beenBENEZRA ET AL. | 1685
T AB LE 2 Features of HVC projection neuron axons
Proj. 90% M-L 90% A-P 90% D-V Path length Path length beyond Branch nodes HVC Axon
ID target extent (lm) extent (lm) extent (lm) (mm) 200 lm (mm) beyond 25 lm innervation cluster
35 RA 800 250 350 6.77 2.74 24 0.23 L
38 RA 650 450 350 20.00 11.94 62 0.51 L
43 RA 600 450 150 7.35 2.99 22 0.22 L
45 RA 650 550 350 15.56 9.21 42 0.51 L
48 RA 600 500 200 16.66 7.81 73 0.57 L
54 RA 350 200 250 5.89 1.06 18 0.22 L
57 RA 850 500 300 10.83 5.72 27 0.49 L
63 RA 750 450 300 9.88 4.93 30 0.46 L
66 RA 700 350 300 12.42 5.73 38 0.46 L
67a RA 750 500 400 24.36 19.17 44 0.47 L
67p RA 900 700 350 22.24 16.28 37 0.50 B
78 RA 1000 350 300 5.97 3.21 13 0.40 L
80 RA 700 400 400 9.75 3.38 30 0.58 L
132p RA 650 700 400 29.17 21.99 57 0.54 L
135a RA 650 350 550 10.47 6.37 25 0.35 L
135p RA 850 500 350 13.40 8.57 31 0.54 L
136a RA 550 500 250 13.79 6.75 41 0.48 L
136p RA 800 450 400 6.58 2.77 24 0.31 L
140a RA 150 200 100 3.31 0.17 32 0.09 L
140p RA 500 450 350 13.39 7.42 47 0.34 L
142a RA 650 350 250 7.19 3.75 25 0.44 L
142p RA 600 350 200 10.68 5.81 29 0.53 L
AVG 6 SD 668 6 184 432 6 131 311 6 99 12.53 6 6.61 7.17 6 5.66 35 6 15 0.42 6 0.13
22 X 550 550 450 21.06 17.14 53 0.54 L
81 X 650 650 300 16.09 9.02 34 0.40 L
91 X 650 600 350 16.30 11.80 21 0.49 L
97 X 1150 600 400 22.35 18.89 39 0.66 B
103 X 1050 500 400 21.24 17.64 31 0.79 B
106 X 850 750 500 16.10 12.53 29 0.37 B
110 X 400 450 300 6.64 2.55 18 0.24 L
127a X 650 550 250 15.39 11.09 38 0.41 L
127p X 400 250 150 4.59 2.26 7 0.15 L
128a X 950 650 400 27.06 21.23 51 0.49 B
128p X 1200 600 450 30.37 23.20 48 0.58 B
129a X 1100 800 450 26.69 20.39 47 0.47 B
129p X 1150 550 450 38.88 32.81 58 0.68 B
130a X 1050 700 350 22.80 19.03 32 0.61 B
130p X 1100 700 350 32.07 25.60 52 0.65 B
132a X 1000 650 350 17.90 14.64 27 0.44 B
(Continues)1686 | BENEZRA ET AL.
T AB LE 2 (Continued)
Proj. 90% M-L 90% A-P 90% D-V Path length Path length beyond Branch nodes HVC Axon
ID target extent (lm) extent (lm) extent (lm) (mm) 200 lm (mm) beyond 25 lm innervation cluster
AVG 6 SD 869 6 277 597 6 130 369 6 89 20.97 6 8.91 16.24 6 8.03 37 6 14 0.50 6 0.17
RA vs. X p-value 0.03 4.2 3 1024 0.046 0.003 0.002 0.48 0.15
28 RA/X 950 600 300 16.07 11.15 39 0.46 B
75 RA/X 550 500 300 27.75 15.52 91 0.59 L
L AVG 6 SD 630 6 171 441 6 126 307 6 97 12.90 6 6.82 7.53 6 5.58 36 6 19 0.41 6 0.14
B AVG 6 SD 1038 6 109 650 6 85 396 6 58 24.48 6 6.86 19.45 6 5.94 41 6 10 0.56 6 0.12
26 25 24 25
B vs. L 1.5 3 10 2.4 3 10 0.003 1.0 3 10 2.6 3 10 0.10 0.01
p-value
B: broadcast type, L: local type. Statistical differences were assessed using the Wilcoxon rank-sum test.
previously described in one existing data set (Kittelberger, 2002), but In conclusion, we show that there is significant innervation within
the unique function of such neurons—if any—remains elusive. In our HVC from both major projection cell types, providing the substrate for
study, we present two such neurons and further find that one neuron local processing that could potentially play a crucial role in vocal learn-
appears to have morphological similarities to HVC(X) neurons and the ing and production. Furthermore, these connections can help to inform
other appears more similar to an HVC(RA) neuron (Rojas-Piloni et al., our understanding of the neural mechanisms of sequence generation
2017). Whether HVC(RA/X) neurons are an example of errant wiring more broadly (Harvey, Coen, & Tank, 2012; G. B. Mello, Soares, &
or a distinct neuron cell type with a specified functional role within Paton, 2015; Pastalkova, Itskov, Amarasingham, & Buzsaki, 2008;
the network remains unknown. Schmidt et al., 2017; Schmitt et al., 2017).
FIGURE 10 Spatial properties of HVC(RA) and HVC(X) axons. (a, b) One dimensional profile of axonal length along three axes for HVC(RA) (a)
and HVC(X) (b) neurons. Red and blue traces are from example neurons, grey traces are from all remaining individual neurons from each
group in our data set. The center of each plot (0 mm) denotes soma location. (c) Distal axon path length and HVC innervation proportion
(see Materials and Methods) organized by projection target. Filled circles represent examples from (a) and (b). (d) The first two principal
components of four spatial parameters of axons. The two clusters as designated using the OPTICS algorithm (see Materials and Methods)
are represented by closed circles and open circles; red—HVC(RA); blue—HVC(X); green—HVC(RA/X)BENEZRA ET AL. | 1687
Journal of the Society for Neuroscience, 34(50), 16821–16834. https://
doi.org/10.1523/JNEUROSCI.1940-14.2014
Benton, S., Cardin, J. A., & DeVoogd, T. J. (1998). Lucifer Yellow filling of
area X-projecting neurons in the high vocal center of female canaries.
Brain Research, 799(1), 138–147.
Bonke, B. A., Bonke, D., & Scheich, H. (1979). Connectivity of the audi-
tory forebrain nuclei in the guinea fowl (Numida meleagris). Cell and
Tissue Research, 200(1), 101–121.
Bottjer, S. W., Glaessner, S. L., & Arnold, A. P. (1985). Ontogeny of brain
nuclei controlling song learning and behavior in zebra finches. Journal
of Neuroscience: Official Journal of the Society for Neuroscience, 5(6),
1556–1562.
Dercksen, V. J., Hege, H. C., & Oberlaender, M. (2014). The filament edi-
tor: An interactive software environment for visualization, proof-
editing and analysis of 3D neuron morphology. Neuroinformatics, 12
(2), 325–339. https://doi.org/10.1007/s12021-013-9213-2
FIGURE 11 Broadcast axons innervate a larger volume than local
Dutar, P., Vu, H. M., & Perkel, D. J. (1998). Multiple cell types distin-
axons. (a, b) Axons of three local (a) and broadcast (b) neurons
guished by physiological, pharmacological, and anatomic properties in
registered within the average HVC reference frame (dotted line).
nucleus HVc of the adult zebra finch. Journal of Neurophysiology, 80
(c, d) Schematic of local (c) and broadcast (d) axonal innervation of
(4), 1828–1838.
HVC
Fortune, E. S., & Margoliash, D. (1992). Cytoarchitectonic organization
and morphology of cells of the field-L complex in male zebra finches
AC KNOW LE DGME NT S
(Taenopygia guttata). Journal of Comparative Neurology, 325(3), 388–
This research was supported by the NIH (R01NS075044) (M.L.), the 404. https://doi.org/10.1002/cne.903250306
New York Stem Cell Foundation (M.L.), the Rita Allen Foundation Fortune, E. S., & Margoliash, D. (1995). Parallel pathways and conver-
(M.L.), Simons Foundation (Global Brain Initiative) (M.L.), the German gence onto HVc and adjacent neostriatum of adult zebra finches
(Taeniopygia guttata). Journal of Comparative Neurology, 360(3), 413–
Research Foundation (DFG) EG 401/1-1 (R.E.), EMBO ALTF 348–
441. https://doi.org/10.1002/cne.903600305
2017 (R.E.), the Center of Advanced European Studies and Research
Galvis, D., Wu, W., Hyson, R. L., Johnson, F., & Bertram, R. (2017). A dis-
(caesar, M.O.), the Max Planck Institute for Biological Cybernetics tributed neural network model for the distinct roles of medial and
(M.O.), the Bernstein Center for Computational Neuroscience, lateral HVC in zebra finch song production. Journal of Neurophysiol-
funded by German Federal Ministry of Education and Research ogy, 118(2), 677–692. https://doi.org/10.1152/jn.00917.2016
Grant BMBF/FKZ 01GQ1002 (M.O.), and the European Research Gibb, L., Gentner, T. Q., & Abarbanel, H. D. (2009). Inhibition and recur-
rent excitation in a computational model of sparse bursting in song
Council (ERC) under the European Union’s Horizon 2020 research
nucleus HVC. Journal of Neurophysiology, 102(3), 1748–1762. https://
and innovation program (grant agreement No 633428) (M.O.). We doi.org/10.1152/jn.00670.2007
thank Madeleine Junkins for technical assistance and Margot Elma-
Goller, F., & Cooper, B. G. (2004). Peripheral motor dynamics of song
leh, Elnaz Hozhabri, and Kalman Katlowitz for comments on earlier production in the zebra finch. Annals of the New York Academy of Sci-
versions of this manuscript. ences, 1016, 130–152. https://doi.org/10.1196/annals.1298.009
Guest, J. M., Seetharama, M. M., Wendel, E. S., Strick, P. L., & Oberlaender,
M. (2017). 3D reconstruction and standardization of the rat facial nucleus
C ONFLICT OF INT E RE ST for precise mapping of vibrissal motor networks. Neuroscience, 368, 171–
The authors have no conflicts of interest. 186. https://doi.org/10.1016/j.neuroscience.2017.09.031
Hahnloser, R. H., Kozhevnikov, A. A., & Fee, M. S. (2002). An ultra-sparse
code underlies the generation of neural sequences in a songbird.
OR CID Nature, 419(6902), 65–70. https://doi.org/10.1038/nature00974
Michael A. Long http://orcid.org/0000-0002-9283-3741 Hamaguchi, K., Tanaka, M., & Mooney, R. (2016). A distributed recurrent
network contributes to temporally precise vocalizations. Neuron, 91
(3), 680–693. https://doi.org/10.1016/j.neuron.2016.06.019
R E FER E NCE S Hamaguchi, K., Tschida, K. A., Yoon, I., Donald, B. R., & Mooney, R.
Ankerst, M., Breunig, M. M., Kriegel, H. P., & Sander, J. (1999). OPTICS: (2014). Auditory synapses to song premotor neurons are gated off
Ordering points to identify the clustering structure. Sigmod Record, during vocalization in zebra finches. eLife, 3, e01833. https://doi.org/
28(2), 49–60. 10.7554/eLife.01833
Armstrong, E., & Abarbanel, H. D. (2016). Model of the songbird nucleus Hanuschkin, A., Diesmann, M., & Morrison, A. (2011). A reafferent and
HVC as a network of central pattern generators. Journal of Neuro- feed-forward model of song syntax generation in the Bengalese
physiology, 116(5), 2405–2419. https://doi.org/10.1152/jn.00438. finch. Journal of Computational Neuroscience, 31(3), 509–532. https://
2016 doi.org/10.1007/s10827-011-0318-z
Basista, M. J., Elliott, K. C., Wu, W., Hyson, R. L., Bertram, R., & Johnson, Harvey, C. D., Coen, P., & Tank, D. W. (2012). Choice-specific sequences
F. (2014). Independent premotor encoding of the sequence and in parietal cortex during a virtual-navigation decision task. Nature,
structure of birdsong in avian cortex. Journal of Neuroscience: Official 484(7392), 62–68. https://doi.org/10.1038/nature109181688 | BENEZRA ET AL.
Jin, D. Z. (2009). Generating variable birdsong syllable sequences with in adult male and female canaries. Journal of Comparative Neurology,
branching chain networks in avian premotor nucleus HVC. Physical 284(3), 337–349. https://doi.org/10.1002/cne.902840302
Review E, 80(5 Pt 1), 051902. https://doi.org/10.1103/PhysRevE.80. Nottebohm, F., Kelley, D. B., & Paton, J. A. (1982). Connections of
051902 vocal control nuclei in the canary telencephalon. Journal of Com-
Karten, H. J. (1968). The ascending auditory pathway in the pigeon parative Neurology, 207(4), 344–357. https://doi.org/10.1002/cne.
(Columba livia). II. Telencephalic projections of the nucleus ovoidalis 902070406
thalami. Brain Research, 11(1), 134–153. Nottebohm, F., Stokes, T. M., & Leonard, C. M. (1976). Central control of
Katz, L. C., & Gurney, M. E. (1981). Auditory responses in the zebra song in the canary, Serinus canarius. Journal of Comparative Neurology,
finch’s motor system for song. Brain Research, 221(1), 192–197. 165(4), 457–486. https://doi.org/10.1002/cne.901650405
Kelley, D. B., & Nottebohm, F. (1979). Projections of a telencephalic Oberlaender, M., Bruno, R. M., Sakmann, B., & Broser, P. J. (2007). Trans-
auditory nucleus-field L-in the canary. Journal of Comparative Neurol- mitted light brightfield mosaic microscopy for three-dimensional trac-
ogy, 183(3), 455–469. https://doi.org/10.1002/cne.901830302 ing of single neuron morphology. Journal of Biomedical Optics, 12(6),
Kittelberger, J. M. (2002). Neurotrophins, synaptic connectivity and the 064029. https://doi.org/10.1117/1.2815693
regulation of song plasticity in the zebra finch (PhD thesis). Duke Oberlaender, M., de Kock, C. P., Bruno, R. M., Ramirez, A., Meyer, H. S.,
University, Durham, NC (3077141). Dercksen, V. J., . . . Sakmann, B. (2012). Cell type-specific three-
Kornfeld, J., Benezra, S. E., Narayanan, R. T., Svara, F., Egger, R., Ober- dimensional structure of thalamocortical circuits in a column of rat
laender, M., . . . Long, M. A. (2017). EM connectomics reveals axonal vibrissal cortex. Cerebral Cortex, 22(10), 2375–2391. https://doi.org/
target variation in a sequence-generating network. eLife, 6, e24364. 10.1093/cercor/bhr317
https://doi.org/10.7554/eLife.24364 Oberlaender, M., Dercksen, V. J., Egger, R., Gensel, M., Sakmann, B., &
Kosche, G., Vallentin, D., & Long, M. A. (2015). Interplay of inhibition Hege, H. C. (2009). Automated three-dimensional detection and
and excitation shapes a premotor neural sequence. Journal of Neuro- counting of neuron somata. Journal of Neuroscience Methods, 180(1),
science: Official Journal of the Society for Neuroscience, 35(3), 1217– 147–160. https://doi.org/10.1016/j.jneumeth.2009.03.008
1227. https://doi.org/10.1523/JNEUROSCI.4346-14.2015 Pastalkova, E., Itskov, V., Amarasingham, A., & Buzsaki, G. (2008). Internally
Kozhevnikov, A. A., & Fee, M. S. (2007). Singing-related activity of identi- generated cell assembly sequences in the rat hippocampus. Science, 321
fied HVC neurons in the zebra finch. Journal of Neurophysiology, 97 (5894), 1322–1327. https://doi.org/10.1126/science.1159775
(6), 4271–4283. https://doi.org/10.1152/jn.00952.2006 Picardo, M. A., Merel, J., Katlowitz, K. A., Vallentin, D., Okobi, D. E., Benezra,
Kubota, M., & Taniguchi, I. (1998). Electrophysiological characteristics of S. E., . . . Long, M. A. (2016). Population-level representation of a tempo-
classes of neuron in the HVc of the zebra finch. Journal of Neuro- ral sequence underlying song production in the zebra finch. Neuron, 90
physiology, 80(2), 914–923. (4), 866–876. https://doi.org/10.1016/j.neuron.2016.02.016
Long, M. A., Jin, D. Z., & Fee, M. S. (2010). Support for a synaptic chain Pinault, D. (1996). A novel single-cell staining procedure performed in vivo
model of neuronal sequence generation. Nature, 468(7322), 394– under electrophysiological control: Morpho-functional features of juxta-
399. https://doi.org/10.1038/nature09514 cellularly labeled thalamic cells and other central neurons with biocytin
Lynch, G. F., Okubo, T. S., Hanuschkin, A., Hahnloser, R. H., & Fee, M. S. or Neurobiotin. Journal of Neuroscience Methods, 65(2), 113–136.
(2016). Rhythmic continuous-time coding in the songbird analog of Poole, B., Markowitz, J. E., & Gardner, T. J. (2012). The song must go on:
vocal motor cortex. Neuron, 90(4), 877–892. https://doi.org/10. Resilience of the songbird vocal motor pathway. PLoS One, 7(6),
1016/j.neuron.2016.04.021 e38173. https://doi.org/10.1371/journal.pone.0038173
Mello, G. B., Soares, S., & Paton, J. J. (2015). A scalable population code Roberts, T. F., Hisey, E., Tanaka, M., Kearney, M. G., Chattree, G., Yang,
for time in the striatum. Current Biology: Cb, 25(9), 1113–1122. C. F., . . . Mooney, R. (2017). Identification of a motor-to-auditory
https://doi.org/10.1016/j.cub.2015.02.036 pathway important for vocal learning. Nature Neuroscience, 20(7),
Mello, C. V., Vates, G. E., Okuhata, S., & Nottebohm, F. (1998). Descend- 978–986. https://doi.org/10.1038/nn.4563
ing auditory pathways in the adult male zebra finch (Taeniopygia gut- Rojas-Piloni, G., Guest, J. M., Egger, R., Johnson, A. S., Sakmann, B., &
tata). Journal of Comparative Neurology, 395(2), 137–160. Oberlaender, M. (2017). Relationships between structure, in vivo
Mooney, R. (2000). Different subthreshold mechanisms underlie song function and long-range axonal target of cortical pyramidal tract neu-
selectivity in identified HVc neurons of the zebra finch. Journal of rons. Nature Communications, 8(1), 870. https://doi.org/10.1038/
Neuroscience, 20(14), 5420–5436. s41467-017-00971-0
Mooney, R., & Prather, J. F. (2005). The HVC microcircuit: the synaptic Scharff, C., Kirn, J. R., Grossman, M., Macklis, J. D., & Nottebohm, F.
basis for interactions between song motor and vocal plasticity path- (2000). Targeted neuronal death affects neuronal replacement and
ways. Journal of Neuroscience, 25(8), 1952–1964. https://doi.org/10. vocal behavior in adult songbirds. Neuron, 25(2), 481–492.
1523/JNEUROSCI.3726-04.2005 Scharff, C., & Nottebohm, F. (1991). A comparative study of the behav-
Narayanan, R. T., Egger, R., Johnson, A. S., Mansvelder, H. D., Sakmann, ioral deficits following lesions of various parts of the zebra finch
B., de Kock, C. P., & Oberlaender, M. (2015). Beyond columnar orga- song system: implications for vocal learning. Journal of Neuroscience,
nization: Cell type- and target layer-specific principles of horizontal 11(9), 2896–2913.
axon projection patterns in rat vibrissal cortex. Cerebral Cortex, 25 Schmidt, H., Gour, A., Straehle, J., Boergens, K. M., Brecht, M., & Helm-
(11), 4450–4468. https://doi.org/10.1093/cercor/bhv053 staedter, M. (2017). Axonal synapse sorting in medial entorhinal cor-
Narayanan, R. T., Mohan, H., Broersen, R., de Haan, R., Pieneman, A. W., tex. Nature, 549(7673), 469–475. https://doi.org/10.1038/
& de Kock, C. P. (2014). Juxtasomal biocytin labeling to study the nature24005
structure-function relationship of individual cortical neurons. Journal Schmitt, L. I., Wimmer, R. D., Nakajima, M., Happ, M., Mofakham, S., &
of Visualized Experiments, 84, e51359. https://doi.org/10.3791/51359 Halassa, M. M. (2017). Thalamic amplification of cortical connectivity
Nixdorf, B. E., Davis, S. S., & DeVoogd, T. J. (1989). Morphology of sustains attentional control. Nature, 545(7653), 219–223. https://doi.
Golgi-impregnated neurons in hyperstriatum ventralis, pars caudalis org/10.1038/nature22073You can also read