Mice and Rats Display Different Ventilatory, Hematological, and Metabolic Features of Acclimatization to Hypoxia - Frontiers
←
→
Page content transcription
If your browser does not render page correctly, please read the page content below
ORIGINAL RESEARCH
                                                                                                                                                  published: 12 March 2021
                                                                                                                                          doi: 10.3389/fphys.2021.647822

                                                Mice and Rats Display Different
                                                Ventilatory, Hematological, and
                                                Metabolic Features of
                                                Acclimatization to Hypoxia
                                                Christian Arias-Reyes , Jorge Soliz * † and Vincent Joseph * †

                                                Centre de Recherche de l’Institute Universitaire de Cardiologie et de Pneumologie de Québec, Université Laval,
                                                Québec, QC, Canada

                                                Phylogeographic studies showed that house mice (Mus musculus) originated in the
                                                Himalayan region, while common rats (Rattus rattus and Rattus norvegicus) come from
                                                the lowlands of China and India. Accordingly, it has been proposed that its origins gave
                           Edited by:
                     Rodrigo Iturriaga,
                                                mice, but not rats, the ability to invade ecological niches at high altitudes (pre-adaptation).
    Pontificia Universidad Católica de          This proposal is strongly supported by the fact that house mice are distributed throughout
                           chile, Chile         the world, while common rats are practically absent above 2,500 m. Considering that the
                      Reviewed by:              ability of mammals to colonize high-altitude environments (>2,500 m) is limited by their
                       Catherine Ivy,
          Western University, Canada            capability to tolerate reduced oxygen availability, in this work, we hypothesize that
              Jean-Paul R. Richalet,            divergences in the ventilatory, hematological, and metabolic phenotypes of mice and rats
          Université Paris 13, France
                                                establish during the process of acclimatization to hypoxia (Hx). To test this hypothesis
                 *Correspondence:
                          Jorge Soliz
                                                male FVB mice and Sprague-Dawley (SD) rats were exposed to Hx (12% O2) for 0 h
        jorge.soliz@criucpq.ulaval.ca           (normoxic controls), 6 h, 1, 7, and 21 days. We assessed changes in ventilatory [minute
                     Vincent Joseph             ventilation (VE), respiratory frequency (fR), and tidal volume (VT)], hematological (hematocrit
    vincent.joseph@criucpq.ulaval.ca
                                                and hemoglobin concentration), and metabolic [whole-body O2 consumption (VO2) and
    †
      These authors have contributed
 equally to this work and share senior          CO2 production (VCO2), and liver mitochondrial oxygen consumption rate (OCR) parameters].
                           authorship           Compared to rats, results in mice show increased ventilatory, metabolic, and mitochondrial
                                                response. In contrast, rats showed quicker and higher hematological response than mice
                   Specialty section:
         This article was submitted to          and only minor ventilatory and metabolic adjustments. Our findings may explain, at least
                Integrative Physiology,         in part, why mice, but not rats, were able to colonize high-altitude habitats.
               a section of the journal
               Frontiers in Physiology          Keywords: acclimatization to hypoxia, physiology, metabolism, mitochondria, rodents
       Received: 30 December 2020
        Accepted: 15 February 2021
         Published: 12 March 2021
                                                INTRODUCTION
                             Citation:
           Arias-Reyes C, Soliz J and           Animals living at high-altitude present a series of physiological adjustments to prevent an imbalance
     Joseph V (2021) Mice and Rats              in the supply and demand of oxygen (Scott et al., 2008; Storz et al., 2010). These adjustments
          Display Different Ventilatory,
                                                occur along the oxygen cascade, and include a combination of physiological, cellular, molecular,
       Hematological, and Metabolic
           Features of Acclimatization
                                                and biochemical modifications that result in either an increased supply, narrowed demand, more
                           to Hypoxia.          efficient use of oxygen, or combinations of those three (Hochachka, 1985; Scott et al., 2008;
           Front. Physiol. 12:647822.           Storz et al., 2010). Remarkably, such changes may differ in expression and efficiency between
    doi: 10.3389/fphys.2021.647822              species or even between populations of the same species depending on their genetic backgrounds

Frontiers in Physiology | www.frontiersin.org                                          1                                            March 2021 | Volume 12 | Article 647822
Arias-Reyes et al.                                                                                                Acclimatization to Hypoxia in Rodents

and their phenotypic plasticity (Monge and León-Velarde, 2003;             (CRIUCPQ) with food and water ad libitum and exposed to
Storz et al., 2010; Storz and Scott, 2021). Such differences appear        12:12 h light:dark cycles. All experimental procedures were in
when comparing house mice (Mus musculus), that successfully                concordance with the Canadian Council of animal Care. The
colonized high-altitude environments, and common rats (Rattus              animal study was reviewed and approved by the Animal Protection
rattus and Rattus norvegicus), that are rare or absent in natural          Committee of Université Laval, Québec, Canada.
habitats over 2,500 m above sea level (masl; Jochmans-Lemoine
et al., 2015). In previous works, we described the physiological           Exposure to Hypoxia
traits of lab mice (FVB) and Sprague-Dawley (SD) rats established          Animals were exposed to hypoxia (12% O2) for 6 h (nmice,
at 3,600 masl for more than 20 years and over 30 generations.              rats = 15, 13), 1 (nmice, rats = 12, 12), 7 (nmice, rats = 8, 9), or 21
Compared to rats, mice have a higher metabolic rate, higher                (nmice, rats = 10, 7) days. For the 6 h group, we directly used
tidal volume, increased alveolar surface area and lung volume,             the plethysmography chambers (see below), while for the other
lower hematocrit and hemoglobin levels, and reduced right                  groups, we used plexiglass chambers, controlling oxygen levels
ventricular hypertrophy (a sign of reduced pulmonary                       with an oxycycler (Biospherix, Redfield, NY). Hypoxic chambers
hypertension; Jochmans-Lemoine et al., 2015). In following,                were open once a week during 1 h for changing animals’
we were interested in unveiling whether these features had a               cages and replacing water and food. Normoxic controls (nmice,
genetic basis or were the result of phenotypic plasticity, thus,           rats = 14, 15) were kept in regular room conditions (21% O2).
the physiological and molecular responses to acute hypoxia (Hx;
6 h – 12% O2, roughly equivalent to 4,000 masl) were evaluated
                                                                           Ventilatory and Metabolic Parameters
at sea level. In comparison to rats, mice had lower metabolic
                                                                           For the last hours of the exposure protocol, animals were
rate, higher minute ventilation, and higher expression of the
                                                                           quickly transferred to plethysmography chambers and recordings
transcription factor HIF-1α (a master regulator of the hypoxic
                                                                           were made for 3 h (while animals were sleeping) using a
response) in the brainstem. On the other hand, rats presented
                                                                           whole-body plethysmograph (EMKA Technologies, Paris,
increased expressions of glucose transporter 1, indicating an
                                                                           France). Mice and rats’ plethysmography chambers were
elevated glycolytic metabolism in the brainstem (Jochmans-
                                                                           constantly supplied with a mix of 12% O2 balanced in N2,
Lemoine et al., 2016). In summary, these data showed that
                                                                           or room air (21% O2) for normoxic controls. Inflow was set
FVB mice develop a more efficient response than SD rats during
                                                                           at 350 ml/min for mice and 1,150 ml/min for rats. A subsampling
the acute phase of exposure to Hx, but it remains unclear
                                                                           pump (100 ml/min) was used to control outflow. O2, CO2,
whether such differences would persist during acclimatization
                                                                           and water pressure levels were continuously measured using
to chronic hypoxia, a process of gradual changes occurring
                                                                           specific gas analyzers (OXZILLA, CA-10, RH-300, Sable Systems,
within few weeks that improves the capture, distribution, and
                                                                           Las Vegas, NV; and CD-3A, AEI Technologies, San Francisco,
utilization of oxygen (Monge and Leon-Velarde, 1991; Schmitt
                                                                           CA). Levels of O2, CO2, and water pressure in the inflowing
et al., 1994; Cáceda et al., 2001; Storz et al., 2010; Czerniczyniec
                                                                           air were measured at the beginning, after 1 h, and at the end
et al., 2015; Lukyanova and Kirova, 2015). To answer this
                                                                           of the recordings to calculate the oxygen consumption (VO2)
question, FVB mice and SD rats were exposed to hypoxia up
                                                                           and CO2 production (VCO2). Animals were weighed after
to 3 weeks to identify the ventilatory, hematological, and metabolic
                                                                           the recordings.
changes occurring at whole-body level as well as in mitochondrial
O2 consumption in the liver (the most metabolically active organ
in rodents – accounting for up to 50% of resting O2 consumption            Hematological Parameters
in mice and rats, Wang et al., 2012; Kummitha et al., 2014).               After plethysmography recordings, animals were anesthetized
We found that mice have a biphasic increase of minute ventilation,         and euthanized. Blood samples were taken to measure the
peaking after 7 days of exposure to hypoxia and later increased            hemoglobin (Hb) concentration and hematocrit (Ht). We used
blood hemoglobin content and hematocrit level. Surprisingly,               an automated spectroscopic system (HemoCue, Ängelholm,
metabolic rate was higher after 7 days of hypoxic exposure, in             Sweden) to measure the concentration of Hb. The Ht was
line with increased mitochondrial O2 consumption in the liver,             calculated by conventional methods using a dedicated blood
mediated by the increased activity of complex II of the electron           capillaries centrifuge.
transport chain (ETC). Contrastingly, apart from an excessive
increase in hematological parameters, rats show only minor                 Mitochondrial O2 Consumption
ventilatory or metabolic adjustments.                                      Tissue Sampling
                                                                           Liver tissue samples (approximately 2 mg) were extracted from
                                                                           rats and mice under normoxia (Nx) or exposed to 1, 7, or
MATERIALS AND METHODS                                                      21 days of hypoxia (12% O2). Samples were immediately
                                                                           transferred to ice-cold respirometry medium MiR05 (0.5 mM
Animals                                                                    EGTA, 3 mM MgCl2*6H2O, 60 mM K-lactobionate, 20 mM
We used male adult (7 weeks old) FVB-NJ mice (Jackson) and                 taurine, 10 mM KH2P04, 20 mM HEPES, 110 mM sucrose,
Sprague-Dawley rats (Charles River). Animals were housed at                and 1 g/L bovine serum albumin pH = 7) supplemented with
the animal care facility at the “Centre de Recherche de l’Institut         saponin (50 μg/L) for permeabilization of the cell membrane
Universitaire de Cardiologie et de Pneumologie de Québec”                  as previously described (Arias-Reyes et al., 2019).

Frontiers in Physiology | www.frontiersin.org                          2                                       March 2021 | Volume 12 | Article 647822
Arias-Reyes et al. Acclimatization to Hypoxia in Rodents
Oxygen Consumption Rates Activity of Cytochrome C Oxidase
Quickly after extraction, liver samples were transferred inside (Complex IV)
the respirometry chambers of the Oxygraph-2k (OROBOROS At the end of the experiments of mitochondrial respiration,
Instruments – Innsbruck, Austria) filled with the same MiR05 after antimycin A injections, 2 mM ascorbate (keeps TMPD
medium supplemented with saponin, and left incubating for in reduced state) and 0.5 mM N,N,N′,N′-Tetramethyl-p-
15 min. The mass-specific (pmol O2·s−1·mg ww−1) oxygen phenylenediamine dihydrochloride (TMPD – specific electron
consumption rates (OCRs) were measured according to the donor to complex IV), were added to measure the OCR exclusive
protocols described below. to complex IV. Finally, 100 mM sodium azide (inhibitor of
In each experiment, the mitochondrial ETC was fueled-up complex IV) was added. The activity of cytochrome C oxidase
through different electron-transfer pathways by the addition of was calculated by subtracting the background chemical oxidation
specific mitochondrial substrates and inhibitors (Gnaiger et al., of the medium (after the addition of azide) from the OCR
2019). The N (NADH electrons through complex I), S (FADH2 after the injection of TMPD.
electrons through complex II), and F (fatty acids oxidation electrons
through ubiquinone) pathways were triggered independently or Data and Statistical Analysis
combined to reach specific mitochondrial activation states namely Plethysmography recordings were analyzed with the software
LEAK and electron transfer (ET). LEAK state results from the Spike2 v.7.19 (Cambridge Electronic Design). We used averaged
proton slippage across the inner mitochondrial membrane toward values of three different segments along the recording where
mitochondrial matrix in presence of mitochondrial metabolic the breathing pattern was stable at resting values to obtain
substrates but in absence of ADP. ET state occurs when the respiratory frequency (fR), minute ventilation (VE), tidal volume
electron transfer and oxygen consumption are uncoupled from (VT), the oxygen consumption (VO2), and CO2 production
the adenosine triphosphate (ATP) synthesis by the addition of (VCO2) rates. VT was calculated as described previously
a protonophore (rapidly returns protons into the mitochondrial (Marcouiller et al., 2014; Ballot et al., 2015; Boukari et al.,
matrix independently of the regulation of the ATP synthase) in 2016; Jochmans-Lemoine et al., 2016). VO2 and VCO2 were
presence of metabolic mitochondrial substrates (Gnaiger et al., 2019). calculated by indirect calorimetry as described in (Boukari
et al., 2016). Values of fR, VT, VO2, and VCO2 were allometrically
LEAK – ET Protocol adjusted to make them comparable between species as described
After the 15 min incubation, injections of 5 mM pyruvate previously (Stahl, 1967; Jochmans-Lemoine et al., 2015).
and 2 mM malate were added consecutively to the respiratory Ventilatory, metabolic, and hematological data were analyzed
chambers containing the samples to trigger the N pathway by two-way ANOVA tests, followed by post hoc analysis (Fisher’s
and reach LEAK state. In following, 2.5 mM ADP, 10 μM Least Significant Difference) using GraphPad Prism 8.3. We used
cytochrome C (see rationale below), and 20 μM CCCP species (mice and rats), and exposure (Nx; 6 h, 1, 7, and 21 days
(protonophore) were added to uncouple mitochondria and of hypoxia) as factors. Values of VE, hematocrit, and VO2, were
consequently initiate the ET state. Then, timely injections of correlated against each other using Spearman’s correlations.
10 mM glutamate, 50 mM succinate, 0.5 mM octanoylcarnitine, Mitochondrial data were captured using the software DatLab
and 0.5 μM rotenone were made to record OCRs for N, NS, v.7.4.0.4 (OROBOROS Instruments – Innsbruck, Austria). Data
NSF, and S pathways correspondingly (Doerrier et al., 2018). was analyzed by two-way RM ANOVA tests using species (mice
Finally, 2.5 μM antimycin A (inhibitor of complex III) was and rats), and exposure (normoxia; 1, 7, and 21 days of hypoxia)
added to stop mitochondrial respiration and make corrections as factors. The combination of mitochondrial respiratory states
for non-mitochondrial OCR. Cytochrome C was used to control and active electron-transfer pathways (i.e., LEAK, ET-N, ET-S,
the integrity of the outer mitochondrial membrane, thus, if ET-NS, and ET-NSF) were the repeated measures. When
OCR increased more than 20% after the addition of cytochrome significant differences in treatments or interactions were found,
C the sample was considered damaged and discarded. a post hoc Fisher’s Least Significant Difference multiple
comparison test was performed.
ETC Maximum Capacity and Flux Control Ratios For all the analyses, test significances were set to p < 0.05.
The ETC maximum capacity is defined as the mitochondrial Data are presented as means ± SD unless stated differently.
OCR when all the electron-transfer pathways relevant for the
analyzed tissue are active during the ET state. In our experiments,
the ETC maximum capacity was measured by triggering the RESULTS
NSF pathway. Then, the flux control ratio (FCR) was calculated
for each sample by dividing the value of OCR for the electron- Ventilatory Response
transfer pathways N, S, and NS by the value of ETC maximum Mice Have a Stronger Ventilatory Response Than
capacity (NSF pathway). FCR values have the advantages of Rats During the Process of Acclimatization to
internal normalization of mitochondrial content (Gnaiger et al., Hypoxia
2019), and of representing the fraction of the ETC maximum A significant effect of the hypoxic exposure on ventilation was
capacity covered by each of the N, S, or NS pathways. In this observed in both species (Two-way ANOVA Fexposure = 25.17;
manuscript, FCR is referred as the level of activation of each d.f. = 4, 105; p < 0.0001; Finteraction = 9.05; d.f. = 4, 105;
electron-transfer pathway. p < 0.0001). In mice, VE remained unchanged after 6 h of
Frontiers in Physiology | www.frontiersin.org 3 March 2021 | Volume 12 | Article 647822Arias-Reyes et al. Acclimatization to Hypoxia in Rodents
hypoxia in comparison to control levels (Fisher’s LSD test Figure 1B – left and middle panels). Compared to normoxic
p = 0.0608). However, significant increases were observed after controls, mice exposed to 6-h hypoxia showed a significant
1, 7, and 21 days of hypoxia (Fisher’s LSD test p1d = 0.0004; decrease in VT values (Fisher’s LSD test p = 0.0185). Consistently,
p7d < 0.0001; and p21d < 0.0001). A peak of VE in mice was mice had higher VT values in comparison to rats in normoxia
reached at day 7 (3-fold normoxic control levels) followed by and 1-, 7-, and 21-days hypoxia (Fisher’s LSD test pCtrl < 0.0001;
a significant reduction at day 21 (Fisher’s LSD test p7d p1d < 0.005; p7d < 0.0001; and p21d < 0.0001). Such difference
vs21d < 0.0001; Figure 1A – middle panel). In rats, VE levels was not significant after 6 h-hypoxia (Fisher’s LSD test p = 0.0649;
increased after 6 h of hypoxia in comparison to control conditions Figure 1B – right panel).
and remained elevated at 1, 7, and 21 days (Fisher’s LSD test Hypoxia significantly affected the respiratory frequency of
p6h = 0.0004; p1d = 0.0062; p7d = 0.0004; and p21d = 0.0035; mice and rats (Two-way ANOVA Fexposure = 49.50; d.f. = 4, 107
Figure 1A – left panel). Comparing both species, mice showed p < 0.0001; Fspecies = 60.56; d.f. = 1, 107 p < 0.0001; and
significantly higher ventilation levels than rats after 7 days of Finteraction = 2.27; d.f. = 4, 107 p = 0.067). In mice, hypoxia triggered
hypoxia (Fisher’s LSD test p < 0.0001). However, VE was not a significant and progressive increase in respiratory frequency
different for mice compared to rats in normoxia, 6 h, 1 and after 6 h, reaching peak values after 7 days of exposure (Fisher’s
21 days of hypoxia (Fisher’s LSD test p6h = 0.35; p1d = 0.09; LSD test p6h < 0.0001; p1d < 0.0001; p7d < 0.0001; and p21d < 0.0001).
and p21d = 0.053; Figure 1A – right panel). fR values dropped by day 21 of hypoxia (p7dvs21d = 0.0004). In
Hypoxia affected VT of mice but not rats (Two-way ANOVA comparison to control levels, rats showed an augmentation in
Fexposure = 2.57; d.f. = 4, 106; p = 0.068; Fspecies = 71.55; d.f. = 14, fR after 6 h of hypoxia (Fisher’s LSD test p < 0.0001) and
106; p < 0.0001; and Finteraction = 2.473; d.f. = 4, 106; p = 0.0488; maintained elevated values until 21 days of hypoxic exposure
A
B
C
FIGURE 1 | Mass-corrected ventilatory parameters of adult rats and mice in normoxia (Nx) or exposed to 6 h, 1, 7, or 21 days of hypoxia (Hx). Mice show a
stronger ventilatory response in hypoxic conditions than rats. (A) Mass-corrected ventilation (VE), (B) mass-corrected tidal volume (VT), and (C) mass-corrected
respiratory frequency (fR). *p < 0.05; **p < 0.01; and ***p < 0.001; ##p < 0.01 and ###p < 0.001 vs. the control. n = 7–15.
Frontiers in Physiology | www.frontiersin.org 4 March 2021 | Volume 12 | Article 647822Arias-Reyes et al. Acclimatization to Hypoxia in Rodents
inclusively. fR values in mice were significantly lower than in conditions mice showed significantly higher Hb than rats
rats in either normoxic conditions (p < 0.0001), or after 6 h, (Two-way ANOVA F = 7.286; d.f. = 1, 82; p = 0.008), however,
1 and 21 days of hypoxia (Fisher’s LSD test p6h < 0.0001; when exposed to hypoxia, no differences between species were
p1d < 0.0001; p21d < 0.0001). Such difference disappears transiently observed after 6 h, 7 and 21 days. Moreover, in animals exposed
after 7 days of hypoxia (Fisher’s LSD test p = 0.574; Figure 1C). to hypoxia for 1 day, Hb was higher in mice than in rats
(Fisher’s LSD test p = 0.028; Figure 2B – right panel).
Hematological Response
Mice Have a Late Hematological Response Metabolic Response
Compared to Rats During the Process of Mice and Rats Have a Transitory Drop in
Acclimatization to Hypoxia Body Temperature During the Process of
Hypoxia significantly affected the hematocrit (Two-way ANOVA Acclimatization to Hypoxia
Finteraction = 3.828; d.f. = 4, 75; p = 0.0069) and hemoglobin Hypoxia had a significant effect on body temperature (BT) in
concentration (Two-way ANOVA Finteraction = 3.208; d.f. = 4, 82; mice and rats (Two-way ANOVA Fexposure = 2.712; d.f. = 4,
p = 0.017) of mice and rats. The Ht of mice significantly increased 117; p = 0.033; Fspecies = 3.466; d.f. = 1, 117; p = 0.065; and
in comparison to controls after 21-days hypoxia (Fisher’s LSD Finteraction = 2.517; d.f. = 4, 117; p = 0.045). In mice, a significant
test p < 0.0001; Figure 2A – center panel). In rats, a progressive drop occurred after 1-day hypoxia (Fisher’s LSD test p = 0.014),
augmentation of Ht was observed early after 1 day of hypoxia however, after 7 days, control levels were restored. Rats showed
(Fisher’s LSD test p = 0.0046; Figure 2A – left panel). When an early decline of BT after 6 h of hypoxia (Fisher’s LSD test
comparing both species, no differences were observed in normoxic p = 0.01), moreover, control levels were re-established after
conditions, 6 h, 1 and 21 days of hypoxia. At day 7 of hypoxia, 7 days. Both species showed similar body temperatures in
however, mice showed significantly lower Ht levels than rats normoxic conditions, 6-h and 21-days hypoxia. At days 1 and
(Fisher’s LSD test p = 0.0003; Figure 2A – right panel). 7 of hypoxic exposure, mice had significantly lower values of
While the concentration of hemoglobin was significantly BT than rats (Fisher’s LSD test p1d = 0.029; p7d = 0.016; Table 1).
increased in mice only after 21 days of hypoxia (Fisher’s LSD
test p = 0.0046; Figure 2B – center panel), in rats we observed Mice but Not Rats Increase Their Whole-Body
a progressive augmentation after 1 day of hypoxic exposure, O2 Consumption and CO2 Production During the
reaching maximum values at day 21 (Fisher’s LSD test vs. Process of Acclimatization to Hypoxia
control: p1d = 0.013; p7d < 0.0001; p21d < 0.0001; p1dvs7d = 0.018; A significant effect of hypoxia on the oxygen consumption
and p7dvs21d = 0.004; Figure 2B – left panel). In normoxic (VO2) was observed in mice but not in rats (Two-way ANOVA
A
B
FIGURE 2 | Hematological parameters (hematocrit – A and hemoglobin concentration – B) of adult rats and mice in normoxia (Nx) or exposed to 6 h, 1, 7 or 21
days of hypoxia (Hx). The hematological response to chronic hypoxia is delayed in mice compared to rats. *p < 0.05; **p < 0.01; and ***p < 0.001; #p < 0.05 and
###
p < 0.001 vs. the control. n = 7–15.
Frontiers in Physiology | www.frontiersin.org 5 March 2021 | Volume 12 | Article 647822Arias-Reyes et al. Acclimatization to Hypoxia in Rodents
TABLE 1 | Ventilatory, hematological, and metabolic parameters in rats and mice during the process of acclimatization to hypoxia at sea-level and at high-altitude.
Sea level High altitude*
Rats Normoxia Hypoxia 6 h 1 day 7 days 21 days 3,600 masl
Body mass (g) 309.7 ± 88.2 279.8 ± 47.3 242.7 ± 19.7 317.5 ± 31.1 372.6 ± 83.9 232 ± 9
Body temp. (°C) 34.5 ± 1 33.6 ± 1.1 34.3 ± 0.8 34.8 ± 0.7 34.1 ± 0.8 35.2 ± 0.2
VE (ml/min/100 g) 73.3 ± 11.9 115.6 ± 19.7 109.4 ± 19 116.9 ± 16.4 106.3 ± 25.1 153 ± 97
VT (ml/100 g) 0.675 ± 0.153 0.723 ± 0.101 0.665 ± 0.13 0.708 ± 0.099 0.677 ± 0.114 0.79 ± 0.34
fR (bpm) 110.2 ± 13.5 157.9 ± 19.5 165.7 ± 16.8 166.3 ± 20.5 155.6 ± 18 186 ± 38
Hematocrit (%) 37.1 ± 3.6 40.1 ± 3.2 42.2 ± 2.6 45.7 ± 3.9 46.6 ± 4.3 60.5 ± 1.1
Hemoglobin (g/L) 117.9 ± 9.9 127 ± 14.8 130.8 ± 8.3 142.8 ± 16.7 158.9 ± 12.9 204 ± 3
VO2 (ml/min/100 g) 1.72 ± 0.44 1.59 ± 0.71 2.04 ± 0.69 1.51 ± 0.36 1.54 ± 0.33 1.7 ± 0.26
VCO2 (ml/min/100 g) 1.63 ± 0.32 1.17 ± 0.26 1.74 ± 0.33 1.58 ± 0.18 1.25 ± 0.3 1.98 ± 0.41
RER (VCO2/VO2) 0.95 ± 0.22 0.84 ± 0.35 0.94 ± 0.3 1.1 ± 0.3 0.81 ± 0.09 1.128 ± 0.105
VE/VO2 46.13 ± 17.18 65.82 ± 25.43 56.98 ± 12.49 80.8 ± 18.82 70.33 ± 17.27 87.7 ± 47.6
O2 extraction 12.56 ± 3.63 17.24 ± 8.51 17.61 ± 3.72 12.92 ± 3.28 14.85 ± 3.44 6.7 ± 2.8
Mice Normoxia Hypoxia 6 h 1 day 7 days 21 days 3,600 masl
Body mass (g) 25.9 ± 2.6 25.1 ± 3.4 24.7 ± 1.1 16 ± 11.9 24.8 ± 1.5 13.7 ± 0.9
Body temp. (°C) 34.3 ± 1.2 33.9 ± 0.9 33.4 ± 0.5 33.7 ± 1.1 34.4 ± 1.1 35.2 ± 0.2
VE (ml/min/100 g) 138.5 ± 54.7 174.3 ± 36.8 211 ± 56.9 367.3 ± 102.2 238.8 ± 77.2 461.4 ± 199.5
VT (ml/100 g) 1.014 ± 0.451 0.824 ± 0.192 0.904 ± 0.219 1.186 ± 0.24 0.978 ± 0.221 1.49 ± 0.67
fR (bpm) 141.1 ± 23.7 216.1 ± 37 235.4 ± 46.1 306.6 ± 49.1 240.5 ± 32.9 320.9 ± 75.8
Hematocrit (%) 38.5 ± 4.3 39 ± 5 42.1 ± 2.1 39 ± 3.7 48.8 ± 3.5 47.0 ± 1.7
Hemoglobin (g/L) 137.9 ± 6.1 135 ± 10.6 140.8 ± 7.3 138.8 ± 8.9 156.9 ± 13.8 116 ± 10
VO2 (ml/min/100 g) 4.11 ± 1.3 3.56 ± 1.13 3.87 ± 0.98 4.99 ± 0.91 4.85 ± 1.11 5.85 ± 0.96
VCO2 (ml/min/100 g) 3.16 ± 0.9 3 ± 0.54 3.18 ± 0.56 4.54 ± 0.9 3.89 ± 1.22 4.95 ± 0.92
RER (VCO2/VO2) 0.78 ± 0.09 0.93 ± 0.38 0.86 ± 0.23 0.91 ± 0.04 0.8 ± 0.12 0.859 ± 0.169
VE/VO2 36.22 ± 17.37 52.49 ± 15.9 58.62 ± 24.39 73.34 ± 15.2 50.4 ± 14.33 79.8 ± 31.6
O2 extraction 17.62 ± 7.21 18.62 ± 4.55 18.02 ± 7.25 13.12 ± 3.28 18.61 ± 6.14 7.1 ± 3.2
Values are means ± SD. Data for normoxia (Nx) and sea level hypoxia (6 h, 1, 7, and 21 days) is presented in this study. *High altitude values were published by
Jochmans-Lemoine et al. (2015).
Fexposure = 2.222 d.f. = 4, 103; p = 0.072; Fspecies = 36.27 d.f. = 1, In mice, we calculated values of RER between 0.778 and 0.929,
103; p < 0.0001; and Finteraction = 2.865 d.f. = 4, 103; p = 0.027). while for rats between 0.813 and 1.096, however, no significant
In comparison to normoxic controls, mice exposed to hypoxia effects of hypoxia or species were found (Figure 3C; Fexposure = 0.25;
for 7 and 21 days showed an increase of 10 and 25% in VO2, d.f. = 4, 103; p = 0.248; Fspecies = 2.256; d.f. = 1, 103; p = 0.136;
respectively (Fisher’s LSD test p7d = 0.017; p21d = 0.016; Figure 3A and Finteraction = 1.212; d.f. = 4, 103; p = 0.3104).
– center panel). No changes were observed in rats (Figure 3A
– left panel). Compared to rats, VO2 in mice resulted significantly
higher in normoxia and after 7 and 21 days of hypoxia (Fisher’s Plasticity in the S (Complex II-Linked) and
LSD test p7d < 0.0001; p21d < 0.0001; Figure 3A – right panel). NS (Complex I&II-Linked) Pathways
CO2 production was significantly affected by hypoxic exposure Upregulates the ETC Maximum Capacity
in mice and rats (Two-way ANOVA Fexposure = 8.375; d.f. = 4, During Acclimatization to Hypoxia in Liver
104; p < 0.0001; Fspecies = 45.29; d.f. = 1, 104; p < 0.0001; and Mitochondria of Mice but Not in Rats
Finteraction = 5.836; d.f. = 4, 104; p = 0.0003). Mice showed an We tested the effect of hypoxia on the oxidative machinery in
augmentation in VCO2 starting after 7 days of hypoxia (Fisher’s the ETC of liver mitochondria of mice and rats during LEAK
LSD test p7d < 0.0001; p21d < 0.004; Figure 3B – center panel). and ET states. Furthermore, we calculated the FCR as a measurement
In rats, a transient reduction of VCO2 after 6 h of hypoxia of the fraction of the ETC maximum capacity covered by the
was observed (Fisher’s LSD test p < 0.001), however, in rats activation of N, S, or NS electron-transfer pathways. No changes
exposed to hypoxia for 1, 7, and 21 days, VCO2 values were were observed for LEAK state in any species either in normoxia
not different from normoxic controls (Figure 3B – left panel). or hypoxia (Figures 4A,C). Regarding ET state, in mice, while
When both species were compared, mice showed higher VCO2 the N pathway (complex I-linked) remained unaltered in normoxia
values than rats after 7 and 21 days of hypoxia (Fisher’s LSD and hypoxia, after 21-days hypoxia the S (complex II-linked),
test p7d < 0.0001; p21d < 0.0001; Figure 3B – right panel). NS (complexes I&II-linked), and NSF (complexes I&II&FAO-
The respiratory exchange ratio (RER) is calculated as the linked) pathways increased significantly in comparison to normoxic
ratio of VCO2 divided by VO2. The RER is associated with the control levels (RM ANOVA Fisher’s LSD test pS = 0.0002;
favored metabolic fuel (carbohydrates, proteins, or fatty acids). pNS < 0.0001; pNSF < 0.0001; Figure 4C). Accordingly, the activation
A value close to 1 represents a predominant glycolytic metabolism, of NS pathway was upregulated by 30% after 21 days of hypoxia
while a value closer to 0.7 implies a metabolism more dependent (RM ANOVA Fisher’s LSD test p < 0.0001). The activation of
on the oxidation of fatty acids (Deuster and Heled, 2008). S pathway was seemingly increased as well (+12%) after 21-days
Frontiers in Physiology | www.frontiersin.org 6 March 2021 | Volume 12 | Article 647822Arias-Reyes et al. Acclimatization to Hypoxia in Rodents
A
B
C
FIGURE 3 | Metabolic parameters of adult rats and mice in normoxia (Nx) or exposed to 6 h, 1, 7, or 21 days of hypoxia (Hx). Mice, but not rats, have an increase
in metabolic rate during the process of acclimatization to hypoxia. Mice show increased values of mass-corrected oxygen consumption (VO2; A) and mass-
corrected CO2 production (B) under hypoxia. The respiratory exchange ratio (RER) remains unchanged in mice and rats (C). *p < 0.05 and ***p < 0.001; #p < 0.05;
##
p < 0.01; and ###p < 0.001 vs. the control. n = 7–15.
hypoxia, and while the difference with the normoxic controls and p21d = 0.0253; Figure 4E). Rats and mice showed similar
was not statistically significant (RM ANOVA Fisher’s LSD test levels of activation (FCR) of the N pathway in normoxic and
p = 0.0548), the improved activation was significant in comparison hypoxic conditions, however, the S pathway was significantly less
to 1 and 7-days hypoxia levels (RM ANOVA Fisher’s LSD test active in mice than in rats when exposed to normoxia, 1 and
p1d < 0.0005; p7d < 0.0259; Figure 4D). Rats showed no alterations 7-days hypoxia (p1d < 0.0001; p7d < 0.001). This difference disappears
in oxygen consumption nor in the activation of electron-transfer after 21 days of hypoxia (p = 0.438). Similarly, the activation of
pathways during ET state (Figures 4A,B). When both species NS pathway was weaker in mice compared to rats in normoxic
were compared, mice showed higher OCRs during ET state than conditions and after 1 day of hypoxia (pctrl < 0.0001; p1d = 0.002).
rats in both normoxic and hypoxic conditions (RM ANOVA Differences disappear after 7 and 21 days of hypoxia (p7d = 0.303;
Fspecies_x_exposure = 10.42; d.f. = 7, 39; p < 0.0001), independently p21d = 0.315; Figure 4F). Finally, we measured the activity of
of the activation of S (Fisher’s LSD test pctrl = 0.023; p1d = 0.0018; complex IV, the final enzyme in the oxidation of oxygen, because
p7d = 0.0023; and p21d < 0.0001), NS (Fisher’s LSD test pctrl = 0.027; it is known to be structurally modified upon exposure to hypoxia.
p1d < 0.001; p7d < 0.001; and p21d < 0.0001), or NSF (Fisher’s In this regard, mice and rats were not different in normoxic
LSD test pctrl < 0.0001; p1d < 0.0001; p7d < 0.0001; and p21d < 0.0001) conditions, however, when under hypoxia, mice reached higher
pathways. The same occurred when only the N pathway was values independently of the time of exposure (Fisher’s LSD test
active after 1 and 21 days of hypoxia, however, no differences pctrl = 0.005; p1d < 0.0001; p7d < 0.0001; and p21d < 0.0001). Mice
were evidenced in normoxic control conditions and after 7-days significantly increased the activity of complex IV after 1 and
hypoxia (Fisher’s LSD test pctrl = 0.2216; p1d = 0.0486; p7d = 0.1649; 21 days-hypoxia in comparison to the normoxic group and showed
Frontiers in Physiology | www.frontiersin.org 7 March 2021 | Volume 12 | Article 647822Arias-Reyes et al. Acclimatization to Hypoxia in Rodents
A B
C D
E F
G
FIGURE 4 | Oxygen consumption rates (OCR) and activation of mitochondrial electron transport chain (ETC) pathways in liver tissue of adult rats and mice exposed
to normoxia (Nx) or 1, 7, or 21 days of hypoxia (Hx). The OCR was measured during inactive adenosine triphosphate (ATP) production (LEAK) or uncoupled electron
transfer (ET) fueled with substrates for the N (complex I), S (complex II), NS (complexes I&II), or NSF (complexes I&II and fatty acids oxidation) pathways. Activation
values represent the fraction of the ETC maximum capacity covered by the activation of N (complex I-linked), S (complex II-linked), or NS (complexes I&II) pathways.
OCR in rats’ liver-mitochondria is not affected by hypoxia (A). Likewise, rats showed no changes in the activation of N, S, or NS pathways in normoxic nor hypoxic
conditions (B). Mice increased its OCR (+44%) after 21-days hypoxia due to an overactivation of S pathway (complex II). Additionally, the maximum ETC capacity
(NSF pathway) was 70% increased after 21 days of hypoxia (C). A non-significant overactivation (+11%) of S pathway occurred in mice after 21 days of hypoxia
together with the increased activation of NS pathway (+20%; D). Mice have higher OCR levels than rats in normoxic and hypoxic conditions. This occurs mainly
because of higher S pathway (complex II) activities. The ETC maximum capacity in mice is higher in normoxia (+52%) and hypoxia (up to +69% at day 21) than in
rats (E). Rats show a higher activation of N, S, and NS mitochondrial pathways compared to mice during acclimatization to hypoxia prior 7 days of hypoxia. The
overactivation of S pathway in mice compensates for these differences after 21-days hypoxia (F). The overactivation of complex IV triggered by hypoxia hints to an
improved efficiency in oxygen use in mice but not in rats (G). *p < 0.05; **p < 0.01; and ***p < 0.001; #p < 0.05; ##p < 0.01; and ###p < 0.001 vs. the control. n = 4–6.
Frontiers in Physiology | www.frontiersin.org 8 March 2021 | Volume 12 | Article 647822Arias-Reyes et al. Acclimatization to Hypoxia in Rodents
control-like values at day 7 (Fisher’s LSD test p1d = 0.002; acute phase of exposure (6 h). This divergent ventilatory response
p7d = 0.329; and p21d < 0.0001). In contrast, rats had a transient between mice and rats may be explained by the higher protein
decline at day 1, then re-establishing normoxic control levels level of HIF-1α, in the brainstem (the region of the brain
(Fisher’s LSD test p1d = 0.0194; p7d = 0.636; and p21d = 0.9161; that contains the respiratory control network) after 6 h of
Figure 4G). hypoxic exposure (O2 12%) observed in mice but not in rats
(Jochmans-Lemoine et al., 2016). Contrary to our findings,
Schmitt et al. (1994) reported a continuous increase in VE
DISCUSSION until day 14 of hypoxic exposure in male SD rats, although,
animals were kept under lower (10%) oxygen concentration,
Our data show that mice and rats have divergent profiles of and it is well known that this affects the magnitude of the
ventilatory, hematological, metabolic, and mitochondrial hypoxic ventilatory response (Powell et al., 1998). Finally, despite
acclimatization to hypoxia. At ventilatory level, mice have an the changes observed in VE and fR, VT were only slightly
early and progressive augmentation in respiratory frequency affected by hypoxia in mice and not affected at all in rats.
and minute ventilation, while this response is limited in rats. Moreover, VT in mice was significantly higher than in rats in
On the other hand, the increase of hematocrit and hemoglobin normoxia and hypoxia, as we reported previously (Jochmans-
occurs only after 3 weeks of hypoxic exposure in mice. Rats Lemoine et al., 2015). Overall, these results show that mice
on the contrary, increased both hematological parameters during have a more plastic respiratory control system than rats.
the first day of hypoxia. Furthermore, while there is an elevation
of whole-body oxygen consumption and CO2 production in
mice, metabolism in rats remains unaffected. These changes Hematological Acclimatization Is Stronger
correspond well with the increased activity of the electron- and Quicker in Rats Than Mice
transfer pathways involving complex II (S pathway) in liver Increases in hematocrit and hemoglobin concentration are
mitochondria of mice, which is absent in rats. common hematological responses to hypoxic exposure in lowland
individuals (Bullard, 1972; Monge and Whittembury, 1976;
Ventilatory Adjustments in Mice Are More Monge and León-Velarde, 2003), helping to ensure the oxygen
Beneficial Than in Rats availability to supply tissues and organs. In this study, we found
We observed in FVB mice and SD rats, a rapid increase (after significantly increased hematocrit and hemoglobin levels after
6-h and 1-day hypoxia correspondingly) in respiratory frequency 21 days of hypoxia (12% O2) in comparison to normoxic
and ventilation, in agreement with previous observations in controls in mice (Ht = +26%, Hb = +14%) and rats (Ht = +26%,
our laboratory (Jochmans-Lemoine et al., 2016). This response Hb = +35%). Interestingly, in mice, values of Ht observed
is well-known to occur in mammals and birds (Storz et al., after 21 days of hypoxia were identical to those reported
2010) since hyperventilation contributes to limit the decrease previously for adult mice from high-altitude colonies (cf.
in alveolar oxygen partial pressure, thus supports oxygen Table 1). However, Hb levels in mice were higher than those
diffusion toward blood. In mice, such increase continued for reported at high altitude (Jochmans-Lemoine et al., 2015). It
7 days, reaching values of VE 2.6-fold and fR 2.1-fold control has been argued that the increase in Hb levels is classical in
levels. Similar sustained increasing trends in ventilation after lowland native species because mammals native to high altitude
different times of exposure to hypoxia have been observed in shows unchanged Hb levels upon hypoxic exposure (Monge
other species like the deer mice, pekin duck, and bar-headed and Leon-Velarde, 1991). Furthermore, genetic studies in “wild”
goose (Black and Tenney, 1980; Powell, 2007; Ivy and Scott, South American Mus musculus collected at sea level and high
2017). After 21 days of hypoxia, however, mice presented an altitude found no signs of natural selection in the locus coding
attenuation in VE and fR, a change hypothesized to for subunits alpha and beta of hemoglobin, in fact, both South
be advantageous for species living permanently under chronic American populations coincided genetically with European
hypoxia (i.e., high altitude) by reducing the oxygen cost of haplotypes, leading to the conclusion that high altitude residency
breathing when other adaptations are present (Powell, 2007). did not affect hemoglobin affinity for oxygen as an adaptive
At this point, both parameters were only 1.7 control levels trait in this species (Storz et al., 2007). These observations
and were about 30% lower than the values reported for FVB suggest that the hematological mechanisms of acclimatization
mice born and grown at 3,600 m of altitude (Jochmans-Lemoine to hypoxia in mice are triggered late and are constrained to
et al., 2015). In rats, VE and fR values were sustained around the first 21 days of hypoxic exposure. On the other hand,
1.6-fold control levels starting after 6 h and remained unchanged rats showed lower values of Ht and Hb in this study than
even at 21 days of hypoxia. Interestingly, the values of mass- those reported for high-altitude animals (Table 1) hinting that
corrected VE, we observed in rats after 6-h, 1-, 7-, and 21-days the hematological acclimatization in this species extends longer
hypoxia (VE6h = 3.4 ± 0.8; VE1d = 3.4 ± 0.6; VE7d = 3.9 ± 0.5; than 3 weeks. Another possibility is that the phenotype shown
and VE21d = 3.7 ± 0.9 ml/min/g0.8), were only 15–20% lower by adult rats in high-altitude colonies is also affected by changes
than those reported by Jochmans-Lemoine et al. (2015) in during gestation or development. The later was shown to be true
adult (2–3 months old) laboratory rats raised at high-altitude in adult SD rats (3 months-old) exposed to postnatal hypoxia
(4.5 ± 2.7 ml/min/g0.8), suggesting that the process of ventilatory (12% O2 for 10 days) as newborns. These animals developed
acclimatization to hypoxia in rats is somehow limited to the identical levels of Ht and Hb concentration to those observed
Frontiers in Physiology | www.frontiersin.org 9 March 2021 | Volume 12 | Article 647822Arias-Reyes et al. Acclimatization to Hypoxia in Rodents
in adult rats grown in high-altitude lab colonies (Lumbroso these changes occurred much earlier in rats. This suggests that
and Joseph, 2009; Jochmans-Lemoine et al., 2015). A limitation in mice the ventilatory compensations are sufficient to supply
of our study is that we did not evaluate the change in enough O2 during the first 3 weeks. In rats, however, the
cardiovascular parameters such as heart rate and arterial oxygen restricted ventilatory response accompanied by an early and
saturation (SaO2) along the process of acclimatization to hypoxia. persistent hematological modulation hint to an improper
It is known that cardiovascular features interact with respiratory compensation of the imbalanced ratio dO2/qO2. Consequently,
and hematological adjustments to counterbalance the diminished we explored the relations among the response patterns of VE,
oxygen availability. Indeed, the heart rate of SD rats living Ht, and VO2 by plotting these features against each other.
permanently at high altitude (3,600 masl) is seemingly increased We noticed distinct interactions between ventilatory,
compared to sea level animals. This does not occur in FVB hematological, and metabolic parameters in mice and rats. In
mice (Jochmans-Lemoine et al., 2015). mice, an initially large ventilatory response is withdrawn after
the day 7 of hypoxia in synchrony with the activation of
hematological adjustments (Figure 5B). Hematological tuning
Elevated Metabolic Rates in Mice Are during acclimatization to hypoxia is classically thought to
Supported by Coordinated Ventilatory and be triggered slightly later than respiratory modulations, and
Hematological Adjustments That Are is considered energetically more efficient than ventilatory and
Disjointed in Rats cardiovascular modifications (Monge and León-Velarde, 2003).
The metabolism of animals exposed to hypoxia has been Moreover, the enhanced ventilation accompanies the increased
classically pointed to be reduced as a strategy to save energy oxygen consumption up to a steady state reached at day 7 of
in conditions of limited oxygen availability (Scott et al., 2008; hypoxic exposure (Figure 5D). The latter is further supported
Storz et al., 2010). However, cumulative evidence shows that by augmented levels of hematocrit (Figure 5F), suggesting that
upon chronic hypoxic exposure metabolic rates can increase ventilatory mechanisms act early during the process of
in vertebrate species adapted to hypoxic conditions such as acclimatization of mice and are coordinately backed by subsequent
the deer mice and the bar-headed geese (Ward et al., 2002; hematological adjustments to ensure an enhanced oxygen supply.
Scott et al., 2008, 2018; Scott and Milsom, 2009; Ivy and Scott, Rats, however, have limited ventilatory adjustments, hence
2017). We found that in rats, hypoxia had no effect on the require stronger hematological compensations to cope with
O2 consumption and CO2 production rates, while these values hypoxic conditions. This is well illustrated by a clear threshold
increase in mice suggesting an increased metabolic expenditure in ventilation right after 6 h of hypoxic exposure while (red
linked with the mechanisms underlying hypoxia-acclimatization. dashed line in Figure 5), in contrast, continuously rising
The values of VO2, we found in our experiments after 21 days hematological adjustments are present for over 3 weeks
of hypoxia were about 20% lower than those observed in mice (Figure 5A). Likewise, although no significant statistical
born and grown in high-altitude colonies (see Table 1), suggesting correlation was found, negative correlation coefficients indicate
further margins to increase metabolic rates during permanent that VO2 is not further increased either by ventilatory or
residency at high altitude. However, body weights after 21 days- hematological modifications following the acute response
hypoxia are higher than in high-altitude animals (see Table 1), occurring in the first day of hypoxia (Figures 5C,E). The fact,
such difference may be due to the effects of hypoxia during we observed a concurrent acute initiation of ventilatory and
gestation and growth similar to those we described for SD hematological mechanisms in rats further supports the hypothesis
rats (Lumbroso and Joseph, 2009). Such metabolic upsurge that blood-level modifications play a more significant role
may also be interpreted as a compensatory mechanism to compared to ventilation in the acclimatization of rats.
restore the body temperature independently of the hypoxic
exposure. However, the metabolic rate (VO2) in mice was
augmented after day 7 and remained this way until day 21 Plasticity in Liver Mitochondria of Mice,
of hypoxia, while the rectal temperature was significantly lower but Not Rats, Permits a More Efficient Use
only at day 1. Interestingly, the VO2 values we observed after of Subcellular Oxygen in Hypoxic
21 days of hypoxic exposure in rats are much closer (less Conditions
than 10%) to those reported for high-altitude born and grown We used liver tissue to study the role of mitochondria in the
SD rats than they are for the FVB mice (Table 1), suggesting metabolic response to chronic hypoxia since this organ accounts
wider margins for plasticity of metabolic systems in mice for around 50% of the whole-body energy expenditure in mice
compared to rats. Moreover, after the rise in oxygen consumption and rats (Wang et al., 2012; Kummitha et al., 2014). We quantified
occurring at day 7 of hypoxia, VO2 was significantly higher the maximum capacity of the ETC by measuring the OCR
in mice than rats, similarly to what happens in high-altitude uncoupled from the ATP synthesis (Gnaiger et al., 2019).
acclimatized animals (Hochachka et al., 1983; Ivy and Scott, 2017). We did not find significant alterations in the mitochondrial
Notably, the forementioned ventilatory and hematological oxygen consumption in the liver of rats. Concurring with our
systems normally act in coordination to compensate any observations, Costa et al. (1988) found no changes in the
imbalance in the relation of oxygen demand and supply (dO2/ respiration of isolated liver-mitochondria after 9-months hypoxia
qO2) produced by hypoxia. Indeed, we observed increased levels (equivalent to 4,400 masl) in Wistar rats. Contrastingly,
of Ht and Hb in mice only after 21 days of hypoxia, while Pickett et al. (1979) observed a slight initial reduction in the
Frontiers in Physiology | www.frontiersin.org 10 March 2021 | Volume 12 | Article 647822Arias-Reyes et al. Acclimatization to Hypoxia in Rodents
A C E
B D F
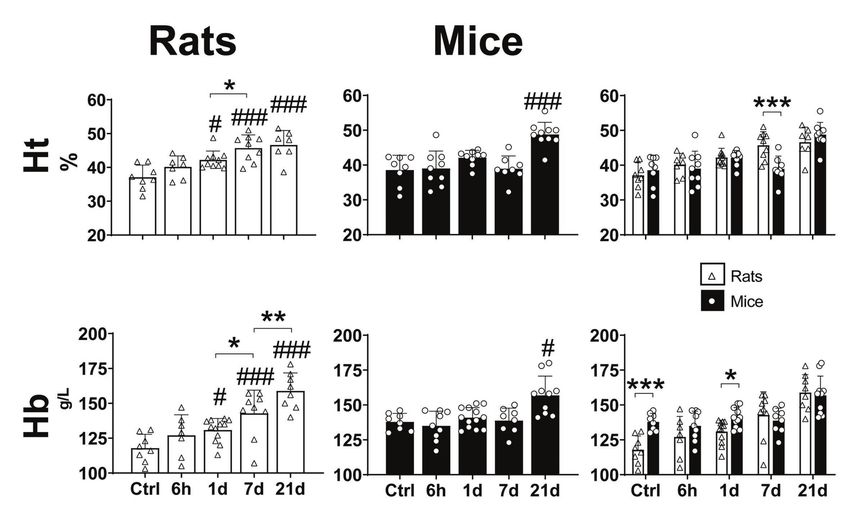
FIGURE 5 | Interaction between ventilatory and hematological parameters (A,B) and the effect of ventilatory (C,D) and hematological (E,F) parameters on the
whole-body oxygen consumption in adult rats and mice exposed to normoxia (Ctrl) or 1, 7, or 21 days of hypoxia. A metabolic increase (oxygen consumption – VO2)
in response to chronic hypoxia in mice is supported by cooperative changes in ventilatory and hematological systems. This outcome in rats is impaired due to a
limited ventilatory response evident after 6 h of hypoxia (dashed line), thus, requiring excessive hematological compensations to cope with hypoxic conditions.
activity of complex II during the first 2 weeks of hypoxia II, while complex I remains unchanged. Similar enhancement
with an outburst over normoxic levels around the third week of complex II activity in ETC under hypoxic exposure has
of normobaric hypoxia in SD rats. Of note, the levels of oxygen been reported in brain cortex of mice and hypoxia-resistant
used in this work were much lower than those we applied to rats (Lukyanova, 1997; Cáceda et al., 2001; Lukyanova et al.,
our animals (equivalent to 6,600 vs. 4,000 masl respectively), 2008; Lukyanova and Kirova, 2015). Contrary to complex I,
under these circumstances, the lack of response we found which is sensitive to drops in intracellular oxygen concentration,
suggests that liver mitochondria in rats may only respond to the activity of complex II is only dependent on the availability
extreme oxygen limitation. of its substrate: succinate (Hawkins et al., 2010). Remarkably,
Interestingly, we did see patterns in the liver mitochondrial in mammals, succinate is accumulated in mitochondria during
respiration of mice that coincide with features of species adapted hypoxia (Hohl et al., 1987; Cáceda et al., 1997; Lukyanova
to high-altitude hypoxia. Deer mice show augmented et al., 2018) and acts as a stabilizer of HIF-1α by attenuating
mitochondrial respiratory capacities in the diaphragm muscle the activity of the polyhydroxylases (PHDs; which mark HIF1-α
after exposure to hypoxia (equivalent to 4,300 masl for 6–8 weeks; for denaturation in normoxic conditions), thus supporting
Dawson et al., 2018; Scott et al., 2018). As well, in the acclimatization to hypoxia (Fuhrmann and Brüne, 2017). Also,
gastrocnemius muscle, this species have elevated expression succinate is involved with auxiliar (albeit less efficient) avenues
levels and activity of enzymes involved in fatty acid β-oxidation to produce ATP by (1) substrate phosphorylation (produces
and oxidative phosphorylation (Cheviron et al., 2012), and a GTP) catalyzed by succinate thiokinase and (2) the reduction
higher density of subsarcolemmal mitochondria (Mahalingam of oxalacetate to succinate that is coupled with the reverse
et al., 2017). HA native deer mice can maintain high metabolic reaction of malate dehydrogenase and the concomitant electron
rates during acclimatization to hypoxia (Cheviron et al., 2012; transfer to the ETC via complex I (Cáceda et al., 2001). Complex
Ivy and Scott, 2017). This occurs either in field conditions at II (succinate dehydrogenase) participates in the second
HA (Hayes, 1989) or in response to cold exposure (Cheviron mechanism. Moreover, complex II is also the gateway for cytosolic
et al., 2012). These biochemical changes are supported by high NADH to enter mitochondria via the glycerophosphate shuttle
capillarity and oxidative fiber density (Lui et al., 2015), and and for the reduced equivalents from fatty acids oxidation, that
result in elevated mitochondrial respiratory capacities way having a great participation in ATP production. Accordingly,
(Mahalingam et al., 2017). In our mice, liver mitochondria the fatty acids metabolism has been suggested to be augmented
show an increased ETC maximum capacity (NSF pathway) after in high-altitude conditions (León-Velarde and Arregui, 1994).
3-week hypoxia propelled by an increased activity of complex Overall, this supports the notion that an increased CII activity
Frontiers in Physiology | www.frontiersin.org 11 March 2021 | Volume 12 | Article 647822Arias-Reyes et al. Acclimatization to Hypoxia in Rodents
as reported here would promote a more efficient O2 utilization acclimatization to hypoxia. The phylogeographic origin of M.
by liver mitochondria in mice. Indeed, the increased activity musculus lies in the Irani-, Iraqi-, and Pakistani-Himalayan
of complex II is regarded as an “evolutionarily formed, urgent, region, from where they initially colonized European and
protective, regulatory, and compensatory mechanism” occurring Asian lands by successfully overcoming migrations across
in most tissues upon hypoxic exposure and during acclimatization mountain chains facing high-altitude challenges and certainly
(Lukyanova and Kirova, 2015). Contrastingly, Leon-Velarde et al. undergoing processes of natural selection (Bonhomme and
(1986) reported no changes in the respiration of isolated liver Searle, 2012). On the contrary, R. rattus originated in India
mitochondria in Swiss mice exposed to hypobaric hypoxia and South-Asia, and dispersed towards lowlands evading the
(equivalent to 4,400 masl) for 90–120 days concluding that northern mountain passes (Aplin et al., 2011). Even more
isolated mitochondria are not suitable to perform experiments contrastingly, R. norvegicus are original from the lowlands of
on the effects of hypoxia. However, the exposure period they central China and their expansion occurred almost strictly
tested is long enough to allow mitochondrial ETC to recover linked to human migration in recent historic times (Song
levels of respiratory complexes activity seen in normoxic animals et al., 2014; Puckett et al., 2016). Together with our present
(Lukyanova and Kirova, 2015). Finally, we learned that liver and past (Lumbroso and Joseph, 2009; Lumbroso et al., 2012;
mitochondria in mice consume more oxygen than their Jochmans-Lemoine et al., 2015, 2016, 2018; Jochmans-Lemoine
counterparts in rats regardless of the availability of oxygen and and Joseph, 2018) results, this phylogeographic pattern strongly
the active electron-transfer pathways. This may explain, at least supports the hypothesis of mice being pre-adapted to
in part, the higher whole-body O2 consumption in mice compared high-altitude hypoxia.
to rats. Interestingly, during normoxia and the first day of We conclude that FVB mice and SD rats develop divergent
hypoxic exposure, the activation of S and NS pathways is lower physiological and mitochondrial mechanisms of acclimatization
in mice than in rats, however, by day 7 of hypoxia such difference to hypoxia. Mice have an adaptive response with adjustments
in activation disappears hinting to the existence of a “spare in oxygen capture, distribution, and utilization that allow them
capacity” in the liver mitochondrial ETC, a feature observed to maintain an unaltered or even increased whole-body and
in other tissues in high-altitude-adapted species (Storz et al., liver-mitochondrial metabolism. On the contrary, rats deploy
2010; Lukyanova and Kirova, 2015). Overall, the higher plasticity an excessive and detrimental alteration in oxygen transport
during acclimatization to hypoxia in mice supports our hypothesis systems in blood and fail to trigger adjuvant ventilatory,
of a genetic background supporting the ability of mice to cope metabolic, and subcellular procedures, therefore, presenting a
with hypoxia, which is limited or absent in rats. deficient acclimatizing response. The adaptive adjustments during
the process of acclimatization of mice may explain, at least
Why Mice Respond Better to Chronic in part, their ability to colonize high-altitude habitats in contrast
Hypoxia Than Rats? to rats and further supports the hypothesis that mice are
Whereas cellular mechanisms work generally at maximum pre-adapted to high-altitude hypoxia.
efficiency, especially in the context of energy generation and
expenditure, there are cases when “spare” room for further
improved efficiency remains as genetical vestiges from ancient DATA AVAILABILITY STATEMENT
more demanding circumstances. This confers populations the
capacity to invade new ecological niches thanks to previously The raw data supporting the conclusions of this article will
acquired appropriate structural and/or functional changes, with be made available by the authors, without undue reservation.
the concomitant emergence of multiple “adaptive peaks” (Griffiths
et al., 2000), a process called “pre-adaptation” (Monge and
León-Velarde, 2003). Indeed, the acclimatizing mitochondrial ETHICS STATEMENT
traits, we observed in mice have been previously posed as
well-adaptive or as distinctive from high-altitude adapted species The animal study was reviewed and approved by Animal
(Lukyanova, 1997; Lukyanova and Dudchenko, 1999; Cáceda Protection Committee of Université Laval, Québec, Canada.
et al., 2001; Czerniczyniec et al., 2015; Lukyanova and Kirova,
2015). On the other hand, acclimatizing changes at systemic
level in rats are almost exclusively reliant on hematological AUTHOR CONTRIBUTIONS
adjustments, a strategy that has been tagged as disadvantageous
due to its limitations to compensate for the reduced levels of CA-R performed all the experiments and data analyses. CA-R,
oxygen delivery, and instead causing stress to the cardiovascular JS, and VJ wrote and approved the manuscript. All authors
system (Lumbroso and Joseph, 2009; Storz et al., 2010; Lumbroso contributed to the article and approved the submitted version.
et al., 2012) on top of the inadequate or inexistent ventilatory,
metabolic, and mitochondrial responses.
Mice (Mus musculus) and rats (Rattus rattus and Rattus FUNDING
norvegicus) are species with very different natural and
phylogeographical histories, this can perfectly justify the This study was funded by the Natural Sciences and Engineering
physiological differences found in their mechanisms of Council of Canada (NSERC RGPIN-2019-06495). CA-R receives
Frontiers in Physiology | www.frontiersin.org 12 March 2021 | Volume 12 | Article 647822You can also read