Changes of Quality of Minimally-Processed Pineapple (Ananas comosus, var. 'Queen Victoria') during Cold Storage: Fungi in the Leading Role - MDPI
←
→
Page content transcription
If your browser does not render page correctly, please read the page content below
microorganisms
Article
Changes of Quality of Minimally-Processed
Pineapple (Ananas comosus, var. ‘Queen Victoria’)
during Cold Storage: Fungi in the Leading Role
Charlène Leneveu-Jenvrin 1, *, Baptiste Quentin 1 , Sophie Assemat 2,3 , Mathilde Hoarau 2,3 ,
Jean-Christophe Meile 2,3 and Fabienne Remize 1
 1   QualiSud, Univ de La Réunion, CIRAD, Univ Montpellier, Montpellier SupAgro, Univ d’Avignon,
     2 rue J. Wetzell, F-97490 Sainte Clotilde, France; b.quentin2605@gmail.com (B.Q.);
     fabienne.remize@univ-reunion.fr (F.R.)
 2   CIRAD, UMR QualiSud, F-97410 Saint Pierre, La Réunion, France; sophie.assemat@cirad.fr (S.A.);
     meile@cirad.fr (M.H.); jean-christophe.meile@cirad.fr (J.-C.M.)
 3   QualiSud, Univ Montpellier, CIRAD, Montpellier SupAgro, Univ d’Avignon, Univ de La Réunion,
     F-34000 Montpellier, France
 *   Correspondence: charlene.leneveu@univ-reunion.fr

 Received: 6 December 2019; Accepted: 27 January 2020; Published: 28 January 2020

 Abstract: Minimally-processed pineapple stored under refrigerated conditions is highly perishable.
 We aimed to characterize the evolution of physicochemical, sensory and microbiological quality
 during cold storage. Pineapple batches were sampled from several locations in Reunion Island and
 then minimally processed. In the processing step, the variability of firmness and counts of yeasts
 and molds were observed. Moreover, correlations between the sampling season and pH and b* color
 component, as well as between fungal population and b* parameter were observed. During storage,
 the visual aspect of pineapple cuts changed to brown and shiny, whereas olfactive descriptors shifted
 from fruity descriptors and fresh to fermented, alcoholic and milky. The values for pH, TA and TSS
 did not significantly vary according to storage time. A decrease in firmness and C* color parameter
 was observed. Yeast and mold counts were significantly higher after 7 days of storage. The diversity
 in yeasts and molds was mainly dependent on the considered batches observed from PCR-DGGE
 profiles. Fungal species were isolated from spoiled pineapple cuts. The implication of Penicilllium
 citrtrinum, Talaromyces amestolkiae, Rhodotorula mucilaginosa, Saccharomyces cerevisiae, and Meyerozyma
 caribbica in the spoilage of minimally-processed pineapple cuts was further demonstrated.

 Keywords: fruit; microbiological quality; sensory quality; fresh-cut

1. Introduction
     Fruit and vegetable consumption has considerably increased in the past decade. In fact, they have
now become an essential part of the human diet. Pineapple (Ananas comosus) is appreciated for its taste
and juiciness. It presents many nutritional benefits, being a good source of antioxidants, especially
polyphenols, minerals, vitamin C, vitamin A, and vitamin B6 [1,2].
     Minimally-processed fruits are attractive for consumers as they are perceived as healthy, fresh
and convenient for use [3]. However, their shelf-life is short, typically a few days under refrigeration,
because of physiological and microbiological disorders resulting from cutting the fruit.
     Many attempts have been made to increase minimally-processed pineapple shelf-life [4].
Controlled storage temperature and modified atmosphere packaging are the most used technologies
to preserve the quality of minimally-processed fruit [5–9]. Edible coatings can also prolong its
shelf-life [7,10]. Physical treatments, such as UV-C, heat, ultrasound or high pressure inert gas,

Microorganisms 2020, 8, 185; doi:10.3390/microorganisms8020185          www.mdpi.com/journal/microorganisms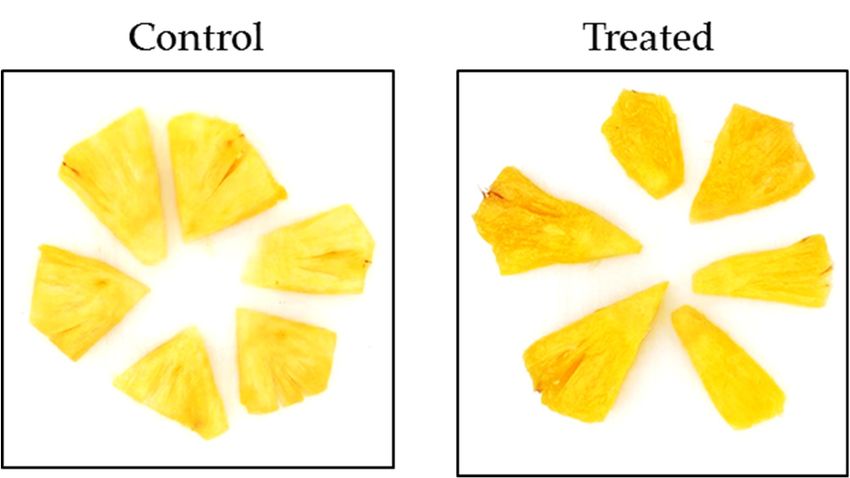
Microorganisms 2020, 8, 185 2 of 17
to preserve the quality of minimally-processed fruit [5–9]. Edible coatings can also prolong its shelf-
Microorganisms 2020, 8, 185 2 of 18
life [7,10]. Physical treatments, such as UV-C, heat, ultrasound or high pressure inert gas, successfully
enhanced the shelf-life of minimally-processed pineapple [11–14]. These treatments probably affected
fruit enzymeenhanced
successfully activitiesthe involved
shelf-life in ofthe respiration rate, browning
minimally-processed pineapple and metabolism
[11–14]. These of phenolic
treatments
compounds.
probably Thefruit
affected growth
enzyme of microorganisms,
activities involvedeither in thethe natural rate,
respiration florabrowning
[7,10], yeasts isolated from
and metabolism of
spoiled pineapple [6] or foodborne pathogens [10] was modulated by
phenolic compounds. The growth of microorganisms, either the natural flora [7,10], yeasts isolated from the above-mentioned
treatments.
spoiled pineapple [6] or foodborne pathogens [10] was modulated by the above-mentioned treatments.
The impact
The impact of of these
these technologies
technologies was was also
also determined
determined on on respiration
respiration rate,
rate, firmness
firmness degradation
degradation
and color changes, especially for L* and b*, which decrease reveals
and color changes, especially for L* and b*, which decrease reveals translucency of fruit pieces translucency of fruit[5,7,12].
pieces
[5,7,12]. However, above all, special attention was paid to sensory properties
However, above all, special attention was paid to sensory properties and volatile compounds involved and volatile compounds
involved
in in the pineapple
the pineapple aroma [2].aroma From [2]. From sixcultivars,
six different different 83cultivars,
volatile83 volatile compounds,
compounds, including including
15 esters
15 esters and 57 alkenes, were detected [2]. Different volatile compounds
and 57 alkenes, were detected [2]. Different volatile compounds were shown to be involved were shown to be involved
in the
in the[2,6,8].
aroma aromaDuring[2,6,8].theDuring
storagethe storage of minimally-processed
of minimally-processed pineapple, anpineapple,
increase inan increase in
concentration
concentration
of of ethanol,
ethanol, ethylacetate, ethylacetate,and
acetaldehyde, acetaldehyde,
methyl esters and methyl esters
of carboxylic acidsofwascarboxylic
noticed in acids was
several
noticed in several studies [6,8,15]. However, some discrepancies were
studies [6,8,15]. However, some discrepancies were observed in other volatile compounds detected, observed in other volatile
compounds
possibly detected,
in relation possibly
to cultivar in relation
or storage conditions.to cultivar
The increaseor in
storage conditions.
concentration The compounds
of volatile increase in
concentration of volatile compounds observed during storage can
observed during storage can result either from living tissue metabolism or production by yeastsresult either from living tissue
[6].
metabolism or production by yeasts [6]. The main difference in samples
The main difference in samples stored under different conditions was attributed to a sensory panel stored under different
conditions
to was attributed
odor, especially with theto“fermented”
a sensory panel to odor,[6].
descriptor especially
However, withWutheet “fermented”
al. (2012) [11]descriptor
noticed that[6].
However, Wu et al. (2012) [11] noticed that most differences were detected
most differences were detected in appearance and flavor between control and high-pressure treated in appearance and flavor
between control
pineapple cuts. and high-pressure treated pineapple cuts.
The present
The present studystudy aimed
aimed to todescribe
describethe theinitial
initialphysicochemical,
physicochemical, sensory
sensory and and microbiological
microbiological
qualities of minimally-processed ‘Queen Victoria’ pineapple and
qualities of minimally-processed ‘Queen Victoria’ pineapple and their changes upon storage their changes upon storageat at44°C.
◦ C.
AAfocus
focuswas
wasput putononthethe diversity
diversity of of yeasts
yeasts andand molds
molds and
and the
the modulation
modulation of of the
the encountered
encountered species
species
according to the sample and the
according to the sample and the storage time. storage time.
2. Materials
2. Materials and
and Methods
Methods
2.1.
2.1. Fruits
Fruits Preparation
Preparation
‘Queen
‘QueenVictoria’
Victoria’pineapples
pineappleswere
werecollected from
collected different
from locations
different in Reunion
locations Island
in Reunion (Figure
Island 1) over
(Figure 1)
2over
years2(2017–2019). LocationsLocations
years (2017–2019). mostly differed
mostly in differed
their annual
in rainfall: West location
their annual rainfall:isWest
characterized
locationby is
very low rainfall
characterized by(500–1000
very lowmm), South
rainfall and North
(500–1000 mm),locations by moderate
South and rainfall (1250–2000
North locations by moderate mm), and
rainfall
East locationmm),
(1250–2000 by veryandhigh rainfall
East (2000–3000
location by verymm). highAverage
rainfall daily solar radiation
(2000–3000 is high (1700–2100
mm). Average daily solar
J/cm 2 ) in all locations. In Reunion
radiation is high (1700–2100 J/cm²) inIsland, only two
all locations. seasonsIsland,
In Reunion are observed:
only twowinter
seasonsfrom April to
are observed:
September,
winter fromand summer
April from October
to September, to March.
and summer from October to March.
Figure1.1.Map
Figure Mapof Reunion IslandIsland
of Reunion with sampling locationslocations
with sampling (black stars). Fourstars).
(black locations were
Four differentiated
locations were
based on annual
differentiated cumulative
based rainfall
on annual on yearrainfall
cumulative 2017. Source:
on yearMeteo France. Meteo France.
2017. Source: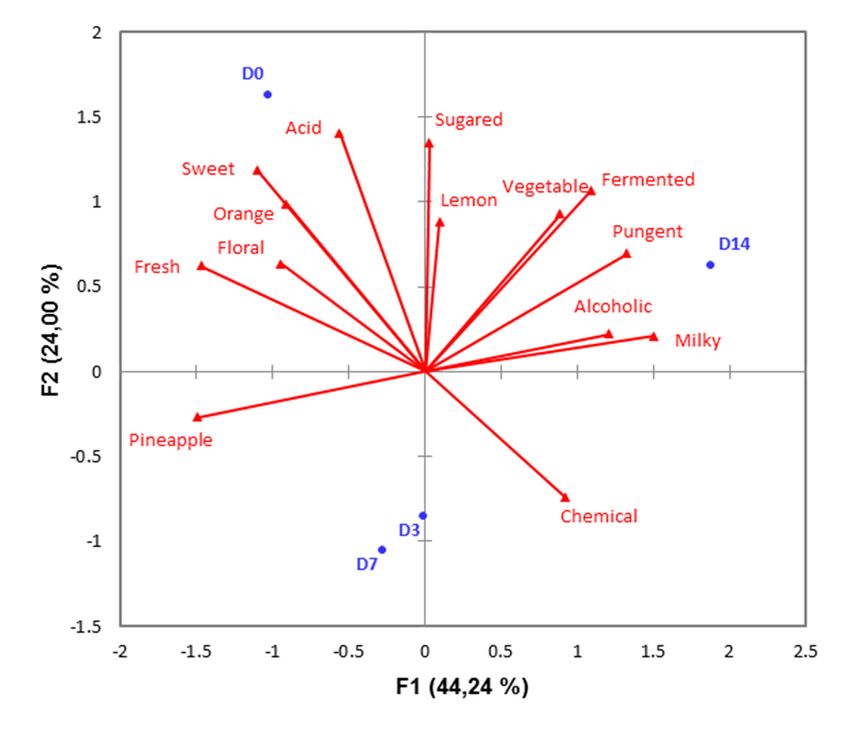
Microorganisms 2020, 8, 185                                                                        3 of 18

     For each sampling date and origin, at least three pineapples with similar maturity levels were
picked up (Table 1).

              Table 1. Pineapple sample names, sampling location and month of sampling (season).

                              Samples        Location                  Date
                                V0             East           October 2017 (summer)
                               CP1             East           March 2018 (summer)
                               VSA             East             May 2018 (winter)
                               CP3             East             June 2018 (winter)
                               VSA2            East             June 2018 (winter)
                               VET             East             July 2018 (winter)
                               VRO             East             July 2018 (winter)
                               VGA             East             July 2018 (winter)
                               CP01            West           October 2017 (summer)
                               CP02            West           October 2017 (summer)
                                V3             West           March 2018 (summer)
                               CP2             West             April 2018 (winter)
                                V5             West             April 2018 (winter)
                               VSL             West             May 2018 (winter)
                                V7             West             May 2018 (winter)
                               VSL2            West             June 2018 (winter)
                               CP03           North         December 2017 (summer)
                                BP             South          March 2018 (summer)
                                V1             South          March 2018 (summer)
                                V2             South          March 2018 (summer)
                                V4             South            April 2018 (winter)
                                V6             South            May 2018 (winter)
                               TP1             Any            January 2019 (summer)
                               TP2             Any           February 2019 (summer)
                               TP3             Any              May 2019 (winter)

     In addition, three samples were collected from a local producer of minimally-processed fruit and
vegetables (Table 1).
     Within 24 h after collection, the fruits were manually peeled and cut into pieces of ca. 3 × 2 cm.
Pieces from different pineapples were manually mixed and further shared into commercial freezer
bags. Each bag contained ca. 100 g of fruit and was stored at 4 ◦ C until analysis. One bag was used for
each time point of analysis.

2.2. Fruit Quality Determination

2.2.1. Microbiology
     Prior to analysis, 30 g of fruits were collected from freezer bags and mixed with 30 mL of SPW
(saline peptone water, Condalab, Torrejón de Ardoz, Madrid, Spain) in a stomacher for 1 min at
maximal speed. For microbial analysis, serial decimal dilutions were performed in SPW. Enterobacteria
were enumerated on VRBG agar (Biokar diagnostic, Solabia, Allonne, France) after incubation for 48 h
Microorganisms 2020, 8, 185 4 of 18
at 37 ◦ C. Psychrotrophic bacteria were enumerated on nutrient agar (Merck, Darmstadt, Germany)
incubated for 3 days at 10 ◦ C. Yeasts and molds enumeration was performed on Sabouraud glucose
agar with 100 mg/L chloramphenicol (Biokar diagnostic, Solabia, Allonne, France) after incubation at
30 ◦ C for 5 days. Yeast and molds were isolated under the same conditions.
2.2.2. Physicochemical
pH value was measured by a pH meter (5231 Crison, and pH-meter Model GLP22, Crison Instruments
S.A. Barcelona, Spain), and the titratable acidity (TA) was determined by titration with 0.05 M NaOH
(TitroLine easy, Schott, Mainz, Germany). TA was expressed as citric acid equivalents in g/100 mL.
Pineapple total soluble solids (TSS), expressed as Brix degrees (◦ Brix), were determined with a
hand refractometer (Atago, Tokyo, Japan) at room temperature.
Three color determinations were performed for each sample (12 mL of mixture) with a
spectrophotometer CM 3500d (Minolta® , Carrières-sur-Seine, France). Measured color parameters
were L*, a* and b*. Numerical values of a* and b* were converted into a saturation variable or chroma:
q
C∗ = (a ∗2 +b∗2 ) (1)
and in a measure of chromaticity, the hue angle:
h◦ = arctan(b ∗ /a∗) (2)
Color difference: q
∆E = (L ∗e −L∗c )2 + (a ∗e −a∗c )2 + (b ∗e −b∗c )2 (3)
in which L*e , a*e and b*e refer to the assay condition; and L*c , a*c and b*c to the control condition,
which was calculated with the initial color as control.
Texture analysis was performed with a TA-TX2® texture analyzer (Stable Micro Systems Ltd.,
Godalming, UK) equipped with a 5 kg load cell. A 2-mm diameter rod was used to penetrate the
pineapple wedge sample at a test speed of 0.5 mm/s. The maximum penetration force was measured
and taken as firmness (N). Three pieces of pineapple were randomly withdrawn from each bag to carry
out repeats.
2.3. Spoilage Assays
Nine fungal isolates were collected from pineapple cuts and identified (Table 2). Their ability to
spoil commercial pineapple juice (pasteurized, LawLam® ) was assayed by the inoculation of juice
and observation of changes during storage. Ten milliliters of juice were inoculated with ca. 4.6 log
CFU/mL of each fungal isolate and stored for 7 days at 4 ◦ C. Fungal enumeration and observation of
color modification, gas production and off-odors production were performed to detect spoilage activity.
This detection was performed in triplicate.
To confirm the ability of each isolate to spoil minimally-processed pineapple, selected isolates
were separately prepared and used for inoculation. Pineapple cuts were dipped in an aqueous solution
containing ca. 4.6 log CFU/mL of fungal spoilage cocktail (1:2 w/v) for 5 min at 150 rpm. Afterwards,
they were drained and packaged (100 ± 2 g) in freezing bags and stored for 7 days at 4 ◦ C. Fruit quality
was then determined.Microorganisms 2020, 8, 185 5 of 18
Table 2. Identification of fungal isolates.
Sampling Fragment Identity Accession
Name Identification E-Value
Source (pb) (%) Number
R Penicillium citrinum VSL-D14 339 98 6.0 × 10−134 MN046972.1
S Penicillium citrinum VSA-D14 426 100 0.0 MN653150.1
A Rhodotorula mucilaginosa CP1-D7 234 100 2.0 × 10−117 MN535021.1
C Saccharomyces cerevisiae BP-D3 507 99 1.0 × 10−161 MN244399.1
D Meyerozyma caribbica V2-D7 330 100 1.0 × 10−170 MN658754.1
F Meyerozyma caribbica VSL-D3 268 99 6.0 × 10−133 MN658754.1
H Meyerozyma caribbica CP1-D3 320 100 4.0 × 10−165 MN416286.1
I Meyerozyma caribbica BP-D3 274 100 1.0 × 10−139 MN658754.1
20 Talaromyces amestolkiae TP1-D3 159 95.6 4.0 × 10−64 MN549518.1
2.4. Sensory Quality Characteristics
Sensory quality of ripe pineapple cuts was carried out by a panel of trained judges. Pineapple
cuts were placed at room temperature 1 hour before sensory analysis. Three pieces per sample were
randomly served and arranged on the plate for evaluation. Each sample was coded differently, with a
three-digit code.
Descriptive profiles were determined for each sample. Preliminary sessions enabled to generate a
descriptive pineapple vocabulary. An 11-point scale between 0 and 10 was used to rate the intensity
of the different sensory criteria. The ISO 11035 (Sensory analysis—Identification and selection of
descriptors for establishing a sensory profile by a multidimensional approach) method was employed.
Two distinct tests were used to determine if there was a detectable difference between two products
A and B: the two/five test and the triangle test. In the two/five test, samples from the same batch stored
for 0, 3, 7 or 14 days were compared. The triangle test was used to compare the control sample and
sample treated with the selected fungal cocktail, both after 7 days of storage according to the sensory
method described by ISO 4120-2004 (Sensory analysis–Methodology–Triangle test).
2.5. Molecular Biology Methods
2.5.1. DNA Extraction
DNA was extracted for each pineapple sample from the SPW suspension prepared for microbial
counting. To achieve extraction, 2 mL of the suspension (stored at −80 ◦ C) were collected in two
microtubes and centrifuged at 14,000× g during 2 min. DNA extractions were carried out on the
assembled pellets according to procedure described by MP Biomedicals® (llkirch, France) with the
FastDNA kit and the FastPrep-24 Instrument using Lysing Matrix A and Lysis buffer CL-Y.
2.5.2. PCR-Denaturing Gradient Gel Electrophoresis (DGGE)
The following DNA primers were used to amplify a region of the fungal ITS: GC-ITS1F
(CGCCCGCCGCGCGCGGCGGGCGGGGCGGGGGCACGGGGGGCTTGGTCATTTAGAGGAAGTAA)
and ITS4 (TCCTCCGCTTATTGATATGC) primers [16]. A 40-pb GC-clamp was added to the forward
primer in order to ensure that the fragment of DNA remains partially double stranded and that the
region screened is in the lowest melting domain [17].
PCR amplification reaction was performed in a final volume of 50 µL containing 0.6 µM of
each primer, all the deoxyribonucleotide triphosphate (dNTPs) at 200 µM, 2 mM of MgCl2 , 10 µL of
5X Taq reaction buffer (Promega, Charbonnières-les-Bains, France), 1.25 U of Taq DNA polymerase
(Promega), and 1 µL of extracted DNA. PCR amplification reactions were carried out as follows: an
initial denaturation at 95 ◦ C for 2 min, 40 cycles at 95 ◦ C for 15 s, 57 ◦ C for 30 s and 72 ◦ C for 45 s,
and final extension at 72 ◦ C for 5 min. The PCR reactions were performed in a Thermocycler (Veriti,
Applied Biosystems, Thermo Fisher Scientific, Loughborough, UK). Aliquots (5 µL) of PCR products
were checked by electrophoresis migration in 2% (w/v) agarose gel with 1× TAE buffer (40 mM Tris-HClMicroorganisms 2020, 8, 185 6 of 18
pH 7.4, 20 mM sodium acetate, 1.0 mM Na2 -EDTA). After running at 100 V for 45 min, the gels were
stained with ethidium bromide solution (50 µg/mL in TAE 1×) and quantified using a standard (DNA
mass ladder 100 bp, Promega).
The PCR products were separated by DGGE using a Cleaver Scientific system (Cleaver Scientific,
Rugby, Warwickshire, UK). Briefly, 30 µL of PCR amplicons were loaded onto 8% (w/v) polyacrylamide
gels (acrylamide: N,N-methylene bisacrylamide, 37.5:1, Promega) in 1× TAE buffer (40 mM Tris-HCl
pH 7.4, 20 mM sodium acetate, 1.0 mM Na2 -EDTA). Electrophoresis was performed at 60 ◦ C using a
denaturing gradient ranging from 40% to 70% (100% corresponded to 7 M urea and 40% v/v formamide,
Promega). The gels were run at 20 V for 10 min and then at 80 V for 16 h. After electrophoresis, the gels
were stained for 1 h with ethidium bromide solution (50 µg/mL in 1× TAE), rinsed for 1 h in distilled
water, and then photographed on a UV transilluminator (Bio-Rad, Marnes-la-Coquette, France). Bands
of interest were cut, and the DNA was extracted. Electrophoretic profiles were analyzed with Phoretix
1D Pro software (Totallab, Newcastle-Upon-Tyne, UK), which considers band presence and relative
intensity on the line. Nearest Neighbor algorithm and Pearson coefficient correlation were used to
build the dendrogram.
Detected bands were cut from the DGGE gel with a sterile scalpel as described previously [18].
Briefly, the DNA of each band was then eluted in 100 µL of TE buffer (10 mM TrisHCl; 1 mM EDTA;
pH 7.4, Sigma-Aldrich, Lyon, France) at 4 ◦ C overnight. DNA was precipitated by adding 1/10 volume
of sodium acetate (3 M, pH 5), 1µL of glycogen (Molecular Grade, Roche Diagnostics, Meylan, France),
and 300 µL of isopropanol and centrifuged at 15,000× g for 30 min at 4 ◦ C. The supernatant was
discarded, DNA pellets were washed with 500 µL 70% ethanol and after 5 min of centrifugation, the
DNA pellets were air dried for 1 h. Finally, the DNA was re-suspended in 20 µL of ultrapure water
and stored at −20 ◦ C.
2.5.3. Identification
DNA primers ITS1F (CTTGGTCATTTAGAGGAAGTAA) and ITS4 were used to amplify a region
of the fungal ITS [16]. PCR amplification reaction was performed in a final volume of 50 µL containing
0.3 µM of each primer, all the deoxyribonucleotide triphosphate (dNTPs) at 200 µM, 1.5mM of MgCl2 ,
10 µL of 5× Taq reaction buffer (Promega), 1.5 U of Taq DNA polymerase (Promega), and 1 µL of
extracted DNA. PCR amplification reactions were carried out as follows: an initial denaturation at 95
◦ C for 2 min, 40 cycles at 95 ◦ C for 15 s, 53 ◦ C for 30 s and 72 ◦ C for 45 s, and final extension at 72 ◦ C
for 5 min. The PCR reactions were performed in a Thermocycler (Veriti, Applied Biosystems, UK).
Aliquots (5 µL) of PCR products were analyzed by electrophoresis in 2% (w/v) agarose gel with 1× TAE
buffer (40mM Tris-HCl pH 7.4, 20mM sodium acetate, 1.0mM Na2 -EDTA).
After running at 100 V for 45 min, the gels were stained with ethidium bromide solution (50 µg/ mL
in TAE 1×) and quantified using a molecular weight marker (100 bp DNA ladder, Promega).
The PCR products were sent to Macrogen (Amsterdam, The Netherlands) for sequencing. For each,
purification was applied, and sequencing was carried out on PCR products using ITS1F or ITS4 primers.
The sequences obtained were aligned with BioEdit software (Sequence Alignment Editor version
7.1.3.0, Freeware Copyright 1991–2007 Tom Hall) followed by a BLAST similarity search.
2.6. Statistical Analysis
The XLSTAT software (Addinsoft, Paris, France) was used for statistical analyses.
One-way variance analysis (ANOVA) was performed with a p-value of 0.001. The Ryan-Einot-
Gabriel-Welsh F (REGWQ) test was used for pair-wise comparisons.
A correlation test for quantitative variables was performed with Kendall’s tau coefficient with a
p-value of 0.05. The correlation between one quantitative and one qualitative variable was investigated
with the biserial correlation method, using the Monte-Carlo simulation.
Word cloud was used to visualize the frequency of descriptors chosen by the panel for samples with
the same duration of cold storage: Word font size is proportional to frequency. K-means classificationMicroorganisms 2020, 8, 185 7 of 18
was used to gather samples into classes according to their description with quantitative variables.
Two-dimension principal component analysis (PCA) plot was used to represent variables (olfactive
descriptors), observations (minimally-processed pineapple stored for 0, 3, 7 or 14 days) and their
relatedness and distance.
3. Results
3.1. Freshly Prepared Minimally-Processed Pineapple Characteristics
A sensory analysis was performed to assign descriptors to freshly minimally-processed samples.
The major color descriptor was “yellow”, and olfactive descriptors were, in descending order of
frequency of occurrence, “pineapple”, “fresh”, “fruity”, “pomegranate”, “red fruit”, “citrus”, and
“sugared”. These olfactive descriptors are primarily related to fruity characteristics. This is consistent
with previous studies showing the role of methyl esters and lactones in the typical fruity flavor of
pineapple [19,20].
The 25 pineapple batches were independently minimally-processed. For each, pH, TA, TSS,
firmness, L*, a*, and b*, color parameters were determined on the day of processing. Psychrotrophic
bacteria, enterobacteria, as well as yeasts and molds were counted. Table 3 shows mean values and
data dispersion between batches.
Table 3. Values and dispersion of physicochemical parameters and microbiological counts of
minimally-processed pineapple batches.
Standard Minimum Maximum
Parameter Mean ±
Deviation Value Value
pH 3.44 ± 0.27 3.09 4.20
TA (g/100 mL) 0.87 ± 0.20 0.68 1.33
TSS (◦ Brix) 14.6 ± 1.5 11.1 17.8
L* 36.7 ± 6.6 32.1 65.3
a* 10.3 ± 2.1 6.3 13.3
b* 50.4 ± 5.7 38.8 59.7
Chroma 51.5 ± 5.6 39.6 60.2
Hue angle 11.6 ± 2.5 6.3 15.3
Firmness (N) 3.8 ± 1.2 2.0 6.7
Psychrotrophic bacteria (log CFU/g) 3.7 ± 0.6 3.3 1 5.4
Enterobacteria (log CFU/g) 3.8 ± 0.6 3.0 2 5.3
Yeasts & Molds (log CFU/g) 4.4 ± 0.7 3.0 5.8
1and 2 : the indicated values correspond to the detection level. For psychotropic bacteria, 14 batches showed counts
below this level. For enterobacteria, four batches showed counts below this level.
The pH values varied between 3.09 and 4.20, and 64% of them ranged between 3.3 and 3.8. Similarly,
for TA, 68% of values were in the range 0.73 and 0.98 g/100 mL. The values for pH, TA, and TSS were
in accordance with previously published data of carbohydrate content of pineapple [1,2,7,10,21,22].
Firmness range was large, from 2.0 to 6.7 N. Among all parameters, firmness exhibited the highest
variation coefficient, of 32%. This range is in accordance with literature data.
For the L* parameter, except for one extremely high value, all batches exhibited values below 41.6.
On the opposite, a* values were spread on the whole range, whereas 85% of b* values were above
45. As a consequence, C* and h◦ exhibited a Normal distribution, with p-values, calculated with the
Anderson-Darling test, of 0.53 and 0.23, respectively.
Counts of psychrotrophic bacteria were for most batches below the detection limit. However,
five batches exhibited counts above 4 log CFU/g. For yeasts and molds, 72% of batches exhibited
counts above 4 log CFU/g, and 16% above 5 log CFU/g. Eventually, for enterobacteria, 40% of batches
exhibited counts above 4 log CFU/g, and 8% above 5 log CFU/g. The highest counts were thus observed
for yeasts and molds.Microorganisms 2020, 8, 185 8 of 18
Correlations between independent quantitative variables (pH, TA, TSS, microbial counts, L*, a*,
b*, firmness) were searched with the non-parametric Kendall test. A positive correlation between L*
and psychrotrophic bacteria enumeration was detected with a p-value of 0.028 and a Kendall’s tau
coefficient of 0.345. Two negative correlations, between pH and L* and between yeast and mold counts
and b*, were detected with p-values of 0.021 and 0.044 and coefficients of -0.336 and -0.291, respectively.
Surprisingly, no correlation was pointed out between TA and TSS, which evolve in an opposite way
during fruit ripening.
Eventually, correlations were searched between qualitative (season and location of sampling) and
quantitative variables. Biserial correlation tool showed a correlation between season and pH, with a
p-value of 0.0002 and a coefficient of 0.60, and a correlation between season and b*, with a p-value of
0.015 and a coefficient of 0.49. This grouping is visualized from pineapple batches plotted on a graph
with x-axis being b* and y-axis being pH (Figure 2).
Harvesting season has considerable impacts on the post-harvest quality of pineapple, affecting
internal browning and storage life [19]. The correlation between season and pH is not surprising but
could have been expected also with TA and TSS. Pineapple flesh color, especially b* and C*, TSS, TA,
and pH were influenced by the season in Thailand (three seasons: summer, rainy and winter) for the
Smooth Cayenne cultivar [23]. The importance of pre-harvest factors on post-harvest quality was
underlined by Chen et al. (2009) [24]. Whereas a model has been proposed to predict TSS of ‘Queen
Victoria’ pineapple flesh from agroclimatic conditions of Reunion Island [21], no correlation has8 been
Microorganisms 2020, 8, 185 of 17
previously pointed out between pH, b* color parameter and season, for this cultivar or crop location.
The relationship
The relationshipbetween
betweenpH pH
and L*
and could
L* be explicated
could by different
be explicated bypineapple
differentflesh compositions,
pineapple flesh
which are reflected on these two parameters. Pineapple flesh color depends on its
compositions, which are reflected on these two parameters. Pineapple flesh color depends on its composition in
carotenoids and flavonoids, and the content in those compounds was showed to depend
composition in carotenoids and flavonoids, and the content in those compounds was showed to on agroclimatic
conditions
depend on [25]. Moreover,
agroclimatic the color[25].
conditions of flavonoids
Moreover, depends
the coloron
of the pH. By depends
flavonoids contrast, on
explaining
the pH. the
By
correlations between a color parameter and a microbial count would require extensive
contrast, explaining the correlations between a color parameter and a microbial count would require metabolomic
analyses to
extensive find out which
metabolomic compounds
analyses to find would be implied.
out which compounds would be implied.
Figure 2.
Figure Relationshipbetween
2.Relationship betweenseason
seasonand
andthe
theparameters
parameterspH
pHand
andb*
b*from
fromfresh
freshminimally-processed
minimally-processed
pineapple. Black circle: summer; white triangle: winter. Confidence ellipses correspond to the seasons.
pineapple. Black circle: summer; white triangle: winter. Confidence ellipses correspond to the
seasons.
3.2. Minimally-Processed Pineapple Changes over Refrigerated Storage
Sensory descriptive profiles (olfactory and aspect) were established on minimally-processed
pineapple during refrigerated storage, after 3, 7, 10, and 14 days, and compared to freshly processed
samples (Figure 3).Microorganisms 2020,
Figure 8, 185
2. Relationship between season and the parameters pH and b* from fresh minimally-processed 9 of 18
pineapple. Black circle: summer; white triangle: winter. Confidence ellipses correspond to the
seasons.
3.2. Minimally-Processed Pineapple Changes over Refrigerated Storage
3.2. Minimally-Processed
Sensory Pineapple(olfactory
descriptive profiles Changes over
andRefrigerated Storageestablished on minimally-processed
aspect) were
pineapple duringdescriptive
Sensory refrigerated storage,
profiles after 3,and
(olfactory 7, 10, and 14
aspect) days,
were and compared
established to freshly processed
on minimally-processed
samples (Figure
pineapple 3). refrigerated storage, after 3, 7, 10, and 14 days, and compared to freshly processed
during
samples (Figure 3).
(a)
Microorganisms 2020, 8, 185 9 of 17
(b)
(c)
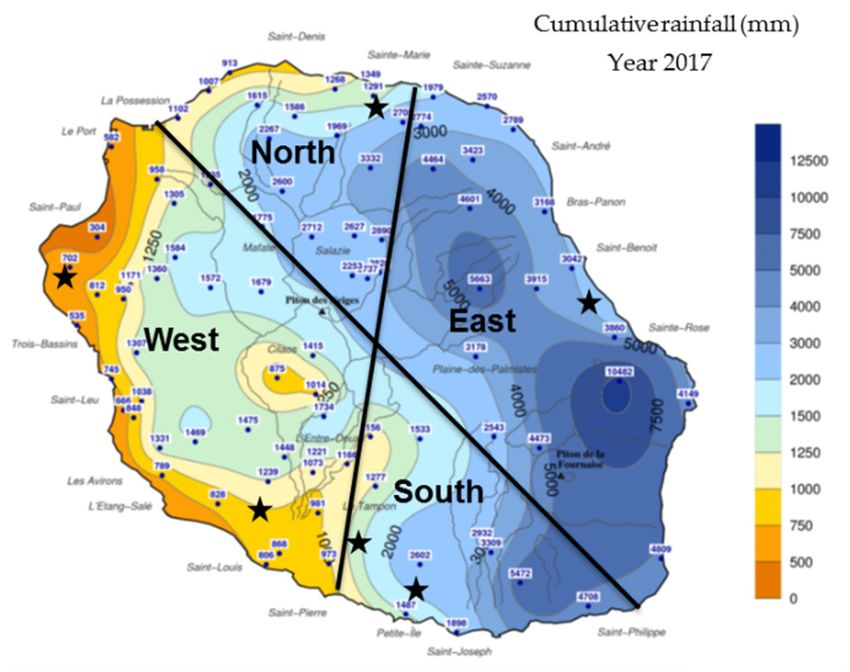
Figure
Figure 3. (a)
3. (a) Visual
Visual aspect
aspect ofof pineapplecuts
pineapple cuts during
during storage.
storage.From
Fromleft toto
left right: 0, 3,
right: 0,73,and 14 days
7 and of of
14 days
storage at
◦ 4°C; (b) Olfactive descriptive profiles of minimally-processed pineapple stored at
storage at 4 C; (b) Olfactive descriptive profiles of minimally-processed pineapple stored at 4 C for 0 4 °C◦ for
days0 (plain
days (plain
line), 3line),
days3 (large
days (large dashes),
dashes), 7 days7 (short
days (short dashes)
dashes) or 14or 14 days
days (dotted
(dotted line);line); (c) PCA
(c) PCA analysis
analysis of olfactive profiles. Sum of F1 and F2 represents 68.24% of data. D0, D3, D7, D14: samples
of olfactive profiles. Sum of F1 and F2 represents 68.24% of data. D0, D3, D7, D14: samples stored at 4
stored at 4 °C for 0, 3, 7, and 14 days respectively.
◦ C for 0, 3, 7, and 14 days respectively.
The visual aspect of minimally-processed pineapple clearly turned slightly brown and shiny
The visual aspect of minimally-processed pineapple clearly turned slightly brown and shiny after
after 14 days at 4 °C (Figure 3a). K-means classification positioned samples into four classes (Figure
14 days at 4 ◦ C (Figure 3a). K-means classification positioned samples into four classes (Figure 3b).
3b). Day 0 samples (fresh pineapple) were in class 1. Olfactive descriptors of samples from day 14
Daywere
0 samples (fresh pineapple) were in class 1. Olfactive descriptors of samples from day 14 were
“fermented”, “pungent”, “alcoholic”, “vegetable”, and “milky”. These descriptors indicate a
“fermented”, “pungent”, “alcoholic”,
negative evolution of sensory “vegetable”,
quality andover
of the product “milky”. Thesecan
time. They descriptors
be related indicate a negative
to a previously
described increase in volatile organic compounds such as ethyl acetate, acetic acid, ethanol or palmitic
acid during storage of pineapple cuts [19,26]. Significant differences were observed between freshly
prepared and (class 4) 14-day stored samples. This accounts for “fresh”, “pineapple”, “pungent”, and
“chemical” descriptors. Samples from day 3 and 7, respectively in classes 2 and 3, were mainly
characterized by “acid”, “fermented” and “chemical”. PCA analysis showed clearly the differences
depending on the storage time of samples determined from olfactive descriptors (Figure 3c).Microorganisms 2020, 8, 185 10 of 18
evolution of sensory quality of the product over time. They can be related to a previously described
increase in volatile organic compounds such as ethyl acetate, acetic acid, ethanol or palmitic acid during
storage of pineapple cuts [19,26]. Significant differences were observed between freshly prepared and
(class 4) 14-day stored samples. This accounts for “fresh”, “pineapple”, “pungent”, and “chemical”
descriptors. Samples from day 3 and 7, respectively in classes 2 and 3, were mainly characterized by
“acid”, “fermented” and “chemical”. PCA analysis showed clearly the differences depending on the
storage time of samples determined from olfactive descriptors (Figure 3c).
Depending on the batch, quicker spoilage could be observed (data not shown) and thus analyses
were stopped when a spoilage was observed. For instance, batches TP1, TP2 and TP3, which came
from the same place, were not acceptable after 7 days of storage. Batches BP, CP01, CP02, CP03, CP1,
V0, V1, V2, and V3 were not acceptable after 14 days of storage. The common feature of the latter
batches is that they were all sampled during the summer season. All winter batches, except TP3, were
considered as acceptable after 14 days of storage.
Changes in physicochemical parameters were determined over the shelf-life of
minimally-processed pineapple (Figure 4 and Figure S1). The values for pH, TA and TSS did not
significantly vary according to storage time. On the opposite side, storage time influenced firmness
and color parameters. A decrease of 26% of firmness was observed after 14 days, when compared
to the determination performed the day of processing. The L* value was not modified according to
storage time, but a* and b* decreased. The calculated dependent parameter C* decreased over storage
time, but h◦ and ∆E did not vary significantly.
Some physicochemical parameter changes of minimally-processed pineapple during cold storage
have been described [5,7,8,10,12,27–30]. In most of these studies, pH appeared stable or varying by less
than 0.2 units over storage time. For TSS, conflicting results are reported, decreasing [28], stable [27]
or increasing [10] during storage. A gradual decrease in firmness was observed previously [5,10,30].
Changes of color, especially browning, have been described during the shelf-life of minimally-processed
pineapple. A a* value increase was observed during the first 8 days of storage in several studies [10,11,29],
whereas a sharp L* and b* values decrease was observed in other studies [7,10,12,30]. The most
reproducible changes are thus pH and TA stability, firmness decrease and b* decrease, indicating a loss
of the yellow color because of either browning or translucency.
Counts of psychrotrophic bacteria did not increase during storage time, with mean values of 3.6
to 3.9 log CFU/g at each sampling time (Table 4). This observation hides great differences between
samples, most of samples exhibiting counts below the detection limit and some of them showing
counts up to 6.9 log CFU/g after 10 days of storage. Consequently, a moderate increase of ca. 1.5 log
CFU/g would not have been detected as significant in our experimental conditions. It was showed
that psychrotrophic bacteria counts increased by less than 2 log CFU/g during 12 to 14 days of storage
of pineapple cuts [7,11]. Counts of enterobacteria remained stable at 3.9 log CFU/g during the first
7 days and increased thereafter to reach 4.5 log CFU/g after 14 days of storage (Table 4). The maximal
observed value of enterobacteria counts gradually increased during storage. Lastly, yeast and mold
counts gradually increased during storage time, from initially 4.4 log CFU/g to 5.1 log CFU/g after
7 days and 6.0 log CFU/g after 14 days. Both minimal and maximal yeast and molds counts changed
during storage time to reach respectively 4.0 log CFU/g and 7.6 log CFU/g after 10 days, and 5.0 log
CFU/g and 7.9 log CFU/g after 14 days (Table 4). Significant differences depending on storage duration
were observed for yeast and mold populations.Microorganisms 2020, 8, 185 11 of 18
Microorganisms 2020, 8, 185 10 of 17
FigureFigure 4. Values
4. Values for for
(a) (a) firmness,
firmness, (b)a*,
(b) a*,(c)
(c)b*
b* and,
and, (d)
(d) C*
C*color
colorparameters of 25
parameters of minimally-processed
25 minimally-processed
pineapple batches during storage at 4°C.
◦ Time of storage varies
pineapple batches during storage at 4 C. Time of storage varies from 0 (D0),from 0 (D0), 3 (D3), 7 (D7),
3 (D3), 10 (D10),
7 (D7), 10 (D10),
and 14 (D14) days. (+) indicates the mean value, and black dots the outliers. For each parameter,
and 14 (D14) days. (+) indicates the mean value, and black dots the outliers. For each parameter,
different uppercase letters indicate significant differences between storage times.
different uppercase letters indicate significant differences between storage times.
Some physicochemical
Table 4. Changes parameter changes
in microbial of minimally-processed
population during storage timepineapple
at 4 ◦ C. during cold
storage have been described [5,7,8,10,12,27–30]. In most of these studies, pH appeared stable or
Daysby
varying ofless
storage 0
than 0.2 units over storage time. 3 For TSS, conflicting
7 results are10 reported, decreasing
14
Number of samples 25 25 22
[28], stable [27] or increasing [10] during storage. A gradual decrease in firmness was observed 22 13
previously [5,10,30]. Microbial
Changes counts in logespecially
of color, CF/g: mean (minimumhave
browning, value;been
maximum value]during the shelf-life
described
ofPsychrotrophic
minimally-processed
bacteria pineapple. A a* value
3.7 [3.3; 5.4] increase
3.7 [3.3; 5.1] was 3.6observed
[3.3; 6.3] during the first
3.9 [3.3; 6.9] 8 days
3.7of storage
[3.3; 5.3]
Enterobacteria
in several studies [10,11,29],3.9whereas
[3.0; 5.3] a sharp
3.9 [3.0;
L* and6.1] b* values
3.9 [3.0; 6.1]
decrease was4.2observed
[3.0; 7.0] in other
4.5 [3.0; 7.8]
studies
Yeasts and molds 4.4 [3.0; 5.6] A 4.9 [3.5; 6.0] AB 5.1 [3.3;7.4] B 5.5 [4.0; 7.6] BC 6.0 [5.0; 7.9] C
[7,10,12,30]. The most reproducible changes are thus pH and TA stability, firmness decrease and b*
decrease, indicating a loss of the yellow color because of either browning or translucency.
Fungal Counts of psychrotrophic
population was compared bacteria did3not
after days increase during
of storage storage time,
according to thewith mean
visual values of
spoilage 3.6
observed.
to 3.9 log CFU/g at each sampling time (Table 4). This observation hides great
Batches TP1, TP2 and TP3, which appeared spoiled after 7 days of storage, exhibited a fungal population differences between
samples, most of samples exhibiting counts below the detection limit and some of them showing
after 3 days of 5.6 log CFU/g. Batches spoiled after 14 days of storage (BP, CP01, CP02, CP03, CP1, V0,
counts up to 6.9 log CFU/g after 10 days of storage. Consequently, a moderate increase of ca. 1.5 log
V1, V2, and V3) showed fungal counts of 4.8 log CFU/g after 3 days. The last group of batches, not
spoiled after 14 days of storage, exhibited a mean fungal population after 3 days of 4.8 log CFU/g, and
thus were identical to the latter group. Yeast and mold counts cannot be strictly correlated to shelf-life.Microorganisms 2020, 8, 185 12 of 18
Mesophilic and psychrotrophic bacteria are possibly involved in minimally-processed pineapple
spoilage, whereas enterobacteria enumerations were used as hygienic indicators of processing. In our
study, the abundance of the two bacterial groups was monitored and did not increase significantly.
The growth of mesophilic and psychrotrophic bacteria in minimally-processed pineapple has been
reported, but consistently to a lesser extent than yeasts and molds [7,10,27,28]. A large and rapid
increase of yeast and mold counts has been previously observed during cold storage of fresh-cut
pineapple [7,10,27,29], confirming our observation. Yeasts and molds are reported as the main
contaminant of fruit salads and fruit juices [31,32]. Yeasts and molds are favored by the high sugar
content and the pH values, comprising between 3.09 and 4.20 for all batches, of minimally-processed
pineapple. They can be responsible for spoilage by producing gas, ethanol and volatile compounds
with off-odors.
Moreover, we showed that fungal counts cannot be solely used as a spoilage indicator, as they are
not strictly correlated to shelf-life. For that reason, yeast and mold diversity and the relationship to
spoilage was focused on.
3.3. Diversity of Yeasts and Molds and Modulation during Storage
The profile of yeast and mold communities during refrigerated storage of minimally processed
pineapple was determined to see if differences between samples could be observed. To that aim,
PCR-DGGE analysis was applied to eight batches (Figure 5): CP1 sampled in East area in summer,
VSA sampled in East area in winter, CP03 sampled in the North in summer, V1 sampled in the South
area in summer, V4 and V6 sampled in the South area in winter, and TP1 and TP2 sampled from a local
producer in summer. V1, V4 and V6 originated from the same producer.
Microorganisms 2020, 8, 185 12 of 17
5. UPGMA
FigureFigure dendrogram
5. UPGMA of PCR-DGGE
dendrogram profiles
of PCR-DGGE obtained
profiles for right
obtained for batches of minimally-processed
right batches of minimally-
processed pineapple. D0, D3, D7, D10, and D14 correspond respectively to 0,
pineapple. D0, D3, D7, D10, and D14 correspond respectively to 0, 3, 7, 10, and 14 days 3, 7, 10, and 14 days of
of storage.
storage. Letters “a” to “h” label DNA bands which were sequenced. Arrows show
Letters “a” to “h” label DNA bands which were sequenced. Arrows show bands appearing during bands appearing
during
storage storage
and open and open
boxes bands boxes bands
which which disappear
disappear during storage.
during storage.
We observed that samples were primarily gathered according to the pineapple batch, rather than
according to storage time. Three groups were differentiated.
The first group contained TP1 and TP2 batches that presented only four bands per lane. For these
two batches, a rapid spoilage occurred and both enterobacteria and yeast and mold counts were
above 5.5 log CFU/g after 3 days of storage.
The second group gathered batches V4, CP1 and V6. For those batches, most of the bands were
observed at the top of the gel. An evolution of the main fungal communities was observed during
storage, with the appearance (black arrow) or disappearance (empty square) of DNA bands at theMicroorganisms 2020, 8, 185 13 of 18
We observed that samples were primarily gathered according to the pineapple batch, rather than
according to storage time. Three groups were differentiated.
The first group contained TP1 and TP2 batches that presented only four bands per lane. For these
two batches, a rapid spoilage occurred and both enterobacteria and yeast and mold counts were above
5.5 log CFU/g after 3 days of storage.
The second group gathered batches V4, CP1 and V6. For those batches, most of the bands were
observed at the top of the gel. An evolution of the main fungal communities was observed during
storage, with the appearance (black arrow) or disappearance (empty square) of DNA bands at the
latter storage times (days 10 and 14).
Lastly, the third group gathered samples CP03, VSA and V1. Their profiles were similar for five
bands, which were labelled “a”, “b”, “c”, “d”, and “g”. The “d” band disappeared from V1 profile after
14 days (Figure 5). DNA retrieved from these bands and sequenced resulted in the identification of (a)
Resinicium saccharicola (mold), (b) Cladosporium sphaerospermum (mold), (c) Cladosporium cladosporioides
(mold), (d) Disporotrichum dimorphosporum (mold), and (g) Rhizopycnis vagum (mold) respectively
(Table 5). The band labelled “h” was only present in V1 sample after 14 days of storage and identified
as belonging to the Rhodotorula glutinis species (pink yeast) (Figure 5 and Table 5). In VSA and V1
groups, two specific bands were labelled “e” and “f”, and were identified as Galactomyces candidum
(mold) and Clavispora lusitaniae (yeast), respectively.
Table 5. Identification of fungal species from DNA extracted from DGGE gels.
Band Origin Identification %Identity E-Value
a CP03–D10 Resinicium saccharicola 98 0
b CP03–D10 Cladosporium sphaerospermum 96.1 0
c CP03–D10 Cladosporium cladosporioides 93.9 4.0 × 10−143
d VSA–D0 Disporotrichum dimorphosporum 85 6.0 × 10⁻⁸
e VSA–D0 Galactomyces candidus 98.8 4.0 × 10−163
f VSA–D0 Clavispora lusitaniae 96.4 3.0 × 10−137
g V1–D14 Rhizopycnis vagum 95.7 4.0 × 10−146
h V1–D14 Rhodotorula glutinis 99 2.0 × 10−86
Except for TP1 and TP2 coming from the same producer and exhibiting a short shelf-life,
PCR-DGGE grouping was not related to sampling season, neither to the location or producer, as it can
be specifically seen from V1, V4 and V6.
R. saccharicola was isolated from sugar cane [33]. Cladosporium spp. is widely present on
plant material and can cause post-harvest spoilage of fruit [34–38], even at a low temperature.
D. dimorphosporum is industrially used as a producer of plant cell wall lytic enzymes [39,40]. R.
vagum, infecting roots and tubers, is known to contribute to vine decline and root necrosis [41–43]. G.
candidus, teleomorph of Geotrichum candidum, is mainly derived from cheese [44], but also from fruit tree
phyllosphere [45]. It was identified from necrotic lesions of pineapple [46]. C. lusitaniae was identified
in apple juice and on rotten fruit [47–49]. Rhodotorula spp., corresponding to the “h” band that appeared
in the V1 sample after 14 days of storage, contaminates at high levels fruit salads and juices made from
cantaloupe, citrus, honeydew, strawberry, coconut water, grape, and apple [31,47,48,50]. All detected
fungal species of this study have already been associated to different fruit or plant materials.
3.4. Identification of Fungal Isolates Involved in Spoilage of Minimally-Processed Pineapple
Nine fungal isolates were obtained from six minimally-processed pineapple batches at different
storage times. Identification is proposed in Table 2. “R” and “S” colony phenotypes were similar
and identified as Penicillium citrinum mold species. Talaromyces amestolkiae was another isolated mold.
Rhodotorula mucilaginosa, Saccharomyces cerevisiae, and Meyerozyma caribbica corresponded to yeast
species isolated. Rhodotorula was the only genus also identified from PCR-DGGE profiles.3.4. Identification of Fungal Isolates Involved in Spoilage of Minimally-Processed Pineapple
Nine fungal isolates were obtained from six minimally-processed pineapple batches at different
storage times. Identification is proposed in Table 2. “R” and “S” colony phenotypes were similar and
identified as Penicillium citrinum mold species. Talaromyces amestolkiae was another isolated 14mold.
Microorganisms 2020, 8, 185 of 18
Rhodotorula mucilaginosa, Saccharomyces cerevisiae, and Meyerozyma caribbica corresponded to yeast
species isolated. Rhodotorula was the only genus also identified from PCR-DGGE profiles.
P.
P.citrinum
citrinumhas hasbeen
beenidentified
identifiedfrom
fromjujube (Ziziphus mauritiana),
jujube (Ziziphus mauritiana), acid
acid food
food products from citrus,
coco milk, coffee and cocoa beans, in which its strong polygalacturonase
coco milk, coffee and cocoa beans, in which its strong polygalacturonase activity activity waswas
detected [38,51–54].
detected [38,51–
This fungus
54]. This can produce
fungus the mycotoxin
can produce citrinin.
the mycotoxin Talaromyces
citrinin. spp. can
Talaromyces spp.occasionally be isolated
can occasionally from
be isolated
low-pH juices juices
from low-pH [55,56].[55,56].
On theOn opposite, R. mucilaginosa
the opposite, and S.and
R. mucilaginosa cerevisiae are commonly
S. cerevisiae involved
are commonly in the
involved
spoilage of fruitofproducts
in the spoilage [48,51,57,58].
fruit products M. caribbica
[48,51,57,58]. is mostly
M. caribbica known
is mostly as anas
known endophyte yeast,
an endophyte but has
yeast, but
been isolated
has been fromfrom
isolated spoiled minimally-processed
spoiled minimally-processed pineapple [26,59].
pineapple [26,59].
Five
Five isolates
isolates were selected
selected from
from DNA
DNAidentification
identificationand andcolony morphology:P. P.
colonymorphology: citrinum
citrinum (R),
(R), T.
T. amestolkiae
amestolkiae (20),
(20), R. mucilaginosa
R. mucilaginosa (A), (A), S. cerevisiae
S. cerevisiae (C),M.
(C), and and M. caribbica
caribbica (F).involvement
(F). Their Their involvement in
in spoilage
spoilage of minimally-processed
of minimally-processed pineapple pineapple
during during refrigerated
refrigerated storagestorage was investigated.
was investigated. Pineapple
Pineapple cuts,
cuts, dipped in the fungal cocktail composed of the five isolates, were analyzed
dipped in the fungal cocktail composed of the five isolates, were analyzed and compared to control and compared to
control
cuts (notcuts (not dipped)
dipped) after of
after 7 days 7 days of storage,
storage, in triplicate.
in triplicate.
Visually,
Visually,treated
treatedcuts
cutsappeared
appeareddarker
darker(Figure
(Figure6).
6). Sensory
Sensory triangle tests confirmed the difference,
with
with a 99.99% confidence. The panel proposed descriptorsof
a 99.99% confidence. The panel proposed descriptors ofthe
thetreated
treatedsamples:
samples: These
These descriptors
descriptors
were
weremainly
mainlynegative
negativeadjectives,
adjectives,“fermented”
“fermented”and and“putrid”
“putrid”being
beingthethemost
mostfrequent.
frequent. The
The descriptors
descriptors
“milky”,
“milky”,“Roquefort
“Roquefortcheese”,
cheese”,then
then“sugared”
“sugared”and and“toffee”
“toffee”werewereless
lessfrequently
frequentlycited.
cited.
Figure6.6.Visual
Figure Visualaspect
aspectof
ofpineapple
pineapplecuts
cutsafter
after77days
daysof
ofstorage
storageatat44°C (left control,
◦ C (left control, right
right treated).
treated).
The comparison of physicochemical parameters pointed to large differences between the control
and the treated samples after 7 days of storage (Table 6). As expected, pH and TSS did not significantly
change. On the opposite, TA decreased during cold-storage of control and increased for the treated
samples after 7 days of storage. Color analysis showed that a* and Hue angle were significantly higher
for the treated samples than for the control conditions. For L*, b*, C*, and ∆E, a bilateral Dunnet’s test
pointed out differences between the treated samples and the control ones after 7 days of storage.
Table 6. Physicochemical parameters and population of yeast and molds for control and treated
samples during storage at 4 ◦ C. D0 correspond to freshly prepared pineapple and D7 to samples after 7
days of storage. Different uppercase letters in the same line indicate significant differences. Lower case
letters indicate differences according to bilateral Dunnet’s test. *: not applicable.
Parameter Control—D0 Control—D7 Treated—D7
pH 3.6 ± 0.1 A 3.6 ± 0.1 A 3.5 ± 0.1 A
TA (g/100 mL) 6.1 ± 0.1 B 5.4 ± 0.2 A 6.6 ± 0.2 C
TSS (◦ Brix) 17.1 ± 0.4 A 17.5 ± 0.5 A 16.0 ± 0.2 A
L* 39.5 ± 0.4 39.2 ± 0.8 b 34.6 ± 0.4 b
a* 10.1 ± 0.3 A 10.7 ± 0.4 A 14.2 ± 0.6 B
b* 64.8 ± 0.7 64.0 ± 1.4 b 58.0 ± 0.5 a
Chroma 65.6 ± 0.7 64.9 ± 1.3 b 59.8 ± 0.5 a
Hue angle 8.8 ± 0.3 A 9.5 ± 0.5 A 13.8 ± 0.6 B
Color difference -* 1.2 ± 1.1 b 9.4 ± 1.4 a
Yeasts & Molds (log CFU/g) 4.8 ± 0.2 A 6.1 ± 0.1 AB 10.0 ± 0.1 BMicroorganisms 2020, 8, 185 15 of 18
As expected, the fungal population increased for the control condition during storage, and the
increase was much more marked for the treated sample (Table 6). Colony phenotypes of the five
isolates were observed on enumeration media for the 7-day stored treated samples.
4. Conclusions
Physicochemical characteristics of minimally-processed pineapple fruit are modulated by the
harvesting season. Hence, microbial populations are probably influenced by composition, together
with environmental conditions. We observed that fungal diversity varied greatly according to the
harvested pineapple batch.
Olfactive descriptors of minimally-processed ‘Queen Victoria’ pineapple were mostly “fresh”,
“sugared” and “pineapple”. After a 14-day cold-storage, the frequency of descriptors “fermented” and
“alcoholic” increased, as opposed to “pineapple” and “fresh”. At the same time, the fungal population
increased to a large extent, and PCR-DGGE profiles were slightly modified. Identification of yeasts and
molds from PCR-DGGE profiles and from isolates pointed to species already described as associated to
carposphere or fruit foods or beverages, and for some involved in spoilage. The fungal diversity, not
only population level, probably played a crucial role in triggering spoilage.
A cocktail of two molds and three yeasts was inoculated on pineapple cuts and resulted in sensory
quality defects and color changes. Future research is needed to better link the presence, growth and
activity of fungal species to spoilage, and hence to extend the shelf-life of minimally-processed fruit.
Supplementary Materials: The following are available online at http://www.mdpi.com/2076-2607/8/2/185/s1.
Author Contributions: C.L.-J., J.-C.M. and F.R. performed the conception and experimental design. C.L.-J., B.Q.,
S.A. and M.H. performed the experiments. Data were analyzed by C.L.-J., B.Q., S.A. and F.R. The manuscript was
written by C.L.-J. and F.R. and corrected by all other authors. All authors have read and agreed to the published
version of the manuscript.
Funding: This work was supported by European Union and Region Reunion (FEDER RE0002361). Part of this
work was funded by the Cirad DPP COSAQ (https://cosaq.cirad.fr/) agronomical research program funded by a
grant from European Community (FEDER-working-program), the Regional Council of Réunion Island and CIRAD.
Acknowledgments: The authors thank Stéphane Avril from SCA TERRACOOP-Vivéa and Philippe Roland from
Colipays for providing pineapples.
Conflicts of Interest: The authors declare no conflict of interest.
References
1. Septembre-Malaterre, A.; Remize, F.; Poucheret, P. Fruits and vegetables, as a source of nutritional compounds
and phytochemicals: Changes in bioactive compounds during lactic fermentation. Food Res. Int. 2018, 104,
86–99. [CrossRef] [PubMed]
2. Sun, G.M.; Zhang, X.M.; Soler, A.; Marie-Alphonsine, P.A. Nutritional composition of pineapple (Ananas
comosus (L.) Merr.). In Nutritional Composition of Fruit Cultivars; Elsevier Inc.: Amsterdam, The Netherlands,
2015; ISBN 9780124081178.
3. Ragaert, P.; Verbeke, W.; Devlieghere, F.; Debevere, J. Consumer perception and choice of minimally processed
vegetables and packaged fruits. Food Qual. Prefer. 2004, 15, 259–270. [CrossRef]
4. Leneveu-Jenvrin, C.; Charles, F.; Barba, F.J.; Remize, F. Role of biological control agents and physical
treatments in maintaining the quality of fresh and minimally-processed fruit and vegetables. Crit. Rev. Food
Sci. Nutr. 2019, 24, 1–19. [CrossRef]
5. Benítez, S.; Chiumenti, M.; Sepulcre, F.; Achaerandio, I.; Pujolá, M. Modeling the effect of storage temperature
on the respiration rate and texture of fresh cut pineapple. J. Food Eng. 2012, 113, 527–533. [CrossRef]
6. Zhang, B.-Y.; Samapundo, S.; Pothakos, V.; de Baenst, I.; Sürengil, G.; Noseda, B.; Devlieghere, F. Effect of
atmospheres combining high oxygen and carbon dioxide levels on microbial spoilage and sensory quality of
fresh-cut pineapple. Postharvest Biol. Technol. 2013, 86, 73–84. [CrossRef]
7. Montero-Calderón, M.; Rojas-Graü, M.A.; Martín-Belloso, O. Effect of packaging conditions on quality and
shelf-life of fresh-cut pineapple (Ananas comosus). Postharvest Biol. Technol. 2008, 50, 182–189. [CrossRef]You can also read