Video Game-Based Therapy on Balance and Gait of Patients with Stroke: A Systematic Review - applied sciences

 
CONTINUE READING
Video Game-Based Therapy on Balance and Gait of Patients with Stroke: A Systematic Review - applied sciences
applied
           sciences
Review
Video Game-Based Therapy on Balance and Gait of
Patients with Stroke: A Systematic Review
Silvia Pintado-Izquierdo 1 , Roberto Cano-de-la-Cuerda 2, *           and Rosa María Ortiz-Gutiérrez 3
 1    Escuela Internacional de Doctorado, Universidad Rey Juan Carlos, Alcorcón, 28922 Madrid, Spain;
      s.pintadoi@alumnos.urjc.es
 2    Department of Physiotherapy, Occupational Therapy, Rehabilitation and Physical Medicine,
      Health Sciences Faculty, Rey Juan Carlos University, Avda. Atenas s/n. 28922, Alcorcón, 28922 Madrid, Spain
 3    Department of Physiotherapy, Health Sciences Faculty San Rafael-Nebrija, FSJD. 28922 Madrid, Spain;
      rortizg@nebrija.es
 *    Correspondence: roberto.cano@urjc.es; Tel.: +34-91-488-86-74
                                                                                                        
 Received: 27 July 2020; Accepted: 12 September 2020; Published: 15 September 2020                      

 Abstract: Background: Stroke patients with motor, sensory and cognitive diseases can take profits
 from information and communication technologies—in particular, from the latest commercial video
 consoles, which are based on motion capture. These technologies are positioning themselves as
 complementary therapeutic tools for treating gait and balance disorders. In this paper, a systematic
 review of the effect of video game-based therapy on balance and gait in stroke patients is shown and
 compared with other types of treatments. Methods: A systematic review of prospective controlled
 clinical trials published in the main biomedical databases in English and Spanish between 2005 and
 2020 was performed. The systematic review presented in this paper has been done following the
 Cochrane Manual recommendations and the PRISMA Declaration by two independent reviewers.
 Data about participants, intervention, outcome measurements and outcome measurement results
 were extracted. The quality of evidence of each study was assessed using Cochrane’s standard quality
 assessment format, which includes a description of the risk of bias. Additionally, the Physiotherapy
 Evidence Database (PEDro) scale was used to assess the methodological quality of each paper. Results:
 A total of 18 papers, including 479 patients, were included in this systematic review, in which the use
 of video consoles (in combination with conventional rehabilitation or exclusively) was compared with
 conventional rehabilitation to treat balance or gait in post-stroke patients. In all studies, a tendency to
 improve balance was found in both intervention groups, finding, in 10 of 17 studies that analysed it,
 a better capacity in the experimental group that included video consoles compared to the conventional
 rehabilitation control group. Regarding gait, in six of seven studies that analysed it, improvements
 were found in both intervention groups, and these improvements were greater in the experimental
 group than compared to the control group in three of them. Conclusions: Commercial video game
 systems, in combination with conventional rehabilitation, have shown positive results on balance
 and gait in post-stroke patients. There were variations between the trials in terms of the video
 consoles used and the duration, frequency and number of sessions with commercial video games.
 Future studies should compare the effects of commercial video game treatments on balance and gait
 in stroke patients with a nonintervention group to know their real efficacy.

 Keywords: commercial gaming devices; balance; gait; stroke; virtual reality; video consoles;
 video games

1. Introduction
      Stroke is defined as a “focal neurological condition (or sometimes general) which occurs suddenly,
lasting for more than 24 h (or the cause of death) and supposedly of vascular origin” [1]. According to

Appl. Sci. 2020, 10, 6426; doi:10.3390/app10186426                                  www.mdpi.com/journal/applsci
Appl. Sci. 2020, 10, 6426                                                                            2 of 33

the World Health Organization (WHO), the average incidence of stroke is around 200 new cases per
100,000 inhabitants/year [2,3]. Stroke induces sensory, motor, cognitive and psychological deficits,
which directly affect the individual’s functionality and quality of life [1]. In this context, between 50%
and 70% of stroke patients present with balance and gait disorders and frequent falls [4,5]. Therefore,
balance and gait disturbances in stroke patients are a key objective for the rehabilitation team.
      Continued rehabilitation during the first year after stroke reduces the risk of functional impairment
and improves independence in activities of daily living. In the chronic phase, continuity in rehabilitation
programmes is also necessary due to the appearance of associated functional deterioration [2]. In this
context, virtual reality (VR) has become extremely relevant in the rehabilitation of cognitive and motor
disorders in these patients. VR has been defined as the “use of interactive simulations created with
computer hardware and software to present users with opportunities to engage in environments
that appear and feel similar to real-world objects and events” [6]. VR possesses a highly motivating
multidimensional virtual environment that the user can interact with, which provides sensory feedback,
thus allowing the individual to perform in activities or tasks comparable to real situations. The intensity
and difficulty degree can be graded and provides the user with information about the reached objectives
in real time [7–10]. There are different types of VR, including: immersive, in which the patient is fully
integrated in the virtual environment and interacts with it through some type of hardware, such as data
gloves or VR glasses, semi-immersive, in which the patient is visualised within the virtual environment
through a screen and interacts with it through their movements or with some remote controller but
without losing contact with the real world, and nonimmersive, in which the patient interacts with the
virtual environment through a computer-generated character represented on a screen with a peripheral
device controller [8,11–13]. Immersive VR systems have shown good results in the treatment of motor
deficits, among which are balance and gait alterations, in stroke patients. However, there is no suitable
protocol, and these systems are costly and complex to use and maintain, unlike semi-immersive
low-cost video game systems [14–16].
      Video games have experienced a technological growth phenomenon which, apart from constituting
a leisure activity, are considered an important tool for learning and motor programme training in
individuals with motor, cognitive and sensory deficits of a neurological origin. Within the available
systems, commercial video games based on motion capture are an alternative way of providing
semi-immersive VR for rehabilitation approaches, such as the possibility of practising functional
activities in a controlled environment, and an increased adherence to the therapy, as it is highly
motivating for the patient. Their low cost, accessibility and user-friendliness allows their use as a
rehabilitation tool [17–19].
      Many systematic reviews (SRs) and meta-analyses have been published in recent years analysing
the effects of VR on balance and gait in stroke patients. Studies comparing the impacts of VR often
include heterogeneous systems or technologies that are customised or noncustomised for stroke
treatment, addressing a broad range of disabilities. However, effectiveness can only be investigated
if similar systems that rehabilitate the same impairment are contrasted. On the other hand, a clear
understanding of the benefits that should make VR interventions effective in promoting recovery is
missing. To our knowledge, few studies have specifically analysed the effects of commercial video
games in stroke patients [14–16,20–22]. In addition, the appearance on the market of new generation
video consoles make it necessary to know the main results provided by these devices used to date in
order to propose rehabilitation strategies in patients with stroke using new video consoles.
      The aim of this paper is to carry out a SR on the effects of video game-based therapy on balance
and gait in patients who have suffered a stroke compared to other types of treatment and to analyse
the differences between the commercial devices and video games used.
Appl. Sci. 2020, 10, 6426                                                                           3 of 33

2. Materials and Methods

2.1. Design
     A paired systematic review (SR) was performed, following the Cochrane Manual recommendations
for SR, as well as the Preferred Reporting Items for Systematic Reviews and Meta-Analyses (PRISMA)
Declaration [23,24].

2.2. Search Strategy
    Two independent reviewers carried out bibliographic searches in the following electronic databases:
CINAHL Medical Science, Medline through EBSCO, PubMed, Physiotherapy Evidence Database
(PEDro) and Scopus, limiting the search to papers from January 2005 to June 2020 in English and Spanish.
    Inverse searches were also carried out based on papers found in the databases. The reviewers
used the COVIDENCE® application (V.1.0. Covidence, Melbourne, VIC, Australia) to sift through the
papers, and a third reviewer worked on resolving discrepancies between the papers belonging to and
being included in this SR.
    The search strategy is shown in Table 1.

                                        Table 1. Search strategy.

 CINAHL Complete
 #1 (MM “Stroke”)
 #2 (TX “Cerebrovascular accident”)
 #3 #1 OR #2
 #4 (MH “Virtual reality”)
 #5 (MM “Virtual reality exposure therapy”)
 #6 (MM “Video games”)
 #7 (TX “Commercial gaming devices”)
 #8 (TX “gaming”)
 #9 (TX “console”)
 #10 (TX “console games”)
 #11 (TX “Wii”)
 #12 (TX “Play Station”)
 #13 (TX “Xbox”)
 #14 (TX “Kinect”)
 #15 (TX “Nintendo Switch”)
 #16 (TX “Play station virtual reality”)
 #17 (TX “Eye toy”)
 #18 #4 OR #5 OR #6 OR #7 OR #8 OR #9 OR #10 OR #11 OR #12 OR #13 OR #14 OR #15 OR #16 OR #17
 #19 (MM “Balance, Postural”)
 #20 (MM “Gait”)
 #21 (MM “Gait Disorders, Neurologic”)
 #22 (MM “Gait Training”)
 #23 (TX “Berg Balance Scale”)
 #24 (TX “Timed Up and Go “)
 #25 (TX “6 min walk test”)
 #26 (TX “10 metre walk test”
 #27 (TX “Functional reach test”)
 #28 (TX “Posturography”)
 #29 #19 OR #20 OR #21 OR #22 OR #23 OR #24 OR #25 OR #26 OR #27 OR #28
 #30 #3 AND #18 AND #29
                                                                    Number of results obtained in CINAHL
                                                                                                     153
Appl. Sci. 2020, 10, 6426                                                                         4 of 33

                                           Table 1. Cont.

 Medline
 #1 (MM “Stroke”)
 #2 (TX “Cerebrovascular accident”)
 #3 #1 OR #2
 #4 (MH “Virtual reality”)
 #5 (MM “Virtual reality exposure therapy”)
 #6 (MM “Video games”)
 #7 (TX “Commercial gaming devices”)
 #8 (TX “gaming”)
 #9 (TX “console”)
 #10 (TX “console games”)
 #11 (TX “Wii”)
 #12 (TX “Play Station”)
 #13 (TX “Xbox”)
 #14 (TX “Kinect”)
 #15 (TX “Nintendo Switch”)
 #16 (TX “Play station virtual reality”)
 #17 (TX “Eye toy”)
 #18 #4 OR #5 OR #6 OR #7 OR #8 OR #9 OR #10 OR #11 OR #12 OR #13 OR #14 OR #15 OR #16 OR #17
 #19 (MM “Postural Balance”)
 #20 (TX “Postural Balance”)
 #21 (MM “Gait”)
 #22 (MM “Gait Disorders, Neurologic”)
 #23 (TX “Berg Balance Scale”)
 #24 (TX “Timed Up and Go “)
 #25 (TX “6 min walk test”)
 #26 (TX “10 metre walk test”
 #27 (TX “Functional reach test”)
 #28 (TX “Posturography”)
 #29 #19 OR #20 OR #21 OR #22 OR #23 OR #24 OR #25 OR #26 OR #27 OR #28
 #30 #3 AND #18 AND #29
                                                                  Number of results obtained in Medline
                                                                                                   152
 PubMed
 #1 “Stroke”[MeSH Terms]
 #2 “cerebrovascular accident”[Title/Abstract]
 #3 #1 OR #2
 #4 “Virtual reality”[MeSH Terms]
 #5 “Virtual Reality Exposure Therapy”[MeSH Terms]
 #6 “Virtual reality”[Title/Abstract]
 #7 “Video games”[Title/Abstract]
 #8 “Commercial gaming devices”[Title/Abstract]
 #9 “gaming”[Text Word]
 #10 “Commercial gaming devices”[Text Word]
 #11 “console”[Text Word]
 #12 “console games”[Text Word]
 #13 “Wii”[Text Word]
 #14 “play station”[Text Word]
 #15 ”Xbox”[Text Word]
 #16 “Kinect”[Text Word]13
 #17 “Nintendo switch”[Text Word]
 #18 “Play station virtual reality”[Text Word]
 #19 “Eye toy”[Text Word]
 #20 #4 OR #5 OR #6 OR #7 OR #8 OR #9 OR #10 OR #11 OR #12 OR #
 13 OR #14 OR #15 OR #16 OR #17 OR #19
 #21 “Postural Balance”[MeSH Terms]
Appl. Sci. 2020, 10, 6426                                                                               5 of 33

                                                Table 1. Cont.

 #22 “Gait”[MeSH Terms]
 #23 “Gait Disorders, Neurologic”[MeSH Terms]
 #24 “Gait training”[Text Word]
 #25 “Berg Balance Scale”[Text Word]
 #26 “Timed Up and Go”[Text Word]
 #27 “6 min walk test”[Text Word]
 #28 “10 metre walk test”[Text Word]
 #29 “Posturography”[Text Word]
 #30 “Functional reach test”[Text Word]
 #31 “Balance” [Title/Abstract]
 #32 #21 OR #22 OR #23 OR #24 OR #25 OR #26 OR #27 OR #28 OR #29 OR #30 OR #31
 #33 #3 AND #20 AND #32
                                                                      Number of results obtained in PubMed
                                                                                                            430
 PEDro
 #”Stroke” “virtual reality” “gait” “balance”
                                                                        Number of results obtained in PEDro
                                                                                                            24
 Scopus
 #1 Tittle-Abs (“Stroke”)
 #2 Tittle-Abs (“Virtual reality”)
 #3 Tittle-Abs (“video games”)
 #4 #2 OR #3
 #5 Tittle-Abs (“Physical Therapy”)
 #6 Tittle-Abs (“Rehabilitation”)
 #7 #5 OR #6
 #8 Tittle-Abs (“Balance”)
 #9 Tittle-Abs (“Gait”)
 #10 Tittle-Abs (“Postural Balance”)
 #11 Tittle-Abs (“Postural Control”)
 #12 #8 OR #9 OR #10 OR #11
 #13 #1 AND #4 and #7 and #12
                                                                       Number of results obtained in Scopus
                                                                                                             5
      MM: exact major subject heading, MH: exact subject heading, TX: whole text and PEDro: Physiotherapy
      Evidence Database.

2.3. Eligibility Criteria
    The eligibility criteria following the Population, Intervention, Comparation and Outcome (PICO)
framework is shown in Table 2.
Appl. Sci. 2020, 10, 6426                                                                                    6 of 33

      Table 2. Eligibility criteria according to Population, Intervention, Comparation and Outcome (PICO).

  P: adult participants (>18 years of age) from both genders, diagnosed clinically with stroke and gait and/or
  balance disorders;
  I: interventions using commercial video games (Nintendo Wii® , Microsoft Xbox® , Microsoft Xbox® in
  combination with Kinect® device or a combination of the previous ones) to treat balance and gait after a stroke;
 C: studies comparing two exercise interventions (one of them was a programme of VR training and the other
 was a conventional rehabilitation programme) and
 O: provide balance and/or gait results registered with instrumentation systems and/or observational ratings
 (posturography, static balance index, postural assessment scale, Berg balance scale, Timed Up and Go test,
 Functional Reach Test, Falls Efficacy Scale International, 10-m walk test, 6-min walk test and dynamic gait
 index test).

    The included studies were prospective controlled clinical trials. While studies that included
high-cost VR systems or other systems different than commercial video games were excluded.

2.4. Extracting Information and Managing Data
     The following data were extracted: number and characteristics of participants; types of
interventions; protocol applied in terms of time, frequency and number of sessions; outcome results on
balance and gait; methodological quality and risk of bias.

2.5. Assessing the Quality of Evidence
     The methodological quality of each study was assessed by two independent reviewers using
Cochrane’s standard quality assessment format [23] and using Review Manager software (V.5.3.
The Cochrane Collaboration, Copenhagen, Denmark), which includes a description and rating for
each item with a table of “Risk of Bias”. A third reviewer was there to help with discrepancies.
The independent assessment of each item was considered “a risk of bias” when the study adequately
addressed each domain. If not enough information was provided to be able to assess it, it was
considered “unclear or doubtful”.
     Additionally, the Physiotherapy Evidence Database (PEDro) Scale, developed by The Centre of
Evidence-Based Physiotherapy (CEBP), was used to assess the methodological quality of each paper.
The PEDro Scale, a 10-item scale, is a validated, reliable and versatile tool used to rate randomised
controlled trials (RCTs). It has been used as a measurement of methodological quality in many
systematic and literature reviews.

3. Results
      A total of 7648 studies were initially identified. After excluding duplicates, 674 were sieved by
title and abstract, and 637 studies were ruled out, since they did not satisfy the eligibility criteria.
An additional 20 references were obtained through inverse searches based on the 37 previously selected
studies, which were potentially relevant due to the title and abstract. The 57 selected studies by title
and abstract were read in-depth: 39 of them were excluded, since they did not satisfy the eligibility
criteria. Finally, 18 papers were included in this SR [25–42] (Figure 1 and Supplementary Materials).
Appl. Sci. 2020, 10, 6426                                                                          7 of 33

                                               Figure 1. Flow chart.

3.1. Characteristics of the Included Studies

3.1.1. Participants
     A total of 479 individuals participated in the 18 studies included in this SR, 247 of whom performed
the experimental intervention and 232 the control intervention. The mean of patients for each study
was 26.61 ± 10.21 (mean ± standard deviation), with an average age of 58.92 ± 6.47 years in the
experimental group (EG), and in the control group (CG), the average ages were 58.17 ± 6.83 years
and 59.66 ± 6.20 years, respectively. Sixteen of the 18 studies collected information on the gender of
Appl. Sci. 2020, 10, 6426                                                                            8 of 33

participants, where the distribution was 55.04% men and 44.95% women [25–31,33–35,37–42]. In 12 of
the studies, the type of stroke was defined, with 66.19% of the cases being ischaemic heart attacks and
33.8% brain haemorrhage [25–32,34,35,37,39]. Fourteen studies specified where the stroke was located:
49.62% were in the right hemisphere, and 50.37% were in the left hemisphere [25–27,29,30,34–42].
The average time since the stroke was 24.23 ± 27.26 months. Only two studies did not include this
data [31,33]. In four studies, the participants were in an acute and/or subacute state [26,35,36,39]; in
one study, the participants had suffered a stroke within the last 12 months [31], and in the other 13
studies, the participants were in a chronic state.

3.1.2. Intervention
      Regarding the commercial video games systems used, 13 studies compared the results on
balance using a video game programme with the Nintendo Wii® (Nintendo Co., Ltd., Kyoto, Japan)
console compared to other rehabilitation treatments [25–33,35,36,38,42], whereby the software Wii
Fit® (Nintendo Co., Ltd., Kyoto, Japan) was used in five of them [25,27,30,31,36], and Wii Fit Plus®
(Nintendo Co., Ltd., Kyoto, Japan) was used in the other five [26,28,29,33,42]. Both commercial software
required the use of the Wii Balance Board® (Nintendo Co., Ltd., Kyoto, Japan) for some games based
on the fact that the player has to stay in the limits of the table and work on changing the weight,
transferring loads from one foot to another and/or back and forth. Wii Sports® software (Nintendo
Co., Ltd., Kyoto, Japan) was used in two papers [32,38] and Wii Sports Resort in one [35]; these two
video games do not limit the playing space, and the player can practice some sports (tennis, boxing,
golf, etc.) using the Wii® controllers in one or both hands, as required in each of the video games.
In them, the players also practice the transfer of loads. In addition, displacement in different directions
is necessary.
      Along the same lines, three studies analysed the effects of using the Kinect-Xbox Microsoft®
(Microsoft Inc., Redmond, WA, USA) console compared to an outpatient physiotherapy programme [34,
37,41], which used Kinect Sport® , Kinect Sport Season2® [34,37,41], Kinect Adventures® [34,41],
Kinect Grunstringer® [41] and Kinect Your Shape: Fitness Evolved® [37] (Microsoft Inc., Redmond,
WA, USA). In all of them, the player does not need controllers, and the playing space is not limited.
Load transfers, displacement and even jumps are practiced in them. In two papers, they studied, on the
one hand, the use of the Nintendo Wii® or Kinect-Xbox Microsoft® console [39] using Wii Fit® and
Kinect Adventures® software, and on the other hand, its combined use [40] using Wii Fit Plus® and
Kinect Adventures® softwares. All these studies used commercial softwares.
      As regards the therapy performed by the CG in the different studies, one of them involved
using the MOTOmed ergometric bike [41]; in nine studies, only group or individual conventional
physiotherapy was used [25,27,30,31,35,37–40]; in the rest of the studies, conventional rehabilitation
was also used plus another therapy—one added a VR system treatment using the Wii® (but in a sitting
position and with different software than that used in the EG), Wii Sports® and Wii Sports Resort® [26];
in five studies, balance treatments were included [28,29,34,36,42]; in another study, a task-oriented
treatment was included [33] and, in another study, electrical stimulation of the tibialis anterior was
included [32]. None of the studies showed differences between the EG and CG regarding the number of
sessions, frequency and length of the intervention. However, in five studies, differences in the session
length existed, with the EG receiving 30 min more treatment per session [25,27,31,32,37] (Table 3).
Appl. Sci. 2020, 10, 6426                                                                                                                                           9 of 33

                                          Table 3. Main characteristics of the studies included in the systematic review (SR) and PEDro.

                                   Mean Age ±          EG              N◦ of                     Duration          CG            Video     Video Games in
      Study          Sample Size                                                 Sessions/Week                                                              PEDro
                                      SD          Intervention        Sessions                   (Weeks)      Intervention      Console          EG
                                                       600
                       N = 20                                                                                      60’
   Barcala et al.                                 conventional                                                                 Nintendo
                       EG = 10     64.35 ± 1.20                         10           2               5        conventional                    Wii Fit®       8/10
       [25]                                       physiotherapy                                                                 Wii®
                       CG = 10                                                                                physiotherapy
                                                   + 300 Wii®
                                                                                                              Conventional
                                                  Conventional                                                rehabilitation
                       N = 30
   Bower et al.                                   rehabilitation                                                    +          Nintendo
                       EG = 17     63.9 ± 0.82                           9           3               3                                      Wii Fit Plus®    6/10
      [26]                                        + 45’ Wii® in                                                45’ Wii® in      Wii®
                       CG = 13
                                                  bipedestations                                                 sitting
                                                                                                                position
                       N = 22                     60’/90’standard                                                 60’/90’
     Cho et al.                                                                                                                Nintendo
                       EG = 11     64.19 ± 1.50   rehabilitation        18           3               6          standard                      Wii Fit®       6/10
       [27]                                                                                                                     Wii®
                       CG = 11                     + 30’Wii®                                                  rehabilitation
                                                                                                                Standard
                       N = 24                       Standard
    Hung et al.                                                                                               rehabilitation   Nintendo
                       EG = 12                    rehabilitation        24           2              12                                      Wii Fit Plus®    8/10
      [28]                                                                                                     + 30’ load       Wii®
                       CG = 12                     + 30’ Wii®
                                                                                                                 transfer
                                                                                                                Standard
                                                    Standard
                       N = 28                                                                                  outpatient
    Hung et al.                                    outpatient                                                                  Nintendo
                       EG = 13     54.39 ± 1.40                         24           2              12        rehabilitation                Wii Fit Plus®    8/10
      [29]                                        rehabilitation                                                                Wii®
                       CG = 15                                                                                 + 30’ load
                                                   + 30’ Wii®
                                                                                                                 transfer
                                                    90’Wii® +
                       N = 20
  Kannan et al.                                     cognitive                                                 90’ standard     Nintendo
                       EG = 10     59.25 ± 2.47                         20                           6                                        Wii Fit®       6/10
     [30]                                             tasks                                                   rehabilitation    Wii®
                       CG = 10
                                                  simultaneously
                       N = 23                     120’/180’standard
   Karasu et al.                                                                                              120’/180’standard Nintendo
                       EG = 12     63.2 ± 1.27    rehabilitation        20           5               4                                        Wii Fit®       7/10
      [31]                                                                                                    rehabilitation     Wii®
                       CG = 11                     + 20’ Wii®
Appl. Sci. 2020, 10, 6426                                                                                                                                            10 of 33

                                                                                Table 3. Cont.

                                   Mean Age ±           EG           N◦ of                       Duration        CG            Video        Video Games in
      Study          Sample Size                                               Sessions/Week                                                                     PEDro
                                      SD           Intervention     Sessions                     (Weeks)    Intervention      Console             EG
                                                    30’general
                                                                                                             30’ general
                       N = 17                      exercises +
    Kim et al.                                                                                               exercises +      Nintendo
                       EG = 10     48.15 ± 9.68    15’ electric        9           3                3                                         Wii Sports®         6/10
      [32]                                                                                                   15’ electric      Wii®
                       CG = 7                      stimulation
                                                                                                             stimulation
                                                   + 30’ Wii®
                                                                                                                  60’
                                                        60’
                                                                                                             therapeutic
                       N = 24                       therapeutic
     Lee et al.                                                                                             exercise + 30’    Nintendo
                       EG = 12     47.53 ± 2.29    exercise with      18           3                6                                         Wii Fit Plus®       6/10
       [33]                                                                                                   functional       Wii®
                       CG = 12                     physiotherapy
                                                                                                                 task
                                                    + 30’ Wii®
                                                                                                              treatment
                                                                                                                                             Kinect Sport® +
                                                                                                                  60’                          Kinect Sport
                                                        45’
                       N = 47                                                                               conventional                       Season2® +
     Lee et al.                                    conventional
                       EG = 26     57.55 ± 2.53                       12           2                6       rehabilitation   Kinect-Xbox®         Kinect          7/10
       [34]                                        rehabilitation
                       CG = 21                                                                              + 30’ balance                    Adventures® +
                                                   + 45’ Xbox®
                                                                                                               training                     Kinect Your Shape:
                                                                                                                                            Fitness Evolved®
                                                       135’
                        N = 10                                                                                  135’
     Lee et al.                                    conventional                                                               Nintendo         Wii Sports
                        EG = 5      65.7 ± 0.5                        12           3                4       conventional                                          7/10
       [35]                                        rehabilitation                                                              Wii®             Resort®
                        CG = 5                                                                              rehabilitation
                                                    + 30’ Wii®
                                                                                                            Conventional
                       N = 50                      Conventional
  Morone et al.                                                                                             physiotherapy     Nintendo
                       EG = 25     60.16 ± 10.04   physiotherapy      12           3                4                                           Wii Fit®          8/10
     [36]                                                                                                   + 20’ balance      Wii®
                       CG = 25                      + 20’ Wii®
                                                                                                              exercises
                                                        30’
                       N = 20                                                                                    30’                         Kinect Sport® +
    Park et al.                                    conventional
                       EG = 10     63.65 ± 2.33                       42           7                6       conventional Kinect-Xbox®         Kinect Sport        8/10
      [37]                                         physiotherapy
                       CG = 10                                                                              physiotherapy                       Season2®
                                                   + 30’ Xbox®
Appl. Sci. 2020, 10, 6426                                                                                                                                                      11 of 33

                                                                                       Table 3. Cont.

                                   Mean Age ±           EG             N◦ of                            Duration            CG             Video        Video Games in
      Study          Sample Size                                                     Sessions/Week                                                                         PEDro
                                      SD           Intervention       Sessions                          (Weeks)        Intervention       Console             EG
                                                        15’
   Pedreira da         N = 27                                                                                               60’
                                                   conventional                                                                           Nintendo
  Fonseca et al.       EG = 14      52.4 ± 8.9                            20               2                10         conventional                       Wii Sports®       7/10
                                                   physiotherapy                                                                           Wii®
      [38]             CG = 13                                                                                         physiotherapy
                                                    + 45’ Wii®
                                                        40’
                       N = 19                      conventional                                                             60’
   Rajaratnam                                                                                                                            Nintendo       Wii Fit® /Kinect
                       EG = 10      61.6 ± 7.8     rehabilitation         15                                           conventional                                         7/10
    et al. [39]                                                                                                                         Wii /Kinect-Xbox®
                                                                                                                                           ®
                                                                                                                                                        Adventures®
                       CG = 9                        + 20’ VR                                                          rehabilitation
                                                   (Wii® /Xbox® )
                                                   90’ standard
                                                       group                                                                120’
                       N = 28                                                                                                         Nintendo           Wii Fit Plus® +
    Singh et al.                                   physiotherapy                                                         standard
                       EG = 15     66.2 ± 1.13                            12               2                6                          Wii® +                Kinect         5/10
       [40]                                        + 30’ VR (15’                                                           group
                       CG = 13                                                                                                       Kinect-Xbox®         Adventures
                                                    Wii® + 15’                                                         physiotherapy
                                                     Xbox® )
                                                                                                                                                        Kinect Sport® +
                                                                                                                                                         Kinect Sport
                                                                                                                            30’
                       N = 40                                                                                                                             Season2® +
   Song & Park                                                                                                          ergometric
                       EG = 20     50.73 ± 0.89      30’   Xbox®          40               5                8                           Kinect-Xbox®        Kinect          6/10
      [41]                                                                                                                 bike
                       CG = 20                                                                                                                          Adventures® +
                                                                                                                        MOTOmed
                                                                                                                                                            Kinect
                                                                                                                                                        Grunstringer®
                                                                                                                             30’
                       N = 30                          30’
     Yatar &                                                                                                           Neurodevelopment
                                                                                                                                     Nintendo
                       EG = 15     59.7 ± 4.38     Neurodevelopment 12                     3                4                                            Wii Fit Plus®      4/10
   Yildrim [42]                                                                                                        + 30’ balance    Wii®
                       CG = 15                     + 30’ Wii®
                                                                                                                          training
                                                  CG, control group; EG, experimental group; SD, standard deviation and VR, virtual reality.
Appl. Sci. 2020, 10, 6426                                                                            12 of 33

3.1.3. Outcomes
     In 12 out of 18 studies, the balance of participants in bipedestations was analysed [25–27,29–33,39–42],
in seven studies, gait was analysed [30,36–38,40–42] and, in 17 studies, aspects related to balance
during functional tasks were analysed [25–37,39–42].
     Data related to maintaining bipedestations were registered using instrumentation systems, such as
the Wii Balance Board® [26,33,39,42], pressure disc [25,40] and dynamometric platforms [27,29–31,41].
Only four studies used the Steptest observational tests [26], the Static Balance Index (SBI) [31] and
Postural Assessment Scale (PASS) [31,32].
     In order to assess balance during functional tasks, the following observational scales were used: the
Berg Balance Scale (BBS) in 11 studies [27,28,30–32,34–37,39,42], the Timed Up and Go test (TUG) in 12
studies [25–27,29–31,35,37,39–42], the Functional Reach Test (FRT) in eight studies [26,29,31,33–35,39,42]
and the Falls Efficacy Scale International (FES-I) in two studies [26,29].
     On the other hand, the variables related to gait were registered in four studies using the 10-metre
walk test (10 MWT) [36,37,40,42], the 6-min walk test (6 MWT) [30,40] and the Dynamic Gait Index
(DGI) [38,42].
     Four studies included possible adverse effects derived from the intervention [26,29,34,37],
which only were evidenced in three of them [26,29,34]. In one study, four EG and two CG participants
experienced a fall during treatment, but they were inconsequential. Those in the EG also manifested
an increase in pain, more so than those in the CG; however, this pain did not last more than 24 h.
Likewise, an intergroup difference existed as regards the sensation of fatigue experienced by the EG
participants in comparison to the CG participants after each session [26]. In other study, two CG
participants reported increased knee pain when training, and three EG participants reported increased
spasticity when playing with the Wii Balance Board® , but this symptom subsided when they played
other games [29]. In the other one, both groups experienced pain, hypertonia and dizziness and were
greater in the EG compared to the CG [34].

3.1.4. Main Results
      Regarding balance in bipedestations, in four of the included studies, no changes were
observed after the experimental intervention or after the comparison [27,39,40,42]. In four studies,
significant statisticaldifferences were found regarding pre-post-treatments in each group but not
between both groups [29,30,33,43]. On the other hand, in three studies, the results showed significant
statistical differences as regards pre-post-treatments in each group and between both groups [31,32,41],
and in one of them, differences in each group and differences between groups in the follow-up assessment
were evidenced [26]. As regards balance during functional tasks, significant statistical differences were
found in pre-post-treatments in each group [25–30,32–37,39–42], and differences between groups were
evidenced in nine of them in favour of the experimental treatment [27,31,33,35–37,39,41,42].
      For gait, one of the studies showed no pre-post changes in the two intervention groups [40].
In two studies, significant differences were found as regards pre-post-treatments in each group but
with no differences between groups [30,42]. In one study, significant differences were found only in
the CG after treatment [38]. In the other three studies, significant statistical differences were found
relating to pre-post-treatments in each group and between both groups in favour of the experimental
treatment [36,37,41] (Table 4). The effect size was only showed in Bower et al. [26].
Appl. Sci. 2020, 10, 6426                                                                                                                                                     13 of 33

                                                                       Table 4. Results of the studies included in the SR.

                                                                                                                                                               Time × Group
                                                                 Mean Values EG             Mean Values CG                                       Effect Size
                    Study                 Outcomes                                                                       Main Results                           Interaction
                                                                  (Mean ± SD)                (Mean ± SD)                                        (Cohen’s d)
                                                                                                                                                                   (F/P)
                                                               Peak plantar pressure
                                                               on affected leg, g/cm2 :   Peak plantar pressure
                                                               pre: 1138.2 ± 333.3;       on affected leg, g/cm2 :
                                                               post: 1309.5 ± 260.1;      pre: 1232.1 ± 182.1
                                                               p < 0.05                   post: 1319.7 ± 194.6
                                                               Peak plantar pressure      p < 0.05
                                                               on non-affected leg,       Peak plantar pressure
                                                               g/cm2 :                    on non-affected leg,
                                                               pre: 1465.7 ± 285.2;       g/cm2 :
                                                               post: 1350.4 ± 243.6;      pre: 1490.9 ± 196.1;
                                                               p < 0.05                   post: 1357.0 ± 185.4;
                                                               ML oscillation EO,         p < 0.05
                                                                                                                           Statistically
                                                               cm:                        ML oscillation EO,
                                                                                                                            significant
                                                               pre: 4.55 ± 0.55;          cm: pre: 4.3 ± 1.69;
                                                                                                                     improvements in both
                                                               post:2.87 ± 0.93;          post: 3.13 ± 1.81;
                                                                                                                           groups after
                                                               p < 0.05                   p < 0.05
                                    Posturography (peak                                                              intervention in all the
                                                               ML oscillation EC, cm:     ML oscillation EC, cm:
                                    plantar pressure and                                                                  variables (the
                                                               pre: 5.40 ± 0.51;          pre: 5.17 ± 2.07;
                                    oscillation in different                                                         variables recorded by
              Barcala et al. [25]                              post: 3.97 ± 0.94;         post: 3.64 ± 1.97;                                        NR             NR
                                    sensorial conditions)                                                                posturography,
                                                               p < 0.05                   p < 0.05
                                    BBS                                                                                BBS and TUG) (p <
                                                                                          AP oscillation EO, cm:
                                    TUG                                                                                        0.05),
                                                               AP oscillation EO, cm:     pre: 1.18 ± 0.13;
                                                                                                                        although without
                                                               pre: 1.18 ± 0.06;          post: 1.12 ± 0.08;
                                                                                                                      significant statistical
                                                               post: 1.13 ± 0.08;         p < 0.05
                                                                                                                      differences between
                                                               p < 0.05                   AP oscillation EC, cm:
                                                                                                                              groups.
                                                               AP oscillation EC, cm:     pre: 1.26 ± 0.15;
                                                               pre: 1.48 ± 0.27;          post: 1.18 ± 0.07;
                                                               post: 1.35 ± 0.27;         p < 0.05
                                                               p < 0.05                   BBS, score:
                                                               BBS, score:                Pre: 37.2 ± 5.22
                                                               Pre: 39.6 ± 6.43;          post: 42.2 ± 4.80
                                                               post: 41.9 ± 6.91;         p < 0.05
                                                               p < 0.05                   TUG, s:
                                                               TUG, s:                    Pre: 28.1 ± 3.10;
                                                               Pre: 27.9 ± 8.22;          post: 25.2 ± 2.78;
                                                               post: 24.3± 8.64;          p < 0.05
                                                               p < 0.05
Appl. Sci. 2020, 10, 6426                                                                                                                                                            14 of 33

                                                                                      Table 4. Cont.

                                                                                                                                                                  Time × Group
                                                            Mean Values EG           Mean Values CG                                           Effect Size
                    Study              Outcomes                                                                 Main Results                                       Interaction
                                                             (Mean ± SD)              (Mean ± SD)                                            (Cohen’s d)
                                                                                                                                                                      (F/P)
                                                          EO COP velocity,
                                                                                   EO COP velocity,
                                                          cm/s:
                                                                                   cm/s:
                                                          pre: 1.90 ± 0.76;
                                                                                   pre: 1.54 ± 0.38;
                                                          post: 1.59 ± 0.49;
                                                                                   post: 1.54 ± 0.42;
                                                          p > 0.05
                                                                                   p > 0.05
                                                          EO ML COP velocity,
                                                                                   EO ML COP velocity:
                                                          cm/s:
                                                                                   pre: 0.60 ± 0.13;
                                                          pre: 0.94 ± 0.45;
                                                                                   post: 0.59 ± 0.16;
                                                          post: 0.71 ± 0.27;
                                                                                   p > 0.05                                               EO COP velocity:
                                                          p > 0.05 EO AP
                                                                                   EO AP velocity, cm/s:             Clinical                   −0.93
                                                          velocity, cm/s:
                                                                                   Pre: 1.29 ± 0.33;        improvements in both        EO ML COP velocity:
                                                          Pre: 1.45 ± 0.60;
                                                                                   post: 1.31 ± 0.38;             groups after                    −1
                                                          post: 1.28 ± 0.41;
                                                                                   p > 0.05                 intervention in all the     EO AP velocity: −0.69
                                                          p > 0.05
                                                                                   EC COP velocity,              variables (the           EC COP velocity:
                                  Wii Balance Board®      EC COP velocity,
                                                                                   cm/s:                    variables recorded by               −0.46
                                  (displacement           cm/s:
                                                                                   pre: 2.62 ± 0.82;         Wii Balance Board® ,       EC ML COP velocity:
                                  velocity in different   pre: 2.89 ± 1.30;
                                                                                   post: 2.36 ± 0.67;        Steptest, FRT, TUG,                −0.58            Steptest NR/0.002
                                  sensorial conditions    post: 2.29 ± 0.70;
                                                                                   p > 0.05                     FES-I), but not            EC AP velocity:         FRT: NR/0.066
              Bower et al. [26]   and weight shifting)    p > 0.05
                                                                                   EC ML COP velocity,      statistically significant           −0.30             NR in the other
                                  Steptest                EC ML COP velocity,
                                                                                   cm/s:                      improvements (p >          ML weight shifting:         variables
                                  FRT                     cm/s:
                                                                                   pre: 0.89 ± 0.34;                  0.05).                     0.71
                                  TUG                     pre: 1.38 ± 0.99;
                                                                                   post: 0.76 ± 0.22;          Not statistic and         Steptest (affected):
                                  FES-I                   post: 0.94 ± 0.38;
                                                                                   p > 0.05                  clinically significant              1.54
                                                          p > 0.05
                                                                                   EC AP velocity, cm/s:     differences between        Steptest (unaffected):
                                                          EC AP velocity, cm/s:
                                                                                   pre: 2.27 ± 0.70;             groups in any                   0.41
                                                          pre: 2.21 ± 0.84;
                                                                                   post: 2.12 ± 0.61;            variable after               FRT: 0.03
                                                          post: 1.91 ± 0.60;
                                                                                   p > 0.05                      intervention.               TUG: 0.29
                                                          p > 0.05
                                                                                   ML weight shifting, n:                                    FES-I: 0.19
                                                          ML weight shifting, n:
                                                                                   pre: 8.1 ± 3.4;
                                                          pre: 7.2 ± 3.5;
                                                                                   post: 10.1 ± 2.3;
                                                          post: 10.9 ± 4.0;
                                                                                   p > 0.05
                                                          p > 0.05
                                                                                   Steptest (affected),
                                                          Steptest (affected),
                                                                                   score:
                                                          score:
                                                                                   pre: 7.4 ± 6.0;
                                                          pre: 2.7 ± 3.8;
                                                                                   post: 8.9 ± 5.4;
                                                          post: 8.9 ± 5.4;
                                                                                   p > 0.05
                                                          p > 0.05
Appl. Sci. 2020, 10, 6426                                                                                                                                           15 of 33

                                                                                      Table 4. Cont.

                                                                                                                                                     Time × Group
                                                            Mean Values EG           Mean Values CG                                    Effect Size
                    Study              Outcomes                                                                Main Results                           Interaction
                                                             (Mean ± SD)              (Mean ± SD)                                     (Cohen’s d)
                                                                                                                                                         (F/P)
                                                          Steptest (unaffected),   Steptest (unaffected,
                                                          score:                   score):
                                                          pre: 4.2 ± 3.1;          pre:6.1 ± 5.8;
                                                          post:9.0 ± 4.2;          post:9.7 ± 4.7;
                                                          p > 0.05                 p > 0.05
                                                          FRT, cm:                 FRT, cm:
                                                          pre: 28.1 ± 6.4;         pre: 28.3 ± 9.6;
                                                          post: 31.1 ± 6.5;        post: 31.1 ± 9.0;
                                                          p > 0.05                 p > 0.05
                                                          TUG, s:                  TUG, s:
                                                          Pre: 30.3 ± 15.9;        Pre: 32.0 ± 32.2;
                                                          post: 19.2 ± 15.5;       Post: 16.0 ± 11.9;
                                                          p > 0.05                 p > 0.05
                                                          FES-I, score:            FES-I, score:
                                                          pre: 16.6 ± 4.8;         pre: 19.3 ± 7.0;
                                                          post: 11.3 ± 3.2;        post: 13.0 ± 3.4;
                                                          p > 0.05                 p > 0.05
                                                          PSV AP EO, mm/s:         PSV AP EO, mm/s:
                                                          Pre: 7.37 ± 2.20;        Pre: 6.01 ± 1.85;
                                                          Post: 6.20 ± 1.70;       post: 5.64 ± 1.57;
                                                                                                                  Statistically
                                                          p > 0.05                 p > 0.05
                                                                                                                   significant
                                                          PSV AP EC, mm/s:         PSV AP EC, mm/s:
                                                                                                           improvements in both
                                                          Pre: 9.97 ± 2.69;        Pre: 9.67 ± 2.72;
                                                                                                                 groups after
                                                          Post:9.18 ± 1.75;        Post:9.14 ± 2.31;
                                                                                                             intervention in BBS
                                                          p > 0.05                 p > 0.05
                                                                                                             and TUG (p < 0.01);
                                                          PSV ML EO, mm/s:         PSV ML EO, mm/s:
                                                                                                                     statistic
                                  Posturography           Pre: 11.40 ± 2.24;       Pre: 9.92 ± 1.28;
                                                                                                            improvements were
                                  (Postural Sway          Post: 11.22 ± 2.06;      Post:9.82 ± 1.20;
                                                                                                           significantly higher in
                                  Velocity in different   p > 0.05                 p > 0.05
                Cho et al. [27]                                                                               the EG (p < 0.05).          NR             NR
                                  sensorial conditions)   PSV ML EC, mm/s:         PSV ML EC, mm/s:
                                                                                                                 The variables
                                  BBS                     Pre: 16.78 ± 2.25;       Pre: 14.41 ± 4.08;
                                                                                                                  recorded by
                                  TUG                     Post: 15.50 ± 3.59;      Post: 14.12 ± 4.01;
                                                                                                                posturography
                                                          p > 0.05                 p > 0.05
                                                                                                                 presented no
                                                          BBS, score:              BBS, score:
                                                                                                            significant statistical
                                                          Pre: 39.09 ± 5.66;       Pre: 41.09 ± 4.01;
                                                                                                              differences in any
                                                          Post: 43.09 ± 4.80;      Post: 43.90 ± 4.06;
                                                                                                                  group after
                                                          p < 0.001                p < 0.001
                                                                                                               intervention (p >
                                                          TUG, s:                  TUG, s:
                                                                                                                      0.05).
                                                          Pre: 21.74 ± 3.41;       Pre: 19.60 ± 4.42;
                                                          Post: 20.40 ± 3.19;      Post: 19.08 ± 4.52;
                                                          p < 0.001                p < 0.01
Appl. Sci. 2020, 10, 6426                                                                                                                                                      16 of 33

                                                                                      Table 4. Cont.

                                                                                                                                                         Time × Group
                                                            Mean Values EG           Mean Values CG                                     Effect Size
                    Study               Outcomes                                                                Main Results                              Interaction
                                                             (Mean ± SD)              (Mean ± SD)                                      (Cohen’s d)
                                                                                                                                                             (F/P)
                                                                                                                     Clinical
                                                                                                            improvements in both
                                                                                                                   groups after
                                                                                                              intervention in BBS,
                                                          BBS, score:              BBS, score:
                                                                                                               but not statistically
                                                          Pre: 46.58 ± 5.16;       Pre: 48.25 ± 3.91;
               Hung et al. [28]   BBS                                                                        significant (p > 0.05)        NR                  NR
                                                          Post: 48.83 ± 5.02;      Post: 50.42 ± 3.99;
                                                                                                                 Not significant
                                                          p > 0.05                 p > 0.05
                                                                                                             statistical differences
                                                                                                               between groups in
                                                                                                                    BBS after
                                                                                                                  intervention.
                                                          Weight bearing on        Weight bearing on
                                                          affected leg with head   affected leg with head
                                                                                                                                                        Intervention effect
                                                          straight EO while        straight EO while
                                                                                                                                                       Percentage of weight
                                                          standing on a solid      standing on a solid
                                                                                                                                                        bearing on affected
                                                          surface, %:              surface, %:                     Statistically
                                                                                                                                                      leg with head straight
                                                          Pre: 42.31 ± 7.94;       Pre: 40.81 ± 10.12;              significant
                                                                                                                                                      EO while standing on
                                                          Post: 43.34 ± 6.03;      Post: 46.07 ± 6.39;      improvements in both
                                                                                                                                                          a solid surface:
                                                          p < 0.05                 p < 0.05                        groups after
                                                                                                                                                              3.61/0.07
                                                          Follow-up: 42.08 ±       Follow-up: 46.72 ±         intervention in the
                                                                                                                                                       Percentage of weight
                                  Posturography           4.00;                    8.80;                    variables recorded by
                                                                                                                                                        bearing on affected
                                  (Percentage of weight   p > 0.05                 p > 0.05                  posturography, FRT,
                                                                                                                                                      leg with head straight
                                  bearing on affected     Weight bearing on        Weight bearing on          FES-I and TUG (p <
                                                                                                                                                      EC while standing on
                                  leg in different        affected leg with head   affected leg with head     0.05). These results
                                                                                                                                                          a solid surface:
                                  sensorial conditions,   straight EC while        straight EC while          were maintained at
                                                                                                                                                              2.61/0.12
               Hung et al. [29]   Stability index in      standing on a solid      standing on a solid      3-month follow-up in           NR
                                                                                                                                                         Stability index in
                                  different sensorial     surface, %:              surface, %:              FRT and TUG but not
                                                                                                                                                         head straight EO
                                  conditions)             Pre: 43.58 ± 10.46;      Pre: 41.10 ± 9.86;           in the variables
                                                                                                                                                       while standing on a
                                  FRT                     Post: 44.03 ± 6.76;      Post: 46.17 ± 6.95;             recorded by
                                                                                                                                                           solid surface:
                                  TUG                     P < 0.05                 P < 0.05                   posturography and
                                                                                                                                                              0.02/0.89
                                  FES-I                   Follow-up: 42.23 ±       Follow-up: 45.86 ±                  FES-I.
                                                                                                                                                         Stability index in
                                                          4.99;                    7.98;                        Not significant
                                                                                                                                                         head straight EC
                                                          p > 0.05                 p > 0.05                  statistical differences
                                                                                                                                                       while standing on a
                                                          Stability index in       Stability index in         between groups in
                                                                                                                                                           solid surface:
                                                          head straight EO         head straight EO            any variable after
                                                                                                                                                           1.71/0.20 FRT:
                                                          while standing on a      while standing on a            intervention.
                                                                                                                                                          0.00/0.96 TUG:
                                                          solid surface:           solid surface:
                                                                                                                                                          0.57/0.46 FES-I:
                                                          Pre: 27.37 ± 12.52;      Pre: 24.22 ± 9.81;
                                                                                                                                                              0.00/0.97
                                                          Post: 28.40 ± 15.11;     Post: 25.69 ± 8.92;
                                                          P < 0.05                 P < 0.05
Appl. Sci. 2020, 10, 6426                                                                                                                   17 of 33

                                                                 Table 4. Cont.

                                                                                                                      Time × Group
                                         Mean Values EG         Mean Values CG                       Effect Size
                    Study   Outcomes                                                 Main Results                      Interaction
                                          (Mean ± SD)            (Mean ± SD)                        (Cohen’s d)
                                                                                                                          (F/P)
                                       Follow-up: 28.84 ±     Follow-up: 27.17 ±
                                       10.25;                 12.37;
                                       p > 0.05               p > 0.05
                                       Stability index in     Stability index in
                                       head straight EC       head straight EC                                       Maintenance effect
                                       while standing on a    while standing on a                                   Percentage of weight
                                       solid surface:         solid surface:                                         bearing on affected
                                       Pre: 43.34 ± 27.73;    Pre: 35.17 ± 13.45;                                  leg with head straight
                                       Post: 38.30 ± 17.82;   Post: 38.29 ± 18.94;                                 EO while standing on
                                       P < 0.05               P < 0.05                                                 a solid surface:
                                       Follow-up: 38.52 ±     Follow-up: 36.86 ±                                          5.06/0.03
                                       23.46;                 16.52;                                                Percentage of weight
                                       p > 0.05               p > 0.05                                               bearing on affected
                                       FRT, cm:               FRT, cm:                                             leg with head straight
                                       Pre: 21.62 ± 5.19;     Pre: 21.73 ± 5.33;                                   EC while standing on
                                       Post: 25.35 ± 3.92;    Post: 25.37 ± 4.99;                                      a solid surface:
                                       p < 0.05               p < 0.05                                                    2.61/0.12
                                       Follow-up: 24.63 ±     Follow-up: 25.82 ±                                      Stability index in
                                       4.82;                  7.29;                                                   head straight EO
                                       p < 0.05               p < 0.05                                              while standing on a
                                       TUG, s:                TUG, s:                                                   solid surface:
                                       Pre: 26.06 ± 12.05;    Pre: 29.45± 16.22;                                          0.18/0.67
                                       Post: 20.88 ± 7.77;    Post: 26.61 ± 12.92;                                    Stability index in
                                       p < 0.05               p < 0.05                                                head straight EC
                                       Follow-up: 23.01±      Follow-up: 25.60 ±                                    while standing on a
                                       7.89;                  13.79;                                                    solid surface:
                                       p < 0.05               p < 0.05                                                    1.71/0.20
                                       FES-I:                 FES-I:                                                    FRT: 0.16/0.69
                                       Pre: 29.15 ± 6.85;     Pre: 30.07 ± 4.76;                                       TUG: 0.07/0.79
                                       Post: 25.38 ± 6.06;    Post: 26.20 ± 6.80;                                      FES-I: 0.02/0.89
                                       P < 0.05               P < 0.05
                                       Follow-up: 29.31 ±     Follow-up: 30.80 ±
                                       9.81;                  11.42;
                                       p > 0.05               p > 0.05
Appl. Sci. 2020, 10, 6426                                                                                                                                                     18 of 33

                                                                                       Table 4. Cont.

                                                                                                                                                          Time × Group
                                                             Mean Values EG           Mean Values CG                                     Effect Size
                    Study               Outcomes                                                                Main Results                               Interaction
                                                              (Mean ± SD)              (Mean ± SD)                                      (Cohen’s d)
                                                                                                                                                              (F/P)
                                                                                                                   Statistically
                                                                                                                    significant
                                                                                                              improvements after
                                                                                                             intervention in EG in
                                                                                                                MVL (p = 0.001).
                                                                                                                   Statistically
                                   Posturography                                                                    significant
                                   (MVL)                                                                    improvements in both                        MVL: 14.295/0.001
                                                           Data in graph,           Data in graph,
              Kannan et al. [30]   BBS                                                                             groups after             NR           NR in the other
                                                           Not extractable          Not extractable
                                   TUG                                                                        intervention in BBS,                         variables
                                   6 MWT                                                                    TUG and 6 MWT (p <
                                                                                                                       0.05).
                                                                                                                Not statistically
                                                                                                            significant differences
                                                                                                               between groups in
                                                                                                               any variable after
                                                                                                                  intervention.
                                                           displacement ML EO,      displacement ML EO,
                                                           cm:                      cm:
                                                                                                                  Statistically
                                                           pre: 3.0 ± 1.3;          pre: 2.7 ± 0.9;
                                                                                                                   significant
                                                           post: 1.8 ± 0.5;         post: 2.4 ± 0.9;                                                    Intervention effect
                                                                                                            improvements in both
                                                           p < 0.05                 p < 0.05                                                           Displacement ML EO:
                                                                                                                  groups after
                                                           follow-up: 1.7 ± 0.5;    follow-up: 2.5 ± 0.6;                                                    NR/0.034
                                                                                                                intervention in
                                                           p: NR                    p: NR                                                              displacement ML EC:
                                   Posturography                                                            variables recorded by
                                                           displacement ML EC,      displacement ML EC,                                                      NR/0.071
                                   (displacement of the                                                      posturography, BBS,
                                                           cm:                      cm:                                                                displacement AP EO:
                                   centre of pressure in                                                     FRT, SBI and PASS (p
                                                           pre: 3.5 ± 1.4;          pre: 3.1 ± 1.1;                                                          NR/0.012
                                   different sensorial                                                               < 0.05).
                                                           post: 2.4 ± 0.7;         post: 2.9 ± 1.3;                                                   displacement AP EC:
                                   conditions)                                                              The improvements in
              Karasu et al. [31]                           p < 0.05                 p < 0.05                                                NR               NR/0.018
                                   BBS                                                                        BBS and FRT were
                                                           follow-up: 2.2 ± 0.7;    follow-up: 3.1 ± 0.6;                                                 BBS: NR/
Appl. Sci. 2020, 10, 6426                                                                                                               19 of 33

                                                                    Table 4. Cont.

                                                                                                                         Time × Group
                                          Mean Values EG           Mean Values CG                          Effect Size
                     Study   Outcomes                                                      Main Results                   Interaction
                                           (Mean ± SD)              (Mean ± SD)                           (Cohen’s d)
                                                                                                                             (F/P)
                                        pre: 3.0 ± 0.9;          pre: 2.5 ± 0.8;
                                        post: 2.4 ± 0.8;         post: 2.6 ± 1.4;
                                        p < 0.05                 p < 0.05
                                        follow-up: 2.05 ± 0.7;   follow-up: 2.5 ± 0.5;
                                        p: NR                    p: NR
                                        displacement AP EC,      displacement AP EC,
                                        cm                       cm
                                        pre: 3.4 ± 0.9;          pre: 3.1 ± 0.7;
                                        post: 2.8± 0.8;          post: 3.2 ± 1.4;
                                        p < 0.05                 p < 0.05
                                        follow-up: 2.4 ± 0.6;    follow-up: 3.3 ± 0.6;
                                        p: NR                    p: NR
                                        BBS, score:              BBS, score:
                                        pre: 38.8 ± 6.9;         pre: 39.1 ± 6.9;
                                        post: 48.9± 6.4;         post: 42.2 ± 6.4;
                                        p < 0.05                 p < 0.05
                                        follow-up: 48.7 ± 4.7;   follow-up: 39.4 ± 5.7;
                                        p: NR                    p: NR
                                        FRT, cm:                 FRT, cm:
                                        pre: 16.4 ± 5.5;         pre: 18.8 ± 3.3;
                                        post: 25.2 ± 5.5;        post: 22.2 ± 5.1;
                                        p < 0.05                 p < 0.05
                                        follow-up: 23.6 ± 5.4;   follow-up: 20 ± 3.14)
                                        p: NR                    p: NR
                                        SBI, score:              SBI, score:
                                        pre: 426.2 ± 285.3;      pre: 412.4 ± 196.8;
                                        post: 369.3 ± 301.5;     post: 314.2 ± 129.8;
                                        p < 0.05                 p < 0.05
                                        follow-up: 337 ±         follow-up: 399.7 ±
                                        282.8;                   74.7;
                                        p: NR                    p: NR
                                        PASS, score:             PASS, score:
                                        pre: 28.8 ± 4.3;         pre: 27.9 ± 5.2;
                                        post: 32.5 ± 2.5;        post: 30.4 ± 4.1;
                                        p < 0.05                 p < 0.05
                                        follow-up: 32 ± 2.4;     follow-up: 29.2 ± 3.5;
                                        p: NR                    p: NR
                                        TUG, s:                  TUG, s:
                                        pre: 32.5 ± 21.2;        pre: 27.4 ± 15.0;
                                        post: 19.5 ± 9.8;        post: 24 ± 13.5;
                                        p > 0.05                 p > 0.05
                                        follow-up: 20.5 ± 8.3;   follow-up: 29.6 ± 10.5;
                                        p: NR                    p: NR
Appl. Sci. 2020, 10, 6426                                                                                                                                       20 of 33

                                                                                    Table 4. Cont.

                                                                                                                                                 Time × Group
                                                            Mean Values EG         Mean Values CG                                  Effect Size
                    Study              Outcomes                                                             Main Results                          Interaction
                                                             (Mean ± SD)            (Mean ± SD)                                   (Cohen’s d)
                                                                                                                                                     (F/P)
                                                                                                              Statistically
                                                          PASS, score:           PASS, score:                  significant
                                                          Pre: 25.8 ± 3.85;      Pre: 26.42 ± 1.98;     improvements in both
                                                          Post:30.3 ± 3.19;      Post: 28.0 ± 1.63;           groups after
                                  PASS                    p < 0.05               p < 0.05                intervention in PASS
                Kim et al. [32]                                                                                                       NR             NR
                                  MMAS                    MMAS, score:           MMAS, score:           and MMAS (p < 0.05).
                                                          Pre: 29.8 ± 6.4;       Pre: 31.71 ± 1.88;      These improvements
                                                          Post: 34.7 ± 6.2;      Post: 33.57 ± 1.51;        were statistical
                                                          p < 0.05               p < 0.05               significantly higher in
                                                                                                           the EG (p < 0.05).
                                                          COP path length EO,    COP path length EO,
                                                          cm:                    cm:
                                                          Pre: 63.86 ± 33.53;    Pre: 60.65 ± 30.14;
                                                          Post: 51.25 ± 27.29;   Post: 49.52 ± 18.50;
                                                          p < 0.05               p < 0.05                      Statistically
                                                          COP path length EC,    COP path length EC,            significant
                                                          cm:                    cm:                    improvements in both
                                                          Pre: 75.71 ± 37.61;    Pre: 65.85 ± 34.95;           groups after
                                                          Post: 75.71 ± 37.61;   Post: 59.00 ± 24.88;        intervention in
                                                          p < 0.001              p > 0.05               variables recorded by
                                  Wii Balance Board®
                                                          COP velocity EO,       COP velocity EO,        Wii Balance Board®
                                  (COP path length and
                                                          cm/s:                  cm/s:                    and FRT (p < 0.05).
                Lee et al. [33]   velocity in different                                                                               NR             NR
                                                          Pre: 2.12 ± 1.11;      Pre: 2.02 ± 1.00;      The improvements in
                                  sensorial conditions)
                                                          Post: 1.70 ± 0.90;     Post: 1.65 ± 0.61;      FRT were statistical
                                  FRT
                                                          p < 0.05               p < 0.05               significantly higher in
                                                          COP velocity EC,       COP velocity EC,         the EG (p < 0.0001),
                                                          cm/s:                  cm/s:                   but not in variables
                                                          Pre: 2.52 ± 1.25;      Pre: 2.19 ± 1.16;          recorded by Wii
                                                          Post: 1.99 ± 0.79;     Post: 1.96 ± 0.82;      Balance Board® (p >
                                                          p < 0.05               p > 0.05                          0.05).
                                                          FRT, cm:               FRT, cm:
                                                          Pre: 15.84 ± 6.32;     Pre: 16.40 ± 5.91;
                                                          Post: 24.75 ± 7.44;    Post: 21.39 ± 6.31;
                                                          p < 0.0001             p < 0.0001
Appl. Sci. 2020, 10, 6426                                                                                                                                        21 of 33

                                                                             Table 4. Cont.

                                                                                                                                             Time × Group
                                                     Mean Values EG         Mean Values CG                                   Effect Size
                    Study               Outcomes                                                     Main Results                             Interaction
                                                      (Mean ± SD)            (Mean ± SD)                                    (Cohen’s d)
                                                                                                                                                 (F/P)
                                                   BBS, score:            BBS, score:
                                                   Pre: 43.35 ± 6.23;     Pre: 43.48 ± 6.62;
                                                   Post: 46.19 ± 5.57;    Post: 45.71 ± 6.64;
                                                                                                       Statistically
                                                   P < 0.05               p < 0.05
                                                                                                        significant
                                                   Follow-up: 46.31 ±     Follow-up: 45.00 ±
                                                                                                 improvements in both
                                                   5.80;                  5.06;
                                                                                                       groups after
                                                   p < 0.05               p < 0.05
                                                                                                    intervention and
                                                   FRT, cm:               FRT, cm:
                                                                                                 follow-up in BBS and                      Intervention effect
                                                   Pre: 21.43 ± 7.62;     Pre: 22.05 ± 8.27;
                                                                                                   TUG-cog (p < 0.05),                      BBS: 0.705/0.497
                                  BBS              Post: 22.63 ± 5.07;    Post: 21.84 ± 7.46;
                                                                                                    although without                        FRT: 3.066/0.051
                Lee et al. [34]   FRT              P > 0.05               p > 0.05                                              NR
                                                                                                 significant differences                     TUG-cog: NR
                                  TUG-cog          Follow-up: 22.48 ±     Follow-up: 18.74 ±
                                                                                                 between both groups.                      Maintenance effect
                                                   5.87;                  5.88;
                                                                                                    FRT presented no                              NR
                                                   p > 0.05               p > 0.05
                                                                                                  significant statistical
                                                   TUG-cog, s:            TUG-cog, s:
                                                                                                    differences in any
                                                   Pre: 27.18 ± 14.90;    Pre: 32.13 ± 24.63;
                                                                                                        group after
                                                   Post: 24.15 ± 10.87;   Post: 28.48 ± 21.53;
                                                                                                    intervention and
                                                   p < 0.05               p < 0.05
                                                                                                  follow up (p > 0.05).
                                                   Follow-up: 23.52 ±     Follow-up: 28.67 ±
                                                   10.96;                 18.73;
                                                   p < 0.05               p < 0.05
                                                                                                        Statistically
                                                                                                        significant
                                                                                                 improvements in both
                                                                                                       groups after
                                                   BBS, score:            BBS, score:              intervention in BBS
                                                   Pre: 41.8 ± 4.2;       Pre: 38.8 ± 3.7;          and FRT (p < 0.05).
                                                   Post: 46.2 ± 4.3;      Post: 41.2 ± 2.9;       These improvements
                                                   p:
Appl. Sci. 2020, 10, 6426                                                                                                                                      22 of 33

                                                                            Table 4. Cont.

                                                                                                                                           Time × Group
                                                    Mean Values EG         Mean Values CG                                  Effect Size
                    Study              Outcomes                                                     Main Results                            Interaction
                                                     (Mean ± SD)            (Mean ± SD)                                   (Cohen’s d)
                                                                                                                                               (F/P)
                                                                                                       Statistically
                                                                                                       significant
                                                                                                improvements in both
                                                                                                      groups after
                                                                                                   intervention in all
                                                                                                     variables (BBS,
                                                                                                FAC and 10 MWT) (p
                                                                                                         < 0.001),                       Intervention effect
                                                                                                 the improvements in                     10 MWT: NR/0.099
                                   BBS
                                                  Data in graph,         Data in graph,             BBS and 10 MWT                         NR in the other
              Morone et al. [36]   FAC                                                                                        NR
                                                  Not extractable        Not extractable            were statistically                        variables
                                   10 MWT
                                                                                                significantly higher in                  Maintenance effect
                                                                                                    the EG (p < 0.05),                           NR
                                                                                                   but not in FAC (p >
                                                                                                           0.05).
                                                                                                   These Statistically
                                                                                                       significant
                                                                                                  improvements were
                                                                                                      maintained in
                                                                                                        follow-up
                                                  BBS, score:            BBS, score:
                                                                                                      Statistically
                                                  Pre: 35.80 ± 8.61;     Pre: 37.30 ± 11.98;
                                                                                                      significant
                                                  Post: 50.00 ± 6.27;    Post: 44.70 ± 7.47;
                                                                                                improvements in both
                                                  p:
Appl. Sci. 2020, 10, 6426                                                                                                                                         23 of 33

                                                                                    Table 4. Cont.

                                                                                                                                                   Time × Group
                                                            Mean Values EG         Mean Values CG                                    Effect Size
                    Study                  Outcomes                                                         Main Results                            Interaction
                                                             (Mean ± SD)            (Mean ± SD)                                     (Cohen’s d)
                                                                                                                                                       (F/P)
                                                                                                               Statistically
                                                                                                               significant
                                                                                                        improvements in CG
                                                                                                          after intervention in
                                                                                                             DGI (p < 0.05).
            Pedreira da Fonseca                           Data in graph,         Data in graph,
                                     DGI                                                                         Clinical               NR             NR
                 et al. [38]                              Not extractable        Not extractable
                                                                                                         improvements in EG
                                                                                                          after intervention in
                                                                                                              DGI, but not
                                                                                                        statistically significant
                                                                                                                (p > 0.05)
                                                                                                               Statistically
                                                                                                                significant
                                                                                                          improvements after
                                                                                                         intervention in EG in
                                                                                                           FRT and TUG (p <
                                                                                                           0.05) and in CG in
                                                                                                             TUG (p < 0.05).
                                     Wii Balance Board®                                                  Variable recorded by
                                     (COP)                                                                Wii Balance Board®
            Rajaratnam et al. [39]   BBS                  Data not extractable   Data not extractable         presented no              NR             NR
                                     FRT                                                                  significant statistical
                                     TUG                                                                    differences in any
                                                                                                                group after
                                                                                                        intervention (p > 0.05).
                                                                                                              No significant
                                                                                                         statistical differences
                                                                                                         between both groups
                                                                                                         in any variables after
                                                                                                        intervention (p > 0.05)
Appl. Sci. 2020, 10, 6426                                                                                                                                             24 of 33

                                                                                     Table 4. Cont.

                                                                                                                                                     Time × Group
                                                           Mean Values EG           Mean Values CG                                    Effect Size
                    Study               Outcomes                                                               Main Results                           Interaction
                                                            (Mean ± SD)              (Mean ± SD)                                     (Cohen’s d)
                                                                                                                                                         (F/P)
                                                         OBS, score:              OBS, score:
                                                         Pre: 2.53 ± 1.02;        Pre: 3.25 ± 1.12;
                                                         Post: 2.70 ± 0.72;       Post: 3.31 ± 1.39;
                                                         p: >0.05                 p: >0.05
                                                         TUG, s:                  TUG, s:
                                                         Pre: 25.33 ± 14.38;      Pre: 23.27 ± 12.15;          No significant
                                   Posturography
                                                         Post: 23.07 ± 12.22;     Post: 21.69 ± 12.29;     statistical differences                    TUG: NR/0.02
                                   (OBS)
                                                         p: >0.05                 p: >0.05                   were found in any                      10 MWT: NR/0.66
               Singh et al. [40]   TUG                                                                                                   NR
                                                         10 MWT, m/s:             10 MWT, m/s:                   group after                         6 MWT: NR/0.59
                                   10 MWT
                                                         Pre: 13.20 ± 7.46;       Pre: 14.80 ± 10.16;       intervention in any                         OBS: NR
                                   6 MWT
                                                         Post: 12.17 ± 6.16;      Post: 15.03 ± 9.35;        variable (p > 0.05)
                                                         p: >0.05                 p: >0.05
                                                         6 MWT, m:                6 MWT, m:
                                                         Pre: 162.40 ± 78.97;     Pre: 209.92 ± 176.53;
                                                         Post: 165.27 ± 78.52;    Post: 167.23 ± 103.85;
                                                         p: >0.05                 p: >0.05
                                                         Affected side WB, %:     Affected side WB, %:
                                                         Pre: 42.8 ± 6.1;         Pre: 42.1 ± 4.3;
                                                         Post: 46.1 ± 4.3;        Post: 43.3 ± 4.9;
                                                         p:
Appl. Sci. 2020, 10, 6426                                                                                                                                                                        25 of 33

                                                                                            Table 4. Cont.

                                                                                                                                                                          Time × Group
                                                                 Mean Values EG            Mean Values CG                                         Effect Size
                    Study                  Outcomes                                                                    Main Results                                        Interaction
                                                                  (Mean ± SD)               (Mean ± SD)                                          (Cohen’s d)
                                                                                                                                                                              (F/P)
                                                               Weight distribution,     Weight distribution,
                                                               paretic side, %:         paretic, %:
                                                               Pre: 44.04 ± 7.47;       Pre: 47.54 ± 10.16;
                                                               Post: 48.00 ± 2.80;      Post: 48.59 ± 8.38;
                                                               p: ≤0.05                 p: >0.05
                                                               Follow-up: 46.64 ±       Follow-up: 48.14 ±               Statistically
                                                               4.40;                    8.94;                            significant
                                                               p: >0.05                 p: >0.05                  improvements in both
                                                               FRT, cm:                 FRT, cm:                        groups after
                                                               Pre: 25.26 ± 5.92;       Pre: 24.20 ± 6.66;          intervention in FRT,
                                                               Post: 29.40 ± 5.16;      Post: 27.13 ± 6.19;       BBS, TUG and DGI (p
                                                               p: ≤0.05                 p: ≤0.05                            ≤ 0.05).
                                                               Follow-up: 30.06 ±       Follow-up: 26.80 ±         Significant statistical
                                                               5.16;                    6.58;                       differences between
                                                               p: >0.05                 p: >0.05                    both groups in FRT,
                                     Wii Balance Board®        BBS, score:              BBS, score:               BBS, TUG and DGI (p
                                     (weight distribution)     Pre: 45.60 ± 5.26;       Pre: 39.60 ± 9.31;           ≤ 0.05), with better
                                     FRT                       Post: 50.33 ± 4.09;      Post: 44.80 ± 7.48;             results in EG.
            Yatar & Yildrim [42]                                                                                                                      NR                        NR
                                     BBS                       P: ≤0.05                 P: ≤0.05                         Statistically
                                     TUG                       Follow-up: 50.33 ±       Follow-up: 44.20 ±               significant
                                     DGI                       4.16;                    7.77;                      improvements in EG
                                                               p: >0.05                 p: ≤0.05                    after intervention in
                                                               TUG, s:                  TUG, s:                     weight distribution
                                                               Pre: 17. 96 ± 7.77;      Pre: 26.36 ± 11.60;           recorded by Wii
                                                               Post: 16.17 ± 8.23;      Post: 22.11 ± 11.88;       Balance Board® (p ≤
                                                               P: ≤0.05                 P: ≤0.05                  0.05), but not in CG (P
                                                               Follow-up: 15.95 ±       Follow-up: 22.73 ±                  > 0.05)
                                                               7.93;                    11.95;                     These improvements
                                                               p: >0.05                 p: >0.05                    were maintained in
                                                               DGI, score:              DGI, score:                CG in BBS and TUG
                                                               Pre: 14.86 ± 4.12;       Pre: 12.60 ± 3.96;        in follow-up (p ≤ 0.05)
                                                               Post: 16.86 ± 3.35;      Post: 14.46 ± 3.48;
                                                               P: ≤0.05                 P: ≤0.05
                                                               Follow-up: 16.86 ±       Follow-up: 14.86 ±
                                                               3.33;                    4.06;
                                                               p: >0.05                 p: >0.05
      10 MWT, 10-metre walk test; 6 MWT, 6-min walk test; AP, anteroposterior; BBS, Berg Balance Scale; COP, centre of pressure; DGI, Dynamic Gait Index; EC, eyes closed; EO, eyes open; FAC,
      functional outpatient category; FES-I, Falls Efficacy Scale International; FRT, Functional Reach Test; LOS, limit of stability; ML, mediolateral; MMAS, modified motor assessment scale; MVL,
      movement velocity; NR, not reported; OBS, Overall Balance Score; PASS, Postural Assessment Scale; post, values measured after intervention; pre, values measured before intervention;
      PSV, Postural Sway Velocity; SBI, Static Balance Index; SD, standard deviation TUG, Timed Up and Go test; TUG-cog, cognitive Timed Up and Go test and WB, weight bearing.
Appl. Sci. 2020, 10, 6426                                                                                    26 of 33

3.2. Quality of Evidence
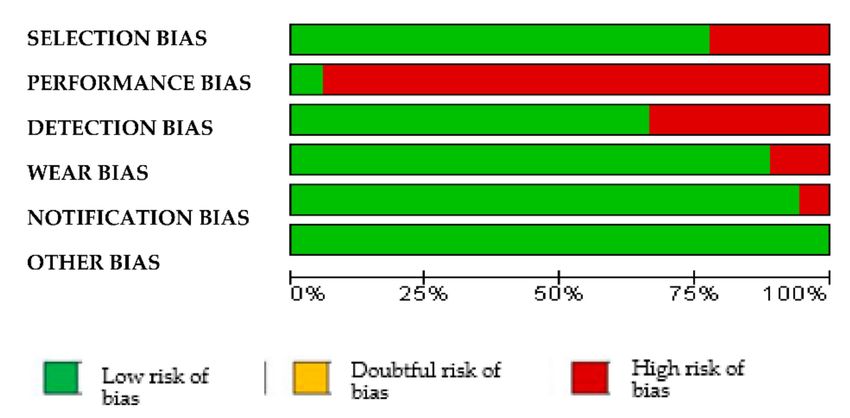
     Nine studies showed moderate bias [26,27,30,32,33,36,40–42], and the other nine studies showed
low bias [25,28,29,31,34,35,37–39]. Performance bias was the most common one. However, notification
bias only appeared in one study [39] (Table 5 and Figure 2).

                              Table 5. Bias risk assessment of the articles included.

                                                                       BIAS
      REFERENCES            Selection       Performance       Detection        Wear     Notification   Others
    Barcala et al. [25]        +                  -                +             +           +           +
     Bower et al. [26]          -                 -                +              -          +           +
      Cho et al. [27]          +                  -                -             +           +           +
     Hung et al. [28]          +                  -                +             +           +           +
     Hung et al. [29]          +                  -                +             +           +           +
    Kannan et al. [30]         +                  -                -             +           +           +
    Karasu et al. [31]         +                  -                +             +           +           +
      Kim et al. [32]          +                  -                -             +           +           +
       Lee et al. [33]          -                 -                -             +           +           +
       Lee et al. [34]         +                  -                +             +           +           +
       Lee et al. [35]         +                  -                +             +           +           +
    Morone et al. [36]         +                  -                +              -          +           +
      Park et al. [37]         +                  -                +             +           +           +
       Pedreira da
                               +                  -                +             +           +           +
    Fonseca et al. [38]
     Rajaratnam et al.
                               +                  +                +             +           -           +
           [39]
     Singh et al. [40]          -                 -                +             +           +           +
    Song & Park [41]           +                  -                -             +           +           +
     Yatar & Yildrim
                                -                 -                -             +           +           +
           [42]
                                    Coding: + = “no bias” and - = “presence of bias”.

                                             Figure 2. Risk of bias graph.
Appl. Sci. 2020, 10, 6426                                                                          27 of 33

     The lowest scores obtained on the PEDro scale were 4/10 [42] and 5/10 [40], and in the rest of the
studies, the scores were between 6/10 and 8/10 (Table 3).

4. Discussion
      The aim of this paper was to investigate the effects of commercial video games as low-cost
semi-immersive VR systems on balance and gait in stroke patients and to know the differences between
the different devices and video games used. Previous publications have shown positive effects using
immersive VR systems [14–16,44–46] on balance and gait in different neurological conditions. However,
this equipment is costly and complex to use and maintain, unlike the low-cost video game systems [19]
included in the papers contemplated in this SR.
      As regards the studies included in this SR, the results generally show positive effects on balance
and gait in post-stroke patients. Specifically, in relation to the participants, they possess homogeneous
characteristics regarding age, gender and type of stroke. On the contrary, homogeneity is not observed
in progression times, including participants in chronic and subacute states. However, differences have
not been observed in the results as regards to patient age and progression times, contrary to what was
described in previous studies as regards the benefits of physical therapy after stroke, which showed
that the oldest patients obtained lower levels of improvement and, also, that patients with the most
mild condition recuperated more favourably [47,48]. However, effect size and time x group interaction
were included in almost none of the papers analysed in this SR.
      The assessment tools used to quantify the effects of therapy on balance and gait were heterogeneous
in the studies included, which evidences a lack of standardisation in the assessment protocols of balance
and gait in post-stroke patients. In several papers, objective tools were used, such as computerised
dynamic posturography systems, which are considered to be baseline instrumentation methods for
assessing balance [49,50] and, in other cases, observational functional assessment tests, such as TUG or
BBS, which, although amply validated in this clinical context [51–55], knowing how to apply them
depends on the examiner’s experience. Moreover, in this last test, the floor ceiling effect is frequent,
which means it is not sensitive to discreet changes in patients with mild or very severe balance
disorders [53,55].
      Results from all the studies show improvements in some of the aspects analysed, regardless of the
approach (with or without commercial video games) that is to say, performing rehabilitation leads to
improvements in patients who have suffered a stroke, which is in-line with previous reviews [56–58].
However, specifically regarding balance, no changes occurred in several of the papers included in
this SR [27,39,40,42] or after conventional physiotherapy treatment or when the latter was applied
in conjunction with exercises in a virtual environment. However, improvements in balance during
functional tasks were observed. This could be due to the fact that such tasks allow greater adaptation
as regards the support base, as well as the need to perform weight transfers in a more dynamic way,
facilitating postural stability, whereas maintaining bipedestations in the tests used for assessment means
the support base must be kept constant, as well as the load and support points when straightening up.
      The results observed also seem to be linked to the length of the therapy sessions. In six studies,
the session times were longer in the EG compared to the CG [25,27,31,32,35,37]. In one of the
studies, this aspect did not lead to significant differences in the results obtained for both groups [25],
in contrast with the other five studies, which showed differences between the groups (in favour of the
EG) [27,31,32,35,37]. Thus, there does seem to be a relationship between the length of time of treatment
and the results, as suggested in previous studies as regards the effects of physiotherapy treatment on
strokes [48,59]. In terms of duration, the number of sessions and weekly frequency of rehabilitation
programmes with commercial video games, there was variability between the studies included in this
SR. Overall, the average number of sessions was nine in two studies [26,32] or 42 sessions in another
one [37]. No differences were found in the results in relation to the total duration of the intervention
weeks, the number of total sessions or the weekly frequency of the sessions.
You can also read