Graphene-Based Biosensor for Early Detection of Iron Deficiency
←
→
Page content transcription
If your browser does not render page correctly, please read the page content below
sensors
Article
Graphene-Based Biosensor for Early Detection of
Iron Deficiency
Oluwadamilola Oshin 1, *, Dmitry Kireev 2,3 , Hanna Hlukhova 4 , Francis Idachaba 1 ,
Deji Akinwande 2,3 and Aderemi Atayero 1
 1    Electrical and Information Engineering Department, Covenant University, Ota 112233, Nigeria;
      francis.idachaba@covenantuniversity.edu.ng (F.I.); atayero@covenantuniversity.edu.ng (A.A.)
 2    Department of Electrical and Computer Engineering, The University of Texas at Austin,
      Austin, TX 78712, USA; kirdmitry@gmail.com (D.K.); deji@ece.utexas.edu (D.A.)
 3    Microelectronics Research Center, The University of Texas at Austin, Austin, TX 78758, USA
 4    Institute of Complex Systems (ICS-8), Forschungszentrum Juelich, 52428 Jülich, Germany;
      gaoa1994@gmail.com
 *    Correspondence: damilola.adu@covenantuniversity.edu.ng

 Received: 13 February 2020; Accepted: 11 March 2020; Published: 1 July 2020

 Abstract: Iron deficiency (ID) is the most prevalent and severe nutritional disorder globally and
 is the leading cause of iron deficiency anemia (IDA). IDA often progresses subtly symptomatic in
 children, whereas prolonged deficiency may permanently impair development. Early detection and
 frequent screening are, therefore, essential to avoid the consequences of IDA. In order to reduce
 the production cost and complexities involved in building advanced ID sensors, the devices were
 fabricated using a home-built patterning procedure that was developed and used for this work
 instead of lithography, which allows for fast prototyping of dimensions. In this article, we report
 the development of graphene-based field-effect transistors (GFETs) functionalized with anti-ferritin
 antibodies through a linker molecule (1-pyrenebutanoic acid, succinimidyl ester), to facilitate specific
 conjugation with ferritin antigen. The resulting biosensors feature an unprecedented ferritin detection
 limit of 10 fM, indicating a tremendous potential for non-invasive (e.g., saliva) ferritin detection.

 Keywords: biosensor; early detection; ferritin; graphene; GFET; iron deficiency; nanotechnology;
 non-invasive

1. Introduction
      Nutrition during the early years of life has a preeminent influence on the quality of health
of an individual in their lifetime [1–3]. Specifically, micronutrients provide the essential building
blocks for brain development, healthy growth, and a robust immune system [1,4–7]. The top three
micronutrients of global health relevance are iodine, iron, and vitamin A, whereas iron deficiency is
the most common nutritional disorder worldwide [8,9].
      Iron deficiency (ID) refers to a condition of significantly low concentration of healthy red blood
cells in the body due to the correspondingly low amount of iron [10,11]. The core function of iron in the
body is oxygen transport in the blood. Iron deficiency, if not diagnosed and treated at the early stage,
will lead to iron deficiency anemia (IDA). Although every age group is vulnerable, it is more prevalent
in women and children [8,12]. However, it is often impossible to recognize ID in children until it
degenerates to IDA. At that point, symptoms such as pale skin, frequent infections, fatigue/lethargy,
pica, and poor appetite become apparent. ID impairs the cognitive development of children from
infancy through to adolescence and is associated with increased morbidity rates [13,14]. It is, therefore,
imperative to be able to promptly detect iron deficiencies in children, so that intervention programs
are timely and better targeted.

Sensors 2020, 20, 3688; doi:10.3390/s20133688                                    www.mdpi.com/journal/sensors
Sensors 2020, 20, 3688                                                                                                        2 of 13

      Although, iron status is best assessed by a combination of indicators, ferritin is established as
the major iron-storage molecule; its production increases in cells as iron supplies increase. The serum
ferritin level is, therefore, the most specific biochemical test that correlates with relative total body
iron stores; hence, it is the most widely used iron status indicator [8]. However, since ferritin is
an acute-phase reactant protein, its concentration is elevated in the presence of infection or inflammation.
A child under five years of age is said to be iron-deficient if their serum ferritin level is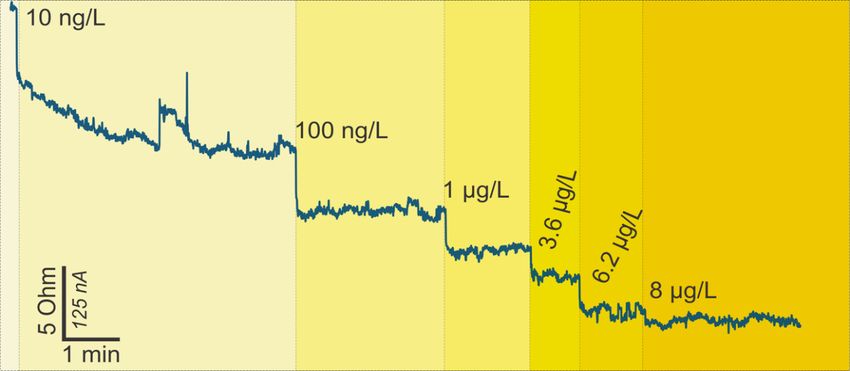
Sensors 2020, 20, 3688                                                                               3 of 13

sensor [27] is 3–556 µg/L in buffer and 5.78–888 µg/L in serum ferritin standard. However, the sensitivity
and specificity reported are based on a detection limit of 18 µg/L. Ferritin concentrations lower than
this cut-off resulted in a degradation of the sensitivity and specificity of the biosensor. The silicon
nanowire detection mechanism is a departure from the rest in its utilization of a nano-field-effect
transistor (FET). This presented the significant advantage of a lower detection limit as compared with
others. From an extensive literature search, it was observed that there are significantly few studies on
the detection of ferritin concentration using field-effect biosensors. Their method attained a ferritin
detection limit down to 50 pg/mL using a horn-like polycrystalline-silicon nanowire (SiNW) FET.
Even though their fabrication method is acclaimed to be simpler, the synthesis of silicon nanowires is
generally non-trivial and expensive [30,31]. On the other hand, graphene synthesis is simple; graphene
is widely commercially available and inexpensive. Moreover, unlike SiNWs, the two-dimensional (2D)
planar surface structure of graphene facilitates ease of functionalization. Graphene fabrication and
transfer to the substrate are also significantly simple compared to the procedure for SiNWs [32].
      Since the first exfoliation of a single atomic layer of graphene in 2004 by Geim and Novoselov [33],
of all other nanomaterials, it is known to be the most promising nanostructured material suitable for
biosensing, under intense research for over a decade [34,35].
      In this research work, we developed an FET biosensor using monolayer graphene as the conducting
channel. We functionalized the channel using anti-ferritin antibodies to selectively capture the ferritin
protein antigen, with a limit of detection about 10 fM. It is noteworthy that this performance was
attained despite using our low-cost and straightforward shadow mask patterning procedure to
derive the source and drain electrodes of the graphene-based FETs (GFETs), rather than the standard
(ultraviolet (UV) or e-beam) lithography process [36]. This work is the first report of ferritin detection
using graphene. It also offers the lowest ferritin detection limit obtainable by any reported sensor.
This work demonstrates the enormous potential of using a GFET for non-invasive early detection of
iron deficiency.

2. Materials and Methods

2.1. Materials
      Graphene on 25-µm-thick copper foil (Gr/Cu) synthesized through chemical vapor deposition
(CVD) was purchased from Chongqing Graphene Technology Co., Ltd. (also known as Chongqing Moxi
Technology). The following materials were ordered from Millipore Sigma (formerly Sigma-Aldrich):
ferritin, anti-ferritin antibody, dimethylformamide (DMF), Tween-20, ethanolamine (ETA), and ~150 mM
phosphate-buffered saline (1× PBS, pH 7.4 at 25 ◦ C). Here, 1.5 mM PBS (0.01× PBS) was prepared by
diluting 1× PBS appropriately with de-ionized water. Furthermore,1-pyrenebutanoic acid, succinimidyl
ester (PASE) was purchased from Thermofisher Scientific.

2.2. GFET Fabrication
      A 285-nm-thick SiO2 on Si wafer was used as a substrate. The source and the drain of the transistor
used in this work were patterned according to an interdigitated electrode (IDE). The IDE-structured
transistors were fabricated using a shadow mask to pattern the electrodes on top of the SiO2 /Si substrate.
The masks were fabricated via a simple yet robust technology, which allows for fast prototyping
of desirable patterns at a fraction of time and cost, and which utilizes a commercially available,
off-the-shelf tool, Silhouette Cameo, capable of providing resolution down to 200 um [37]. A detailed
account of this process was reported elsewhere [36]. Although this is a more straightforward approach
to patterning in contrast with lithography, there is a limit on the sizes obtainable due to the resolution
of the mechanical cutting machine. Each SiO2 /Si wafer yielded 28 transistors based on the pre-set
dimensions (see Figure S1, Supplementary Materials). Since an IDE structure was used, the overall
length of the channel was set to 1 mm, and the width was set to 68.8 mm, yielding a ~69 W/L ratio. Using
the CHA e-beam-assisted evaporator, a thin layer each of Ni (10 nm) and Au (90 nm) was deposited.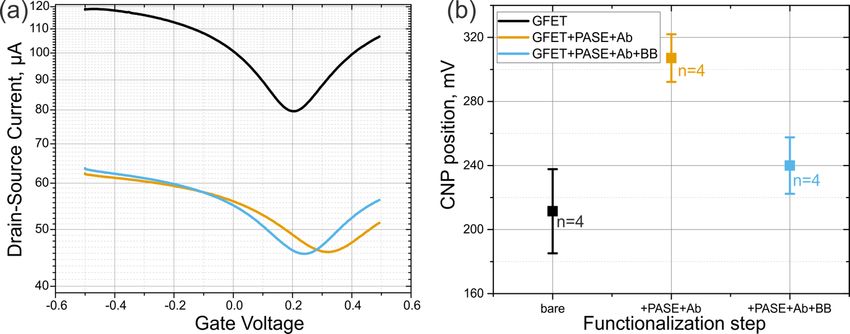
Sensors 2020, 20, x FOR PEER REVIEW 4 of 13
transistors based on the pre-set dimensions (see Figure S1, Supplementary Materials). Since an IDE
structure
Sensors 2020,was used, the overall length of the channel was set to 1 mm, and the width was set
20, 3688 4 of to
13
68.8 mm, yielding a ~69 W/L ratio. Using the CHA e-beam-assisted evaporator, a thin layer each of
Ni (10 nm) and Au (90 nm) was deposited. Nickel was deposited first to serve as an adhesion layer,
Nickel was was
while gold deposited first contact
the metal to serveserving
as an adhesion layer, and
as the source while goldfor
drain was thetransistor.
the metal contact serving as
The purchased
the source and drain for the transistor. The purchased Gr/Cu was cut into
Gr/Cu was cut into desired sizes and stuck onto dummy silicon wafers. A protective polymer desired sizes and stuck onto
dummy siliconmethacrylate)
(poly(methyl wafers. A protective
(PMMA)) polymer (poly(methyl
was drop-casted methacrylate)
onto the Gr/Cu (PMMA)) was drop-casted
and spin-coated for even
onto the Gr/Cu and spin-coated for even distribution. The resulting PMMA/Gr/Cu
distribution. The resulting PMMA/Gr/Cu was then annealed at 150 °C for 5 min. This was thereafter was then annealed
at 150 ◦ C foronto
transferred 5 min.theThis was thereafter
etchant transferredpersulfate)
(0.1 M ammonium onto the etchant
to remove(0.1 M
theammonium
underlyingpersulfate)
copper foil,to
remove
leaving the underlying
PMMA/Gr copper
on top of thefoil, leavingThe
solution. PMMA/Gr
PMMA/Gr on top
wasof the triple-washed
then solution. The PMMA/Gr
with deionized was then
(DI)
triple-washed with deionized (DI) water, followed by a careful transfer of
water, followed by a careful transfer of a PMMA/Gr sheet onto each IDE-structured transistor a PMMA/Gr sheet onto each
to
IDE-structured
bridge the source transistor
and drainto bridge the source
electrodes. Afterand
thedrain electrodes.
transfer, After the transfer,
PMMA/graphene PMMA/graphene
was left to slowly dry
was left12
out for tohslowly
at room dry out for 12 h followed
temperature, at room temperature,
by 5 min of 150followed by 5 min
°C annealing inof 150 ◦toCre-flow
order annealing thein order
PMMA
to re-flow the PMMA and improve graphene-substrate adhesion. The devices
and improve graphene-substrate adhesion. The devices were then left for 24 h in acetone in order were then left for 24toh
in acetone
remove thein protective
order to remove
PMMA thelayer,
protective
then PMMA
washedlayer,
withthenIPA, washed with IPA,
and dried withandan dried
oxygen with an
gun.
oxygen gun. Polydimethylsiloxane (PDMS) chambers were then molded
Polydimethylsiloxane (PDMS) chambers were then molded and attached to each chip to form an and attached to each chip to
form an exposed well above the graphene sensing area, thereby creating
exposed well above the graphene sensing area, thereby creating the means for liquid-based the means for liquid-based
measurements.
measurements. The The GFET
GFET fabrication
fabrication process
process isis summarized
summarized in in Figure
Figure 1a–g.
1a–g.
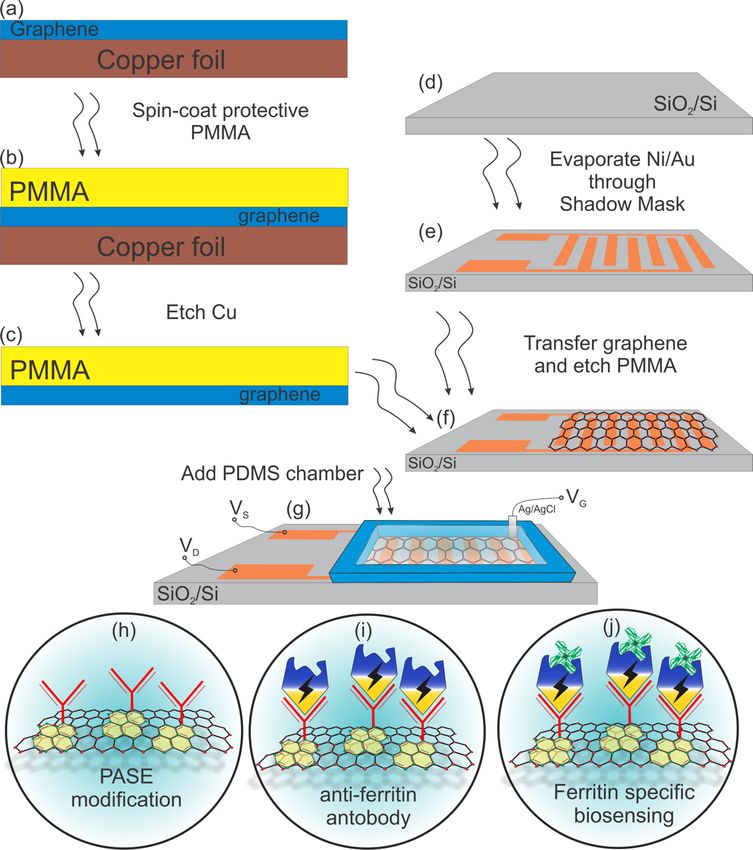
Figure 1. (a–f) Graphene-based field-effect transistor (GFET) biosensor fabrication process; (g) the
Figure 1. (a–f) Graphene-based field-effect transistor (GFET) biosensor fabrication process; (g) the
schematic of the final GFET-based biosensor with a polydimethylsiloxane (PDMS) well on top to secure
schematic of the final GFET-based biosensor with a polydimethylsiloxane (PDMS) well on top to
electrolyte; (h–j) further graphene functionalization with pyrenebutanoic acid, succinimidyl ester
(PASE), an anti-ferritin antibody and the final step of ferritin-specific biosensing.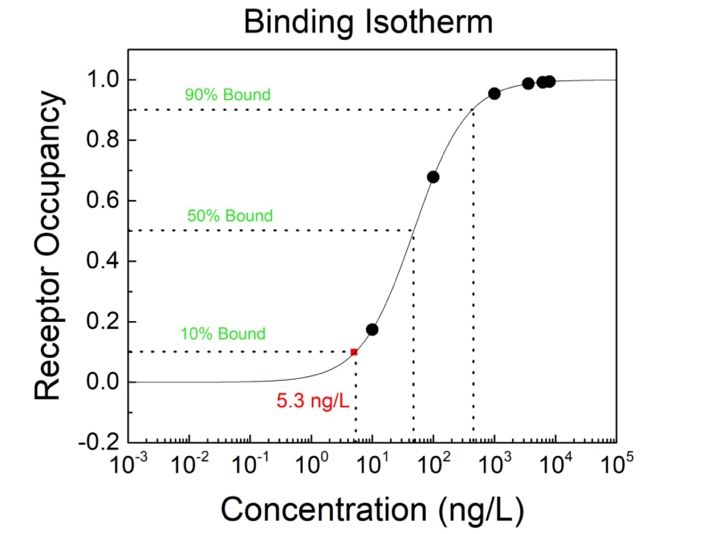
Sensors 2020, 20, 3688                                                                              5 of 13

2.3. GFET Functionalization
     Transforming a GFET into a specific biosensor requires immobilization of the necessary
biomolecules as seen in Figure 1h–j. To immobilize the biomolecules, a bi-functional linker molecule)
1-pyrenebutanoic acid, succinimidyl ester (PASE) was firstly introduced to the graphene surface.
The graphene channel area was incubated in the solution of 10 mM PASE in DMF for 2 h at room
temperature. The aromatic pyrene groups of PASE bind very strongly but non-covalently to the
graphene surface via π–π stacking, leaving the succinimidyl ester group at the other end (see Figure 1h).
Next, a 1 mg/mL solution of anti-ferritin antibody in 1× PBS was introduced to the GFETs and incubated
for 12 h at 4 ◦ C. In effect, the succinimidyl ester groups of PASE react covalently with the amino groups
of the antibody, forming a stable amide bond (see Figure 1i). After incubation, the GFETs were washed
thoroughly with 1× PBS and DI water, then dried with compressed nitrogen. The graphene surface
was then washed with 0.05% Tween-20 in 0.01× PBS to passivate the unbound graphene surface or
physically trapped biomolecules. Finally, an additional blocking step of 100 mM ETA in 0.01× PBS was
applied to the graphene surface for 1 h at room temperature to deactivate any unreacted succinimidyl
ester groups of the PASE that may remain on the surface, followed by thorough washing in 0.01× PBS
and DI water, and drying with compressed nitrogen (see Figure 1j). The GFET functionalization process
is summarized in Figure S2 (Supplementary Materials).
     After functionalization, the target analyte, ferritin, was prepared in 0.01× PBS to obtain the
desired concentrations.

2.4. GFET Characterization
     Prior to functionalization, we took the Raman spectra of the graphene on our IDE FET substrate
via the Renishaw inVia Raman microscope, using the blue excitation laser wavelength of 442 nm and
4 mW power on the sample to verify the graphene quality and number of layers. The GFETs were
electrically characterized at room temperature prior to functionalization, after antibody immobilization
and after applying the blocking buffer (Tween-20 and ETA). All measurements were based on
a liquid-gated FET set-up, as shown in Figure S3 (Supplementary Materials). We used 0.01× PBS
as the electrolyte buffer solution, and a Keithley B2902A Source Measure Unit (SMU) coupled to
a Wentworth Labs probe station. Ag/AgCl pellet electrodes (E-206, Science Products) were used as
gate reference electrodes, and they were carefully washed between experiments in order to avoid any
cross-contamination. The immobilization processes were characterized by monitoring the drain current
changes for a drain-source voltage (VDS ) of 0.2 V while sweeping the gate voltage (VGS ) from −0.5 to
0.5 V. The sensor performance was determined by monitoring the drain current changes per time for
a given drain-source voltage and gate voltage, as the GFET was exposed to the different concentrations
of ferritin. The time-trace recordings were performed while keeping both VDS and VGS constant at a
certain operational point. The point was set to be VDS = 0.1 V and VGS = 0.05 V to make sure there
were no excessive currents through the graphene.

3. Results and Discussion
     As shown in Figure S4 (Supplementary Materials), the used graphene was a high-quality
monolayer, as verified by the I2D /IG ratio >2 [38]. The Raman spectrum also revealed a minimal D peak
at 1350 cm−1 , showing very low defect density. The quality of this graphene facilitated consistent GFET
transport properties and confirmed the high fabrication yield of >99% as specified by the manufacturer.
     Characterizations were based on transfer curves obtained by plots of drain current versus the gate
voltage during stages of fabrication and functionalization of the GFET. The transfer curve obtained by
characterizing the bare GFETs immediately after fabrication showed that the GFETs had an average
and positive-valued Dirac voltage (Vdirac) of 211 ± 60.4 mV (Figure 2, black line). This monolayer
graphene Dirac point corresponds to the charge neutrality point (with a mean value of Vcnp = 211 mV)
or the point of least conductivity/ maximum resistance. Pristine monolayer graphene (non-doped)
Sensors 2020, 20, 3688 6 of 13
Sensors 2020, 20, x FOR PEER REVIEW 6 of 13
has a Vcnp of 0 V; graphene is said to be p-doped when Vcnp is positive and n-doped when Vcnp
Vcnp = 211mV) or the point of least conductivity/ maximum resistance. Pristine monolayer graphene
is negative. Specific anti-ferritin antigen binding was achieved by functionalizing the GFET with an
(non-doped) has a Vcnp of 0V; graphene is said to be p-doped when Vcnp is positive and n-doped
anti-ferritin antibody using PASE as the linker to the graphene surface; this yielded an average Vdirac
when Vcnp is negative. Specific anti-ferritin antigen binding was achieved by functionalizing the
of 307 ± 33.54 mV (Figure 2, yellow curve). Usage of the anti-ferritin specific antibody gives us an
GFET with an anti-ferritin antibody using PASE as the linker to the graphene surface; this yielded an
immense advantage
average Vdirac of 307of± 33.54
building
mV a(Figure
single2,type of molecule
yellow specific
curve). Usage biosensor
of the that specific
anti-ferritin will be sensitive
antibody to
ferritin
gives usonly. Next, a advantage
an immense blocking buffer comprising
of building a singlea wash
type ofstep with 0.05%
molecule Tween-20
specific biosensorwasthatapplied
will be to
remove unbound biomolecules from the graphene surface as much as possible,
sensitive to ferritin only. Next, a blocking buffer comprising a wash step with 0.05% Tween-20 was before incubating
the functionalized
applied to remove channel
unboundwith ETA to block
biomolecules fromthetheremaining unreacted
graphene surface N –hydroxy
as much succinimidyl
as possible, before
(NHS)
incubating the functionalized channel with ETA to block the remaining unreacted N –hydroxy of
ester linkers on the channel surface. Specificity of the biosensor was also assured by means
asuccinimidyl
previously tested
(NHS) method of additional
ester linkers biosensor
on the channel passivation
surface. Specificityperformed with was
of the biosensor ethanolamine
also assured and
Tween-20
by means[39,40]. This last functionalization
of a previously tested method step yielded anbiosensor
of additional average Vdirac ± 40 mV (Figure
of 240 performed
passivation with 2,
blue line). The decrease in Vdirac was likely due to the removal of weakly bound
ethanolamine and Tween-20 [39,40]. This last functionalization step yielded an average Vdirac of 240 antibody probes and
the nullifying of remnant NHS–ester linker molecules. The standard deviations
± 40 mV (Figure 2, blue line). The decrease in Vdirac was likely due to the removal of weakly bound (SD) of the provided
charge
antibodyneutrality
probes andpointthe(CNP) values
nullifying come from
of remnant the analysis
NHS–ester of molecules.
linker multiple (nThe = 4)standard
differentdeviations
GFET chips
that
(SD)were
of thefabricated
provided in a similar
charge manner.
neutrality Figure
point (CNP) S5values
(Supplementary
come from Materials)
the analysisshows the shift
of multiple (n =of4)the
I–V curve GFET
different upon functionalization steps for another
chips that were fabricated device
in a similar that was
manner. not S5
Figure used for time-trace Materials)
(Supplementary recording of
shows the
ferritin, butshift
to seeof the
the I–V curve upon
steady-state functionalization
shift steps for another device that was not used for
in the current response.
time-trace recording of ferritin, but to see the steady-state shift in the current response.
Figure 2.
Figure 2. (a) Transfer curves
curves of
of aa GFET
GFETupon
uponfunctionalization
functionalizationprocess.
process.Black, orange,
Black, orange,and blue
and lines
blue lines
represent the bare GFET, the
represent the GFET
GFETfunctionalized
functionalizedwith
withPASE
PASEandandantibodies,
antibodies, and the
and functionalized
the functionalized
GFET after passivation
GFET passivation with
with blocking
blockingbuffer
buffer(BB).
(BB).(b)
(b)Statistics
Statisticsofofthe
theCNP
CNPshift upon
shift uponthethe
same
same
functionalization from nn ==44similar
functionalization steps from similardevices.
devices.
3.1.
3.1. Ferritin
Ferritin Detection
Detection
The
The liquid-gated
liquid-gated FET
FET(LG-FET)
(LG-FET)measurement
measurementset-up set-upisisthe
theprimary
primarymeasurement
measurementconfiguration
configurationfor
biosensors, where
for biosensors, the “liquid”
where the “liquid”is theissample
the samplecontaining the analyte
containing to betodetected
the analyte or quantified.
be detected In this
or quantified.
LG-FET set-up, the
In this LG-FET gatethe
set-up, voltage that triggers
gate voltage the modulations
that triggers in the device
the modulations in the is applied
device to a reference
is applied to a
electrode
reference through
electrodethe liquid to
through thethe graphene
liquid to thechannel.
graphene Aschannel.
this potential
As thisis applied,
potentialthe ELECTRICAL
is applied, the
DOUBLE
ELECTRICAL LAYER (EDL) with
DOUBLE LAYER a capacitance
(EDL) withvalue of CEDL isvalue
a capacitance formedof just
CEDLabove the graphene
is formed just abovechannel.
the
graphene
In channel.
effect, the CEDL inInseries
effect, thethe
with CEDL in series
air-gap with thedue
capacitance air-gap capacitance
to graphene’s due to graphene’s
hydrophobicity and the
hydrophobicity
inherent quantum and the inherent
capacitance ofquantum
graphenecapacitance
produce the of total
graphene
gate produce
capacitance the total
of thegate capacitance
GFET. Therefore,
aofsignificant
the GFET.advantage
Therefore, ofa significant
this set-upadvantage
is the lowofoperating
this set-up is the required
voltage low operating voltage
for the device, required
typically
for the 1device,
within V. Thetypically
thicknesswithin
of the1EDLV. Theis athickness
functionofofthe
theEDL
Debyeis alength
function
(λDof) as
theseen
Debye length (λD(1).
in Equation ) as
seenWhen
in Equation (1).
antigens bind to their antibodies immobilized on the FET surface, a change in surface
charge When antigens
is induced bind
at the to theirsite.
binding antibodies immobilized
For the changes to be on the FETcaptured,
effectively surface, athe change
bindingin surface
site must
charge is induced at the binding site. For the changes to be effectively captured, the binding site must
be within the Debye length, defined by Equation (2) [41]. Therefore, changes that occur outside this
length are subject to electrostatic charge screening.Sensors 2020, 20, 3688 7 of 13
be within the Debye length, defined by Equation (2) [41]. Therefore, changes that occur outside this
length are subject to electrostatic charge screening.
CEDL = ε0 εr/λD (1)
√ [nm]
λD = 0.304/ M (2)
where ε0 is the permittivity of free space, εr is the relative permittivity of the dielectric formed between
the graphene surface and the liquid, and M (molarity) is the ionic strength of the sample (liquid).
From Equation (2), it is evident that a higher molarity results in a shorter Debye length. This concept
is of great concern because most biological interactions take place within high-ionic-strength solutions
(e.g., 1× PBS ionic strength = ~150 mM). In effect, an attempt to sense these interactions electronically
using FET-based sensors is severely impeded by the consequentially short Debye length (0.7 nm for
1× PBS). Therefore, although the binding efficiency of ferritin and its antibody is high due to its large
molecular size [42], to ensure this binding is detected by the GFET biosensor, 0.01× PBS (M = 1.5 mM,
λD = 7.3 nm) was used as the electrolyte to carry out the measurements.
It is also clear from Figure S2 (Supplementary Materials) that the functionalization process incurs
some height on the graphene surface that eats into the Debye length. However, the literature highlights
that the incurred height from the sensor surface after a flat-on-orientation immobilization of the
antibodies is typically about 4 nm [29,43]. Therefore, even for macromolecular antigens like ferritin,
using 0.01× PBS will give room for detection of the antigen–antibody binding since the binding site
will be within the Debye length of ~7.3 nm.
For a p-type GFET device, the number of holes is greater than the number of electrons; hence, on the
application of the gate voltage, decreased conductivity results. On the other hand, when the GFET is
n-type, the application of the gate voltage leads to increased conductivity. However, the immobilization
and the binding of charged target biomolecules to receptors on the channel yield specific channel
modulation effects. For a p-type device, when a negatively charged biomolecule binds to the receptors
on the graphene channel, holes accrue in the channel, leading to increased drain-source current [44].
This binding corresponds to a negative gating potential of the graphene channel and, hence, the reduced
carrier density of graphene [45]. On the contrary, when a positively charged biomolecule binds to the
receptors on the graphene channel, reduced drain-source current results [46]. Ferritin is a negatively
charged molecule with a weight of 474 kDa [47–49]; therefore, with a GFET operated in hole-conduction
mode, it is expected that the drain-source current increases (resistance decreases) as the antigen is
immobilized on the device. Monitoring of current change is carried out at a certain working potential
(0.05 V in this case), and the shift of current is a typical response of biomolecule attachment [40,50–53].
This expected trend can be observed in Figure 3. This figure also represents the points where the
highlighted ferritin concentrations pipetted onto the chip resulted in the depicted electrical changes.
In this experiment, the ferritin was added onto the chip with initially clean PBS solution. Using simple
calculations and a set of four stock ferritin solutions, we gradually increased the concentration of ferritin
in the sensing bath, without cleaning or removing the liquid in between. This allowed us to record the
gradual change in the response due to the increase in ferritin concentration in a single experiment.
Concerning the detection limit and range of the GFET biosensor, we started pipetting the ferritin
antigen onto the chip from the smallest concentration of 10 ng/L, consequently increasing the ferritin
concentration up to 8 µg/L. The initial concentration resulted in a significant rise in drain current,
which suggests that the smallest analyte concentrations detectable by the developed GFETs are actually
lower than 10 ng/L. Notably, the changes in drain current upon ferritin immobilization occurred within
less than 10 s of pipetting the protein onto the GFETs, portraying real-time detection.Sensors 2020, 20, 3688 8 of 13
Sensors 2020, 20, x FOR PEER REVIEW 8 of 13
Figure 3. Change in resistance versus time readings for the GFET ferritin biosensor on the addition of
buffer (phosphate-buffered
ferritin-free buffer (phosphate-bufferedsaline
saline(PBS))
(PBS))and
andincreasing
increasingferritin
ferritinconcentration.
concentration.
3.2. Ferritin Binding
Concerning theKinetics
detection limit and range of the GFET biosensor, we started pipetting the ferritin
antigen
We onto the chip
consider from theand
A (antibody) smallest concentration
F (ferritin) to be twoof 10 ng/L, consequently
interacting increasing
bio-objects which theaferritin
can form bound
concentration
product, upwe
AF, and to 8letµg/L.
CA , CThe
F , initial
and C AF
concentration
be their resulted
concentration in
in a
M significant
(molarity). rise
The in drain current,
time-dependent
which
rate suggests
equation for that the smallest
the formation analyte
of the productconcentrations
CAF is detectable by the developed GFETs are
actually lower than 10 ng/L. Notably, the changes in drain current upon ferritin immobilization
occurred within less than 10 s of pipetting the dcAFprotein
= kononto
cA cF the GFETs, portraying real-time detection. (3)
dt
3.2. Ferritin Binding Kinetics
where the forward reaction rate constant is kon , and the reverse reaction rate constant is ko f f .
We consider A (antibody) and F (ferritin) to be two interacting bio-objects which can form a
bound product, AF, and we let CA, CF, and dcAFCAF be their concentration in M (molarity). The time-
= −ko f f cAF (4)
dependent rate equation for the formation of dt the product CAF is
In equilibrium, the sum of all time-dependent
dc AF derivatives is zero, which, in fundamental
= kon cinAcsolution
interpretation, obeys the law-of-mass-action equation F [54]. (3)
dt
1 kon cAF
Ka =is kon=, and the
where the forward reaction rate constant = reverse reaction rate constant is koff . (5)
KD ko f f cA × cF
dc= K=a −
cAF AF ×kcoff
A× c AF
cF (4)
dt
The strength of the interaction between A (antibody) and F (ferritin) can be linked to the affinity
In equilibrium,
constant the sum of all
Ka via the concentration of time-dependent
bound ferritin moleculesderivatives to is
thezero, which, in of
concentration fundamental
antibodies.
interpretation, obeys the law-of-mass-action equation in solution [54].
However, it is also necessary to consider the dissociation constant KD , because it can be compared
to the reactant ferritin concentrations. In solution, 1 kthe totalcconcentration of bound antibody–ferritin
complex (CAF ) depends on the concentration K a = = on
= AF and ferritin for biosensors with active
of both antibody (5)
K D koff cA × cF
surface areas where the law-of-mass-action applies [55].
Immobilized antibodies on the biosensor cAF = surface
K a × cA are × cFfixed and, thus, the number of captured
ferritin molecules will not change. To have an ideal experiment, the number of ferritin antigens should
be inThe
large excess with
strength of therespect to thebetween
interaction numberAof(antibody)
immobilized andantibodies, suchbethat
F (ferritin) can the effective
linked total
to the affinity
concentration does not change when ferritin antigens adsorb from the solution
constant Ka via the concentration of bound ferritin molecules to the concentration of antibodies. to the surface.
This simplifies
However, the situation,
it is also necessary which, asthe
to consider shown in Figureconstant
dissociation 4, is accomplished
KD, becausebyitproviding a constant
can be compared to
flow of a fresh
the reactant analyte
ferritin solution to theInsensor.
concentrations. In athe
solution, biosensing experiment,of
total concentration anbound
essential quantity is the
antibody–ferritin
“bound
complexfraction/ferritin”,
(CAF) depends onBfthe value [56], because
concentration it is proportional
of both antibody andtoferritin
the measured signal. with
for biosensors The bound
active
fraction is defined
surface areas wherebythe
thelaw-of-mass-action
occupied number ofappliesferritin[55].
antibodies divided by the total amount of ferritin
on the active surface
Immobilized detectionon
antibodies area.
theThe antibodies
biosensor surfacebound areare 0%and,
fixed for a thus,
ferritin
thesensor,
number andofthey reach
captured
100% when
ferritin the sensor
molecules willsurface is fullyTo
not change. saturated
have anwith ideal ferritin analyte the
experiment, molecules.
number of ferritin antigens
should be in large excess with respect to the number of immobilized antibodies, such that the effective
total concentration does not change when ferritin antigens adsorb from the solution to the surface.Thissimplifies
This simplifiesthethesituation,
situation,which,
which,asasshown
shownin inFigure
Figure4, 4,is isaccomplished
accomplishedbybyproviding
providinga a
constant flow of a fresh analyte solution to the sensor. In a biosensing experiment, anan
constant flow of a fresh analyte solution to the sensor. In a biosensing experiment, essential
essential
quantity
quantity is is
thethe “bound
“bound fraction/ferritin”,
fraction/ferritin”, BfBf value
value [56],
[56], because
because it itis is proportional
proportional to to
thethe measured
measured
signal. The bound fraction is defined by the occupied number of ferritin antibodies divided byby
signal. The bound fraction is defined by the occupied number of ferritin antibodies divided thethe
total
Sensorsamount
2020, 20, of ferritin
3688 on the active surface detection area. The antibodies bound are
total amount of ferritin on the active surface detection area. The antibodies bound are 0% for a ferritin 0% for a ferritin
9 of 13
sensor,
sensor, and
and they
they reach
reach 100%
100% when
when thethe sensor
sensor surface
surface is fully
is fully saturated
saturated withwith ferritin
ferritin analyte
analyte molecules.
molecules.
Figure
Figure 4. 4.
Figure Schematic
Schematic
Schematic
4. representation
representation
representation of of
thethe
of the dynamic
dynamic
dynamic equilibrium
of of
equilibrium
equilibrium of ferritin
ferritin
ferritin antigens
to to
antigens
antigens to immobilized
immobilized
immobilized
antibody
antibody
antibody receptors
receptors
receptors on
onon the
thethe active
active
active GFET
GFET
GFET sensor
sensor
sensor area.
area.
area.
= AFAF ∝ biosensor signal
Bound
Bound fraction=
fraction S S F∝AF biosensor signal (6)(6)
Bound fractionF= S ∝ biosensor signal (6)
F
ByBy
By
combining
combining
combining
Equations
Equations (5)(5)
Equations andand (6),
(5)(6),
andwewe can
can
(6),
re-arrange
re-arrange
we
and
and getget
can re-arrangethethe equivalent
equivalent
and
of
thethe law-of-
get theofequivalent
law-of-of the
mass-action
mass-action for active
for active forsurface
surface biosensors.
law-of-mass-action activebiosensors.
surface biosensors.
cc c
equilibrium,BBB(c f (c ) =
f f (c))== c + K
Bound fraction
in in
Bound fraction equilibrium,
Boundfractioninequilibrium, (7)(7)
(7)
cc++KKD D D
Equation
Equation
Equation (7)(7)
(7) corresponds
corresponds
corresponds to to
thethe
to the Langmuir
Langmuir
Langmuir isotherm
isotherm
isotherm [57],
[57],
[57], which
which
which is is
is derived
derived
derived forfor
thethe
for the adsorption
adsorption
adsorption of of
thethe
of the
molecules
molecules
molecules onto
onto surfaces
surfaces (in(in
thisthis case,
case, ononthethe biosensor
biosensor surface
surface with
with attached
attached antibodies)
antibodies) [53,58].
[53,58].
Compared to the law-of-mass-action, this method is simpler and only depends on thethe
Compared
Compared to
to the
the law-of-mass-action,
law-of-mass-action, this
this method
method is
is simpler
simpler and
and only
only depends
depends on
on the ferritin
ferritin
ferritin
concentration
concentration
concentration C
CF and
FF and the equilibrium dissociation
equilibriumdissociation
the equilibrium dissociationconstantconstant
constantfor for
forthe the antibodies
theantibodies
antibodies K K .
KDD.. In
D In
Inthe the specific
the specific
specific casecase
case of
of antibodies
antibodies binding
binding to to ferritin
ferritin antigens,
antigens, the the affinity
affinity constant
constant Ka Ka
should
of antibodies binding to ferritin antigens, the affinity constant Ka should be calculated. With the should
be be calculated.
calculated. With With
the knownthe
known
affinity
known affinity
constant,
affinity constant,
constant, thethe
the binding binding
isotherm
binding isotherm forfor
for the antibody
isotherm thethe antibody
occupancy
antibody occupancy
with the with
occupancy with
bonded thethe bonded
ferritin
bonded ferritin
antigen
ferritincan
antigen
antigen becan
easily can easily
plotted
easily be be plotted
(Figure
plotted As(Figure
5). (Figure
can be5).5).
AsAs
seen can
from
can bebetheseen
seengraph,
fromfrom thethe
the graph,
lowest
graph, thethe
ferritin lowest
antigen
lowest ferritin antigen
concentration
ferritin antigen
concentration
that was that
successfully was successfully
bonded to bonded
antibodies isto antibodies
equal to 5.3 is
ng/L equal
(10
concentration that was successfully bonded to antibodies is equal to 5.3 ng/L (10 fM), which can to
fM),5.3 ng/L
which (10
can fM),
be which
indicated can be
asbethe
indicated
limit of as the
detection limit
(LoD)of detection
for these (LoD)
types offor these
developed types
GFETof developed
indicated as the limit of detection (LoD) for these types of developed GFET biosensors. biosensors. GFET biosensors.
Figure 5. Binding isotherm for the antibody (receptor) occupancy with ferritin antigen on the
GFET biosensor.Sensors 2020, 20, 3688 10 of 13
4. Conclusions
In this work, we demonstrated the possibility of using graphene to develop an FET biosensor for
the detection of serum ferritin protein, whose level gives reliable information about iron deficiencies in
the human body. This is the first reported GFET biosensor for ferritin detection. These GFETs were
fabricated using our innovative and low-cost method of preparing a shadow mask for patterning and
evaporating metal contacts on the substrate. From our analysis, the ferritin detection limit of the GFET
biosensor is 5.3 ng/L (10 fM), which is the lowest detection limit reported for ferritin in the literature,
while the detection range is 5.3 ng/L (10 fM) to ~0.5 µg/L (1 pM). These results show that there is
excellent potential in using these GFETs for non-invasive ferritin sensing characterized by very low
detection limits.
Supplementary Materials: The following are available online at http://www.mdpi.com/1424-8220/20/13/3688/s1,
Figure S1: The IDE shadow mask pattern design specific for 4-inch wafer used in this work, Figure S2: GFET
functionalization process, Figure S3: Liquid-gated FET Setup, Figure S4: Raman shift for CVD-synthesized
monolayer graphene, Figure S5: Shift of I-V curve upon different stages of functionalization of another device (#7).
(a) Shows initial I-V curve, as well as upon functionalization with PASE + antibody, passivation, and addition
of target ferritin biomolecule of 8 ng/mL concentration. (b) Shows the change in the I-V curve upon final step,
of addition of specific ferritin biomolecules Table S1: Ferritin concentration and the equivalent bound fraction.
Author Contributions: Conceptualization, O.O.; data curation, O.O.; D.K. and H.H.; formal analysis, O.O.; D.K.;
and H.H.; funding acquisition, F.I. and A.A.; investigation, O.O.; D.K.; and H.H.; methodology, O.O. and D.K.;
project administration, F.I. and A.A.; resources D.K.; software, D.K.; supervision, F.I.; D.A.; and A.A.; validation,
O.O.; D.K.; and D.A.; visualization, D.K.; writing—original draft, O.O.; writing—review and editing, D.K.; H.H.;
F.I.; D.A. and A.A. All authors have read and agreed to the published version of the manuscript.
Funding: This research received no external funding.
Acknowledgments: The publication of this work is fully sponsored by the Covenant University Center for
Research, Innovation, and Discovery (CUCRID), Covenant University, Ota, Nigeria.
Conflicts of Interest: The authors declare no conflicts of interest.
References
1. Prado, E.L.; Dewey, K.G. Nutrition and brain development in early life. Nutr. Rev. 2014, 72, 267–284.
[CrossRef] [PubMed]
2. UNICEF. Nutrition in the First 1000 Days; UNICEF: New York, NY, USA, 2012.
3. Oshin, O.; Hampel, D.; Idachaba, F.; Atayero, A. The First 1000 Days: Trends towards Biosensing in Assessing
Micronutrient Deficiencies. J. Phys. Conf. Ser. 2019, 1299, 012136. [CrossRef]
4. Prado, E.L.; Sebayang, S.K.; Apriatni, M.; Adawiyah, S.R.; Hidayati, N.; Islamiyah, A.; Siddiq, S.; Harefa, B.;
Lum, J.; Alcock, K.J.; et al. Maternal multiple micronutrient supplementation and other biomedical and
socioenvironmental influences on children’s cognition at age 9–12 years in Indonesia: Follow-up of the
SUMMIT randomised trial. Lancet Glob. Health 2017, 5, e217–e228. [CrossRef]
5. Baker, R.; Caballero, B.H.; Dennison, B.A.; Innis, S.M.; Simmons, R.; Bonny, S. Toddler Nutrition.
Mead Johnson Nutritionals. 2007. Available online: https://www.meadjohnson.com/pediatrics/us-en/
sites/hcp-usa/files/LB2264.pdf (accessed on 11 March 2020).
6. Shergill-Bonner, R. Micronutrients. Paediatr. Child Health 2013, 23, 331–336. [CrossRef]
7. Bailey, R.L.; West, K.P., Jr.; Black, R.E. The Epidemiology of Global Micronutrient Deficiencies. Ann. Nutr. Metab.
2015, 66, 22–33. [CrossRef] [PubMed]
8. WHO. Evaluating the public health significance of micronutrient malnutrition. In Guidelines on Food
Fortification with Micronutrients; WHO: Geneva, Switzerland, 2010; pp. 41–92.
9. Lopez, A.; Cacoub, P.; Macdougall, I.C.; Peyrin-Biroulet, L. Iron deficiency anaemia. Lancet 2015, 387, 907–916.
[CrossRef]
10. Lu, S.-Y. Perception of iron deficiency from oral mucosa alterations that show a high prevalence of Candida
infection. J. Formos. Med. Assoc. 2016, 115, 619–627. [CrossRef]
11. Lynch, S.; Pfeiffer, C.M.; Georgieff, M.K.; Brittenham, G.; Fairweather-Tait, S.; Hurrell, R.F.; McArdle, H.J.;
Raiten, D.J. Biomarkers of Nutrition for Development (BOND)—Iron Review. J. Nutr. 2018, 148, 1001S–1067S.
[CrossRef]Sensors 2020, 20, 3688 11 of 13
12. Freerks, L.; Papadatou Soulou, E.; Batchelor, H.; Klein, S. A review of GI conditions critical to oral drug
absorption in malnourished children. Eur. J. Pharm. Biopharm. 2019, 137, 9–22. [CrossRef]
13. Kuku-Shittu, O.; Onabanjo, O.; Fadare, O.; Oyeyemi, M. Child Malnutrition in Nigeria: Evidence from Kwara
State; International Food Policy Research Institute: Washington, DC, USA, 2016.
14. Lozoff, B. Early Iron Deficiency Has Brain and Behavior Effects Consistent with Dopaminergic Dysfunction.
J. Nutr. 2011, 141, 740S–746S. [CrossRef] [PubMed]
15. WHO; UNICEF; UNU. Iron Deficiency Anaemia: Assessment, Prevention and Control; WHO: Geneva, Switzerland,
2001.
16. Höller, U.; Bakker, S.J.L.; Düsterloh, A.; Frei, B.; Köhrle, J.; Konz, T.; Lietz, G.; McCann, A.; Michels, A.J.;
Molloy, A.M.; et al. Micronutrient status assessment in humans: Current methods of analysis and future
trends. TrAC Trends Anal. Chem. 2018, 102, 110–122. [CrossRef]
17. Kanneppady, S.K.; Bhaskar, A.; Kanneppady, S.S.; Rao, P.K.; Ramasamy, S.; Lakshman, A.R.; Shetty, S.R.;
Devi, U.H.; Oo, A.M.; Lwin, O.M. Analysis of Salivary Micronutrients in Oral Potentially Malignant Disorder.
J. Nutr. Health Food Sci. 2018, 6, 1–4. [CrossRef]
18. Guo, L.-N.; Yang, Y.-Z.; Feng, Y.-Z. Serum and salivary ferritin and Hepcidin levels in patients with chronic
periodontitis and type 2 diabetes mellitus. BMC Oral Health 2018, 18, 63. [CrossRef]
19. Aghazadeh, M.; Eslami, H.; Pirzadeh, A.; Aghazadeh, Z.; Dousti, H.; Falsafi, P. Evaluation of Correlation
Between Saliva And Serum Ferreting Level In Patients With Iron Deficiency Anemia And Comparison Group.
IOSR J. Humanit. Soc. Sci. (IOSR-JHSS) 2016, 21, 54–59.
20. Khan, A. Detection and quantitation of forty eight cytokines, chemokines, growth factors and nine acute
phase proteins in healthy human plasma, saliva and urine. J. Proteom. 2012, 75, 4802–4819. [CrossRef]
21. Jagannathan, N.; Thiruvengadam, C.; Ramani, P.; Premkumar, P.; Natesan, A.; Sherlin, H.J. Salivary ferritin
as a predictive marker of iron deficiency anemia in children. J. Clin. Pediatr. Dent. 2012, 37, 25–30. [CrossRef]
22. Canatan, D.; Akdeniz, S.K. Iron and ferritin levels in saliva of patients with Thalassemia and iron deficiency
anemia. Mediterr. J. Hematol. Infect. Dis. 2012, 4, e2012051. [CrossRef]
23. Agarwal, P.K.; Agarwal, K.N.; Agarwal, D.K. Biochemical changes in saliva of malnourished children. Am. J.
Clin. Nutr. 1984, 39, 181–184. [CrossRef]
24. Kartalov, E.P.; Lin, D.H.; Lee, D.T.; Anderson, W.F.; Taylor, C.R.; Scherer, A. Internally calibrated quantification
of protein analytes in human serum by fluorescence immunoassays in disposable elastomeric microfluidic
devices. Electrophoresis 2008, 29, 5010–5016. [CrossRef]
25. Lu, Z.; O’Dell, D.; Srinivasan, B.; Rey, E.; Wang, R.; Vemulapati, S.; Mehta, S.; Erickson, D. Rapid diagnostic
testing platform for iron and vitamin A. deficiency. Proc. Natl. Acad. Sci. USA 2017, 114, 13513–13518.
[CrossRef] [PubMed]
26. Peterson, R.D.; Cunningham, B.T.; Andrade, J.E. A photonic crystal biosensor assay for ferritin utilizing
iron-oxide nanoparticles. Biosens. Bioelectron. 2014, 56, 320–327. [CrossRef] [PubMed]
27. Srinivasan, B.; O’Dell, D.; Finkelstein, J.L.; Lee, S.; Erickson, D.; Mehta, S. ironPhone: Mobile device-coupled
point-of-care diagnostics for assessment of iron status by quantification of serum ferritin. Biosens. Bioelectron.
2018, 99, 115–121. [CrossRef] [PubMed]
28. Lee, S.; Aranyosi, A.J.; Wong, M.D.; Hong, J.H.; Lowe, J.; Chan, C.; Garlock, D.; Shaw, S.; Beattie, P.D.;
Kratochvil, Z.F.; et al. lexible opto-electronics enabled microfluidics systems with cloud connectivity for
point-of-care micronutrient analysis. Biosens. Bioelectron. 2016, 78, 290–299. [CrossRef] [PubMed]
29. Yen, L.-C.; Pan, T.-M.; Lee, C.-H.; Chao, T.-S. Label-free and real-time detection of ferritin using a horn-like
polycrystalline-silicon nanowire field-effect transistor biosensor. Sens. Actuators B Chem. 2016, 230, 398–404.
[CrossRef]
30. Namdari, P.; Daraee, H.; Eatemadi, A. Recent Advances in Silicon Nanowire Biosensors: Synthesis Methods,
Properties, and Applications. Nanoscale Res. Lett. 2016, 11, 406. [CrossRef]
31. Nair, P.R.; Alam, M.A. Design Considerations of Silicon Nanowire Biosensors. IEEE Trans. Electron. Devices
2007, 54, 3400–3408. [CrossRef]
32. Ambhorkar, P.; Wang, Z.; Ko, H.; Lee, S.; Koo, K.I.; Kim, K.; Cho, D.D. Nanowire-Based Biosensors:
From Growth to Applications. Micromachines 2018, 9, 679. [CrossRef]
33. Novoselov, K.S.; Geim, A.K.; Morozov, S.V.; Jiang, D.; Zhang, Y.; Dubonos, S.V.; Grigorieva, I.V.; Firsov, A.A.
Electric field effect in atomically thin carbon films. Science 2004, 306, 666–669. [CrossRef]Sensors 2020, 20, 3688 12 of 13
34. Chauhan, N.; Maekawa, T.; Kumar, D.N.S. Graphene based biosensors—Accelerating medical diagnostics to
new-dimensions. J. Mater. Res. 2017, 32, 2860–2882. [CrossRef]
35. Peña-Bahamonde, J.; Nguyen, H.N.; Fanourakis, S.K.; Rodrigues, D.F. Recent advances in graphene-based
biosensor technology with applications in life sciences. J. Nanobiotechnol. 2018, 16, 75. [CrossRef] [PubMed]
36. Oshin, O.; Kireev, D.; Akinwande, D.; Adetiba, E.; Idachaba, F.; Atayero, A. Advancing PoC Devices for Early
Disease Detection using Graphene-based Sensors. J. Phys. Conf. Ser. 2019, 1378, 032031. [CrossRef]
37. Yang, S.; Chen, Y.C.; Nicolini, L.; Pasupathy, P.; Sacks, J.; Su, B.; Yang, R.; Sanchez, D.; Chang, Y.F.; Wang, P.;
et al. ‘Cut-and-Paste’ Manufacture of Multiparametric Epidermal Sensor Systems. Adv. Mater. 2015, 27,
6423–6430. [CrossRef] [PubMed]
38. Li, X.; Cai, W.; An, J.; Kim, S.; Nah, J.; Yang, D.; Piner1, R.; Velamakanni, A.; Jung, I.; Tutuc, E.; et al.
Large-area synthesis of high-quality and uniform graphene films on copper foils. Science 2009, 324, 1312–1314.
[CrossRef] [PubMed]
39. Zhang, X.; Jing, Q.; Ao, S.; Schneider, G.F.; Kireev, D.; Zhang, Z.; Fu, W. Ultrasensitive Field-Effect Biosensors
Enabled by the Unique Electronic Properties of Graphene. In Small; Wiley-VCH Verlag: Weinheim, Germany,
2019; p. 1902820.
40. Fu, W.; Feng, L.; Panaitov, G.; Kireev, D.; Mayer, D.; Offenhäusser, A.; Krause, H. Biosensing near the
neutrality point of graphene. Sci. Adv. 2017, 3, e1701247. [CrossRef] [PubMed]
41. Fu, W.; Jiang, L.; van Geest, E.P.; Lima, L.M.C.; Schneider, G.F. Sensing at the Surface of Graphene Field-Effect
Transistors. Adv. Mater. 2017, 29. [CrossRef]
42. Ikai, A. The World of Nano-Biomechanics: Mechanical Imaging and Measurement by Atomic Force Microscopy;
Elsevier: Amsterdam, The Netherlands, 2008.
43. Hideshima, S.; Sato, R.; Kuroiwa, S.; Osaka, T. Fabrication of stable antibody-modified field effect transistors
using electrical activation of Schiff base cross-linkages for tumor marker detection. Biosens. Bioelectron.
2011, 26, 2419–2425. [CrossRef]
44. Kazuhiko, M.; Yasuhide, O.; Kenzo, M. Utilizing research into electrical double layers as a basis for the
development of label-free biosensors based on nanomaterial transistors. Nanobiosens. Dis. Diagnosis 2015, 5,
1–13.
45. Teixeira, S.; Burwell, G.; Castaing, A.; Gonzalez, D.; Conlan, R.S.; Guy, O.J. Epitaxial graphene immunosensor
for human chorionic gonadotropin. Sens. Actuators B Chem. 2014, 190, 723–729. [CrossRef]
46. Mao, S.; Lu, G.; Yu, K.; Bo, Z.; Chen, J. Specific protein detection using thermally reduced graphene oxide
sheet decorated with gold nanoparticle-antibody conjugates. Adv. Mater. 2010, 22, 3521–3526. [CrossRef]
47. He, D.; Marles-Wright, J. Ferritin family proteins and their use in bionanotechnology. New Biotechnol. 2015, 32,
651–657. [CrossRef]
48. Uto, K.; Yamamoto, K.; Kishimoto, N.; Muraoka, M.; Aoyagi, T.; Yamashita, I. Electrostatic adsorption of
ferritin, proteins and nanoparticle conjugate onto the surface of polyelectrolyte multilayers †. J. Mater. Chem.
2008, 18, 3876–3884. [CrossRef]
49. Takahashi, T.; Kuyucak, S. Functional properties of threefold and fourfold channels in ferritin deduced from
electrostatic calculations. Biophys. J. 2003, 84, 2256–2263. [CrossRef]
50. Huang, Y.; Dong, X.; Liu, Y.; Li, L.J.; Chen, P. Graphene-based biosensors for detection of bacteria and their
metabolic activities. J. Mater. Chem. 2011, 21, 12358–12362. [CrossRef]
51. Ohno, Y.; Maehashi, K.; Matsumoto, K. Label-free biosensors based on aptamer-modified graphene field-effect
transistors. J. Am. Chem. Soc. 2010, 132, 18012–18013. [CrossRef]
52. Maehashi, K.; Katsura, T.; Kerman, K.; Takamura, Y.; Matsumoto, K.; Tamiya, E. Label-free protein biosensor
based on aptamer-modified carbon nanotube field-effect transistors. Anal. Chem. 2007, 79, 782–787.
[CrossRef]
53. Saltzgaber, G.; Wojcik, P.; Sharf, T.; Leyden, M.R.; Wardini, J.L.; Heist, C.A.; Adenuga, A.A.; Remcho, V.T.;
Minot, E.D. Scalable graphene field-effect sensors for specific protein detection. Nanotechnology
2013, 24, 355502. [CrossRef]
54. Schuster, P.; Érdi, P.; Tóth, J. Mathematical Models of Chemical Reactions. Theory and Applications of
Deterministic and Stochastic models. A volume in the series: Nonlinear Science, Theory and Application.
Manchester University Press, Manchester (U.K.) 1989. 259 Seiten. Berichte der Bunsengesellschaft für Phys. Chem.
1989, 93, 1501–1502. [CrossRef]Sensors 2020, 20, 3688 13 of 13
55. Hammond, J.L.; Formisano, N.; Estrela, P.; Carrara, S.; Tkac, J. Electrochemical biosensors and nanobiosensors.
Essays Biochem. 2016, 60, 69–80.
56. Pollard, T.D. MBOC technical perspective: A guide to simple and informative binding assays. Mol. Biol. Cell
2010, 21, 4061–4067. [CrossRef]
57. Swenson, H.; Stadie, N.P. Langmuir’s Theory of Adsorption: A Centennial Review. Langmuir 2019, 35,
5409–5426. [CrossRef] [PubMed]
58. Li, Y.; Wang, C.; Zhu, Y.; Zhou, X.; Xiang, Y.; He, M.; Zeng, S. Fully integrated graphene electronic biosensor
for label-free detection of lead (II) ion based on G-quadruplex structure-switching. Biosens. Bioelectron.
2017, 89 Pt 2, 758–763. [CrossRef]
© 2020 by the authors. Licensee MDPI, Basel, Switzerland. This article is an open access
article distributed under the terms and conditions of the Creative Commons Attribution
(CC BY) license (http://creativecommons.org/licenses/by/4.0/).You can also read