High Performance PA 6/Cellulose Nanocomposites in the Interest of Industrial Scale Melt Processing - MDPI
←
→
Page content transcription
If your browser does not render page correctly, please read the page content below
polymers
Article
High Performance PA 6/Cellulose Nanocomposites in the
Interest of Industrial Scale Melt Processing
Pruthvi K. Sridhara                 and Fabiola Vilaseca *

                                          Advanced Biomaterials and Nanotechnology, Department of Chemical Engineering, University of Girona,
                                          17003 Girona, Spain; pruthvi.sridhara@udg.edu
                                          * Correspondence: fabiola.vilaseca@udg.edu; Tel.: +34-667-292-597

                                          Abstract: On an industrial scale, it is a challenge to achieve cellulose based nanocomposites due to
                                          dispersion issues and high process temperatures sensitivity. The current study describes methods to
                                          develop mechanically strong and thermally stable polyamide 6 (PA 6) and cellulose nanofibers (CNF)
                                          composites capable of tolerating high processing temperatures. With PA 6 being a very technical
                                          polymer matrix to be reinforced with CNF, good dispersion can be achieved with a high speed kinetic
                                          mixer and also shield the CNF from excess thermal degradation by implementing extremely short
                                          processing time. This paper presents an industrially feasible method to produce PA 6/CNF nanocom-
                                          posites with high CNF composition processed by a high speed kinetic mixer (GELIMAT® ) followed
                                          by compression molding to obtain a homogenous and thermally stable nanocomposites aimed at
                                          high performance applications. PA 6 was reinforced with three different wt % formulations (5, 15
                                          and 25 wt %) of cellulose nanofibers. The resulting nanocomposites exhibited significant increase in
                                          Young’s modulus and ultimate strength with CNF content, owing to the effective melt processing
                                          and the surface charge density of the CNF, which necessitated the dispersion. The thermal stability
                                and polymer crystallinity with respect to CNF composition for the PA 6/CNF nanocomposites were

                                          examined by TGA and DSC analysis. Rheology studies indicated that viscosity of the composites
Citation: Sridhara, P.K.; Vilaseca, F.
                                          increased with increase in CNF composition. Overall, this work demonstrates industrially viable
High Performance PA 6/Cellulose
                                          manufacturing processes to fabricate high performance PA 6/CNF nanocomposites.
Nanocomposites in the Interest of
Industrial Scale Melt Processing.
                                          Keywords: polyamide 6; cellulose nanofibers; nanocomposites; melt processing; mechanical proper-
Polymers 2021, 13, 1495. https://
doi.org/10.3390/polym13091495
                                          ties; thermal properties

Academic Editor: Giulia Fredi

Received: 20 April 2021                   1. Introduction
Accepted: 3 May 2021                           Polyamide 6/nylon 6 (PA 6) is an engineering thermoplastic boasting good mechanical
Published: 6 May 2021                     integrity, thermal properties, chemical and dimensional stability. In recent years, com-
                                          posites of PA 6 have gained tremendous interest in high performance and light weight
Publisher’s Note: MDPI stays neutral      replacement for metals and rubbers in the industrial sector especially in the automotive
with regard to jurisdictional claims in   industry [1]. The performance of PA 6 can be further enhanced by reinforcing the polymer
published maps and institutional affil-
                                          matrix with fibrous or crystalline filler [2]. Industrial interest has shifted towards eco-
iations.
                                          friendly and economic means to produce greener materials to reduce the impact of carbon
                                          footprint on the environment. Incorporating natural fibers to polymeric matrixes not only
                                          generates lower CO2 emission, but also increases the biodegradability of the material [3].
                                          Commonly used synthetic fibers such as glass and carbon fibers possess higher density
Copyright: © 2021 by the authors.         than natural fibers, comparably to such synthetic fibers, natural fibers reinforcement can
Licensee MDPI, Basel, Switzerland.        provide high specific mechanical properties to the polymer composites [4]. Further studies
This article is an open access article    have revealed that incorporating natural fiber-fillers with their dimension in nanoscale,
distributed under the terms and
                                          significantly improves the mechanical properties of neat polymers due to their high specific
conditions of the Creative Commons
                                          strength and high aspect ratio [5].
Attribution (CC BY) license (https://
                                               With cellulose being one of the most abundant natural polymer, reinforcing PA 6 with
creativecommons.org/licenses/by/
                                          cellulosic nanofillers is an effective way to develop new composites, further widening the
4.0/).

Polymers 2021, 13, 1495. https://doi.org/10.3390/polym13091495                                          https://www.mdpi.com/journal/polymers
Polymers 2021, 13, 1495                                                                                           2 of 17

                          potential of applications for polymeric composites [6]. There are two major families among
                          nanocellulose: cellulose nanocrystals (CNC) and cellulose nanofibers (CNF). CNF are easily
                          produced with high yield when compared to CNCs and, generally, CNF are more thermally
                          stable than CNC when they are purified thoroughly from lignin and hemicellulose, which
                          are thermally volatile constituents [7]. Enzymatically treatment of cellulose is one of the
                          simplest and ecofriendly ways to defibrillate and extract CNF [8]. These CNF embody
                          a swirled and flexible characteristic, and typically having their lengths in the range of
                          0.7–2 µm and diameters of around 5–30 nm, with majority of nanofibers with diameters
                          within 15–30 nm [9,10]. As PA 6 and CNF are polar materials and are hydrophilic in nature,
                          good interaction is formed between them making them compatible with each other [11].
                               CNF have a young’s modulus of 24 GPa and tensile strength of 320 MPa [12]. These
                          mechanical properties can be imparted to the end-use composite by dispersing them into
                          polymer matrix by various processing methods. However, there are several challenges in
                          reinforcing CNF with PA 6 matrix given the processing temperatures of PA 6 are close to
                          the degradation onset temperatures of the CNF. On an industrial scale, it is important to
                          optimize processing methods and modify materials if necessary, to produce high perfor-
                          mance nanocomposites and to improve the scalability of the overall production. While
                          processes like solvent casting have been successful in negating the degradation effect by
                          not involving high temperatures, solvent casting process is most suited to small-scale or
                          lab conditions and besides, extensive use of solvents generates chemical wastes making
                          it not ecofriendly [13,14]. Conventional methods like melt processing, injection molding
                          and compressing molding have already been well established in the current day industry.
                          To this day, many researchers have been successful in melt processing cellulose compos-
                          ites with polyethylene (PE), polypropylene (PP), polyvinyl alcohol (PVA) and polylactic
                          acid (PLA) [15]. Additionally, previous works within our group have successfully melt
                          processed PA 6 composites with well dispersed microfibrillated/pulp fibers with improved
                          mechanical properties and without compromising on thermal stability [16,17].
                               The obstacles of thermal stability can be overcome and good dispersion of CNF within
                          the PA 6 matrix can be achieved by melt compounding with a high speed thermo-kinetic
                          mixer such as a GELIMAT® . The schematic of a Gelimat mixing chamber is shown in
                          Figure 1 [18]. The process involves exerting high shear rates on the materials, which increase
                          the temperature of the compounding mixture and a final homogenous compound with
                          excellent dispersion can be obtained [19]. Materials can be compounded in extremely less
                          time (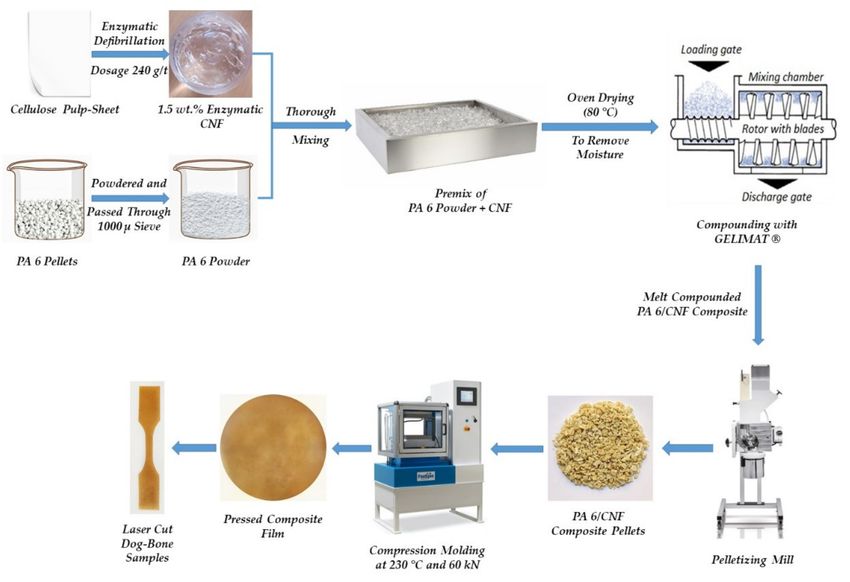
Polymers 2021, 13, 1495                                                                                        3 of 17

                          Figure 1. Schematic of GELIMAT® feeding and mixing chamber [18].

                          2. Materials and Methods
                                The PA 6 (density ρ = 1.14 g/cm3 ) was obtained commercially in pellet form from
                          Radici Plastics Iberica SL (Barcelona, Spain). The PA 6 pellets were then powdered from
                          Powder Plastics Europe SL (Valls, Spain) and the powdered PA 6 was passed through
                          a 1000-micron sieve. The major particle size distribution of the powdered PA 6 ranged
                          between 150 and 800 microns. For the rest of this paper, powdered PA 6 will be denoted as
                          just PA 6. Cellulose was originally obtained in form of pulp sheets from Domsjö Fabriker
                          (Örnsköldsvik, Sweden). These sheets were of high cellulose content (>97% pure cellulose)
                          primarily derived from softwood. To prepare the CNF, an endoglucanase enzyme namely
                          Novozyme 476 obtained from Novozymes® AS (Copenhagen, Denmark) was utilized to
                          expedite the disintegration of cellulose pulp. The Schematic of the complete composites
                          preparation process is depicted in Figure 2.

                          2.1. Processing of PA 6/CNF Nanocomposites
                          2.1.1. Preparation of CNF
                                The cellulose pulp was subjected to enzymatic treatment/disintegration as described
                          by Heriksson et al. [8]. Initially, the cellulose pulp was broken up in distilled water and
                          was amalgamated in a disintegrator (Papelquimia SA, Besalu, Spain) to form 3 wt %
                          cellulose pulp fibers suspension. The cellulose pulp fibers were then mechanically sub-
                          jected to a PFI mill (IDM Test SL, San Sebastian, Spain) at 1000 revolutions to increase
                          the fibers swelling in water and provide adequate accessibility for the enzyme. The
                          enzymatic treatment was carried out by dispersing the 3 wt % pulp fiber in 50 mM
                          tris(hydroxymethyl)aminomethane/HCl buffer with pH 7 and 0.02 wt % enzyme. The
                          fibers were incubated for 2 h at 50 ◦ C and later washed on a Büchner funnel. This was
                          followed by keeping the fibers at 80 ◦ C for 30 min to stop the enzyme activity and was
                          washed again. Additionally, the fibers were again subjected to the PFI mill at 4000 rev-
                          olutions. After the enzyme treatment, 1.5 wt % of pretreated fibers solution in distilled
                          water was prepared and subjected to homogenization (Panda Plus, GEA Niro Soavi, Parma,
                          Italy). The fibers were passed through the homogenizer 6 times and a consistent CNF gel
                          was procured.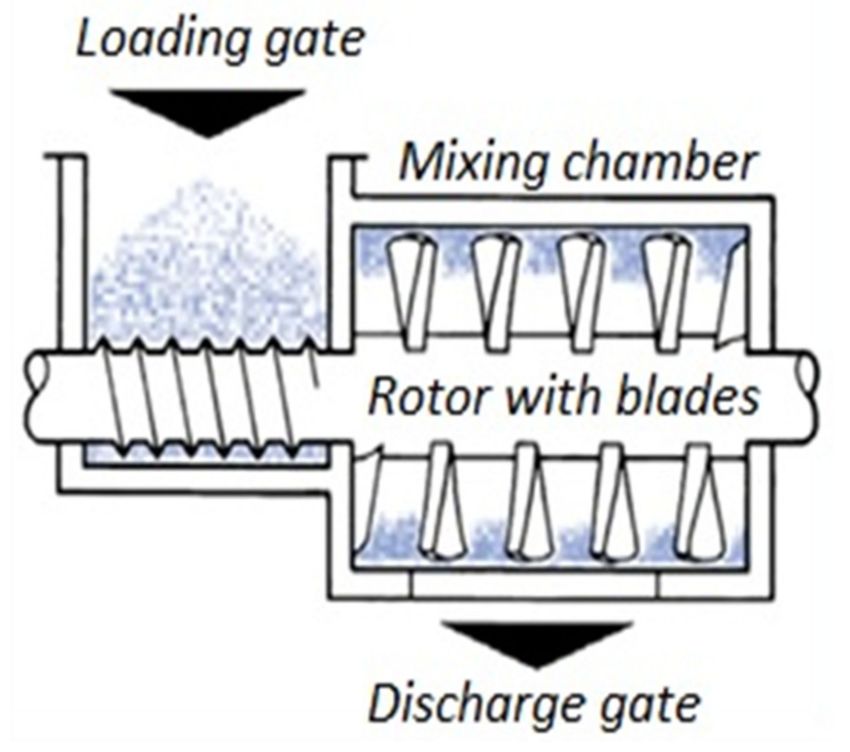
Polymers 2021, 13, 1495                                                                                                 4 of 17

                Figure 2. Schematic representaion of the manufacture process for PA 6/CNF nanocomposites [18,22,23].

                                  2.1.2. Melt Compounding
                                       In order to prepare 5 wt %, 15 wt % and 25 wt % of PA 6/CNF nanocomposites, batches
                                  of PA 6 respectively were dried for 8 h in an 80 ◦ C oven to remove any moisture content.
                                  Each batch of dry PA 6 was thoroughly mixed with the respective amount of CNF gel to
                                  obtain the corresponding CNF wt % formulation of the nanocomposite. These mixtures
                                  were then dried in a 60 ◦ C oven until all the gel-moisture content was removed. The dry PA
                                  6/CNF mixture was introduced into the Gelimat® (Draiswerke G5 S, Ramsey, NJ, USA) at
                                  a rotor speed of 300 rpm. The loading gate was shut and the rotor speed was increased to
                                  2500 rpm. The action of the blades at such high speed allowed a mixture to reach melting
                                  temperature (220–230 ◦ C) in less than 20 s. The completion of the compounding process
                                  was signified by the drop in current drawn by the rotor. Simultaneously, the discharge gate
                                  was opened and the compounded mixture was collected and cooled immediately using a
                                  cold bath. The compounding process was repeated to obtain the remaining formulations of
                                  the nanocomposites. Further, the compounded composite mixtures for all the formulations
                                  were produced into composite pellets respectively using a pelletizer (SM100, Retsch GmbH,
                                  Haan, Germany).

                                  2.2. Characterization of PA 6/CNF Nanocomposites
                                  2.2.1. Compression Molding
                                       All the formulations of nanocomposites pellets obtained from the compounding
                                  process was compression molded into films using a laboratory hydraulic hot press (Fontijne
                                  Presses BV, Delft, The Netherlands) at 230 ◦ C under a pressure of 60 kN for 10 min. Spacers
                                  with 0.5 mm thickness were positioned to control the thickness of the produced films. The
                                  obtained films were light brown in color and translucent with no optical signs of CNF
                                  aggregation. However, minute aggregation was observed in the 25 wt % formulation.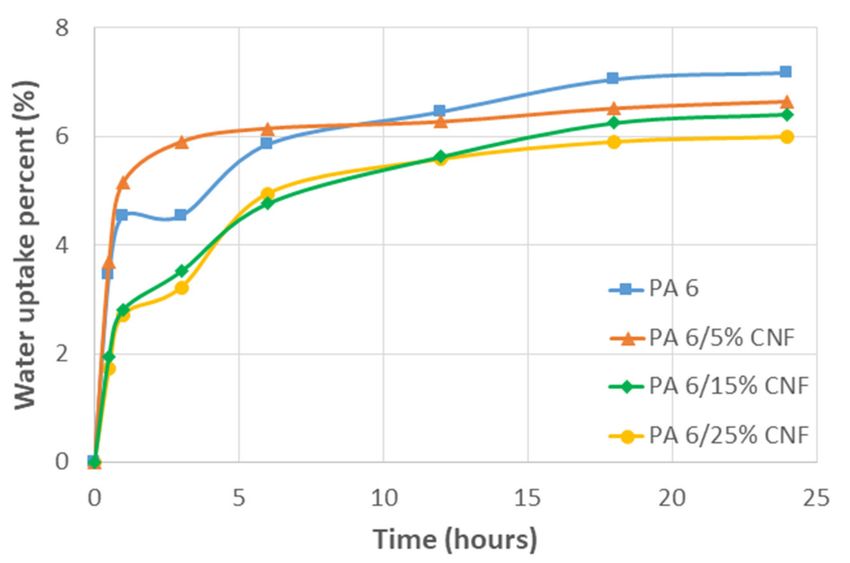
Polymers 2021, 13, 1495                                                                                             5 of 17

                          2.2.2. Mechanical Testing
                                PA 6/CNF nanocomposites were tensile tested using a 5 kN Instron® Type 1122
                          Test (Norwood, MA, USA) machine. Dog-bone shaped samples from the PA 6/CNF
                          nanocomposites films were cut using a die as per ASTM D638 (Type V) specifications. The
                          pressed dog-bone samples were tested under two parameters. Firstly, dry samples, where
                          the dog-bone samples were dried in an 80 ◦ C oven for 6 h prior to testing. Secondly, 48 h
                          conditioned samples, where the samples were placed in a climatic chamber at 23 ± 2 ◦ C
                          and 50% ± 5% relative humidity for 48 h (ASTM D618 13) prior to testing. Tests were
                          carried out at room temperature at a strain rate of 2 mm min−1 and a gauge length of
                          30 mm. The thickness and width of the narrow section for each sample was measured
                          using a digital micrometer (Starrett® , Athol, MA, USA). Trials were repeated to establish
                          statistical significance.

                          2.2.3. Conductometric and Polyelectrolyte Titration of CNF
                                The content of carboxyl groups of the CNFs was determined by conductometric
                          titration as described by Saito et al. [22]. CNF was dispersed rigorously in deionized
                          H2 O and 0.01 M HCl (Sigma Aldrich, Munich, Germany). The suspension was titrated
                          with 0.5 M NaOH (Sigma Aldrich, Munich, Germany). Titration conductivity values were
                          plotted against volume of NaOH added. The carboxyl content S (µMol/g) was calculated
                          using Equation (1).
                                                                V       · CNaOH
                                                         S = NaOH               ·106                          (1)
                                                                      WCNF
                          where VNaOH is the added volume of NaOH, CNaOH is the concentration of NaOH solution
                          and WCNF is the weight of dispersed CNF.
                               The surface charge of CNF was also characterized for cationic demand, which was de-
                          termined by polyelectrolyte titration using a Mütek PCD04 (BTG SL, UK) charger analyzer.
                          The titration was performed through surface adsorption of diallyldimethylammonium
                          chloride, poly-DADMAC, (Sigma Aldrich, Munich, Germany, molecular weight: 107 kDa)
                          and the excess was titrated with polyethenesodiumsulphonate, PES-Na, (BTG, Éclépens,
                          Switzerland) an anionic standard polymer.

                          2.2.4. Rheology Study
                                The rheological behavior was studied using a melt flow indexer/MFI-type device
                          (Ceast, Pianezza, Italy). Neat PA 6 and the compounded nanocomposite pellets were tested
                          for MFI at 230 ◦ C through a capillary (die) of specific diameter and length by pressure
                          applied through dead weight M (kg) as per ASTM 1238-73. The geometrical dimensions
                          of the MFI apparatus are: radius of the die r = 1 mm; radius of the heating cylinder
                          R = 4.75 mm; length of the heating cylinder L = 30 mm (ISO 1133). The mass series was as
                          follows: M1–M2–M3......M7 (kg) = 1.2–2.16–3.8–5.0–7.16–10.0–12.16. For each mass used,
                          five MFI values were measured for statistical significance.
                                Capillary rheological properties can be illustrated on a rheogram, which represents
                          variation of dynamic viscosity µ (Pa s) versus shear rate γ (s−1 ). To go from MFI (g/10 min)
                          to viscosity, the equations governing the flow of fluids inside a capillary (die) was used [23].
                                The apparent shear rate γ depends on the volume flow rate Q (m3 s−1 ) and die radius
                          r (m).
                                                                         4 · Q
                                                                  γ =                                                 (2)
                                                                        π · r3
                                The volume flow rate Q can be calculated using the MFI data and the respective hot
                          density ρ (g cm−3 ) of the samples.

                                                                       600 · MFI
                                                                Q =                                                    (3)
                                                                          ρ · t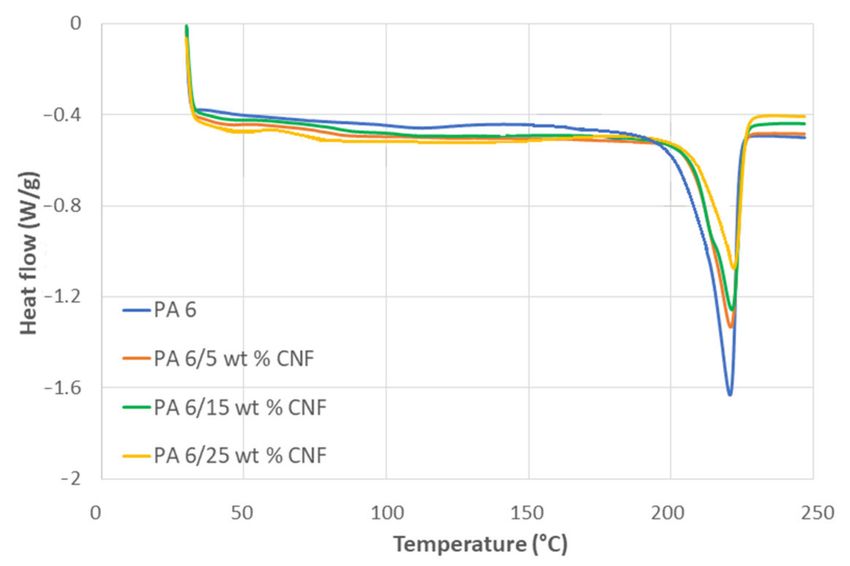
Polymers 2021, 13, 1495                                                                                             6 of 17

                               Hence,
                                                                       2400 · MFI
                                                               γ =                                                     (4)
                                                                      π · r3 · ρ · t
                               The viscosity µ is defined as shear stress τ (Pa) divided by the shear rate γ. The shear
                          stress τ depend on the pressure P exerted at die inlet, i.e., the force F exerted by the mass
                          M placed on the MFI piston.

                                                                    F      M · g
                                                            P =          =                                             (5)
                                                                  π · R2   π · R2
                               Hence,
                                                           P · F        M · g · r
                                                         τ =      =                                              (6)
                                                           2 · L      π · R2 · 2 · L
                               The above Equations (4) and (6) are for Newtonian fluids. PA 6 and respective
                          composite blends have non-Newtonian behavior. Therefore, the apparent shear rates were
                          corrected using the Rabinowitsch shear rate correction [24]. A first realistic approach to
                          the rheological behavior was presented by the power law symbolized by Oswald law
                          (Equation (7)).
                                                              τT = k · γT n                                      (7)
                          where τT is the true shear stress, k is a constant of the fluid and n is the flow index
                          (pseudoplasticity index). To find out n, the curve Ln τ = f (Ln γ) was plotted from the
                          calculated apparent stresses and shear rates obtained from the MFI data. With n being the
                          slope and Ln k the intercept, the necessary Rabinowitsch correction was performed for the
                          apparent shear rate γ (Equation (8)).

                                                                       (3n + 1)
                                                               γT =             · γ                                    (8)
                                                                          4n
                          where γT is the true shear rate, from which the true effective viscosity µ was calculated.
                          Thus, the rheogram representing the rheological behavior of PA 6 and PA 6/CNF nanocom-
                          posites at 230 ◦ C was obtained.

                          2.2.5. Water Absorption Study
                              Three dog-bone samples for each formulation were chosen to conduct periodic mass
                          measurements when submerged in water over a 24-h period. The dry samples were
                          weighed before placing them in distilled H2 O at room temperature. The samples were
                          removed from the water and patted dry with Kimwipes® prior to weighing. Mass measure-
                          ments were taken at 0 h, 0.5 h, 1 h, 3 h, 6 h, 12 h, 18 h and 24 h. The weight percentage change
                          was calculated using Equation (9), where Wwet is the weight of sample after immersed in
                          water and Wdry is the dry weight of the sample.

                                                                             Wwet − Wdry
                                                    percent change =                           · 100                   (9)
                                                                                Wdry

                               The samples were allowed to gain mass until they reached an equilibrium state. The
                          water uptake kinetics can be modelled analytically by using Fick’s theory of dispersion.
                          The diffusion coefficient D (m2 s−1 ) of the nanocomposite samples with respect to the ability
                          of moisture/water to penetrate the samples was deduced from Fick’s law. The diffusion
                          coefficient was determined for shorter immersion time and thus, Fick’s law is stated as in
                          Equation (10). Where Mt (%) is the water uptake at a lower immersion time, M∞ (%) is the
                          maximum mass gained, L (m) is the thickness of the sample and time t (s).
                                                                            r      !
                                                              Mt              Dt
                                                                    = 2 ·                                          (10)
                                                             M∞               π L2
Polymers 2021, 13, 1495 7 of 17
2.2.6. Thermal Properties
Thermogravimetric analysis (TGA) was conducted using a Mettler Toledo TGA 851
equipment (Greifensee, Switzerland). The temperature ranged from 25 to 600 ◦ C with
a 10 ◦ C/min heating rate. The tests were carried out by placing the samples in an open
platinum pan within a nitrogen environment. All the results were recorded using the STARe
thermal analysis software. Additionally, TGA at isothermal conditions (230 ◦ C) for the
CNF gel was performed to check for thermal stability of CNF at processing temperatures.
In addition to TGA, a differential scanning calorimeter (DSC) was performed with
DSC Q2000 equipment (TA Instruments, New Castle, DE, USA). The DSC was run three
times for each formulation and the dry samples ranging from 6 to 8 mg were placed in
aluminum pans. The samples underwent a heating cycle from 30 to 260 ◦ C with a heating
rate of 10 ◦ C/min. All the results were reported by a TA Universal Analysis software. The
degree of crystallinity (χc ) was calculated corresponding to the enthalpy of the melting
endotherm using Equation (12), where ∆Hsample is the enthalpy of the melting endotherm
of the sample from the heating cycle, ∆H polymer is the melting enthalpy of PA 6 polymer
in the sample, wCNF is the weight fraction of the CNF in the sample and ∆H100% is the
theoretical melting enthalpy of 100% crystalline PA6, which is equivalent to 230 J/g [25,26].
!
1
∆H polymer = ∆Hsample · (11)
1 − w100
CNF
∆H polymer
χ c (%) = · 100 (12)
∆H100%
2.2.7. Scanning Electron Microscopy (SEM)
The morphology of fractured samples due to elongation from tensile testing was
characterized under a S4800 electron microscope (Hitachi, Ibaraki, Japan). The 5 wt % and
25 wt % formulations of the PA 6/CNF nanocomposites were analyzed at an accelerated
voltage of 15 kV to distinguish CNF and PA 6 matrix. The fractured surfaces were coated
with a thin layer of gold with the help of a sputter prior to observation.
3. Results and Discussion
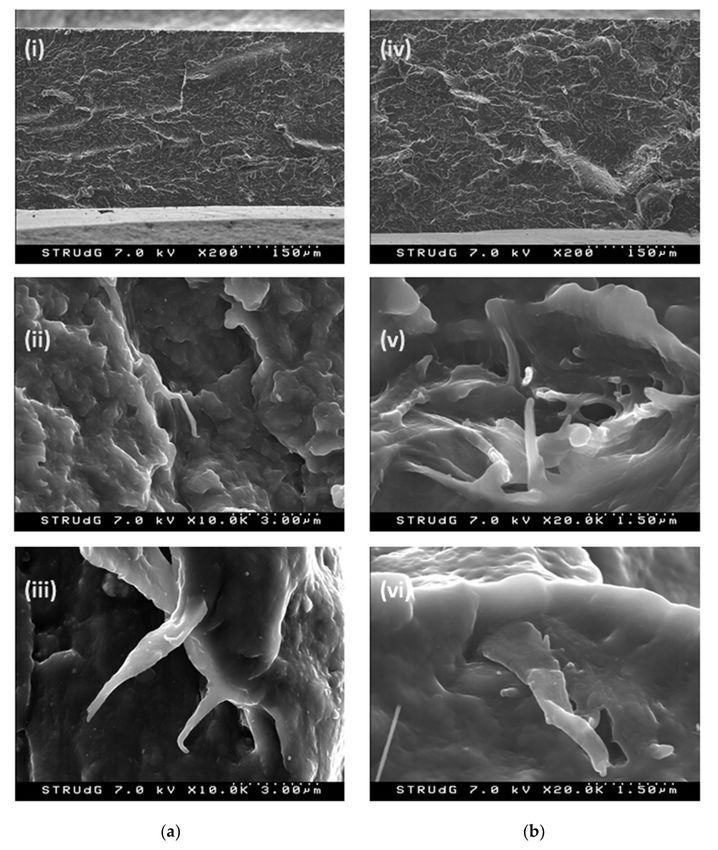
Samples were made for three different formulations of CNF composition: 5 wt %,
15 wt % and 25 wt %. The PA 6/CNF pellets and the respective homogeneous films
obtained by Gelimat compounding and compression molding are shown in Figure 3. The
processes resulted in a color change of slight brownish color and the films showed no optical
aggregation of CNF. This discoloration of the pressed composite samples was expected
due to the onset thermal degradation temperature of the CNF. This degradation is slow,
mild and is mainly attributed to the dehydration of composite and formation of peroxides,
which may catalyze the cellulose degradation [27,28]. However, our previous experience
with pulp fiber composites suggest that it does not affect the mechanical integrity [16].
Mechanical properties of nanocomposites depend on many parameters like weight
fraction of CNF, degree of dispersion of CNF and the size of the nanofibers. The mechanical
behavior of the PA 6/CNF nanocomposites increased with the increase in CNF content
with respect to neat PA 6. The best result for ultimate tensile strength (77.7 MPa) and
modulus (5.6 GPa) was obtained for the 25 wt % formulation. All the data from the tensile
tests are summarized in Table 1.Polymers 2021, 13, 1495 8 of 17
Figure 3. PA 6/CNF nanocomposites pellets and dog-bone samples for (a) 5 wt %, (b) 15 wt % and (c) 25 wt % formulations.
Table 1. Summary of tensile test results of dry and 48 h conditioned samples for neat PA 6 and all formulations of
nanocomposites.
Mean Thickness Ultimate Strength Elastic Modulus Strain at Break
CNF (mm) (MPa) (GPa) (%)
Content (wt %)
Dry 48 h CC Dry 48 h CC Dry 48 h CC Dry 48 h CC
Neat PA 6 0.46 ± 0.05 0.48 ± 0.03 50.8 ± 0.62 47.8 ± 1.1 2.2 ± 0.1 2.1 ± 0.3 9.8 ± 5.4 10.4 ± 5.6
5 0.35 ± 0.05 0.29 ± 0.06 56.5 ± 1.1 53.6 ± 0.7 3.9 ± 0.7 3.5 ± 0.7 2.3 ± 0.6 2.5 ± 0.5
15 0.30 ± 0.04 0.25 ± 0.08 65.6 ± 1.5 61.7 ± 2.1 4.8 ± 0.6 4.3 ± 0.3 1.6 ± 0.4 1.8 ± 0.2
25 0.25 ± 0.04 0.31 ± 0.03 77.7 ± 2.01 73.2 ± 2.5 5.6 ± 0.1 5.4 ± 0.4 1.2 ± 0.3 1.3 ± 0.1
The improvement in the mechanical properties are directly correlated to dispersion
and distribution of CNF within the PA 6 matrix [29]. Additionally, the processing methods
did not compromise on the thermal stability and the melt compounding improved the
homogeneity of the nanocomposites. The compatibility of CNF-PA 6 and the direct melt
mixing of the composites allowed us to suppress the use any coupling agent and dispersive
agent. This increases the scalability of the entire process, which is important at an industrial
level. The reduction of deformation (strain) at break for the nanocomposites indicated good
wetting and interaction between the CNF and PA 6 matrix, which allowed effective stress
transfer and improved the stiffness [30]. Some studies on polyamide cellulose composites
indicated improvement in mechanical properties for lower nanocellulose concentrations,
but for higher concentration the tensile properties diminished. This could be due to
excessive nanofiller–nanofiller interaction leading to poor reinforcement and embrittlement
of the overall sample [31]. Another reason could be that increased filler content makes the
polymer difficult to penetrate the space between the nanofillers resulting in poor wetting
and hindering stress transfer through the interface [32]. Overall, for such high fiber weight
fraction nanocomposites, the CNF exists as a 3D percolated network due to the hydroxyl
groups on CNF resulting in hydrogen bonding between them [33]. Our findings support
the fact that high performance, high cellulose weight fraction composites can be obtained
by optimizing processing methods, which means our processing method was successful in
penetrating PA 6 in between the percolated network of CNF. Hence, is accountable for the
improvement in mechanical properties of the nanocomposites.
The enhanced mechanical properties are directly related to how well the CNF is
dispersed within the PA 6 matrix. The dispersibility is indeed dependent on the surface
charge density of the CNF, which governs the electrostatic repulsion between the individualPolymers 2021, 13, 1495 9 of 17
fibers [34]. Polyelectrolyte and conductimetric titration revealed the cationic demand of
258 µeq. g/g and the carboxyl group content of 54 µmol COOH/g, respectively, for the
current enzymatic CNF. This suggests that amount of electrostatic repulsion between the
CNFs is sufficient to be well dispersed within the PA 6 matrix, which is further corroborated
by improvement in tensile properties [35]. Nevertheless, shorter chained polyamides such
as PA 6 possess higher frequency of amide groups resulting in hydrophilicity and thus,
leading to stronger interactions with CNF.
Capillary rheological properties are important to optimize the processing conditions
and to know the rheological behavior of the nanocomposites with respect to the addition of
CNF content. A rheogram representing variation of dynamic viscosity (µ) versus shear rate
(γT ) can be obtained without having to use a sophisticated rheometer. We used an MFI type
device to measure the melt flow indices of the samples with 5–6 different masses. By using
different sets of masses, we were able to vary the shear stress. Subsequently, applying
simple rheological equations, we traced a rheogram for the samples at 230 ◦ C (Figure 4).
The MFI values for the samples can be found in the Supplementary Materials. By studying
the flow behavior through a capillary, relevant processing shear rates were characterized
to confirm the process-ability of these nanocomposites. In addition, capillary rheological
characterization by applied pressure closely resembles injection molding process [36]. All
the samples displayed similar shear thinning behavior. PA 6/CNF nanocomposites behave
as pseudoplastic fluids (non-Newtonian behavior) confirmed by decreasing viscosity with
increasing shear rates. Moreover, pseudoplastic behavior is enhanced by the addition
of CNF. For the nanocomposite samples, the viscosities increased with increase in CNF
content with the highest viscosity seen for the 25 wt % formulation. At lower formulations
(5 wt %), the CNF for the most part was like free particles and the nanocomposite melt
had higher mobility. At higher formulations (15 and 25 wt %), the CNF disturbs the
normal flow of nanocomposite melts and hinders the mobility causing high shear stresses,
which is attributed to the hydrodynamic effect [37]. There was only a slight increase in
viscosity for the nanocomposites samples when compared to neat PA 6, maybe due to the
processing method employed and the aspect ratio of the CNF. This suggests the CNF was
well dispersed and the presence of a percolating network [38]. Furthermore, rheological
behavior is beneficial for process optimization and adjust processing conditions to improve
the productivity.
Figure 4. Rheological behavior of neat PA 6 and PA 6/CNF nanocomposites.Polymers 2021, 13, 1495 10 of 17
Further, water uptake study was carried out gravimetrically over a 24-h period. Mass
measurements were noted periodically at 0 h, 0.5 h, 1 h, 3 h, 6 h, 12 h, 18 h and 24 h
to determine the water absorption and associate it with the mechanical performance of
the nanocomposite samples. In our case, two main interactions can be conjectured. The
interaction between the water molecules and the amide groups of the PA 6. Then, the
interaction of water molecules with the hydrophilic CNF. With the former dominating
the absorption process in nanocomposite samples as the water uptake for nanocomposite
samples decreased as function of CNF content but remained lower than the neat PA 6
(Figure 5). This is due to the strong hydrogen bonds between CNF and PA 6 along with
the CNF–CNF interaction which are competing with water [39]. To study the influence of
moisture on the mechanical properties, tensile samples were moisture conditioned for 48 h
in a climatic chamber at 23 ◦ C and relative humidity 50% prior to testing. From the Table 1,
all the conditioned samples (48 h CC) showed reduced tensile modulus and strength. The
reduction of modulus in the presence of moisture is common to most polyamides due to
the plasticizing effect of water molecules on polyamides [40]. Tg for moisture conditioned
PA 6 can decrease to room temperature and below, as water molecules interfere with
hydrogen bonds between the polymer chain increasing the chain mobility. The reduced Tg
causes a strong reduction of the amorphous modulus in the presence of moisture leading
to decrease in the semicrystalline polymer [41]. Additionally, the reduction of modulus of
matrix results in the modulus reduction of the nanocomposites. With increased mobility
due to moisture conditioning, the yield stress also decreases and the deformation at break
increases. Hence, moisture is a key factor affecting processing and final performance for
PA 6/CNF nanocomposites.
Figure 5. Water absorption percent versus time for neat PA 6 and PA 6/CNF nanocomposites at
room temperature.
Fick’s law was used to calculate diffusion coefficient D at lower times of immersion,
i.e., when Mt /M∞ = 0.5. The diffusion coefficient for all the samples is summarized
in Table 2. It was observed that diffusion coefficient decreased as the amount of CNF
increased with 25 wt % formulation showing the least D value. The lower D values
can be related to the lower mobility of PA 6 chains inhibited by CNF reinforcement.
Nevertheless, hydrogen bonding between the fibers and the PA 6 matrix can also have
a negative effect on the diffusion of water through the composite samples [42]. The M∞
values for nanocomposite samples were reached quicker when compared to neat PA 6 due
to lower diffusion coefficients of the samples and the values remained below that of neat
PA 6.Polymers 2021, 13, 1495 11 of 17
Table 2. Diffusion coefficient at 23 ◦ C for PA 6/CNF nanocomposites.
CNF Content (wt %) M∞ (%) D × 10−9 (m2 s−1 )
Neat PA 6 7.2 6.5
5 6.8 3.2
15 6.6 0.6
25 6.1 0.5
Thermogravimetric analysis (TGA) was conducted to determine the thermal behavior
of nanocomposites and compare it with the neat samples. Thermograms indicating TGA
curves and DTG curves for all the samples are shown in Figure 6. TGA plot revealed
the region of degradation (Figure 6a) and moreover, elucidated the temperature range
for processing the nanocomposites. The initial mass loss within the temperature range of
60–110 ◦ C is attributed to the evaporation of water from the samples. This loss of water
is important because water acts as an auto accelerator in the degradation process [27].
For temperatures above 300 ◦ C, degradation of cellulosic materials kicks off giving away
combustible volatiles such as methanol, acetic acid acetaldehyde and propenal. These
volatiles components increase the rate of decomposition in the nanocomposites [43]. For the
nanocomposites, the thermal stability decreased mildly with an increase in CNF content.
The CNF char residue for the samples lied between the range of 2–4%. From the first
derivative of TG (Figure 6b), the DTG thermal bands were obtained at 460 ◦ C for neat
PA 6. In our case, a maximum temperature of 230 ◦ C was used during the processing of
nanocomposites, thus avoiding excessive thermal degradation of CNF.
The TGA was performed for the enzymatic CNF gel (1.5 wt % consistency) by heating
the sample in an aluminum pan from 30 to 230 ◦ C at a heating rate of 50 ◦ C/min. At
4 min 230 ◦ C was reached and the CNF was checked for thermal degradation at isothermal
conditions for 15 min. The TGA curve for CNF at isothermal conditions (230 ◦ C) is shown
in Figure 6c. The initial drop in the TGA curve is due to the loss of water from the CNF gel.
The remaining pure CNF does not experience any thermal degradation at the processing
temperature. This indicates that the thermal stability of the CNF was not compromised at
a processing temperature of 230 ◦ C for this time.
DSC analysis was conducted to recognize the effect of CNF content on the melt-
ing behavior and crystallinity of PA 6 matrix. Single, well defined endothermic peaks
were obtained for all samples and the DSC thermogram for the heating cycle is shown in
Figure 7. The values of glass transition temperature (Tg ), melting temperature (Tm ) and cor-
responding enthalpies (∆H) are summarized in Table 3, according to Equations (11) and (12)
in the experimental section.
Table 3. Thermal properties of neat PA 6 and PA 6/CNF nanocomposites.
CNF Content Tg Tm ∆Hpolymer χc
(wt %) (◦ C) (◦ C) (J/g) (%)
Neat PA 6 51.6 221.96 72.1 31.4
5 53.5 221.32 60.49 26.3
15 54.7 220.91 59.81 26.0
25 55.4 220.69 57.12 24.8Polymers 2021, 13, 1495 12 of 17
Figure 6. Thermograms, (a) TGA, (b) DTG for neat PA 6 and PA 6/CNF nanocomposites and (c) TGA of CNF gel at
isothermal conditions at 230 ◦ C.
Figure 7. DSC thermogram, heating cycle for neat PA 6 and PA 6/CNF nanocomposites.Polymers 2021, 13, 1495 13 of 17
The DSC measurements indicate that the glass transition for the nanocomposite sam-
ples occurred at a slightly higher temperature when compared to neat PA 6. Additionally,
the glass transition temperature increased with addition of CNF content. This was at-
tributed to the strong interactions between polar amide groups of PA 6 and hydroxyl
groups of CNF, thus reducing the segmental mobility of the nanocomposite structure [44].
The steady increase in Tg also indicated that the CNF was well dispersed in the PA 6
matrix [45]. The melting point of the neat PA 6 from the endothermic melting peak was
detected at 221.96 ◦ C, which can be associated to the α-form crystals of PA 6 [46]. There
was no significant influence on the melting point of the nanocomposite samples as the
changes in Tm was minuscule. The Tm for all samples were between 220 and 222 ◦ C. The
degree of crystallinity of the nanocomposite samples reduced with the addition of CNF.
The crystallinity of PA 6 was 31.4%, while the crystallinity for the 25 wt % formulation was
24.8%. Identical decrease in crystallinity was observed for PA 6 nanocomposites contain-
ing microcrystalline cellulose and nanoclay [47,48]. The decrease in the crystallinity for
nanocomposite samples is attributed to the vast surface on nanofillers, and the effect on
the mobility of chains of polymer matrix. In some previous study, CNF acted as nucleating
sites for crystallization [49]. The nucleating effect significantly contributes to the formation
of transcrystalline layers around nanofillers thus, resulting in increase in crystallinity [50].
Nevertheless, the addition of nanofillers constrains the mobility of polymer chains hin-
dering the crystal growth [45]. Thereby, decreasing the degree of crystallinity was the
prevailing factor in our case.
The morphology of 5 wt % and 25 wt % formulations samples were observed under
electron microscope. The SEM micrographs of the fractured surfaces for the nanocomposite
samples are shown in Figure 8. The distribution of CNF appeared to be homogenous
within the in-plane layers of the fractured samples with very few voids and no agglomera-
tions in Figure 8(i),(iv). The fractured surfaces of the nanocomposite samples were almost
identical to all formulations. The CNF show good adhesion to the PA 6 matrix and the
interface bonding regions are observed in Figure 8(ii),(v). The morphology of fractured
surfaces was formed under tension. Hence, the polymer strands had a fiber like shape,
which were broken at some point during tensile elongation and were surrounded by CNF
(Figure 8(v)). No major pull-out of the fibers was observed, but some broken fibers were
found, which indicated suitable interface between PA 6 and CNF. Due to the hydrophilic
nature of CNF and PA 6, the CNF demonstrated to be a suitable reinforcement to the poly-
mer without problems of agglomeration. Under elongation, the different moduli of CNF
and PA 6 created different deformation modes and the different strains were generated
by the same load, which created stress concentration points at the interface of PA 6 and
CNF. As this unmatched strain reached a magnitude of the interfacial adhesion between
PA 6 and CNF, a sliding deformation occurs [31]. This sliding deformation is observed in
Figure 8(vi). Moreover, the reinforcing effect was estimated by the effective stress transfer
through interfacial adhesion, which was corroborated by the improved mechanical proper-
ties of the PA 6/CNF nanocomposites. Additionally, from the SEM micrographs, it was
observed that the CNF integrity was unharmed, signifying no serious thermal degradation
had taken place.Polymers 2021, 13, 1495 14 of 17
Figure 8. SEM micrographs of (a) 5 wt % and (b) 25 wt % PA/CNF nanocomposites.
4. Conclusions
PA 6 with its material properties has become a hot commodity in the automobile
industry. There is tremendous emphasis on enhancing the mechanical properties using
natural nanofillers. CNF with its high specific strength, aspect ratio and compatibility
with PA 6 became a tangible ecofriendly and sustainable choice of reinforcement. To
produce CNF reinforced polymer composites at an industrial level, successful incorporation
of CNF within the polymer matrix is critical. This study corroborated that premixing
and compounding via a thermokinetic mixer, PA 6/CNF nanocomposites with good
dispersion could be obtained. Minimizing the exposure time of CNF to high processing
temperatures was key in obtaining composites with the preserved integrity of CNF. Three
different formulations: 5, 15 and 25 wt % formulations of PA 6/CNF nanocomposites
were produced. The mechanical properties were improved with the addition of CNF, with
25 wt % formulation showing the highest tensile values, in Young’s modulus and in tensilePolymers 2021, 13, 1495 15 of 17
strength. Water uptake study indicated that the water uptake reduced with the addition of
CNF due to the hydrogen bonds between the PA 6 and CNF, which hindered the diffusion
of water molecules. DSC analysis revealed that the degree of crystallinity reduced for the
nanocomposites as the addition of CNF constrained the polymer chain hindering crystal
growth. TGA expectedly implied that the thermal stability of nanocomposites reduced
slightly for the nanocomposites. The capillary rheological study indicated that the dynamic
viscosity increased with the addition of CNF. SEM micrographs showed homogenous
interface morphology of fractured samples with hardly any fiber pull-out.
Further, producing samples with injection molding and optimizing processing meth-
ods will further increase the scalability of CNF/polymer composites on an industrial
level. Ultimately, this study provides insightful prospects on sustainable materials and
developing high performance nanocellulose reinforced polymer composites with high fiber
weight fractions.
Supplementary Materials: The following are available online at https://www.mdpi.com/article/10
.3390/polym13091495/s1, Table S1: melt flow indices (MFI) and melt volume flow rate (MVR) for
neat PA 6 and PA 6/CNF nanocomposites at different masses.
Author Contributions: Conceptualization, P.K.S. and F.V.; methodology, P.K.S. and F.V.; validation,
P.K.S. and F.V.; formal analysis, P.K.S.; investigation, P.K.S.; resources, P.K.S. and F.V.; data curation,
P.K.S.; writing—original draft preparation, P.K.S.; writing—review and editing, P.K.S. and F.V.;
visualization, P.K.S. and F.V.; supervision, F.V.; project administration, F.V.; funding acquisition, F.V.
All authors have read and agreed to the published version of the manuscript.
Funding: This research was funded by the Wallenberg Wood Science Institute—KTH (KAW 2018.0451,
Sweden) in Sweden, the by UdG grant (IFUdG 2017) in Spain, and by the Spanish Ministry of Science,
Innovation and Universities (RTI 2018-102070-B-C22).
Institutional Review Board Statement: Not applicable.
Informed Consent Statement: Not applicable.
Data Availability Statement: The data presented in this study are available on request from the
corresponding author.
Acknowledgments: The authors would like to thank the LEPAMAP group of the UdG for aiding
in the use of laboratory equipment. The authors also want to thank Joan Pere López, Daniel Reyes
Bautista and Albert Serra for helping to perform thermal analysis, SEM analysis and conductometric
titration respectively. The Secretary of Chemical Engineering branch and the OITT of UdG are
appreciated for their administrative support.
Conflicts of Interest: The authors declare no conflict of interest.
References
1. Annandarajah, C.; Langhorst, A.; Kiziltas, A.; Grewell, D.; Mielewski, D.; Montazami, R. Hybrid cellulose-glass fiber composites
for automotive applications. Materials 2019, 12, 3189. [CrossRef]
2. Huber, T.; Müssig, J.; Curnow, O.; Pang, S.; Bickerton, S.; Staiger, M.P. A critical review of all-cellulose composites. J. Mater. Sci.
2012, 47, 1171–1186. [CrossRef]
3. Gholampour, A.; Ozbakkaloglu, T. A review of natural fiber composites: Properties, modification and processing techniques,
characterization, applications. J. Mater. Sci. 2020, 55, 829–892. [CrossRef]
4. Corrêa, A.C.; de Morais Teixeira, E.; Carmona, V.B.; Teodoro, K.B.R.; Ribeiro, C.; Mattoso, L.H.C.; Marconcini, J.M. Obtaining
nanocomposites of polyamide 6 and cellulose whiskers via extrusion and injection molding. Cellulose 2014, 21, 311–322. [CrossRef]
5. Dufresne, A. Cellulose nanomaterials as green nanoreinforcements for polymer nanocomposites. Philos. Trans. R. Soc. A Math.
Phys. Eng. Sci. 2018, 376. [CrossRef]
6. Boland, C.S.; De Kleine, R.; Keoleian, G.A.; Lee, E.C.; Kim, H.C.; Wallington, T.J. Life cycle impacts of natural fiber composites for
automotive applications: Effects of renewable energy content and lightweighting. J. Ind. Ecol. 2016, 20, 179–189. [CrossRef]
7. Zimmermann, T.; Bordeanu, N.; Strub, E. Properties of nanofibrillated cellulose from different raw materials and its reinforcement
potential. Carbohydr. Polym. 2010, 79, 1086–1093. [CrossRef]
8. Henriksson, M.; Henriksson, G.; Berglund, L.A.; Lindström, T. An environmentally friendly method for enzyme-assisted
preparation of microfibrillated cellulose (MFC) nanofibers. Eur. Polym. J. 2007, 43, 3434–3441. [CrossRef]Polymers 2021, 13, 1495 16 of 17
9. Prakobna, K.; Berthold, F.; Medina, L.; Berglund, L.A. Mechanical performance and architecture of biocomposite honeycombs
and foams from core–shell holocellulose nanofibers. Compos. Part A Appl. Sci. Manuf. 2016, 88, 116–122. [CrossRef]
10. Khalil, H.P.S.A.; Davoudpour, Y.; Islam, M.N.; Mustapha, A.; Sudesh, K.; Dungani, R.; Jawaid, M. Production and modification of
nanofibrillated cellulose using various mechanical processes: A review. Carbohydr. Polym. 2014, 99, 649–665. [CrossRef] [PubMed]
11. Francisco, D.L.; Paiva, L.B.; Aldeia, W. Advances in polyamide nanocomposites: A review. Polym. Compos. 2019, 40, 851–870.
[CrossRef]
12. Iwamoto, S.; Isogai, A.; Iwata, T. Structure and mechanical properties of wet-spun fibers made from natural cellulose nanofibers.
Biomacromolecules 2011, 12, 831–836. [CrossRef] [PubMed]
13. Kong, I.; Tshai, K.Y.; Hoque, M.E. Manufacturing of Natural Fibre-Reinforced Polymer Composites by Solvent Casting Method; Springer:
New York, NY, USA, 2015; pp. 331–349.
14. Lee, K.W.; Chung, J.W.; Kwak, S.-Y. Highly branched polycaprolactone/glycidol copolymeric green plasticizer by one-pot
solvent-free polymerization. ACS Sustain. Chem. Eng. 2018, 6, 9006–9017. [CrossRef]
15. Wang, L.; Gardner, D.J.; Wang, J.; Yang, Y.; Tekinalp, H.L.; Tajvidi, M.; Li, K.; Zhao, X.; Neivandt, D.J.; Han, Y.; et al. Towards
the scale-up production of cellulose nanocomposites using melt processing: A critical review on structure-processing-property
relationships. Compos. Part B Eng. 2020. [CrossRef]
16. Sridhara, P.K.; Vilaseca, F. Assessment of fiber orientation on the mechanical properties of PA6/cellulose composite. Appl. Sci.
2020, 10, 5565. [CrossRef]
17. Alonso-Montemayor, F.J.; Tarrés, Q.; Oliver-Ortega, H.; Espinach, F.X.; Narro-Céspedes, R.I.; Castañeda-Facio, A.O.; Delgado-
Aguilar, M. Enhancing the mechanical performance of bleached hemp fibers reinforced polyamide 6 composites: A competitive
alternative to commodity composites. Polymers 2020, 12, 1041. [CrossRef] [PubMed]
18. DUSATEC. Mixing Ultrahigh-Speed Thermokinetic Gelimat TM Technology. Available online: http://www.dusatec.net/images/
Gelimat_brochure_final.pdf (accessed on 20 April 2021).
19. Gopakumar, T.G.; Page, D.J.Y.S. Compounding of nanocomposites by thermokinetic mixing. J. Appl. Polym. Sci. 2005, 96,
1557–1563. [CrossRef]
20. Park, B.; Balatinecz, J.J. A comparison of compounding processes for wood-fiber/thermoplastic composites. Polym. Compos. 1997,
18, 425–431. [CrossRef]
21. Lee, J.-A.; Yoon, M.-J.; Lee, E.-S.; Lim, D.-Y.; Kim, K.-Y. Preparation and characterization of cellulose nanofibers (CNFs) from
microcrystalline cellulose (MCC) and CNF/polyamide 6 composites. Macromol. Res. 2014, 22, 738–745. [CrossRef]
22. Saito, T.; Isogai, A. TEMPO-mediated oxidation of native cellulose. The effect of oxidation conditions on chemical and crystal
structures of the water-insoluble fractions. Biomacromolecules 2004, 5, 1983–1989. [CrossRef]
23. Shenoy, A.V.; Saini, D.R.; Nadkarni, V.M. Melt rheology of polymer blends from melt flow index. Int. J. Polym. Mater. Polym.
Biomater. 1984, 10, 213–235. [CrossRef]
24. Guillot, P.; Colin, A. Determination of the flow curve of complex fluids using the Rabinowitsch-Mooney equation in sensorless
microrheometer. Microfluid. Nanofluidics 2014, 17, 605–611. [CrossRef]
25. Wu, Q.; Liu, X.; Berglund, L.A. An unusual crystallization behavior in polyamide 6/montmorillonite nanocomposites. Macromol.
Rapid. Commun. 2001, 22, 1438–1440. [CrossRef]
26. Millot, C.; Fillot, L.A.; Lame, O.; Sotta, P.; Seguela, R. Assessment of polyamide-6 crystallinity by DSC: Temperature dependence
of the melting enthalpy. J. Therm. Anal. Calorim. 2015, 122, 307–314. [CrossRef]
27. Borsoi, C.; Zimmernnam, M.V.G.; Zattera, A.J.; Santana, R.M.C.; Ferreira, C.A. Thermal degradation behavior of cellulose
nanofibers and nanowhiskers. J. Therm. Anal. Calorim. 2016, 126, 1867–1878. [CrossRef]
28. Van De Velde, K.; Kiekens, P. Thermal degradation of flax: The determination of kinetic parameters with thermogravimetric
analysis. J. Appl. Polym. Sci. 2002, 83, 2634–2643. [CrossRef]
29. Peng, Y.; Gardner, D.J.; Han, Y. Characterization of mechanical and morphological properties of cellulose reinforced polyamide 6
composites. Cellulose 2015, 22, 3199–3215. [CrossRef]
30. Faruk, O.; Bledzki, A.K.; Fink, H.P.; Sain, M. Progress report on natural fiber reinforced composites. Macromol. Mater. Eng. 2014,
299, 9–26. [CrossRef]
31. Nicharat, A.; Sapkota, J.; Weder, C.; Foster, E.J. Melt processing of polyamide 12 and cellulose nanocrystals nanocomposites. J.
Appl. Polym. Sci. 2015, 132. [CrossRef]
32. Krishna, S.; Patel, C.M. Computational and experimental study of mechanical properties of Nylon 6 nanocomposites reinforced
with nanomilled cellulose. Mech. Mater. 2020, 143. [CrossRef]
33. Lee, K.Y.; Aitomäki, Y.; Berglund, L.A.; Oksman, K.; Bismarck, A. On the use of nanocellulose as reinforcement in polymer matrix
composites. Compos. Sci. Technol. 2014, 105, 15–27. [CrossRef]
34. Tarrés, Q.; Boufi, S.; Mutjé, P.; Delgado-Aguilar, M. Enzymatically hydrolyzed and TEMPO-oxidized cellulose nanofibers for the
production of nanopapers: Morphological, optical, thermal and mechanical properties. Cellulose 2017, 24, 3943–3954. [CrossRef]
35. Wei, J.; Chen, Y.; Liu, H.; Du, C.; Yu, H.; Ru, J.; Zhou, Z. Effect of surface charge content in the TEMPO-oxidized cellulose
nanofibers on morphologies and properties of poly(N-isopropylacrylamide)-based composite hydrogels. Ind. Crops. Prod. 2016,
92, 227–235. [CrossRef]
36. Dijkstra, D.J. Guidelines for rheological characterization of polyamide melts (IUPAC technical report). Pure Appl. Chem. 2009, 81,
339–349. [CrossRef]Polymers 2021, 13, 1495 17 of 17
37. Håkansson, K.M.O.; Fall, A.B.; Lundell, F.; Yu, S.; Krywka, C.; Roth, S.V.; Santoro, G.; Kvick, M.; Wittberg, L.P.; Wågberg, L.; et al.
Hydrodynamic alignment and assembly of nanofibrils resulting in strong cellulose filaments. Nat. Commun. 2014, 5. [CrossRef]
38. Kiziltas, A.; Nazari, B.; Gardner, D.J.; Bousfield, D.W. Polyamide 6-cellulose composites: Effect of cellulose composition on melt
rheology and crystallization behavior. Polym. Eng. Sci. 2014, 54, 739–746. [CrossRef]
39. Venkatraman, P.; Gohn, A.M.; Rhoades, A.M.; Foster, E.J. Developing high performance PA 11/cellulose nanocomposites for
industrial-scale melt processing. Compos. Part B Eng. 2019, 174. [CrossRef]
40. Chaichanawong, J.; Thongchuea, C.; Areerat, S. Effect of moisture on the mechanical properties of glass fiber reinforced polyamide
composites. Adv. Powder. Technol. 2016, 27, 898–902. [CrossRef]
41. Abacha, N.; Kubouchi, M.; Sakai, T. Diffusion behavior of water in polyamide 6 organoclay nanocomposites. Express Polym. Lett.
2009, 3, 245–255. [CrossRef]
42. Oliver-Ortega, H.; Méndez, J.A.; Espinach, F.X.; Tarrés, Q.; Ardanuy, M.; Mutjé, P. Impact strength and water uptake behaviors of
fully bio-based PA11-SGW composites. Polymers 2018, 10, 717. [CrossRef] [PubMed]
43. Qua, E.H.; Hornsby, P.R. Preparation and characterisation of nanocellulose reinforced polyamide-6. Plast. Rubber Compos. 2011,
40, 300–306. [CrossRef]
44. Paci, M.; Filippi, S.; Magagnini, P. Nanostructure development in nylon 6-Cloisite®30B composites. Effects of the preparation
conditions. Eur. Polym. J. 2010, 46, 838–853. [CrossRef]
45. Zhu, R.; Yadama, V.; Liu, H.; Lin, R.J.T.; Harper, D.P. Fabrication and characterization of Nylon 6/cellulose nanofibrils melt-spun
nanocomposite filaments. Compos. Part A Appl. Sci. Manuf. 2017, 97, 111–119. [CrossRef]
46. Jin, J.; Rafiq, R.; Gill, Y.Q.; Song, M. Preparation and characterization of high performance of graphene/nylon nanocomposites.
Eur. Polym. J. 2013, 49, 2617–2626. [CrossRef]
47. Kiziltas, A.; Gardner, D.J.; Han, Y.; Yang, H.S. Dynamic mechanical behavior and thermal properties of microcrystalline cellulose
(MCC)-filled nylon 6 composites. Thermochim. Acta 2011, 519, 38–43. [CrossRef]
48. Goitisolo, I.; Eguiazábal, J.I.; Nazábal, J. Effects of reprocessing on the structure and properties of polyamide 6 nanocomposites.
Polym. Degrad. Stab. 2008, 93, 1747–1752. [CrossRef]
49. Chavarria, F.; Paul, D.R. Comparison of nanocomposites based on nylon 6 and nylon 66. Polymer 2004, 45, 8501–8515. [CrossRef]
50. John, M.J.; Anandjiwala, R.; Oksman, K.; Mathew, A.P. Melt-spun polylactic acid fibers: Effect of cellulose nanowhiskers on
processing and properties. J. Appl. Polym. Sci. 2013, 127, 274–281. [CrossRef]You can also read