Molecular-Assisted Distinctness and Uniformity Testing Using SLAF-Sequencing Approach in Soybean - MDPI
←
→
Page content transcription
If your browser does not render page correctly, please read the page content below
G C A T
T A C G
G C A T
           genes
Article
Molecular-Assisted Distinctness and Uniformity
Testing Using SLAF-Sequencing Approach
in Soybean
Shengrui Zhang 1,† , Bin Li 1,† , Ying Chen 1 , Abdulwahab S. Shaibu 1 , Hongkun Zheng 2 and
Junming Sun 1, *
 1   The National Engineering Laboratory for Crop Molecular Breeding, MARA Key Laboratory of Soybean
     Biology (Beijing), Institute of Crop Sciences, Chinese Academy of Agricultural Sciences,
     12 Zhongguancun South Street, Beijing 100081, China; Zhangshengrui@caas.cn (S.Z.); libin02@caas.cn (B.L.);
     chenying@ystwt.com (Y.C.); asshuaibu.agr@buk.edu.ng (A.S.S.)
 2   Biomarker Technologies Corporation, Beijing 101300, China; zhenghk@biomarker.com.cn
 *   Correspondence: sunjunming@caas.cn; Tel./Fax: +86-10-82105805
 †   These authors contributed equally to this study.

 Received: 15 January 2020; Accepted: 4 February 2020; Published: 6 February 2020

 Abstract: Distinctness, uniformity and stability (DUS) testing of cultivars through morphological
 descriptors is an important and compulsory part of soybean breeding. Molecular markers are
 usually more effective and accurate in describing the genetic features for the identification and
 purity assessment of cultivars. In the present study, we assessed the distinctness and uniformity
 of five soybean cultivars using both single nucleotide polymorphism (SNP) markers developed by
 specific-locus amplified fragment sequencing (SLAF-seq) technology, and simple sequence repeat
 (SSR) markers. The phylogenetic tree and principal component analysis (PCA) from both the SLAF-seq
 and SSR methods showed a clear distinction among cultivars Zhonghuang 18, Zhonghuang 68 and
 Zhonghuang 35, while no clear distinction was observed between cultivars Zhonghuang 13 and
 Hedou 13. Using the SLAF-seq method, we determined the proportion of homozygous loci for the
 five soybean cultivars. The heterozygosity of each individual plant was estimated for the assessment
 of cultivar purity and the purity levels of the five soybean cultivars ranged from 91.89% to 93.96%. To
 further validate the applicability of the SLAF-seq approach for distinctness testing, we used the SNP
 information of 150 soybean cultivars with different origins. The cultivars were also distinguished
 clearly. Taken together, SLAF-seq can be used as an accurate and reliable method in the assessment of
 the distinctness and uniformity of soybean cultivars.

 Keywords: soybean (Glycine max (L.) Merrill); SSR; SNP; SLAF-seq; fingerprint; cultivar identification

1. Introduction
     Plant varietal identification and purity assessment play important roles in breeding, registration
and trade processes, and they depend mainly on two strategies based on morphological descriptors
or molecular markers [1]. Morphological descriptors including plant height, leaf shape, flower color
and maturity are traditionally used to distinguish and classify plant species or cultivars [2]. Cultivar
registration and protection require distinctness, uniformity and stability (DUS) testing based on
morphological features [3]. However, the current DUS testing has some limitations in distinguishing
cultivars. For instance, the commercial cultivars are usually bred using narrow elite parent backgrounds,
which leads to high similarity in morphological descriptors and thereby results in difficulty in cultivar
identification. Furthermore, for the case of maize in China, there are 6291 registered cultivars as of
2013, and they are all required to be evaluated alongside new candidate varieties for accurate DUS

Genes 2020, 11, 175; doi:10.3390/genes11020175                                      www.mdpi.com/journal/genes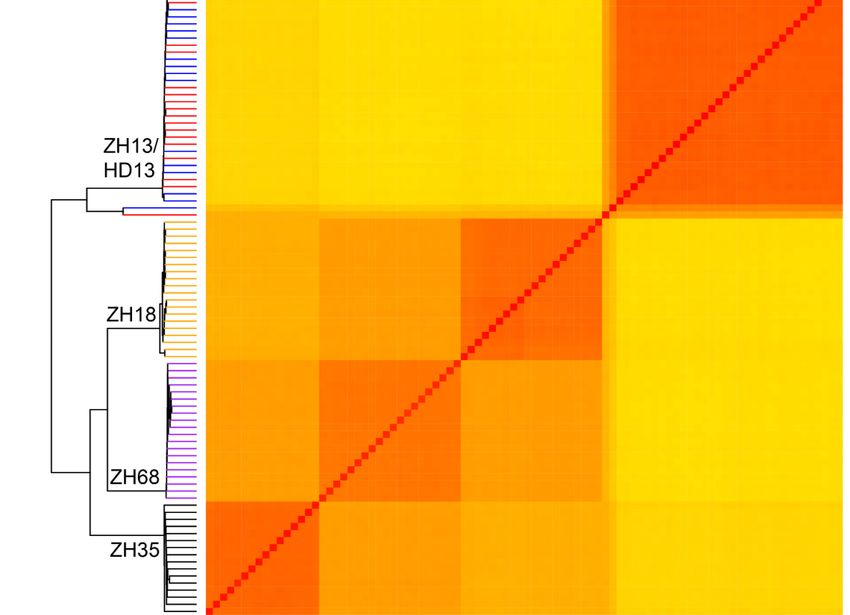
Genes 2020, 11, 175                                                                                2 of 18

assessment [4]. The time-, labor-consumption and sensitivity to environmental changes involved in
DUS testing make it vague in distinguishing cultivars [5]. Furthermore, this process of DUS testing
using morphological descriptor is mostly restricted to a few traits which are easily influenced by
environmental factors [6]. These disadvantages seriously affect the accuracy and efficiency of cultivar
identification and may lead to the possibility of infringing or fake varieties passing the DUS testing
in cultivar registration, causing economic losses to breeders. In addition to DUS testing based on
morphological descriptors, more reliable methods should be applied to identify varieties with similar
morphological features in DUS testing or infringement lawsuits.
      Owing to these reasons, the International Union for the Protection of New Varieties of Plants
(UPOV), an intergovernmental organization whose system of plant variety protection is intended to
encourage innovation in the field of plant breeding [7], has called for the adoption of a DNA-based
system that will enable examiners to deploy trait-specific DNA markers in DUS testing [6]. Genetic
features have been considered a remarkable improvement for the identification of cultivars in DUS
testing [8–11]. Recently, molecular marker approaches appeared to define the genome variations of
different cultivars and have become more important and popular in cultivar identification and genetic
map construction [12]. Molecular markers including restriction fragment length polymorphisms
(RFLP) [13], random amplified polymorphic DNA (RAPD) [14–16], simple sequence repeat (SSR) [17,18],
inter-simple sequence repeat (ISSR) [19], and single nucleotide polymorphism (SNP) [20,21], were
applied to genetic diversity analysis and genetic mapping. In DUS testing, amplified fragment length
polymorphisms (AFLP) and SSR are the most commonly used [6]. SSR markers have the advantage of
being highly polymorphic and originate from defined chromosomal locations. Recently, SNP markers
have been used in distinctness testing of maize and alfalfa varieties. Compared to SSR markers,
bi-allelic SNP markers are more abundant in plant genomes, making them the choice of markers for
DNA fingerprinting in modern plant breeding and plant research programs. Additionally, compared
with mutable markers, such as microsatellites, SNPs have a low rate of recurrent mutation, making
them stable indicators [22]. During the period of Sanger sequencing, the calling of SNPs depended on
PCR and Sanger sequencing created low-throughput fingerprint for varieties. With the advantages of
the next generation sequencing (NGS) technologies in this decade, high-throughput detection of SNPs
is highly accelerated [23,24].
      Although dramatic falls have occurred in recent decades, the sequencing cost remains an important
constraint in many cases [25]. To balance the cost and depth of sequencing, reduced-representation
genome sequencing (RRGS) technology was developed [23]. This approach first creates a reduced
representation library (RRL) by digesting genomic DNA with a specific restriction enzyme.
Subsequently, the RRL is sequenced for SNP calling through NGS technologies. It ensures sufficient
accuracy for SNP calling due to more coverage for each SNP when compared to whole-genome
resequencing [23]. Specific-locus amplified fragment sequencing (SLAF-seq) is one extensively used
RRGS technique, and can generate more than 100,000 tags in each experiment. It ensures the accuracy
of the tags by increasing the depth of the tags. Recently, SLAF-seq has been used in QTL mapping [26],
genome-wide association analysis [27], and bulk segregant analysis [28].
      Soybean [Glycine max (L.) Merrill] is one of the most widely grown crops for oil, plant protein
and other numerous uses. The world production of soybean as of 2017 was 352 million tons [29].
However, not all cultivars produced the same average yield due to genetic variability. Therefore,
DUS testing is important for guiding and protecting breeders. Purity contributes to the retention of
varietal characteristics, and a positive correlation between varietal purity and yield has been reported.
In recent decades, varietal identification and purity assessment based on molecular markers [25–31]
usually had some limitations, such as low-density and low-throughput. This has made DUS testing
using molecular markers extraordinarily time-consuming and labor-intensive. Therefore, a more
reliable and accurate approach is needed. The ever increasing use of NGS technologies has renewed
the focus of researchers on the detailed investigation of molecular-based or molecular-assisted DUS
testing in a timelier manner [6]. The DNA-based markers can be used to supplement, or even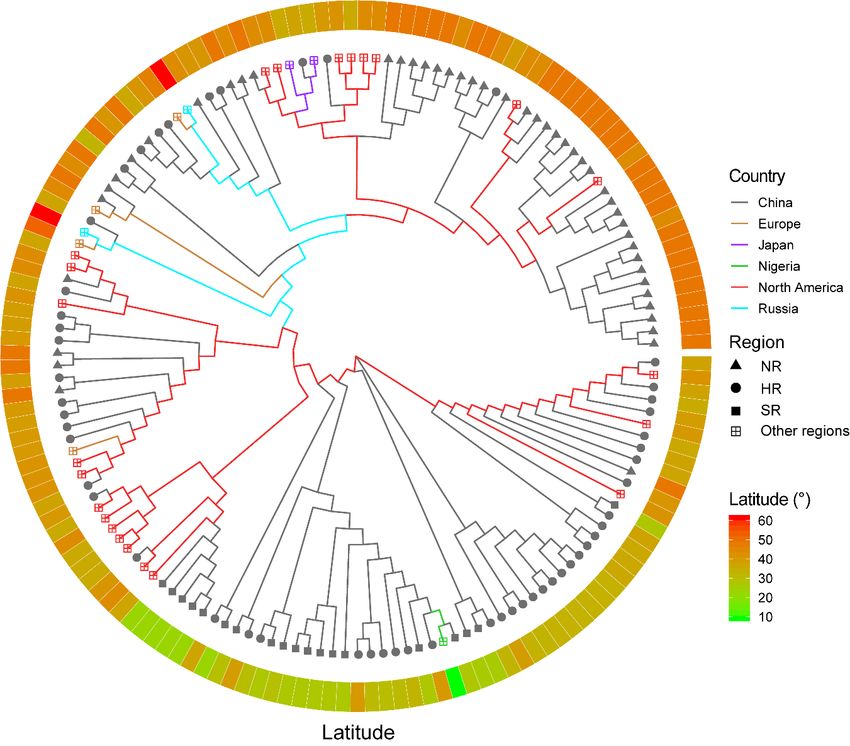
Genes 2020, 11, 175                                                                                                        3 of 18

ultimately replace, existing morphological and protein-based approaches. The UPOV Working Group
on Biochemical and Molecular Techniques and DNA Profiling, in particular, have explored such
options and proposed two models: the first is using characteristic-specific molecular markers, while the
second is combining phenotypic and molecular distances in the management of variety collections [30].
Nowadays, DUS testing based on morphological descriptors is compulsory; however, it may have
difficulty distinguishing similar cultivars. Hence, adopting the first model, we developed an accurate
and reliable approach to complement the morphological method of DUS testing in soybean using
SLAF-seq technology.

2. Materials and Methods

2.1. Plant Materials
     Soybean cultivars including cv. Zhonghuang 13 (ZH13), Zhonghuang 35 (ZH35), Zhonghuang
18 (ZH18), Zhonghuang 68 (ZH68) and Hedou 13 (HD13) were used for the assessment of cultivar
uniformity in this study (Table 1). The cv. ZH13, ZH35, ZH18 and ZH68 were released by Soybean
High-yield and Quality Breeding Research Group in the Institute of Crop Sciences (ICS), Chinese
Academy of Agricultural Sciences (CAAS). Cultivar ZH18 is one of the parents for cv. ZH68. Cultivar
ZH13 is a leading soybean cultivar in the Huanghuaihai valley region of China, while cv. ZH 35 is one
of the highest yielding soybean cultivars, which had the highest yield record of 6.32 tons per hectare in
2012 in China. Cultivar HD13 was developed by the Heze Academy of Agricultural Science, Shandong
Province. The soybean seeds of each cultivar were produced by our research group except cv. HD13,
which was sourced from a local market in China. Twenty random soybean healthy seeds of each
cultivar were grown in vermiculite under a constant temperature of 25 ◦ C and 16 hours of illumination
with LED lights at 300 µmol m−2 s−1 . After two weeks, the representative leaf samples from the
individual plants were harvested and persevered in liquid nitrogen for genomic DNA extraction.

                                     Table 1. The pedigrees of the five cultivars.

                                         Release
       Cultivar          Breeder                            Parents                                 Features
                                          Year
                                                          Yudou8 ×                    High yield, wide adaptability, disease
   Zhonghuang 13       ICS, CAAS 1         2001
                                                      Zhongzuo90052-76             resistance, lodging resistance, high protein
                                                       Zhongzuo9943 ×
   Zhonghuang 35       ICS, CAAS 1         2007                                     High yield, lodging resistance, high oil
                                                         Zheng76062
                                                        Zhongpin661 ×                High yield, disease resistance, lodging
   Zhonghuang 18       ICS, CAAS 1         2001
                                                          Century-2                          resistance, high protein
                                                       Zhonghuang18 ×                High yield, disease resistance, no beany
   Zhonghuang 68       ICS, CAAS 1         2013
                                                         Karikoi-434                                 flavour
                                                                                      High yield, wide adaptability, disease
      Hedou 13           HAAS 2            2005        Yudou8 × He95-1
                                                                                   resistance, lodging resistance, high protein
      1Institute of Crop Sciences, Chinese Academy of Agricultural Sciences.   2   Heze Academy of Agricultural Sciences,
      Shandong Province, China.

     Furthermore, The dataset of SNPs called by SLAF-seq was obtained from the additional file 2 of
the published study on the GWAS of resistance to cyst nematode in soybean [6]. The dataset consists of
36,976 SNPs from 440 soybean varieties and we selected 150 cultivars randomly from 440 cultivars for
the construction of phylogenic trees. The 150 cultivars contain 118 Chinese cultivars which originated
from three main soybean cultivation regions including Northern Region (NR), Huanghuaihai Region
(HR), and Southern Region (SR), 23 cultivars from North America, four from Europe, two from Japan,
two from Russia and one from Nigeria.

2.2. DNA Extraction, SLAF Library Construction and Sequencing
    The genomic DNA extraction was performed using DNase secure Plant Kit (Catalog Number:
DP320, TIANGEN Biotech (Beijing) Co., Ltd., Bejing, China). The procedure of SLAF-seq described by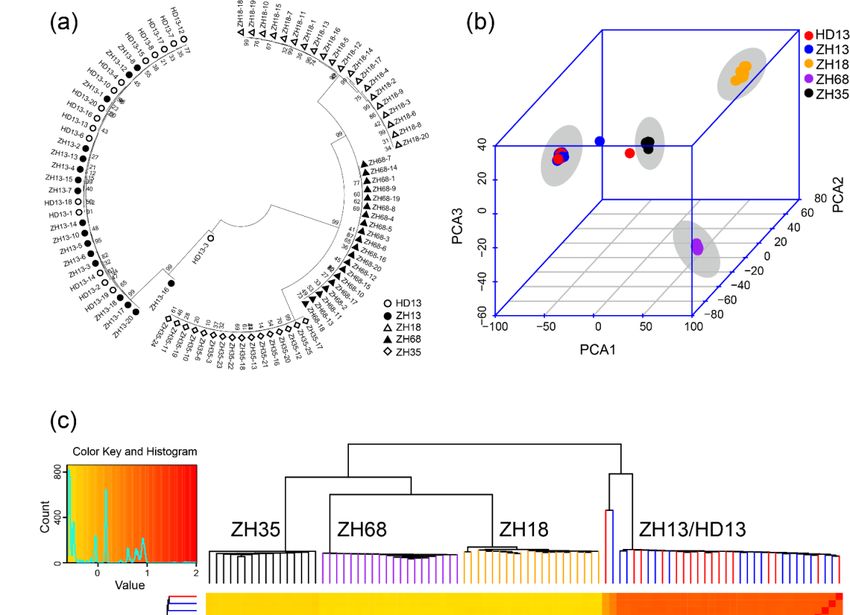
Genes 2020, 11, 175                                                                                 4 of 18

Sun et al. [31] was used with some modifications. Briefly, a pilot experiment was performed to evaluate
the number, distribution and repetition of the restriction fragment. Genomic DNA was incubated with
HaeIII (New England Biolabs (NEB), Ipswich, USA), T4 ligase (NEB), ATP (NEB) and HaeIII adaptors at
37 ◦ C for 2 h after which the reaction was heat-inactivated at 65 ◦ C for 15 min. The fragments were
digested with EcoRI at 37 ◦ C for 2 h and the barcode1 was added to the fragments by PCR using HaeIII
primers. The products were purified by E.Z.N.A.®Cycle Pure Kit (Omega Bio-tek, Norcross, GE,
USA) and then pooled in 24 samples. The pooled samples were incubated with HaeIII, T4-ligase, ATP
and Solexa adapter at 37 ◦ C for 2 h and then purified using a Quick Spin column (Qiagen, Hilden,
Germany). Fragments of 300–360 bp (with indices and adaptors) were separated by 2% agarose gel
and collected by a Gel Extraction Kit (Qiagen, Hilden, Germany). The barcode2 was then added
using the Solexa amplification primer mix by Phusion Master Mix (NEB). Fragments of 300–360 bp
were gel-purified for sequencing. Pair-end sequencing was done using the Illumina high-throughput
sequencing platform (Illumina, San Diego, USA).

2.3. SSR Detection
     The primers for the SSR markers were synthesized according to the sequences reported by
Guan et al. [32] and the forward primer of each SSR was labeled with 6-FAM or HEX fluorescent dyes
(Table S1). The PCR reaction mix was prepared as follows: 20 µL reaction solution containing 30 ng of
total genomic DNA, 2 pM of forward and reverse primers, 1 µL dNTP, and 0.25 µL Taq polymerase
(Transgen, Beijing, China). The PCR was performed under the conditions of 95 ◦ C for 3 min and
subsequent 35 cycles of 94 ◦ C for 30 s, 55 ◦ C for 30 s, and 72 ◦ C for 30 s, using a Bio-rad C1000 Touch
Thermocycler (Bio-rad, Hercules, USA). Of the diluted PCR product (1/30 times), 0.3 µl containing
500 bp ROX internal marker was resolved by PAGE on an ABI 3730XL DNA sequencer (Perkin Elmer,
Waltham, USA). The fragment sizes were automatically analyzed using Genemapper V3.7 software
(Thermo Fisher Scientific, Waltham, MA, USA).

2.4. SLAF-seq Data Grouping and Genotyping
    Grouping and genotyping of SLAF-seq data were carried out by the procedures described by
Sun et al. [31]. Briefly, the high-quality reads (error chance < 0.01%, QC30) were mapped onto the
soybean genome (Glyma.Wm82.a2) using BWA software [33,34]. The reads with over 90% identity
were considered as the identical SLAF markers and grouped in one SLAF locus. The Genome Analysis
Toolkit [35] and SAMtools [36,37] were applied for SNPs discovery and the common SNPs were
used for subsequent analysis. Alleles were defined in each SLAF using the minor allele frequency
(MAF) evaluation. The SNPs with MAF < 0.05 and integrity > 0.8 were collected and used for
subsequent analysis.

2.5. Data Analysis
     The phylogenic trees from the SNP and SSR data were constructed by the neighbor-joining method
with bootstrap value 500 using Mega 10 software [38–40] and used for assessment of distinctness and
uniformity of cultivars. The visualization and annotation of the phylogenic trees were carried on by
ggtree package in R project [41,42]. Principal component analysis (PCA) and kinship analysis were
further conducted to assess the cultivar distinctness and cultivar specific SNPs. The PCA and kinship
analyses using SNPs were performed using the GAPIT package in R project [43]. The PCA for SSR
data was performed using the PCA function in R project.

2.6. Assessment of Purity
     The ratio of the homozygous loci of each individual plant was analyzed and considered as
the purity of the plants. The purity of a cultivar was the average of all the individual plants of
these cultivars.
Genes 2020, 11, 175 5 of 18
Genes 2020, 11, 175 5 of 18
The ratio of the homozygous loci of each individual plant was analyzed and considered as the
purity of the plants. The purity of a cultivar was the average of all the individual plants of these
3. Results
cultivars.
3.1. Assessment
3. Results of Distinctness and Uniformity of Soybean Cultivars Based on SLAF-seq
In order to assess the uniformity of soybean cultivars, multiple plants of five cultivars were
3.1. Assessment of Distinctness and Uniformity of Soybean Cultivars Based on SLAF-seq
subjected to SLAF-seq. A total of 9.89 Gb data consisting of 53,078,875 pair-end reads were generated
In order toratio
with a high-quality assess the uniformity
(0.1% of soybean
chance of error, QC30)cultivars,
of abovemultiple plants of
80.0% (Figure five
1a). cultivars
The averagewere
number
subjected to SLAF-seq. A total of 9.89 Gb data consisting of 53,078,875 pair-end reads were generated
of reads from each individual soybean plant was 1.29 million (Figure 1b). The average GC content
with a high-quality ratio (0.1% chance of error, QC30) of above 80.0% (Figure 1a). The average
(42.27%) of all the cultivars was not significantly different. Over 90% of the high-quality reads were
number of reads from each individual soybean plant was 1.29 million (Figure 1b). The average GC
mapped to the reference soybean genome (Wm82 a2v1) by BWA software and this covered 5.98% of
content (42.27%) of all the cultivars was not significantly different. Over 90% of the high-quality reads
the genome.
were mappedIn total, 163,134
to the SNPs
reference were called
soybean genomeby(Wm82
GATKa2v1)
and bySAMtools from the
BWA software andfive
thiscultivars
covered and
the SNPs in each plant ranged from 63,806 to 91,758. The average number of SNPs
5.98% of the genome. In total, 163,134 SNPs were called by GATK and SAMtools from the five observed in ZH68
plants was the
cultivars highest
and (89,544),
the SNPs while
in each plantthat of ZH13
ranged plantstowas
from 63,806 the The
91,758. lowest (81,152).
average numberAfter removing
of SNPs
observed in ZH68
non-polymorphic andplants was the
missing highest
SNPs, (89,544),
21,415 while that of
polymorphic ZH13were
SNPs plantsdiscovered
was the lowest
and(81,152).
distributed
in allAfter
the removing non-polymorphic
20 chromosomes and missing
of soybean (Table SNPs,
S2). 21,415 polymorphic
The lowest numberSNPs of were
SNPsdiscovered and
was observed in
distributed in all the 20 chromosomes of soybean (Table S2). The lowest
chromosome 11, and the highest number was observed in chromosome 1 (Figure 1c). The average number of SNPs was
observed in chromosome 11, and the highest number was observed in chromosome 1 (Figure 1c). The
distance between two adjacent SNPs was 33,497 bp, and 97.2% of the SNPs were located in gaps below
average distance between two adjacent SNPs was 33,497 bp, and 97.2% of the SNPs were located in
150 kb (Figure 1d). The 21,415 polymorphic SNPs were used for the assessment of the uniformity of
gaps below 150 kb (Figure 1d). The 21,415 polymorphic SNPs were used for the assessment of the
the five soybeanofcultivars.
uniformity the five soybean cultivars.
FigureFigure 1. basic
1. The The basic information
information aboutabout specific-locus
specific-locus amplified
amplified fragment
fragment sequencing
sequencing (SLAF-seq)
(SLAF-seq) results
results
in five in five
soybean soybean cultivars.
cultivars. (a) The
(a) The ratio ratio of high-quality
of high-quality reads (QC30)
reads (QC30) in SLAF-seq
in SLAF-seq for five
for five soybean
cultivars; (b) The total read number of SLAF-seq; (c) The single nucleotide polymorphism (SNP)
number in individual chromosomes; (d) The distribution of the gaps between every two adjacent SNPs.
The dashed line indicates the percentage of SNPs with gaps of less than 150 kb.Genes 2020, 11, 175 6 of 18
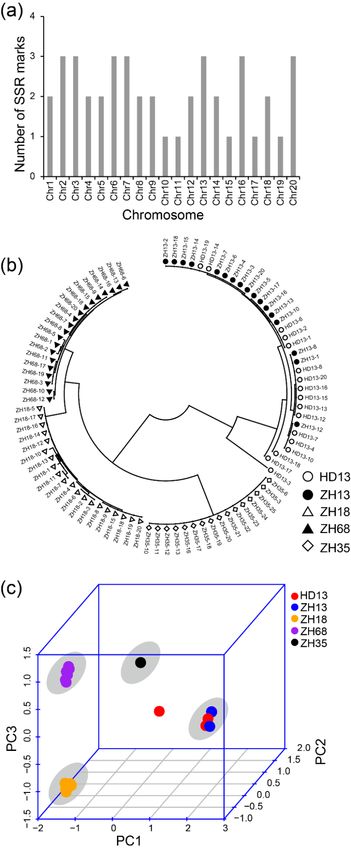
We applied three methods to analyze the genomic variation of the individual plants to assess the
distinctness and uniformity of the five cultivars. Firstly, the Neighbor-Joining phylogenetic tree was
constructed for all individual plants using the SNPs and two major branches were generated. One
branch comprised of ZH13 and HD13 plants, while the other branch comprised of ZH18, ZH68 and
ZH35 plants (Figure 2a). The plants from all the five cultivars were clustered into four groups. The
plants from the same cultivar showed less genetic distance and were clustered into the same group.
The clusters, ZH18 and ZH68, have closer genetic distance than the other clusters. ZH13 and HD13
plants showed no clear distinction (Figure 2a). Two plants, ZH13-16 and HD13-3, were observed to
have farther genetic distance than the other plants of the same cluster and were considered as off-type
plants. The pairwise patristic distances of the plants from the same cultivars were closer than those
from different cultivars. Further distances between off-type plants and the other plants of its kind were
observed (Table 2 and Table S3). Secondly, PCA was performed to investigate the genomic differences
of these plants. The first principal component explained 68.8% of the variance observed, while the first
two and three principal components explained 85.3% and 94.2% of the observed variances, respectively
(Figure 2b). From the 3D plot generated based on the first three principal components, ZH13 and
HD13 plants were grouped together, and the plants from the other varieties were grouped by their
respective cultivars (Figure 2b). ZH13-16 and HD13-3 were out of the groups and identified as off-type
plants. Finally, the stepwise kinship matrix was calculated based on the SNPs, and all the plants were
grouped into four subgroups. Except for ZH13 and HD13, plants from other cultivars were clustered
into their corresponding groups (Figure 2c) and ZH13-16 and HD13-3 show more distant kinship than
the other ZH13 and HD13 plants. Taken together, the plants from cv. ZH35, ZH68 and ZH18 were
clearly distinct between cultivars and showed a significant distinction with cultivars. However, plants
from ZH13 and HD13 showed no distinction from each other. The uniformity of cv. ZH35, ZH68 and
ZH18 are good at the genetic level and each of the cv. ZH13 and HD13 had an off-type plant.Genes 2020, 11, 175 7 of 18
Genes 2020, 11, 175 7 of 18
Figure
Figure 2. Identification
2. Identification of cultivar
of cultivar distinctness
distinctness of of five
five soybean
soybean cultivars
cultivars based
based ononthethe SNPs
SNPs discovered
discovered
byby SLAF-seq.
SLAF-seq. (a)(a)
TheThe phylogenetic
phylogenetic analysis.
analysis. White
White circles
circles represent
represent cv.cv. Hedou
Hedou 13 13 (HD13),
(HD13), black
black dots
dots
represent cv.Zhonghuang
representcv. Zhonghuang 13 (ZH13),
(ZH13),white
whitetriangles represent
triangles cv. Zhonghuang
represent cv. Zhonghuang 18 (ZH18), black triangles
18 (ZH18), black
represent
triangles cv. Zhonghuang
represent 68 (ZH68),
cv. Zhonghuang white diamonds
68 (ZH68), represent
white diamonds cv. Zhonghuang
represent 35 (ZH35);
cv. Zhonghuang (b) The
35 (ZH35);
principal component analysis. Red: HD13, blue: ZH13, orange: ZH18, purple:
(b) The principal component analysis. Red: HD13, blue: ZH13, orange: ZH18, purple: ZH68, black:ZH68, black: ZH35. The
grey The
ZH35. shadowgreyindicates
shadowthe cluster the
indicates of the cultivar;
cluster (c) Heatmap
of the cultivar; and dendrogram
(c) Heatmap andofdendrogram
a stepwise kinship
of a
matrix. kinship
stepwise Colors indicate
matrix. the cultivars:
Colors Red:
indicate theHD13, blue:Red:
cultivars: ZH13, orange:
HD13, ZH18,
blue: ZH13, purple:
orange:ZH68, black:
ZH18, ZH35.
purple:
ZH68, black: ZH35.Genes 2020, 11, 175 8 of 18
Table 2. The pairwise patristic distances of the plants from the same cultivars.
ZH13 HD13 ZH18 ZH68 ZH35 ZH13/HD13 1 ZH13-16/ZH13 2 HD13-3/HD13 3
Maximum 0.036 0.028 0.052 0.011 0.014 0.035 0.140 0.233
Minimum 0.010 0.006 0.009 0.002 0.006 0.006 0.123 0.221
Average 0.020 0.019 0.024 0.007 0.011 0.021 0.130 0.229
1 The pairwise patristic distances between the plants from ZH13 and HD13 without ZH13-16 and HD3-3. 2 The
pairwise patristic distances between ZH13-16 and the other plants from ZH13. 3 The pairwise patristic distances
between HD13-3 and the other plants from HD13.
3.2. Assessment of Distinctness and Uniformity of Soybean Cultivars based on SSR Markers
As SSR markers are the most commonly used molecular markers for the assessment of uniformity
of cultivars, we compared the effect of assessment of uniformity of cultivars using the methods based
on SLAF-seq and SSR markers. We used 42 SSR markers that have been previously reported for
distinguishing soybean cultivars and evaluating the purity of soybean seeds. There was at least one SSR
marker distributed on each chromosome (Figure 3a). The result of the phylogenetic analysis showed
four major groups (Figure 3b). The plants of cv. ZH13 and HD13 showed no distinction and were
clustered in the same group, namely the ZH13/HD13 cluster. Similar plants of the other cultivars were
clustered and the clusters were named by their cultivar name. In the ZH13/HD13 cluster, the HD13-3
plant was somewhat different in their clustering from the other plants and considered as off-type plants.
The PCA was performed using the genetic distance calculated from SSR markers. The first principal
component was able to explain 62.4% of the variance. The first two components explained 75.6% of the
variance and the first three components explained 90.3% of the variance. From the PCA 3D plot, all
the plants were clustered into four different clusters (Figure 3c). ZH13 and HD13 plants showed no
distinction and were located in the same cluster. HD13-3 plant was far from the ZH13/HD13 cluster,
which is consistent with the result of the phylogenetic analysis. However, ZH13-16 was not identified
as an off-type plant in the SSR results. Taken together, both SLAF-seq and SSR marker methods are
able to distinguish the cultivars and identify HD13-3 as an off-type plant; nevertheless, the SSR method
did not discover the off-type plant ZH13-16.Genes 2020, 11, 175 9 of 18
Genes 2020, 11, 175 9 of 18
Figure3.3.Identification
Figure Identificationof of five
five soybean
soybean cultivars
cultivars based on the polymorphism
polymorphism of of SSR
SSR markers.
markers.(a)(a)The
The
distributionof
distribution ofSSR
SSRmarkers
markers in in soybean
soybean chromosomes; (b) (b) The
Thephylogenetic
phylogenetictree treeofofall
allsoybean
soybeanplants.
plants.
Whitecircles
White circlesrepresent
representcv. cv.Hedou
Hedou13 13 (HD13),
(HD13), black dots represent cv. Zhonghuang
Zhonghuang 13 13(ZH13),
(ZH13),white
white
trianglesrepresent
triangles representcv.cv. Zhonghuang
Zhonghuang 18 18 (ZH18),
(ZH18), black
black triangles
triangles represent
represent cv. Zhonghuang
cv. Zhonghuang 68 (ZH68),
68 (ZH68), white
diamonds represent cv. Zhonghuang 35 (ZH35); (c) The principal component analysis. Red: HD13,Red:
white diamonds represent cv. Zhonghuang 35 (ZH35); (c) The principal component analysis. blue:
HD13,orange:
ZH13, blue: ZH13,
ZH18,orange:
purple:ZH18,
ZH68,purple: ZH68, black:
black: ZH35. The greyZH35. The
circle grey circle
indicates indicates
the cluster of the cultivar.
cluster of
the cultivar.Genes 2020, 11, 175 10 of 18
3.3. The SNP Number Affects Efficiency of Assessment of Distinctness and Uniformity of Cultivars
The density of molecular markers directly impacts the assessment of the distinctness and uniformity
of cultivars. The 21,415 polymorphic SNPs discovered were used to construct a detailed fingerprint for
the five soybean cultivars to assess the distinctness and uniformity of the five cultivars. The number of
SNPs called from SLAF-seq normally depends on the restriction enzyme selection, sequencing depth,
and the genomic variation of cultivars. The increase in similarity level of cultivars will decrease the
amount of identified SNPs, and thereby the efficiency of assessment of distinctness and uniformity.
Based on this reason, we decreased the numbers of SNPs randomly to simulate the estimation of
distinctness and uniformity of the cultivars with high similarities. We randomly selected 10,000,
5000, 1000 and 500 SNPs from the 21,415 SNPs using R project. The selected SNPs were used for the
construction of the Neighbor-Joining phylogenetic tree to evaluate the genetic variation of individual
plants using three replications. We found the number of SNPs indeed affected the structure of the
phylogenetic tree, while the plants from the same cultivar still clustered into their corresponding
cluster. The phylogenetic trees constructed by 10,000 and 5000 SNPs showed a high similarity of
structure compared to those constructed by 21,415 SNPs (Figure 4a,b). With the decreasing SNP
number, the structure of the phylogenetic tree changed for the genetic distances of ZH35, ZH18 and
ZH68 groups (Figure 4c,d). When the SNP number was decreased to 500, the genetic distance between
ZH35 and ZH68 branches declined to the shortest (Figure 4d), suggesting that this SNP number may
be a threshold for the effective construction of the phylogenetic tree. However, the distinction between
cv. ZH13, ZH35, ZH18 and ZH68 was still reliable when the number of SNP was decreased to 500.Genes 2020, 11, 175 11 of 18
Genes 2020, 11, 175 11 of 18
Figure
Figure 4. 4.
TheThe phylogeneticanalysis
phylogenetic analysisof
ofthe
the five soybean cultivars
cultivarsusing
usingthe
thedecreasing
decreasingnumber
numberof of
SNPs
SNPs
randomly picked from all the SNPs identified by SLAF-seq. (a) 10,000 SNPs; (b) 5000 SNPs;
randomly picked from all the SNPs identified by SLAF-seq. (a) 10,000 SNPs; (b) 5000 SNPs; (c) 1000 (c) 1000
SNPs;
SNPs; (d)(d)
500500 SNPs.
SNPs.
3.4.The
Assessment
off-type of Genetic
plants, Purity for
ZH13-16 Soybean
and HD13-3,Cultivars Using
were able toSLAF-seq
be identified in all the conditions. ZH13-16
was located
The genetic purity of each cultivar was analyzed basedthe
in the branch containing ZH13 and HD13 in all on conditions.
SNP markersHD13-3 was by
discovered grouped
SLAF- in
theseq,
same branch containing ZH13 and HD13 plants in the phylogenetic tree constructed
which provides more informative features than SSR markers. Here, we assessed the purity by 10,000,
of
5000 and 500 SNPs, but was grouped into the branch containing ZH18, ZH68 and ZH35.
each cultivar by the ratio of homozygous loci to all the loci discovered by the SLAF-seq approach Nevertheless,
in the phylogenetic
(Table tree onlypossessed
3). All the cultivars constructed by 1000
a high ratioSNPs, HD13-3 was
of homozygous locidiscriminated as an off-type
ranging from 91.89% plant
to 93.96%.
in all of the
Plants conditions.
from ZH68 hadThe the result
highestobtained showed
purity level fromthat the to
91.36% assessment
96.25%, andof distinctness and uniformity
plants from ZH18 had the
of cultivars usinglevel
lowest purity SLAF-seq
rangingtechnology
from 91.38% is very robustIntriguingly,
to 93.19%. and reliablesome
even loci
withalways
a low number
retain theofsame
SNPs.
heterozygous status in the individual plants within the cultivar. As shown in Table 4, the number of
heterozygous loci ranged from 36 in ZH68 to 50 in ZH18. There was the presence of some
heterozygous loci among the plants from different cultivars. The loci position of 2,540,914 inGenes 2020, 11, 175 12 of 18
3.4. Assessment of Genetic Purity for Soybean Cultivars Using SLAF-seq
The genetic purity of each cultivar was analyzed based on SNP markers discovered by SLAF-seq,
which provides more informative features than SSR markers. Here, we assessed the purity of each
cultivar by the ratio of homozygous loci to all the loci discovered by the SLAF-seq approach (Table 3).
All the cultivars possessed a high ratio of homozygous loci ranging from 91.89% to 93.96%. Plants from
ZH68 had the highest purity level from 91.36% to 96.25%, and plants from ZH18 had the lowest purity
level ranging from 91.38% to 93.19%. Intriguingly, some loci always retain the same heterozygous
status in the individual plants within the cultivar. As shown in Table 4, the number of heterozygous
loci ranged from 36 in ZH68 to 50 in ZH18. There was the presence of some heterozygous loci among
the plants from different cultivars. The loci position of 2,540,914 in chromosome 1 was heterozygous in
all the cultivars except ZH35. As the plants tested here were randomly selected, the probability of
maintaining heterozygosity at the same locus in tens of plants should be extremely low, which implies
that this phenomenon may not be accidental.
Table 3. The purity of five soybean cultivars based on SLAF-seq.
Cultivar Purity (%) Min (%) Max (%) Std. * (%)
HD13 92.44 91.32 94.58 0.96
ZH13 92.55 91.24 94.41 1.02
ZH18 91.89 91.38 93.19 0.44
ZH68 93.36 91.36 96.25 1.09
ZH35 92.53 92.32 95.50 1.12
* Std. represented for standard deviation.
Table 4. The number of same heterozygous loci between two different soybean cultivars based
on SLAF-seq.
Cultivar HD13 ZH13 ZH18 ZH68 ZH35
HD13 38
ZH13 21 48
ZH18 7 8 50
ZH68 3 10 24 36
ZH35 7 5 12 16 46
3.5. The Application of SLAF-seq Technology for the Assessment of the Distinctness in 150 Soybean Cultivars
To validate the reliability of the SLAF-seq method in the assessment of soybean cultivars, the
SLAF-seq data of 150 soybean cultivars were used to assess the effect of SLAF-seq on differentiating
soybean cultivars. The dataset consists of 36,976 SNPs and was used for the further assessment of
the SLAF-seq approach for cultivar distinction. The neighbor-joint phylogenetic tree was constructed
(Figure 5 and Table S4) and the soybean cultivars with close latitudes were clustered together. The
cultivars from Europe (other European countries apart from Russia), Japan, Nigeria and Russia were
clearly distinct. The European and Russian cultivars were more closely related. The pairwise patristic
distances were calculated for the soybean cultivars (Table S4) and the closest patristic distance (0.105)
was found between the cultivars Harosoy and Amsoy and the largest distance (0.508) was found
between cultivars TF8 and Jheidou. The results showed that the 36,976 SNP markers were able to outline
the distinction among the 150 soybean cultivars, which shows the robustness of SLAF-seq technology.Genes 2020, 11, 175 13 of 18
Genes 2020, 11, 175 13 of 18
Figure
Figure 5. The
5. The phylogenetic
phylogenetic tree
tree forfor 150
150 soybeancultivars.
soybean cultivars.The
Thebranch
branchcolours
coloursrepresent
represent the
the countries
countries of
of origin.
origin. The cultivation
The cultivation regionsregions are represented
are represented by different
by different symbolssymbols
of the of the branches:
branches: the triangle
the solid solid
triangle represents
represents Northern
Northern Region of Region of China
China (NR), the(NR),
solid the solid
circle circle represents
represents Huanghuaihai
Huanghuaihai Region Region
of China
of China
(HR), (HR),square
the solid the solid square represents
represents SouthernSouthern Region
Region (SR) (SR) of and
of China Chinatheand the square
square with awith a cross
cross inside
inside represents other regions (the regions are out of China). The latitudes of the origins
represents other regions (the regions are out of China). The latitudes of the origins of cultivars are of cultivars
are indicated
indicated by theby thein
ring ring
theinouter
the outer
layer,layer, anddiverse
and the the diverse colours
colours represent
represent thethe latitude
latitude degrees
degrees (◦ ).(°).
4. Discussion
4. Discussion
The identification
The identificationofofcultivars
cultivars plays
plays anan important
important rolerole in
in the
themodern
modernagriculture
agriculture industry.
industry.
Morphological
Morphological and
and geneticmarkers
genetic markershavehavebeen
been applied
applied to define
define and
anddistinguish
distinguishcultivars.
cultivars.InIn
recent
recent
years,
years, DUSDUS testing
testing basedon
based onmorphological
morphological descriptors
descriptors is
is compulsory
compulsoryininthe theprocess
processofofregistering
registering
newnew cultivars,
cultivars, andandDUSDUStesting
testingbased
basedon onmolecular
molecular markers
markers is is optional.
optional.However,
However,some somecultivars
cultivars
have narrow genetic backgrounds, which may lead to a lack of proper identificationindex
have narrow genetic backgrounds, which may lead to a lack of proper identification index using
using
morphologicaldescriptors
morphological descriptorsonly.
only.Therefore,
Therefore, molecular
molecular markers
markersare areneeded
neededtotodistinguish
distinguishbetween
between
such
such similar
similar cultivars.Among
cultivars. Amongall allthe
themolecular
molecular markers,
markers, SNP—which
SNP—whichisisthe themost
mostabundant
abundant in in
thethe
genome—can be identified in a high-throughput scale and is considered as an
genome—can be identified in a high-throughput scale and is considered as an ideal molecular marker. ideal molecular
marker. In this study, we aimed to establish an effective and easy molecular method for DUS testing
In this study, we aimed to establish an effective and easy molecular method for DUS testing in soybean
in soybean by using SLAF-seq for the high-throughput discovery of SNPs.
by using SLAF-seq for the high-throughput discovery of SNPs.
SNPs have more abundant and stable genomic variations than other molecular markers, and
SNPs have more abundant and stable genomic variations than other molecular markers, and
with the development of SNP identification progresses, more and more studies have been discussing
with the development of SNP identification progresses, more and more studies have been discussing
the possibility of applying SNP markers in DUS testing of important crops, such as in wheat, maize,
thebarley
possibility of applying
and alfalfa SNP
[4,44–46]. markers
Here, firstly,inwe
DUS testing
applied of important
SLAF-seq crops,SNPs
to discover suchfor
as the
in wheat, maize,
assessment
barley
of the distinctness of five soybean cultivars after which we further tested the approach on 150 of
and alfalfa [4,44–46]. Here, firstly, we applied SLAF-seq to discover SNPs for the assessment
the distinctness of five soybean cultivars after which we further tested the approach on 150 cultivarsGenes 2020, 11, 175 14 of 18
using SNP data from a GWAS study [6]. In the analysis of the five soybean cultivars, the phylogenetic
analysis shows that all cultivars were able to be clearly distinguished. The genetic distance between
the two closest varieties was 0.105, which was much further than the genetic distance of the plants
from the same cultivars (0.002 ~ 0.052, Table 2), indicating that SLAF-seq has the ability to distinguish
between different varieties. Additionally, two direct relatives—cv. ZH18 and ZH68—were able to be
distinguished by SLAF-seq. Cultivar ZH68 was developed by ICS, CAAS through the crossing of cv.
ZH18 and Karikoi-434. Although the two cultivars have high similarity in their genetic background
(Figures 1b and 3a), they were still able to be distinguished completely using SLAF seq. However, cv.
ZH13 and HD13, which share a common parent cv. Yudou 8, were not able to be distinguished by
the phylogenetic tree, PCA, or kinship analysis using both SSR and SNP markers (Figures 2 and 3).
The SNPs identified in this study were distributed in all the 20 chromosomes of soybean, and the
distance between adjacent markers of most SNPs was below 150 kb. The density of SNP markers
was far more than of any of the conventional markers; however, no genetic difference was discovered
between cv. ZH13 and HD13. Therefore, our results suggest that cv. ZH13 and HD13 possibly belong
to the same cultivar.
The number of cultivars with high similarity has a greater impact on the identification of varieties.
Therefore, it is suggested to set thresholds for differences within and between cultivars by increasing
the number of repeats per variety when the cultivars with high similarity were subjected to being
identified. Additionally, SLAF-seq is able to provide more precise fingerprints for cultivars and leads
to increasing consideration in lawsuits based upon cultivar infringement.
Although the sequencing methods based on both SLAF-seq and SSR markers showed clear cultivar
distinction, they had different effects in the assessment of the cultivar uniformity. The SLAF-seq method
showed that ZH13-6 and HD13-3 were off-type plants and the SSR method showed that HD13-3 was
off-type plants. Because the marker density of the SLAF-sequencing method was much higher than
that of the SSR method, the off-type plants identified by the SLAF-sequencing method may have an
extensive difference at the genome-wide level. The SSR method was limited by the marker number,
and the detected SSR markers may have a variant in the off-type plants, leading to misjudgment. This
misclassification may also be attributable to the possibility of error in alignment because of the low
number of SSR markers. The results indicated that the SLAF-seq method was able to show more
distinction among the cultivars, even for cultivars with close genetic backgrounds.
The amount of SNPs discovered by SLAF sequencing depends on many factors, such as restriction
enzyme selection, depth of sequencing, and genomic variation among the tested cultivars. Previously,
SLAF-seq was used in GWAS for soybean cyst nematode resistance in soybean, which led to the
identification of 36,976 and 33,194 SNPs from 440 and 200 diverse soybean accessions, respectively [27,47].
Both of the two types of research used MseI and HaeIII and collected fragments in size of 300–500 bp for
sequencing, and the number of SNPs is about 10% more in the 440 accessions than the 200 accessions. In
a recombinant inbred population, EcoRI and MseI were used for the construction of SLAF and 116,216
SLAFs were discovered, of which 9948 SNPs were polymorphic and were used for the construction of a
high-density genetic map in soybean [26]. In the present study, even with the low number of cultivars,
we were able to identify 21,415 polymorphic SNPs which were in close comparison to the above studies.
This shows that the number of SNPs is likely to not be affected by the number of accessions, but by
other factors such as restriction enzymes, genomic variation and depth of sequencing. Furthermore,
in order to investigate the effect of decreasing the number of SNPs on the efficiency of assessment of
cultivar distinctness and uniformity, we reduced the number of SNPs to 10,000, 5000, 1000 and 500 and
simulated the situation that the cultivars with high similarity were identified. With the decrease in
the number of SNPs up to 500, the cultivars still showed clear distinction and off-type plants were
clearly differentiated. This further indicates the robustness of the SLAF-seq method in the assessment
of cultivar distinctness and uniformity.
The purity level reflects the ability to maintain the stability of cultivar characteristics, and usually,
every percentage of purity of soybean cultivars resulted in the 450 kg yield loss per hectare [32]. Here,Genes 2020, 11, 175 15 of 18
the proportion of homozygous loci was applied to access the purity level of five cultivars based on the
SLAF-seq approach. The purity level of each cultivar was above 90%. Most of the approved soybean
cultivars are high-generation strains developed through at least six consecutive selfings. Therefore, in
theory, the homozygous ratio should be over 90%, which shows an agreement with our result. ZH13 is
an elite soybean cultivar with high yield and wide adaptability and has popularized over 6.7 million
hectares of land as of 2018 in China. The high purity of cultivar ZH13 contributed to the retention of its
excellent characteristics, which ensures its cultivation in large areas for about 20 years. Although the
cultivars used in this study had above 90% level of purity, the individual plants from each cultivar
exhibited different purities. For example, ZH68 has the widest range of purities from 91.36–96.26% in
the tested cultivars. To obtain higher purified cultivars, further selection should be done to purify the
genetic background of cultivars. Additionally, we also found an interesting phenomenon that some
loci exhibit the same heterozygous status in all the plants within cultivar and among various cultivars,
despite the fact that these cultivars have been cultivated for more than 15 years. This phenomenon
has been observed by the previous researches in soybean and Arabidopsis [48,49]. To some extent,
the stable heterozygous loci presented in all lines may reflect the high purity and stability of these
cultivars as well as the robustness of our approach.
To further validate the applicability of the SLAF-seq approach for distinctness testing, we used SNP
information of 150 soybean cultivars with different origins [6]. The phylogenetic tree analysis showed a
distinction among the cultivars based on their different origins. The cultivars from China showed a very
good differentiation when compared to the North American cultivars. This may be attributed to the
exchange of genetic materials between both countries, and the same cultivar may have been recorded
with different origins because sometimes the germplasms were not always accompanied by the proper
documentation. The cultivars originating from China were also distinguished into their respective
regions (HR, NR and SR). The cultivars from SR in China were clearly distinct, while the majority of
the accessions from HR and NR also showed clear differentiation, with few cultivars interspersed in
both regions. This may also be attributed to an error in the documentation of cultivar information. In a
DNA fingerprinting study for the identification of pineapple germplasms using SNP markers [40], they
also observed genetic redundancy and the erroneous documentation of germplasms which led to some
misclassifications of some germplasms. Therefore, proper documentation is needed in germplasm
collections in order to reduce genetic redundancy and misclassification, and such misclassification can
only be detected through the application of a molecular approach as demonstrated in the present study.
Consistent with the results obtained from the five cultivars, the SLAF-seq approach was demonstrated
to be a reliable technique for distinctness testing among soybean cultivars.
The cost involved in the application of technology is very important and should be considered
before deploying such technology. In the current study, the costs of SLAF-seq and SSR methods
were roughly 67 RMB ($9.66) and 48 RMB ($6.92) per sample, respectively. Although the costs of
SLAF-seq were higher than the SSR method, SLAF-seq was able to provide more accurate and abundant
information than the SSR method which makes it worthwhile. Moreover, with the development
of SLAF-seq, its cost will be gradually decreased in the future research.In general, SLAF-seq has a
promising application in DUS testing.
5. Conclusions
Taken together, the SLAF-seq approach can be reliably used to complement existing DUS testing
based on morphological descriptors in soybean, and this approach has proven to be an accurate
method compared to other methods. Our results suggest that the SLAF-seq approach is robust in
distinguishing different soybean cultivars and also accurate in assessing the uniformity and purity of
soybean cultivars.
Supplementary Materials: The following are available online at http://www.mdpi.com/2073-4425/11/2/175/s1,
Table S1: The primer information of SSR markers; Table S2: The characteristics of polymorphic SNPs discovered by
SLAF sequencing; Table S3: The pairwise distances of 5 cultivars; Table S4: The pairwise distances of 150 cultivars.Genes 2020, 11, 175 16 of 18
Author Contributions: Conceptualization, S.Z., B.L., and J.S.; methodology, S.Z. and H.Z.; formal analysis, S.Z.;
investigation, Y.C. and B.L.; data curation, S.Z. and H.Z.; writing—original draft preparation, S.Z.; writing—review
and editing, A.S.S, B.L., and J.S.; visualization, S.Z.; supervision, B.L. and J.S.; project administration, J.S.; funding
acquisition, B.L. and J.S. All authors have read and agreed to the published version of the manuscript.
Funding: This study was funded by the Ministry of Science and Technology of China, grant number
2017YFD0101401, 2016YFD0100504, and 2016YFD0100201, National Science and Technology Major Project
of China, grant number 2016ZX08004-003, National Natural Science Foundation of China, grant number No.
31671716, and the Chinese Academy of Agricultural Sciences (CAAS) Agricultural Science and Technology
Innovation Project.
Acknowledgments: We thank Yingpeng Han from Northeast Agricultural University for providing the SNP
information used in this study.
Conflicts of Interest: The authors report that there is no conflict of interest.
Abbreviations
Specific-locus amplified fragment SLAF
distinctness, uniformity and stability DUS
principal component analysis PCA
International Union for the Protection of New Varieties of Plants UPOV
fragment length polymorphisms RFLP
random amplified polymorphic DNA RAPD
simple sequence repeat SSR
inter-simple sequence repeat ISSR
single nucleotide polymorphism SNP
amplified fragment length polymorphisms AFLP
reduced representation library RRL
References
1. Sohn, H.B.; Kim, S.J.; Hwang, T.Y.; Park, H.M.; Lee, Y.Y.; Markkandan, K.; Lee, D.; Lee, S.; Hong, S.Y.;
Song, Y.H.; et al. Barcode system for genetic identification of soybean [Glycine max (L.) Merrill] cultivars
using inDel markers specific to dense variation blocks. Front. Plant Sci. 2017, 8, 520–531. [CrossRef]
2. Song, Q.; Quigley, C.; Nelson, R.; Carter, T.; Boerma, H.; Strachan, J.; Cregan, P. A selected set of trinucleotide
simple sequence repeat markers for soybean cultivar identification. Plant Var. Seeds 1999, 12, 207–220.
3. Bonow, S.; Von Pinho, E.V.; Vieira, M.G.; Vosman, B. Microsatellite markers in and around rice genes:
Applications in variety identification and DUS testing. Crop Sci. 2009, 49, 880–886. [CrossRef]
4. Tian, H.; Wang, F.; Zhao, J.; Yi, H.; Wang, L.; Wang, R.; Yang, Y.; Song, W. Development of maizeSNP3072, a
high-throughput compatible SNP array, for DNA fingerprinting identification of Chinese maize varieties.
Mol. Breed. 2015, 35, 136–146. [CrossRef] [PubMed]
5. Tommasini, L.; Batley, J.; Arnold, G.; Cooke, R.; Donini, P.; Lee, D.; Law, J.; Lowe, C.; Moule, C.; Trick, M.; et al.
The development of multiplex simple sequence repeat (SSR) markers to complement distinctness, uniformity
and stability testing of rape (Brassica napus L.) varieties. Theor. Appl. Genet. 2003, 106, 1091–1101. [CrossRef]
[PubMed]
6. Jamali, S.H.; Cockram, J.; Hickey, L.T. Insights into deployment of DNA markers in plant variety protection
and registration. Theor. Appl. Genet. 2019, 132, 1911–1929. [CrossRef] [PubMed]
7. Jördens, R. Progress of plant variety protection based on the International Convention for the Protection of
New Varieties of Plants (UPOV Convention). World Pat. Inf. 2005, 27, 232–243. [CrossRef]
8. Morell, M.; Peakall, R.; Appels, R.; Preston, L.; Lloyd, H. DNA profiling techniques for plant variety
identification. Aust. J. Exp. Agric. 1995, 35, 807–819. [CrossRef]
9. Choudhury, P.R.; Kohli, S.; Srinivasan, K.; Mohapatra, T.; Sharma, R.P. Identification and classification of
aromatic rices based on DNA fingerprinting. Euphytica 2001, 118, 243–251. [CrossRef]
10. Geleta, N.; Labuschagne, M.T.; Viljoen, C.D. Genetic diversity analysis in sorghum germplasm as estimated
by AFLP, SSR and morpho-agronomical markers. Biodivers. Conserv. 2006, 15, 3251–3265. [CrossRef]Genes 2020, 11, 175 17 of 18
11. Congiu, L.; Chicca, M.; Cella, R.; Rossi, R.; Bernacchia, G. The use of random amplified polymorphic
DNA (RAPD) markers to identify strawberry varieties: a forensic application. Mol. Ecol. 2000, 9, 229–232.
[CrossRef] [PubMed]
12. Lai, K.; Lorenc, M.T.; Edwards, D. Molecular marker databases. In Plant Genotyping: Methods and Protocols;
Batley, J., Ed.; Springer New York: New York, NY, USA, 2015; pp. 49–62. [CrossRef]
13. Tanksley, S.D.; Young, N.D.; Paterson, A.H.; Bonierbale, M.W. RFLP mapping in plant breeding: new tools
for an old science. Bio/Technology 1989, 7, 257–264. [CrossRef]
14. Welsh, J.; McClelland, M. Fingerprinting genomes using PCR with arbitrary primers. Nucleic Acids Res. 1990,
18, 7213–7218. [CrossRef] [PubMed]
15. Williams, J.G.K.; Kubelik, A.R.; Livak, K.J.; Rafalski, J.A.; Tingey, S.V. DNA polymorphisms amplified by
arbitrary primers are useful as genetic markers. Nucleic Acids Res. 1990, 18, 6531–6535. [CrossRef] [PubMed]
16. Lynch, M.; Milligan, B.G. Analysis of population genetic structure with RAPD markers. Mol. Ecol. 1994, 3,
91–99. [CrossRef] [PubMed]
17. Jeffreys, A.J. Hypervariable minisatellite regions in human DNA. Nature 1985, 314, 67–73. [CrossRef]
18. Akkaya, M.S.; Bhagwat, A.A.; Cregan, P.B. Length polymorphisms of simple sequence repeat DNA in
soybean. Genetics 1992, 132, 1131–1139.
19. Pradeep Reddy, M.; Sarla, N.; Siddiq, E.A. Inter simple sequence repeat (ISSR) polymorphism and its
application in plant breeding. Euphytica 2002, 128, 9–17. [CrossRef]
20. Jorde, L.B. Linkage disequilibrium and the search for complex disease genes. Genome Res. 2000, 10, 1435–1444.
[CrossRef]
21. Goldstein, D.B. Islands of linkage disequilibrium. Nat. Genet. 2001, 29, 109–111. [CrossRef]
22. Sachidanandam, R.; Weissman, D.; Schmidt, S.C.; Kakol, J.M.; Stein, L.D.; Marth, G.; Sherry, S.; Mullikin, J.C.;
Mortimore, B.J.; Willey, D.L.; et al. A map of human genome sequence variation containing 1.42 million
single nucleotide polymorphisms. Nature 2001, 409, 928–933. [CrossRef] [PubMed]
23. Davey, J.W.; Hohenlohe, P.A.; Etter, P.D.; Boone, J.Q.; Catchen, J.M.; Blaxter, M.L. Genome-wide genetic
marker discovery and genotyping using next-generation sequencing. Nat. Rev. Genet. 2011, 12, 499–510.
[CrossRef] [PubMed]
24. Elshire, R.J.; Glaubitz, J.C.; Sun, Q.; Poland, J.A.; Kawamoto, K.; Buckler, E.S.; Mitchell, S.E. A robust, simple
genotyping-by-sequencing (GBS) approach for high diversity species. PLoS One 2011, 6, e19379. [CrossRef]
25. Sims, D.; Sudbery, I.; Ilott, N.; Heger, A.; Ponting, C. Sequencing depth and coverage: key considerations in
genomic analyses. Nat. Rev. Genet. 2014, 15, 121–132. [CrossRef] [PubMed]
26. Li, B.; Tian, L.; Zhang, J.; Huang, L.; Han, F.; Yan, S.; Wang, L.; Zheng, H.; Sun, J. Construction of a high-density
genetic map based on large-scale markers developed by specific length amplified fragment sequencing
(SLAF-seq) and its application to QTL analysis for isoflavone content in Glycine max. BMC Genom. 2014, 15,
1086–1101. [CrossRef]
27. Han, Y.; Zhao, X.; Cao, G.; Wang, Y.; Li, Y.; Liu, D.; Teng, W.; Zhang, Z.; Li, D.; Qiu, L.; et al. Genetic
characteristics of soybean resistance to HG type 0 and HG type 1.2.3.5.7 of the cyst nematode analyzed by
genome-wide association mapping. BMC Genom. 2015, 16, 598–608. [CrossRef]
28. Zhang, X.; Wang, G.; Chen, B.; Du, H.; Zhang, F.; Zhang, H.; Wang, Q.; Geng, S. Candidate genes for
first flower node identified in pepper using combined SLAF-seq and BSA. PLoS ONE 2018, 13, e0194071.
[CrossRef]
29. Zhang, S.; Wang, H.; Wang, Z.; Ren, Y.; Niu, L.; Liu, J.; Liu, B. Photoperiodism dynamics during the
domestication and improvement of soybean. Sci. China Life Sci. 2017, 60, 1416–1427. [CrossRef]
30. International Union for the Protection of New Varieties of Plants. Guidance on the Use of Biochemical and
Molecular Markers in the Examination of Distinctness, Uniformity and Stability (DUS). Available online:
http://www.upov.int/edocs/tgpdocs/en/tgp_15.pdf (accessed on 1 November 2019).
31. Sun, X.; Liu, D.; Zhang, X.; Li, W.; Liu, H.; Hong, W.; Jiang, C.; Guan, N.; Ma, C.; Zeng, H.; et al. SLAF-seq: An
efficient method of large-scale De Novo SNP discovery and genotyping using high-throughput sequencing.
PLoS ONE 2013, 8, e58700. [CrossRef]
32. Guan, R.; Fang, H.; He, Y.; Chang, R.; Qiu, L. Molecular homozygosity of soybean varieties (lines) in regional
test of China by using SSR markers. Acta Agron. Sin. 2012, 38, 1760–1765. [CrossRef]
33. Li, H.; Durbin, R. Fast and accurate short read alignment with Burrows-Wheeler transform. Bioinformatics
(Oxford, England) 2009, 25, 1754–1760. [CrossRef] [PubMed]Genes 2020, 11, 175 18 of 18
34. Li, H.; Durbin, R. Fast and accurate long-read alignment with Burrows-Wheeler transform. Bioinformatics
(Oxford, England) 2010, 26, 589–595. [CrossRef] [PubMed]
35. McKenna, A.; Hanna, M.; Banks, E.; Sivachenko, A.; Cibulskis, K.; Kernytsky, A.; Garimella, K.; Altshuler, D.;
Gabriel, S.; Daly, M.; et al. The Genome Analysis Toolkit: a MapReduce framework for analyzing
next-generation DNA sequencing data. Genome Res. 2010, 20, 1297–1303. [CrossRef] [PubMed]
36. Li, H.; Handsaker, B.; Wysoker, A.; Fennell, T.; Ruan, J.; Homer, N.; Marth, G.; Abecasis, G.; Durbin, R.;
Genome Project Data Processing, S. The Sequence Alignment/Map format and SAMtools. Bioinformatics
(Oxford, England) 2009, 25, 2078–2079. [CrossRef] [PubMed]
37. Li, H. A statistical framework for SNP calling, mutation discovery, association mapping and population
genetical parameter estimation from sequencing data. Bioinformatics (Oxford, England) 2011, 27, 2987–2993.
[CrossRef] [PubMed]
38. Tamura, K.; Nei, M.; Kumar, S. Prospects for inferring very large phylogenies by using the neighbor-joining
method. Proc. Natl. Acad. Sci. USA 2004, 101, 11030–11035. [CrossRef] [PubMed]
39. Kumar, S.; Stecher, G.; Li, M.; Knyaz, C.; Tamura, K. MEGA X: molecular evolutionary genetics Analysis
across computing platforms. Mol. Biol. Evol. 2018, 35, 1547–1549. [CrossRef]
40. Tamura, K.; Stecher, G.; Peterson, D.; Filipski, A.; Kumar, S. MEGA6: molecular evolutionary genetics
analysis version 6.0. Mol. Biol. Evol. 2013, 30, 2725–2729. [CrossRef]
41. Yu, G.; Smith, D.; Zhu, H.; Guan, Y.; Lam, T. ggtree: an R package for visualization and annotation of
phylogenetic trees with their covariates and other associated data. Methods Ecol. Evol. 2017, 8, 28–36.
[CrossRef]
42. Yu, G.; Lam, T.; Zhu, H.; Guan, Y. Two methods for mapping and visualizing associated data on phylogeny
using ggtree. Mol. Biol. Evol. 2018, 35, 3041–3043. [CrossRef]
43. Lipka, A.; Tian, F.; Wang, Q.; Peiffer, J.; Li, M.; Bradbury, P.; Gore, M.; Buckler, E.; Zhang, Z. GAPIT: genome
association and prediction integrated tool. Bioinformatics (Oxford, England) 2012, 28, 2397–2399. [CrossRef]
[PubMed]
44. Gao, L.; Jia, J.; Kong, X. A SNP-based molecular barcode for characterization of common wheat. PloS ONE
2016, 11, e0150947. [CrossRef] [PubMed]
45. Cockram, J.; Jones, H.; Norris, C.; O’Sullivan, D. Evaluation of diagnostic molecular markers for DUS
phenotypic assessment in the cereal crop, barley (Hordeum vulgare ssp. vulgare L.). Theor. Appl. Genet. 2012,
125, 1735–1749. [CrossRef] [PubMed]
46. Annicchiarico, P.; Nazzicari, N.; Ananta, A.; Carelli, M.; Wei, Y.; Brummer, C. Assessment of cultivar
distinctness in Alfalfa: A comparison of genotyping-by-sequencing, simple-sequence repeat marker, and
morphophysiological observations. Plant Genome 2016, 9, 1–12. [CrossRef]
47. Zhao, X.; Teng, W.; Li, Y.; Liu, D.; Cao, G.; Li, D.; Qiu, L.; Zheng, H.; Han, Y.; Li, W. Loci and candidate genes
conferring resistance to soybean cyst nematode HG type 2.5.7. BMC Genom. 2017, 18, 462. [CrossRef]
48. Bomblies, K.; Yant, L.; Laitinen, R.A.; Kim, S.-T.; Hollister, J.D.; Warthmann, N.; Fitz, J.; Weigel, D. Local-scale
patterns of genetic variability, outcrossing, and spatial structure in natural stands of Arabidopsis thaliana.
PLoS Gemet. 2010, 6, e1000890. [CrossRef]
49. Li, Y.H.; Zhou, G.; Ma, J.; Jiang, W.; Jin, L.G.; Zhang, Z.; Guo, Y.; Zhang, J.; Sui, Y.; Zheng, L.; et al. De novo
assembly of soybean wild relatives for pan-genome analysis of diversity and agronomic traits. Nat. Biotechnol.
2014, 32, 1045–1052. [CrossRef]
© 2020 by the authors. Licensee MDPI, Basel, Switzerland. This article is an open access
article distributed under the terms and conditions of the Creative Commons Attribution
(CC BY) license (http://creativecommons.org/licenses/by/4.0/).You can also read