North Atlantic Hurricane Winds in Warmer than Normal Seas - MDPI
←
→
Page content transcription
If your browser does not render page correctly, please read the page content below
atmosphere
Article
North Atlantic Hurricane Winds in Warmer
than Normal Seas
Jill C. Trepanier
 227 Howe-Russell Geoscience Complex, Geography and Anthropology, Louisiana State University, Baton Rouge,
 LO 70803, USA; jtrepa3@lsu.edu

 Received: 19 December 2019; Accepted: 12 March 2020; Published: 16 March 2020

 Abstract: Tropical cyclones devastate coastlines around the world. The United States and surrounding
 areas experienced catastrophic extreme events in recent hurricane seasons. Understanding extreme
 hurricanes and how they change in a warming ocean environment is of the utmost importance.
 This study makes use of the historical, positive relationship between average summer sea surface
 temperatures (SSTs) and maximum hurricane wind speeds across the North Atlantic Basin from
 1854–2018. Geographically weighted regression shows how the relationship between hurricane winds
 and SSTs varies across space. Each localized slope is used to increase historical wind speeds to
 represent winds in a three-degree Celsius warmer-than-average sea surface. The winds are then used
 to estimate the maximum intensity of the thirty-year hurricane (one with a 3.3% annual probability
 of occurrence) across the hexagonal grid using extreme value statistics. Viewing the results spatially
 allows for geographic patterns to emerge in the overall risk of major hurricane occurrence in warm
 SST environments. This study showcases the difference in the historical extreme compared to
 the potential future extreme in the hopes to better inform those charged with making important,
 life-saving decisions along the U.S. and neighboring coasts.

 Keywords: tropical cyclones; climate change; risk; spatial statistics

1. Introduction
      Harrowing winds, torrential downpours, and rising storm surges are all characteristics of the
extreme hurricane, the tropical tempest designed to transfer massive amounts of energy from our
planet’s equator to the poles. Millions of people around the globe feel the effect of these impressive
phenomena as they barrel through oceanscapes, often striking land with fierce repercussions. In 2017
and 2018, only five events, i.e., Hurricanes Harvey, Irma, Maria, Florence, and Michael, took the
souls of nearly 3500 people throughout the Caribbean Islands and the United States’ Gulf and East
coasts [1–4].
      Hurricane Harvey ranks second only to Hurricane Katrina for the costliest hurricane to ever strike
the United States, causing an estimated $125 billion in damage [5]. Hurricanes Maria and Irma rank
third and fifth in the list at $90 and $50 billion, respectively [5]. There are a wide variety of reasons
why damage amounts are so high and why death tolls are so catastrophic, and one reason is because
more people live in harm’s way along the coasts, with over three times as many people living along
coastlines compared to the global average [6]. Many of the fastest growing urban areas around the
world are located on or near coastal zones [7,8], presenting a growing risk to and heightened costs from
the adverse effects of extreme hurricanes. A notion plaguing the tropical cyclone research community
offers another potential reason the costs are increasing: changing hurricane frequency and intensity.
      Hurricane scientists around the world have been attempting to assess the frequency and intensity
of hurricanes in a changing climate for over three decades [9–12]. The approaches to gain insight into
this include empirical [13], numerical [14,15], and statistical [16,17], all having their rightful place in

Atmosphere 2020, 11, 293; doi:10.3390/atmos11030293                       www.mdpi.com/journal/atmosphere
Atmosphere 2020, 11, 293                                                                             2 of 15

the pursuit of understanding. The models show some disagreement due to varying approaches, but
strong influences on the variability of hurricanes from multi-decadal and interannual forces, such
as the Altantic Multidecadal Oscillation [18] and the El Niño Southern Oscillation [19], are generally
agreed upon. They show general agreement because the basic physics of hurricane development
focuses on the importance of heat in the intensification of the system [20]. Many of these studies
attempt to understand the impact of heat on extreme hurricanes.
      Under some numerical simulations, the frequency of very intense tropical cyclones and
storm-related precipitation are projected to increase in warmer sea surface temperatures (SSTs) [12].
In some statistical simulations, the frequency of tropical cyclones is expected to increase in the far
North Atlantic, and the expected intensity for given time periods is expected to increase throughout
the Basin with warmer SSTs [16]. Other studies show climate change has impacted the average and
extreme rainfall amounts in recent events but did not impact the maximum sustained wind speed [21].
      Hurricane risk estimates are prolific in the literature, also using a variety of calculation methods.
Risk can be defined many ways, but here, it is defined as the statistical probability of something
happening (i.e., a certain magnitude wind speed) in a given location. Simpson and Lawrence [22]
offered one of the first return period calculations using an empirical approach, which has been
utilized in papers since [23]. More sophisticated statistical approaches exist to calculate risk, including
generalized Pareto probabilities [24] and quantile regression [25]. Some emphasize the importance in
the spatial variability of hurricane risk and utilize methods appropriate to calculate changes across
space, i.e., extreme value theory [26] and geographically weighted regression [16,17].
      It is important to consider the geographic variability of climate change impacts to the average and
extreme behavior of hurricanes because the risk of impact is not the same everywhere [16]. Focusing
on individual events, or on the Basin as a whole, can be problematic when wondering how hurricanes
will be impacted by climate change because we know the influences of climate change are also not
ubiquitous [27]. The definition of an extreme hurricane is also highly variable and is dependent upon
what locations are “used to” [28]. Each location along our coast or throughout the North Atlantic Basin
has its “normal” extreme hurricane based on the local, historical climatology.
      The purpose of this study is to compare the spatial variability of extreme hurricane risk in a
world with ocean temperatures similar to the climatology (the mean) to a world where ocean surface
temperatures are higher than the climatology. Said another way, it is meant to compare the historical
“normal” extreme to the extreme expected in conditions warmer than “normal”. In our present climate,
ocean temperatures are increasing [29]. Trenberth et al. [30] describe the role ocean heat content
played in the development of the 2017 hurricane season, where the National Oceanic and Atmospheric
Administration (NOAA) report the accumulated cyclone energy was 225% of the normal [30]. In this
study, the expected maximum intensity of a hurricane along the U.S. Coast and throughout the North
Atlantic Basin in an ocean environment with more available heat is provided using a combination
of extreme value statistics and geographically weighted regression (GWR). The goal is to better
understand future hurricane risk.

The Importance of Geography
     Hurricanes are not the same everywhere. It is difficult for scientists to understand how every
hurricane will change in a warming climate because every hurricane is unique in its formation, and
every landfalling end point has a unique resiliency and adaptation strategy (and in some cases,
the unique is the nonexistent). The geography of hurricane risk is important. When appropriately
estimating the spatial variability in the risk of extreme hurricane winds, proper attention and resource
allocation can be paid to those areas most at risk [16].
     Ellis et al. [28] describe the importance of understanding the relative risk of tropical cyclones in
a given spot. Every location analyzed has its own definition of an extreme hurricane based on the
localized 50 year return level. Extreme hurricanes in the Northeastern USA, such as Boston or New
York City, are high level Category 1 events on the Saffir–Simpson Hurricane Wind Scale (38.9 and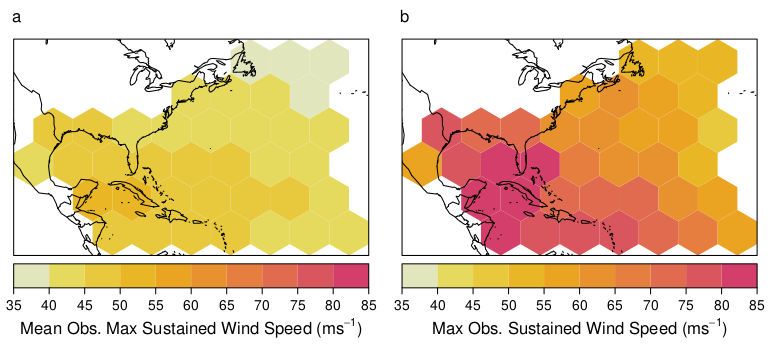
Atmosphere 2020, 11, 293                                                                           3 of 15

37.9 ms−1 , respectively), whereas extremes in places known for hurricanes, such as Miami, FL, and
New Orleans, LA, are Category 4 and 3 events, respectively [28]. This difference in relative risk is
important for societal preparedness [31] and for understanding how risk will change in an environment
with oceans warmer than the historical average.
     Hurricane Sandy was a post-tropical cyclone with wind speeds in the Category 1 range when
it made landfall near Brigantine, New Jersey, on 29 October 2012 [32]. Hurricane Irma destroyed
virtually all structures on the island of Barbuda when it made landfall as a Category 5 hurricane
and made landfall six more times in various places landing, finally, near Marco Island, Florida, as
a Category 3 event on 10 September 2017 [33]. Hurricane Maria was a raging Category 5 hurricane
when it made landfall in Puerto Rico on 20 September 2017 [34]. Hurricane Harvey was a rapidly
intensified Category 4 when it struck Houston on 25 August 2017 [1], and Hurricane Florence, a rapidly
weakening Category 1 as it made landfall near Wrightsville Beach, NC, on 14 September 2018 [4]. This
storm synopsis is provided to suggest the wind category of the storm is arguably irrelevant when
related to the magnitude of damage in a given place. Category 1 events through Category 5 events
all have the capacity to destroy locations, kill people, and cause irreparable damages. In all reports,
similar statements are made regarding the rarity of these events in the given locations. A Category 1
hurricane to the New Jersey coast is not dissimilar from the Category 4 in Houston or the Category 3
in Florida. The risk often boils down to this: what are the locations most familiar with and, thus, what
have they been preparing for? The preparation for the “normal” in the past may not be enough for the
“normal” in the future.

2. Materials and Methods

2.1. The Data
      Estimating the climatological, or “normal”, conditions of the North Atlantic is a necessary first
step to describing the difference in a warmer world. All analyses use two data sources. The National
Hurricane Center’s Best Track HURDAT2 data set [35] and NOAA’s Extended Reconstructed Sea
Surface Temperature (ERSST) V5. HURDAT2 includes the six-hourly information on the location
and maximum winds of all known tropical cyclones in the North Atlantic from 1851–2018. The
six-hourly values are spline interpolated to hourly-values to increase the resolution of the data [36].
Only hurricanes (maximum sustained 10 meter, 1-minute averaged winds ≥33 ms−1 ) are considered
for this study. The data are available at https://www.nhc.noaa.gov/data/?#hurdat. There are known
problems with the HURDAT2 data, including observational bias post-satellite era. It is likely more
extreme hurricanes were missed in earlier parts of the record [37], suggesting intensity estimates for
extreme hurricanes prior to the satellite era are likely unreliable. However, reanalyses to these data
have been underway for the last few decades (e.g., [38]) to assess necessary changes to the earlier parts
of the record. At present, HURDAT2 is the best approximation of known hurricane data in the North
Atlantic back to 1851 and should not be discounted due to likely inconsistencies, particularly where
extreme hurricanes are concerned, as these are the events causing the largest losses of life and money.
      The NOAA ERSST V5 data are the newest version of ERSST data and are available as monthly
SST averages from 1854 to the present. The data are on a 2 × 2◦ grid with spatial completeness
enhanced with statistical methods. The SSTs are derived from the latest International Comprehensive
Ocean-Atmosphere Data Set 3.0, with additional supplementary data sources enhancing resolution.
The NOAA ERSST V5 data are provided by the NOAA/OAR/ESRL PSD, in Boulder, CO, USA, from
their website at https://www.esrl.noaa.gov/psd/data/gridded/data.noaa.ersst.v5.html.
      North Atlantic hurricane climatology is described in a wide variety of articles [39–42]. Figure 1
displays all hurricane events included for analysis color coded by levels of the Saffir–Simpson Scale.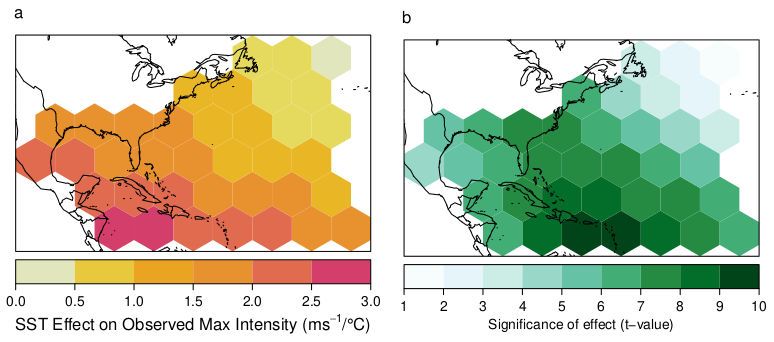
Atmosphere 2020, 11, 293                                                                                 4 of 15

      Figure 1. North Atlantic Hurricane Tracks from 1854–2018. Hurricanes are color coded by
      Saffir–Simpson Category at maximum sustained wind intensity. Category 1, 33–42 ms−1 , green.
      Category 2, 43–49 ms−1 , yellow. Category 3, 50–58 ms−1 , orange. Category 4, 59–69 ms−1 , red.
      Category 5, ≥70 ms−1 , purple. Category 5 events are rare and geographically limited, while Category
      1 events are common and ubiquitous throughout the Basin.

      All results in this study are displayed using a hexagonal tessellation because hexagons are a
geometric representation of a circle (similar to the shape of a hurricane), and hurricane characteristics
and risk have been successfully shown using them in the past [16,17,43]. Each of the 36 hexagons has
an area of 626,147 km2 , which is a little less than the size of Texas. This size is chosen to ensure a large
enough sample of maximum sustained winds (i.e., n ≥ 30), while having it small enough to allow for
any patterns in geographic variability to emerge.
      Figure 2a shows the number of hurricane events per equal-area hexagon overlaid on a map of
the North Atlantic Ocean Basin, and Figure 2b shows the number of major hurricanes (maximum
sustained wind speeds ≥50 ms−1 ). The maximum number of 220 wind speed events is off the coast of
the Carolinas in the open Atlantic, likely due to the recurving nature of hurricanes as they interact with
the Bermuda High. Everywhere along the United States coastline, the countries of Central America,
and the Caribbean, have all been frequented by hurricanes in the past and will continue to receive them
into the future. Major hurricanes are experienced almost everywhere except the far eastern extent of the
Basin. The maximum frequency of major hurricanes shifts to the south toward the Florida peninsula
compared to all hurricane events. The concern over the warming ocean environment questions the
changing frequency and intensity of future major, or extreme, hurricanes.
      Figure 3a shows the mean observed wind speed per hexagon, and Figure 3b shows the maximum
observed wind speed. The mean, or average, of the climate is a good representation of the “normal”
type of hurricane a location can expect to experience within the hexagonal region, or what the people
living in the locations are likely most used to because they experience those conditions more often
than others. Figure 3a is the “normal” hurricane expectation (i.e., the climatological mean), where
Figure 3b is the extreme (i.e., the climatological maximum). Historically, the most extreme wind
speeds throughout the Basin are experienced in the Gulf of Mexico, Caribbean Sea, and in the North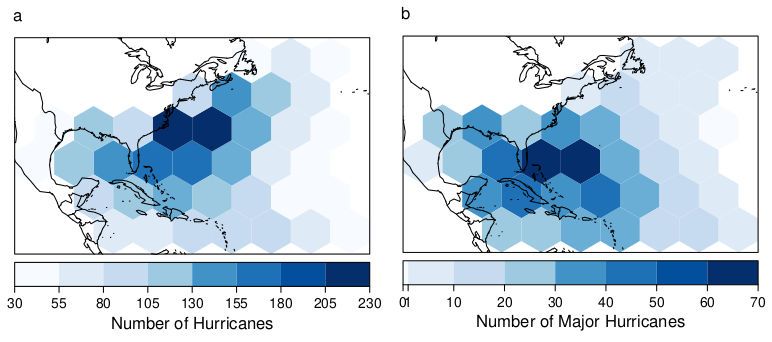
Atmosphere 2020, 11, 293                                                                                5 of 15

Atlantic approaching the Florida Straits. Both graphics utilize the same color scale to showcase the
incredible difference between the average and the maximum, highlighting the importance for a model
to utilize an approach useful for estimating the risk of extreme behavior of hurricanes and not the
climatological average.

      Figure 2. (a) Number of hurricanes with winds ≥33 ms−1 in equal-area hexagons from 1854–2018.
      (b) Number of major hurricanes with winds ≥50 ms−1 .

      Figure 3. (a) Mean observed maximum sustained wind speeds per hexagon in ms−1 . (b) Maximum
      observed sustained wind speeds per hexagon in ms−1 . Note the identical scale between the graphics.

     The maximum potential intensity equation offered by Emanuel [9,20,44] and further expanded
upon in the decades since suggests, all else being equal, a hurricane thrives in an environment with
greater surface ocean temperature. One accepted theory describing the formation of hurricanes is
similar to the Carnot heat engine; more energy in = more energy out [20]. Theoretically, more energy
available at the surface of the ocean allows for easier evaporation, higher water vapor content, and
more convective potential within the developing system, and some have argued SST provides an
upper boundary of intensity of a tropical cyclone, but it is not, alone, enough to estimate the maximum
intensity of a hurricane [45]. A large number of variables play a role in whether a hurricane will
actually form in an environment of high ocean heat. At varying levels of the atmosphere, these
include, but are not limited to, vertical wind shear, relative/specific humidity, air temperature near the
tropopause, vorticity, and divergence aloft. An additional oceanic variable is the amount of available
energy in the upper portion of the ocean, known as upper ocean heat content. Trenberth et al. [30]
found record high ocean heat content levels present during the life cycle of Hurricane Harvey in 2017,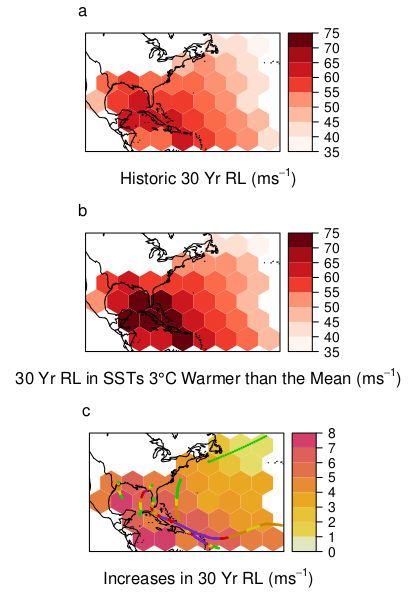
Atmosphere 2020, 11, 293                                                                                6 of 15

which led to exacerbated rainfall and rapid intensification. In this study, these additional variables are
largely ignored, purposefully, in an attempt to highlight the importance of higher ocean surface heat in
the geographic variability of hurricane risk. The model assumes these characteristics are not changing
in response to changing ocean heat.
      Figure 4 shows the difference between the mean August–October SST in degrees Celcius and
the maximum value experienced in those months throughout the duration of the record. This time
period is chosen because it represents the part of the year with the most energy available for hurricane
intensification [16]. In all locations in the Gulf of Mexico and Caribbean Sea, the maximum SST
experienced is higher than the average, and in some places by as much as 6 degrees Celsius. Models
utilizing average conditions, like those in Trepanier [16], offer conservative estimates of the sensitivity
of extreme hurricanes to SST. The areas of greatest increase between the maximum and the average
are nearest to the coastline, which exacerbates the potential threat of extreme hurricanes to coastal
citizens. The increased temperature from the average most certainly plays a role on the intensification
of hurricanes [30], and if the higher heat is available near the coast, it could lead to rapid intensification.

      Figure 4. Difference between mean August–October sea surface temperatures (SST) (◦ C) and maximum
      August–October SST (◦ C).

2.2. Calculating the Expected Extreme
     A wide variety of hurricane return frequency estimation methods are present in the literature. The
empirical approach finds how many events exist in a given time period [23], the numerical approach
creates simulations based on physical and mathematical relationships between variables [46], and
the statistical approach utilizing extreme value theory focuses in on the rarest of events and uses
extrapolation methods to estimate how often the most intense hurricane will come [24,26,47,48]. The
average, or “normal”, event is more easily estimated due to its prolific occurrence in a given spot. The
maximum, or most extreme, hurricane is difficult to statistically estimate because the sample size in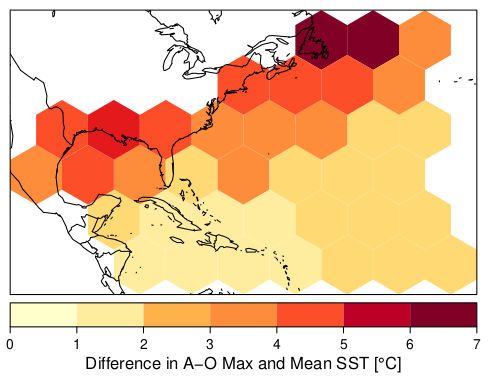
Atmosphere 2020, 11, 293                                                                             7 of 15

any given location is often very low. Extreme value analysis is helpful with this problem as it requires
an estimation of a wind speed greater than what has been observed and provides a framework for this
extrapolation [49].
     Probabilistic extreme value theory deals with the stochastic behavior of the maximum and the
minimum of independent and identically distributed random variables [50]. Distributional properties
of extremes, as well as of exceedances over specified thresholds are determined by the upper tails of the
underlying distribution [51]. Three extreme limit distributions exist [52]. Extreme value distributions
are typically broken into three families: Type 1 (Gumbel-type distribution) has an infinite upper tail
(though not as high as the Frèchet distribution), Type 2 (Frèchet-type distribution) has a higher infinite
upper tail, and Type 3 (Weibull-type distribution) has a finite upper tail [51]. According to Coles [49],
the families can be combined into a single family known as the generalized extreme value (GEV)
distribution. The model has three parameters, a location parameter µ, a scale parameter σ, and a shape
parameter ξ. A major limitation to the GEV distribution is it restricts the data to annual maxima only,
and it may ignore data that could be potentially useful in describing the extreme tail behavior [53].
Models based on a threshold approach were developed as a response to this limitation. When an entire
time series of data are available, modeling exceedances over a threshold results is a better use of the
data [49]. This is known as the generalized Pareto distribution (GPD) model and is used here.
     Following Trepanier [16] and Trepanier and Scheitlin [50], wind speed exceedances (i.e., wind
speeds over a given threshold u) W − u are modeled as samples from a GPD, so that for an individual
hurricane with maximum wind W,
                                                                     −1/ξ
                                                             ξ
                             Pr(W > v|W > u)        =     1 + [v − u]                                   (1)
                                                             σ
                                                    =    GPD(v − u|σ, ξ )

where σ > 0 and σ + ξ (v − u) ≥ 0. The frequency of storms with intensity reaching at least u follows
a Poisson distribution [40] with a threshold crossing rate, λu . Thus, the number of hurricanes per year
with winds exceeding v is a thinned Poisson process with mean λv = λu Pr(W > v|W > u). This is
the peaks-over-threshold (POT) method. That is, to estimate the return period for a given return level,
values below a certain threshold are removed before analysis so as to not bias the results toward the
mean [49,53]. The estimated model is characterized for a given u by σ, ξ, and λu .
     The return period for any v has an exponential distribution with mean r (v) = 1/λv since the
number of storms exceeding any wind speed v is a Poisson process. By substituting for λv in terms of
both λu and the GPD parameters then solving for v as a function of r the corresponding return level
for a given return period can be estimated as

                                                    σh                 i
                                     rl(r ) = u +      (r · λ u ) ξ − 1 .                               (2)
                                                    ξ

    For a more complete description of the statistical theory supporting this model please refer to
Kotz and Nadarajah [51] and Coles [49], and for more applications of this theory with hurricane data
using hexagonal tessellations see Trepanier [16] and Trepanier et al. [17].

2.3. Relationship to SST
     The relationship between extreme hurricane winds and SST is not geographically ubiquitous [16]. SST
significantly effects the σ parameter, or the type of wind speeds a given location will likely experience,
as well as significantly effecting the estimated 30-year return level (i.e., the expected maximum intensity
of a hurricane, on average, every 30 years, or an event with a 3.3% annual probability of occurring).
The effect of SST is most noted in the Caribbean Sea (σ) and in the Gulf of Mexico (the 30-year return
level) [16]. Estimating the variability in the sensitivity of hurricane wind speeds to SST is done
with GWR.
Atmosphere 2020, 11, 293 8 of 15
GWR allows the relationship between two variables to vary across the study area [54,55]. It
is easier to identify where the explanatory variable (SST) contributes the strongest to a change in
the response variable (extreme hurricane winds). The relationship between the response (y) and the
explanatory (x) can be expressed mathematically as
y = Xβ( g) + e (3)
where g is your set of geographic coordinates, here the set of hexagons.
2
β̂( g) = ( X T WX )−1 X T Wy where W is a weights matrix given by W = exp −hD2 where D is a
matrix of pairwise distances between the hexagons, and h is the bandwidth [55]. The weights matrix
is proportional to the influence a hexagon j has on its neighboring hexagons i in determining the
localized relationship between x and y. Weights are determined using the bisquare scheme. The
bandwidth controls the amount of smoothing. The procedure for choosing the bandwidth is an
iterative optimization procedure where improvements are made to the bandwidth choice based on
previous bandwidth values. It is considered the cross-validation bandwidth [36,56].
3. Results
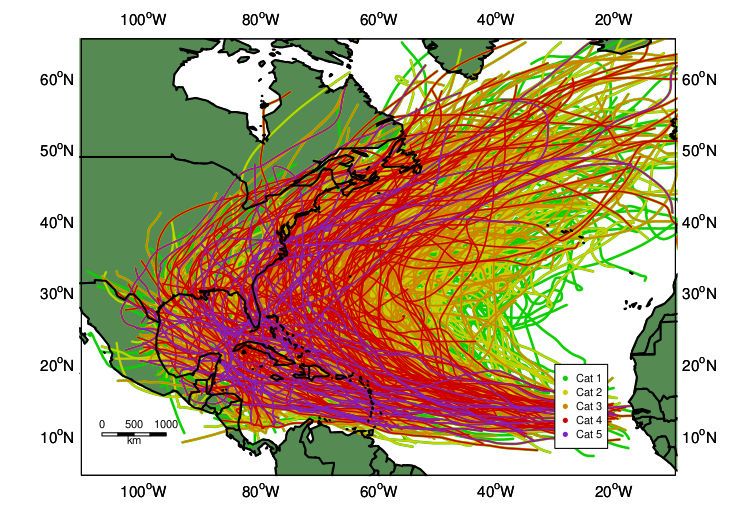
The model provides an estimate of how often any magnitude hurricane will occur in a given
location. The extreme value model is estimated at each of the 36 hexagons throughout the Basin. The
threshold u in the extreme value model is set at the 50th percentile of the wind speed distribution in
each hexagon. When the threshold is at this level, it allows for each geographic location to describe
its own unique hurricane risk, while still providing enough data values for the model to be robust.
Any higher than the 50th percentile, and many locations, particularly in the northern ocean, end with
sample sizes too small to fit the model. This type of estimation is conducted in Trepanier [16]. Figure 5
shows the historical 50th percentile threshold choice in a model using HURDAT2. One location over
the Greater Antilles Islands stands out at nearing Category 3 intensity for the median value, while the
majority of locations in the main development region are in the Category 2 range. Locations on the
eastern seaboard expect high level Category 1 events. This graphic suggests the extreme behavior of
hurricanes is geographically dependent.
One concern within the scientific community focuses on what maximum wind speeds will look
like in future extreme events. To maintain this focus, observed per-event maximum wind speeds
are chosen to represent this value in each hexagon for the model. This allows for the relative risk of
hurricanes to be represented while also considering the geographically varying influence of SST. The
strength of SSTs explanatory power of maximum wind speeds in a hurricane is offered by the R2 value
from the model. The values range from 0.46 (46% variability explained) near land to 0.79 in the open
Atlantic. The closer to land, the more varying influences can impact the maximum wind (e.g., land
interaction, local changes in SST, rapidly changing wind shear).
The strength of the local relationship between the observed per event maximum wind intensity
and the average (“normal”) August–October SST is shown in Figure 6a, and the significance of the
relationship is shown in Figure 6b. Local significance is estimated by dividing the coefficient value
by its standard error (the t-value). Regions where t ≥ 2 show statistically significant relationships
between the variables. Only in the far North Atlantic do areas show insignificant relationships between
the variables. Residuals of the model were tested for normality using the Shapiro Wilk’s Test, and the
model proves to be an adequate representation of the relationship.Atmosphere 2020, 11, 293 9 of 15
Figure 5. The historical 50th percentile wind speed used as the extreme value model threshold in ms−1 .
Figure 6. (a) Strength of the local relationship between the observed per event maximum wind intensity
and the average (“normal”) August–October SST in ◦ C. (b) Significance of the relationship.
The range of sensitivity varies from a 0.5 ms−1 increase per ◦ C in the far North Atlantic and over
Mexico, to a 2.5 ms−1 increase per ◦ C in the southwestern Caribbean Sea. This means, all else being
equal, that an increase of three degrees Celsius in SST compared to the average conditions used in
the model would equate to an increase in your maximum hurricane winds of 7.5 ms−1 in parts of the
Caribbean. This increases the category, and thus, expected damages of the system.
This relationship leads to this question, what do the new return frequencies look like in a world
with warmer sea surfaces? One could simply increase the winds by the local slope. However, a more
sophisticated technique would be to utilize the extreme value analysis as the definition of extreme
(50th percentile wind speeds) will change in each location based on the new distribution of wind
speeds, but the societal expectation of wind speeds is still based on the historical experience. The
extreme value approach can offer return frequency estimates for higher winds to better prepare for the
future expectation.Atmosphere 2020, 11, 293 10 of 15
The individual per-hexagon slopes representing the relationship between wind and SST are used
to calculate wind speed changes in an SST environment with three-degree Celsius increases from
the average. One and two degree increases are also estimated but are not included here, for brevity
purposes. The expected increases in a three-degree warmer environment scale down to one and
two degree increases with this model so increases at this level can be inferred from Figure 6a. The
difference between the maximum and average is offered in Figure 4. As an example, if the slope of the
relationship suggests a two ms−1 increase in wind for every one degree Celsius SST increase, then a
three-degree SST increase would equate to winds being six ms−1 higher than the historical record.
Three-degree increases are not unprecedented. SSTs have been higher than average during the
past three decades than at any other time since 1880 and are continuing to rise [57]. Trepanier [16]
show the variable most sensitive to changes in SST is the ξ parameter, representing the extreme tail
behavior of the hurricane wind distribution in a given spot. This means the wind intensity of the event
is most affected by changing SSTs compared to, say, frequency of the events. Alexander et al. [58] used
global climate models to assess the mean, variability, and extreme SSTs in the northern oceans and
found annual SST trends are all positive ranging, with a general shift in the mean, suggesting that
many SSTs of the future will always be warmer than the warmest years from 1976–2005. Using a three
degree increase to SSTs locally compared to the average is a conservative estimate of SST increases in
the future.
These changed wind speeds are then used to estimate the thirty-year return level of a hurricane
in the warmed sea environment. Thirty years is chosen because it represents the typical homeowner’s
mortgage duration. It is a short enough period of time when people would be present to experience an
extreme, while not being so short that the expected return level is not indicative of the extreme in a
location. The model is calculated using the historical threshold, as this is what the local populations
are most familiar with. The intent is to model the new wind speeds over the historical threshold to
maintain the “normal” expectation.
The extreme value approach is used on the observed wind data and the simulated wind data in
warmer SSTs (Figure 7a,b, respectively), and the difference between the two in Figure 7c. The tracks of
the 2017 Hurricanes Maria, Irma, and Harvey and 2018 Hurricane Michael are superimposed on the
last figure with wind speeds color coded by the Saffir–Simpson Scale.
In Figure 7a, the average return level is shown. This is the return level we would expect once,
on average, every thirty years (or a 3.3% annual chance), if we consider the historical climatology
of SSTs and hurricane wind speeds in the Basin. Upper-level Category 4 hurricanes are expected
throughout the Caribbean Islands, near the Florida Peninsula, and near the Yucatan Peninsula in these
historical conditions.
Figure 7b shows the expected return level for the same time period and using the same graphic
scale in an environment with all else being equal and SSTs being three degrees warmer than the
climatological average. In these warmer conditions (which are very similar to the SST conditions
present in the 2017 hurricane season), wind speeds reaching Category 5 intensity are expected
throughout the Caribbean, over all major islands, over Florida, and Louisiana. Category 4 wind speeds
now cover north Florida (evidenced in reality by Hurricane Michael in 2018), spread throughout the
main development region and up the eastern coast of the United States. Category 3 winds are now
experienced much farther north than previously experienced.
Figure 7c shows the areas with the largest differences in return level. Areas in the main
development region, Gulf of Mexico, and near Florida have increases from 1 up to 8 ms−1 . This
means the locations with the highest populated areas can expect even more devastating wind speeds
than historically typical in years where SSTs are warmer than the climatological average and the
remaining atmospheric conditions are conducive to formation. Hurricanes Harvey, Irma, Maria, and
Michael are shown with Category depiction to show the relationship between these high wind speeds
and the new return levels in warmer than normal seas. A Wilcoxon t-test suggests a significantAtmosphere 2020, 11, 293 11 of 15
statistical difference between population means of the historic return level and the return level in
warmer than normal SST conditions.
Figure 7. (a) The calculated return level (in ms−1 ) for 30 years or 3.3% annual probability of occurrence
using historic data and the average relationship between maximum wind and SSTs. (b) The calculated
return level for 30 years using the increased maximum wind speeds based on local sensitivity to SST.
(c) The difference between historic and future return levels. Tracks from Hurricanes Harvey, Irma,
and Maria from 2017 and Hurricane Michael from 2018 are included and color coded based on the
Saffir–Simpson Wind Scale described in Figure 1.
4. Discussion and Concluding Remarks
The Where Matters
Extreme hurricane winds are changing. This is evidenced in the most recent hurricane seasons
and is supported by the geographic and statistical approach offered in this study. Each hexagonAtmosphere 2020, 11, 293 12 of 15
represents the location’s individualized extreme wind event in warmer than normal seas based on the
local relationship with SSTs. The geographic variability in hurricane wind risk is evident.
The official Category of the hurricane does not matter. A Category 1 to a place that normally
never experiences hurricanes can be just as detrimental as the Category 5 in a place that receives
hurricanes often. Hurricanes Sandy, Irma, Maria, Harvey, and most recently, Florence and Michael are
proof of this. All of these events were ranging in characteristics, categories, and landfall locations, and
all caused incredible damages in each place. The relative risk of a hurricane is dependent upon the
location’s historical climatology and overall preparedness.
This study aims to support the idea that past hurricane climatology will not be the same as future
hurricane climatology. Future hurricanes will have more extreme wind speeds when the heat content
of the ocean’s surface is higher, and the other variables are conducive to formation. Currently, SSTs
are showing no signs of decreasing anywhere but in the far extreme North Atlantic (likely due to
glacial melting) [57]. All else being equal, future hurricanes will have higher wind speeds, and thus,
higher Categories than what each location has historically experienced. This is supported by numerical
modeling approaches, where frequency, intensity, and intensification all shift to higher values under
future increases in SST anomalies [46].
The impacts of this result on emergency preparedness are immense. Hurricane Sandy proved
that New Jersey and surrounding locations were underprepared, even when the threat had been
made apparent by research scientists in the year before [59,60]. Hurricane Michael made landfall
in a location along the north Florida coastline as a Category 5 system and was the strongest system
ever experienced in this location [61]. This rarity lead to a general under-preparedness, and 1584 of
the 1692 buildings in Mexico Beach, Florida, were destroyed. One might argue it is impossible to
prepare for a Hurricane Michael or Maria. Quite unfortunately, the research here suggests hurricanes
in warmer sea environments will be closer to these extremes than throughout the historical climatology,
as evidenced in the higher return levels over the same time period. It is of the utmost importance
emergency officials consider the anticipated changes to the "normal" extreme in the locations for which
they are responsible for preparing.
In order for the results of this paper to be applicable, SSTs must be warmer than the historical
average. While this has been the case for the last three decades [57], in future years with anomalously
cool SSTs, the maximum intensity of the hurricane should be lower than expected. There are major
climatological mechanisms controlling the status of SSTs in the North Atlantic. The El Niño Southern
Oscillation (ENSO) can be characterized by SST anomalies, suggesting large scale influence on SSTs by
ENSO [18]. Multidecadal changes in intense North Atlantic hurricane formation have been attributed
to changes in the Atlantic SST structure (the Atlantic Multidecadal Oscillation) [62]. These influencing
factors are not considered here as possible forcings leading to changing SSTs. SSTs are simply made
warmer due to the recent observed high values of SSTs throughout the main development region and
not because of large-scale oscillation patterns.
Emanuel [63] states hurricane potential intensity, low-level vorticity, and vertical wind shear
strongly covary and are highly correlated with SST, particularly in the period where reanalysis data
are most reliable. Vecchi et al. [64] show the different expected trends in absolute versus relative SST
and discuss the resultant influence on Atlantic hurricane activity. Relative SST, at this point, did not
yet have a distinct difference from natural climate variability, and thus, was not expected to influence
localized hurricane intensity differently in the future than it had in the past. However, a recent study
suggests warming in SSTs is typically underestimated in reconstruction data sets (including the one
utilized in this study) when compared to instrumental records (e.g., buoys) [65], suggesting that studies
relying on these data sets are typically under-representing the level of actual warming occurring in the
oceans. Thus, this study is necessary because localized increases in SST exist throughout hurricane
prone regions, and, when other conditions are conducive, will lead to increases in power availability
within the hurricane and will increase the risk of extreme hurricane behavior locally.Atmosphere 2020, 11, 293 13 of 15
SST warming is not discussed as being caused by anything specific. Research exists suggesting
anthropogenic influences are the cause [21] by considering pre and post industrial era tropical cyclones.
The purpose of this study is not to point a finger at human activity, but instead, to showcase the
necessity of accepting a warming SST climate and its influence on tropical cyclone intensity. Every
location in the North Atlantic and Gulf of Mexico will feel increased hurricane wind intensity when
warm seas are present and a hurricane is capable of forming (i.e., other conditions are conducive).
Emergency officials in each location along the United States Gulf and Eastern seaboards need to
educate, plan, and prepare for an increasingly windy future.
Funding: This research received the cost of publication charges from the Louisiana State University Middleton
Library Open Access Publishing Fund.
Conflicts of Interest: The author declares no conflict of interest.
Abbreviations
The following abbreviations are used in this manuscript:
ENSO El Niño Southern Oscillation
GPD Generalized Pareto Distribution
GWR Geographically Weighted Regression
NOAA National Oceanic and Atmospheric Administration
SST Sea Surface Temperature
References
1. Blake, E.S.; Zelinsky, D.A. Hurricane Hurricane Harvey Tropical Cyclone Report AL092017; Technical Report;
National Hurricane Center: Miami, FL, USA, 2018.
2. Podlaha, A.; Bowen, S.; Lorinc, M.; Bhattacharya, A. Global Catastrophe Recap; Technical Report; Aon Benfield:
London, UK, 2018.
3. Milken Institute School of Public Health. Project Report: Ascertainment of the Estimated Excess Mortality from
Hurricane Maria in Puerto Rico; Technical Report; The George Washington University: Washington, DC, USA, 2018.
4. Stewart, S.R.; Berg, R. Hurricane Florence Tropical Cyclone Report AL062018; Technical Report; National
Hurricane Center: Miami, FL, USA, 2019.
5. National Hurricane Center. Costliest U.S. Tropical Cyclones Tables Updated; Technical report; National Hurricane
Center: Miami, FL, USA, 2018.
6. Small, C.; Nicholls, R.J. A global analysis of human settlement in coastal zones. J. Coast. Res. 2003, 19, 584–599.
7. McGranahan, G.; Balk, D.; Anderson, B. The rising tide: Assessing the risks of climate change and human
settlements in low elevation coastal zones. Environ. Urban. 2007, 19, 17–37. [CrossRef]
8. Neumann, B.; Vafeidis, A.T.; Zimmerman, J.; Nicholls, R.J. Future coastal population growth and exposure
to sea-level rise and coastal flooding–A global assessment. PLoS ONE 2015. [CrossRef]
9. Emanuel, K. The dependence of hurricane intensity on climate. Nature 1987, 326, 483–485. [CrossRef]
10. Emanuel, K. Increasing destructiveness of tropical cyclones over the past 30 years. Nature 2005, 436, 686–688.
[CrossRef]
11. Knutson, T.; McBride, J.; Chan, J.; Emanuel, K.; Holland, G.; Landsea, C.; Held, I.; Kossin, J.; Srivastava, A.;
Sugi, M. Tropical cyclones and climate change. Nat. Geosci. 2010. [CrossRef]
12. Bacmeister, J.T.; Reed, K.A.; Hannay, C.; Lawrence, P.; Bates, S.; Truesdale, J.E.; Rosenbloom, N.; Levy, M.
Projected changes in tropical cyclone activity under future warming scenarios using a high-resolution climate
model. Clim. Chang. 2018, 146, 547–560. [CrossRef]
13. Darling, R. Estimating probabilities of hurricane wind speeds using a large-scale empirical model. J. Clim.
1991, 4, 1035–1046. [CrossRef]
14. Bender, M.A.; Knutson, T.R.; Tuleya, R.E.; Sirutis, J.J.; Vecchi, G.A.; Garner, S.T.; Held, I.M. Modeling impact
of anthropogenic warming on the frequency of intense Atlantic hurricanes. Science 2010, 327, 454–458.
[CrossRef]Atmosphere 2020, 11, 293 14 of 15
15. Lin, N.; Emanuel, K.; Oppenheimer, M.; Vanmarcke, E. Physically based assessment of hurricane surge
threat under climate change. Nat. Clim. Chang. 2012, 2, 462–467. [CrossRef]
16. Trepanier, J.C. Hurricane winds over the North Atlantic: spatial analysis and sensitivity to ocean temperature.
Nat. Hazards 2014. [CrossRef]
17. Trepanier, J.C.; Ellis, K.N.; Tucker, C.S. Hurricane risk variability along the Gulf of Mexico Coastline.
PLoS ONE 2015, 10, e0118196. [CrossRef] [PubMed]
18. Landsea, C.; Pielke, R., Jr.; Mestas-Nunez, A.; Knaff, J. Atlantic basin hurricanes: Indices of climatic changes.
Clim. Chang. 1999, 42, 89–129. [CrossRef]
19. Gray, W. Atlantic seasonal hurricane frequency: Part I: El Niño and 30 mb quasibiennial oscillation influences.
Mon. Weather Rev. 1984, 112, 1649–1668. [CrossRef]
20. Emanuel, K. The maximum intensity of hurricanes. J. Atmos. Sci. 1988, 45, 1143–1155. [CrossRef]
21. Patricola, C.M.; Wehner, M.F. Anthropogenic influences on major tropical cyclone events. Nature 2018, 563, 339–346.
[CrossRef]
22. Simpson, R.; Lawrence, M. Atlantic Hurricane Frequencies along the U.S. Coastline; Technical Memo to the National
Weather Service SR-58; National Oceanic and Atmospheric Administration: Silver Spring, MD, USA, 1971.
23. Keim, B.; Muller, R.; Stone, G. Spatiotemporal patterns and return periods of tropical storm and hurricane
strikes from Texas to Maine. J. Clim. 2007, 20, 3498–3509. [CrossRef]
24. Jagger, T.; Elsner, J. Climatology models for extreme hurricane winds in the United States. J. Clim. 2006,
19, 3220–3236. [CrossRef]
25. Elsner, J.; Kossin, J.; Jagger, T. The increasing intensity of the strongest tropical cyclones. Nature 2008, 455, 92–95.
[CrossRef]
26. Malmstadt, J.; Elsner, J.; Jagger, T. Risk of strong hurricane winds to Florida cities. J. Appl. Meteorol. Climatol.
2010, 49, 2121–2132. [CrossRef]
27. Core Writing Team; Pachauri, R.K.; Meyer, L.A. (Eds.) Climate Change 2014: Synthesis Report. Contribution
of Working Groups I, II and III to the Fifth Assessment Report of the Intergovernmental Panel on Climate Change;
Intergovernmental Panel on Climate Change: Geneva, Switzerland, 2014; p. 151.
28. Ellis, K.N.; Sylvester, L.; Trepanier, J.C. Spatiotemporal patterns of extreme hurricanes impacting U.S. coastal
cities. Nat. Hazards 2015, 75, 2733–2749. [CrossRef]
29. Cheng, L.; Trenberth, K.E.; Fasullo, J.; Boyer, T.; Abraham, J.; Zhu, J. Taking the pulse of the planet. Eos 2018, 98.
[CrossRef]
30. Trenberth, K.E.; Cheng, L.; Jacobs, P.; Zhang, Y.; Fasullo, J. Hurricane Harvey links to ocean heat content and
climate change adaptation. Earth Future 2018, 6, 730–744. [CrossRef]
31. Davidson, R.A.; Lambert, K.B. Comparing the hurricane disaster risk of U. S. coastal counties. Nat. Hazards
Rev. 2001, 2, 132–142. [CrossRef]
32. Blake, E.S.; Kimberlain, T.B.; Berg, R.J.; Cangialosi, J.P.; Bevin, J.L., II. Hurricane Sandy Tropical Cyclone Report
AL182012; Technical Report; National Hurricane Center: Miami, FL, USA, 2013.
33. Cangialosi, J.P.; Latto, A.S.; Berg, R. Hurricane Irma Tropical Cyclone Report AL112017; Technical Report;
National Hurricane Center: Miami, FL, USA, 2018.
34. Pasch, R.J.; Penny, A.B.; Berg, R. Hurricane Maria Tropical Cyclone Report Al152017; Technical report; National
Hurricane Center: Miami, FL, USA, 2019.
35. Landsea, C.W.; Franklin, J.L. Atlantic hurricane database uncertainty and presentation of a new database
format. Mon. Weather Rev. 2013, 141, 3576–3592. [CrossRef]
36. Elsner, J.B.; Jagger, T.H. Hurricane Climatology: A Modern Statistical Guide Using R; Oxford University Press:
New York, NY, USA, 2013; p. 430
37. Hagen, A.B.; Landsea, C.W. On the classification of extreme Atlantic hurricanes utilizing mid-Twentieth-Century
monitoring capabilities. J. Clim. 2012, 25, 4461–4475. [CrossRef]
38. Delgado, S.; Landsea, C.W.; Willoughby, H. Reanalysis of the 1954–63 Atlantic hurricane seasons. J. Clim.
2018, 31, 4177–4192. [CrossRef]
39. Landsea, C. A climatology of intense (or major) Atlantic hurricanes. Mon. Weather Rev. 1993, 121, 1703–1713.
[CrossRef]
40. Elsner, J.; Kara, A. Hurricanes of the North Atlantic: Climate and Society; Oxford University Press: New York, NY, USA,
1999; p. 488.
41. Emanuel, K. Tropical Cyclones. Annu. Rev. Earth Planet. Sci. 2003, 31, 75–104. [CrossRef]Atmosphere 2020, 11, 293 15 of 15
42. Scheitlin, K.; Elsner, J.; Lewers, S.; Malmstadt, J.; Jagger, T. Risk assessment of hurricane winds for Eglin Air
Force Base in northwestern Florida, USA. Theor. Appl. Climatol. 2011. [CrossRef]
43. Brettschneider, B. Climatological hurricane landfall probability for the United States. J. Appl. Meteorol.
Climatol. 2008, 47, 704–716. [CrossRef]
44. Emanuel, K. An air-sea interaction theory for tropical cyclones. Part I: Steady-state maintenance. J. Atmos. Sci.
1986, 43, 585–604. [CrossRef]
45. DeMaria, M.; Kaplan, J. Sea surface temperature and the maximum intensity of Atlantic tropical cyclones.
J. Clim. 1994, 7, 1324–1334. [CrossRef]
46. Bhatia, K.; Vecchi, G.; Murakami, H.; Underwood, S.; Kossin, J. Projected response of tropical cyclone
intensity and intensification in a global climate model. J. Clim. 2018, 31, 8281–8303. [CrossRef]
47. Heckert, N.; Simiu, E.; Whalen, T. Estimates of hurricane wind speeds by ‘peaks over threshold’ method.
J. Struct. Eng. ASCE 1998, 124, 445–449. [CrossRef]
48. Chu, P.; Wang, J. Modeling return periods of tropical cyclone intensities in the vicinity of Hawaii. J. Appl.
Meteorol. Climatol. 1998, 37, 951–960. [CrossRef]
49. Coles, S. An Introduction to Statistical Modeling of Extreme Values; Springer: Berlin/Heidelberg, Germany, 2001; p. 208.
50. Trepanier, J.C.; Scheitlin, K.N. Hurricane wind risk in Louisiana. Nat. Hazards 2014, 70, 1181–1195. [CrossRef]
51. Kotz, S.; Nadarajah, S. Extreme Value Distributions: Theory and Applications; Imperial College Press: London, UK, 2000;
p. 185.
52. Fisher, R.; Tippett, L. Limiting forms of the frequency distribution of the largest or smallest member of a
sample. Process. Camb. Philos. Soc. 1928, 24, 180–190. [CrossRef]
53. Coles, S.; Powell, E. Bayesian methods in extreme value modelling: A review and new developments.
Int. Stat. Rev. 1996, 64, 119–136. [CrossRef]
54. Brunsdon, C.; Fotheringham, A.; Charlton, M. Geographically weighted regression–Modelling spatial
non-stationarity. J. R. Stat. Soc. Ser. Stat. 1998, 47, 431–443. [CrossRef]
55. Fotheringham, A.; Brunsdon, C.; Charlton, M. Quantitative Geography: Perspectives on Spatial Data Analysis;
Sage: London, UK, 2000.
56. Bivand, R.; Yu, D. spgwr: Geographically Weighted Regression; Esri: Redlands, CA, USA, 2017.
57. Environmental Protection Agency. Climate Change Indicators: Sea Surface Temperature; Technical Report;
United States Environmental Protection Agency: Washingotn, DC, USA, 2016.
58. Alexander, M.A.; Scott, J.D.; Friedland, K.D.; Mills, K.E.; Nye, J.A.; Pershing, A.J.; Thomas, A.C. Projected
sea surface temperatures over the 21st century: Changes in the mean, variability and extremes for large
marine ecosystem regions of Northern Oceans. Elem. Sci. Anthr. 2018, 6, 1–9.
59. Abramson, D.M.; Redlener, I. Hurricane Sandy: lessons learned, again. Disaster Med. Public Health Prep.
2012, 6, 328–329. [CrossRef] [PubMed]
60. Powell, T.; Hanfling, D.; Gostin, L.O. Emergency preparedness and public health: the lessons of Hurricane
Sandy. JAMA 2012, 308, 2569–2570. [CrossRef] [PubMed]
61. Bevin, R.B.J.L., II; Hagen, A. Hurricane Michael Tropical Cyclone Report AL142018; Technical Report; National
Hurricane Center: Miami, FL, USA, 2019.
62. Gray, W. Strong association between West African rainfall and U.S. landfall of intense hurricanes. Science
1990, 249, 1251–1256. [CrossRef] [PubMed]
63. Emanuel, K. Environmental factors affecting tropical cyclone power dissipation. J. Clim. 2007, 20, 5497–5509.
[CrossRef]
64. Vecchi, G.A.; Swanson, K.L.; Soden, B.J. Whither hurricane activity? Science 2008, 322, 687–689. [CrossRef]
65. Hausfather, Z.; Cowtan, K.; Clarke, D.C.; Jacobs, P.; Richardson, M.; Rohde, R. Assessing recent warming
using instrumentally homogeneous sea surface temperature records. Sci. Adv. 2017, 3, 1–13. [CrossRef]
c 2020 by the authors. Licensee MDPI, Basel, Switzerland. This article is an open access
article distributed under the terms and conditions of the Creative Commons Attribution
(CC BY) license (http://creativecommons.org/licenses/by/4.0/).You can also read