A minimally destructive protocol for DNA extraction from ancient teeth - David Reich Lab
←
→
Page content transcription
If your browser does not render page correctly, please read the page content below
Downloaded from genome.cshlp.org on February 13, 2021 - Published by Cold Spring Harbor Laboratory Press

Method

A minimally destructive protocol for DNA extraction
from ancient teeth
Éadaoin Harney,1,2,3,4,28 Olivia Cheronet,5,28 Daniel M. Fernandes,5,6 Kendra Sirak,3,4
Matthew Mah,3,7,8 Rebecca Bernardos,3,8 Nicole Adamski,3,8
Nasreen Broomandkhoshbacht,3,8 Kimberly Callan,3,8 Ann Marie Lawson,3,8
Jonas Oppenheimer,3,8 Kristin Stewardson,3,8 Fatma Zalzala,3,8 Alexandra Anders,9
Francesca Candilio,10 Mihai Constantinescu,11 Alfredo Coppa,3,5,12 Ion Ciobanu,13,14
János Dani,15 Zsolt Gallina,16 Francesco Genchi,12 Emese Gyöngyvér Nagy,15
Tamás Hajdu,17,18 Magdolna Hellebrandt,19 Antónia Horváth,19 Ágnes Király,20
Krisztián Kiss,17,18 Barbara Kolozsi,15 Péter Kovács,21 Kitti Köhler,20 Michaela Lucci,22
Ildikó Pap,18 Sergiu Popovici,23 Pál Raczky,9 Angela Simalcsik,14,24
Tamás Szeniczey,17,18 Sergey Vasilyev,25,26 Cristian Virag,27 Nadin Rohland,3,7
David Reich,2,3,4,7,8 and Ron Pinhasi5
1
  Department of Organismic and Evolutionary Biology, Harvard University, Cambridge, Massachusetts 02138, USA; 2The Max
Planck-Harvard Research Center for the Archaeoscience of the Ancient Mediterranean, Cambridge, Massachusetts 02138, USA and
Jena D-07745, Germany; 3Department of Genetics, Harvard Medical School, Boston, Massachusetts 02115, USA; 4Department of
Human Evolutionary Biology, Harvard University, Cambridge, Massachusetts 02138, USA; 5Department of Evolutionary
Anthropology, University of Vienna, Vienna 1090, Austria; 6CIAS, Department of Life Sciences, University of Coimbra, 3000-456
Coimbra, Portugal; 7Broad Institute of Harvard and MIT, Cambridge, Massachusetts 02142, USA; 8Howard Hughes Medical
Institute, Harvard Medical School, Boston, Massachusetts 02115, USA; 9Institute of Archaeological Sciences, Eötvös Loránd
University, 1088 Budapest, Hungary; 10Superintendency of Archaeology, Fine Arts and Landscape for the City of Cagliari and the
Provinces of Oristano and South Sardinia, 09121 Cagliari, Italy; 11Fr. I. Rainer Institute of Anthropology, Bucharest 050711,
Romania; 12Department of Environmental Biology, Sapienza University, 00185 Rome, Italy; 13Cultural-Natural Reserve “Orheiul
Vechi”, 3552 Orhei, Republic of Moldova; 14Institute of Bioarchaeological and Ethnocultural Research, 2012 Chișină u, Republic of
Moldova; 15Déri Museum, 4026 Debrecen, Hungary; 16Ásatárs Kulturális, Régészeti Szolgáltató és Kereskedelmi Limited, 6000
Kecskemét, Hungary; 17Department of Biological Anthropology, Eötvös Loránd University, 1171 Budapest, Hungary; 18Department
of Anthropology, Hungarian Natural History Museum, 1083 Budapest, Hungary; 19Herman Ottó Museum, 3529 Miskolc, Hungary;
20
   Institute of Archaeology, Research Centre for the Humanities, 1097 Budapest, Hungary; 21Damjanich János Museum, 5000
Szolnok, Hungary; 22Department of History, Anthropology, Religion, Arts and Performing Arts, Sapienza University, 00185 Rome,
Italy; 23National Agency for Archaeology, 2012 Chișină u, Republic of Moldova; 24Olga Necrasov Center for Anthropological
Research, Romanian Academy, 700481 Iasi, Romania; 25Institute of Ethnology and Anthropology of the Russian Academy of
Sciences, 119991 Moscow, Russia; 26Center for Egyptological Studies of the Russian Academy of Sciences, 119071 Moscow, Russia;
27
   Satu Mare County Museum, 440031 Satu Mare, Romania

        Ancient DNA sampling methods—although optimized for efficient DNA extraction—are destructive, relying on drilling
        or cutting and powdering (parts of) bones and teeth. As the field of ancient DNA has grown, so have concerns about
        the impact of destructive sampling of the skeletal remains from which ancient DNA is obtained. Due to a particularly
        high concentration of endogenous DNA, the cementum of tooth roots is often targeted for ancient DNA sampling, but
        destructive sampling methods of the cementum often result in the loss of at least one entire root. Here, we present a min-
        imally destructive method for extracting ancient DNA from dental cementum present on the surface of tooth roots. This
        method does not require destructive drilling or grinding, and, following extraction, the tooth remains safe to handle and

28
   These authors contributed equally to this work.                                  © 2021 Harney et al. This article is distributed exclusively by Cold Spring
Corresponding authors: ron.pinhasi@univie.ac.at,                                    Harbor Laboratory Press for the first six months after the full-issue publication
eadaoinharney@gmail.com, olivia.cheronet@univie.ac.at,                              date (see https://genome.cshlp.org/site/misc/terms.xhtml). After six months,
reich@genetics.med.harvard.edu                                                      it is available under a Creative Commons License (Attribution-
Article published online before print. Article, supplemental material, and publi-   NonCommercial 4.0 International), as described at http://creativecommons.
cation date are at https://www.genome.org/cgi/doi/10.1101/gr.267534.120.            org/licenses/by-nc/4.0/.

31:1–12 Published by Cold Spring Harbor Laboratory Press; ISSN 1088-9051/21; www.genome.org                                        Genome Research                1
                                                                                                                                      www.genome.org
Downloaded from genome.cshlp.org on February 13, 2021 - Published by Cold Spring Harbor Laboratory Press
Harney et al.
suitable for most morphological studies, as well as other biochemical studies, such as radiocarbon dating. We extracted and
sequenced ancient DNA from 30 teeth (and nine corresponding petrous bones) using this minimally destructive extraction
method in addition to a typical tooth sampling method. We find that the minimally destructive method can provide ancient
DNA that is of comparable quality to extracts produced from teeth that have undergone destructive sampling processes.
Further, we find that a rigorous cleaning of the tooth surface combining diluted bleach and UV light irradiation seems suf-
ficient to minimize external contaminants usually removed through the physical removal of a superficial layer when sam-
pling through regular powdering methods.
[Supplemental material is available for this article.]
Over the past decade, the field of ancient DNA has experienced a as repositories of ancient DNA in bones (Bell et al. 2008; Pinhasi
rapid increase in the number of ancient genomes published each et al. 2015). Like the cochlea, cementum also does not undergo re-
year (Slatkin and Racimo 2016) as a consequence of advances in modeling (but, unlike the cochlea, it continues to accumulate
ancient DNA sampling (Gamba et al. 2014; Damgaard et al. throughout life) and the haphazard organization of collagen fibers
2015), extraction (Dabney et al. 2013a; Rohland et al. 2018), and in cementum resembles that of woven bone (Freeman 1994;
enrichment (Carpenter et al. 2013; Fu et al. 2013) techniques. As Grzesik et al. 2000). Assessment of DNA preservation in ancient
our ability to sequence large numbers of ancient individuals has teeth shows that dental cementum contains a substantially higher
increased, discussions about the destructive nature of ancient proportion of endogenous DNA than dentine from the same tooth
DNA sampling—which typically requires drilling or cutting and (Damgaard et al. 2015). Furthermore, in a direct comparison be-
powdering ancient bones and teeth—have become more promi- tween cementum and petrous samples, Hansen et al. (2017) find
nent (Makarewicz et al. 2017; Prendergast and Sawchuk 2018; that cementum and petrous yield a comparable amount of endog-
Sirak and Sedig 2019). The identification of the osseous inner enous DNA in well-preserved samples, although in poorly pre-
ear, and specifically the cochlea (located in the petrous portion served individuals, the petrous yields a higher proportion of
of the temporal bone), as an optimal source of ancient DNA endogenous molecules. The only published method for sampling
(Gamba et al. 2014; Pinhasi et al. 2015, 2019) is one of the driving DNA from the cementum specifically recommends a targeted
factors in this revolution, making it possible to access ancient DNA method for extracting DNA from teeth using an “inside-out” ap-
from geographic regions with climatic conditions unfavorable to proach that involves removing the crown and subsequently using
ancient DNA preservation. However, accessing this optimal source a fine drill to remove as much pulp and dentine as possible from
of ancient DNA results in the destruction of the inner ear morphol- the tooth root to ultimately obtain a “case” of cementum
ogy, which is a valuable source of morphological information (de (Damgaard et al. 2015). However, this valuable approach may still
León et al. 2018). Although there are protocols that reduce the de- not be able to perfectly isolate the extremely thin and brittle layer
structive nature of sampling, by sampling from the ossicles of the of cementum, which ranges from 20–50 μm thick at the cemento-
inner ear (Sirak et al. 2020) or performing targeted drilling of the enamel junction, to 150–200 μm thick at the apex of the root
cochlea through the cranial base of complete or reconstructed (Freeman 1994).
crania (Sirak et al. 2017), some destruction (including that of mor- Here, we present an alternative, minimally destructive proto-
phologically informative inner ear components) is inevitable. As a col for sampling ancient DNA from tooth cementum that does not
consequence, this and other less invasive methods may be con- require drilling or cutting, thereby maintaining the morphological
sidered unsuitable in cases where samples are of particular anthro- integrity of the tooth (Fig. 1). The technique targets ancient DNA
pological value and are subject to stringent restrictions on from the cementum of tooth roots by directly exposing the outer-
permissible sampling practices. most layer of a portion of the tooth root to a lysis buffer for a short
Teeth are a valuable alternative to the sampling of the cochlea incubation period, following a nondestructive decontamination
(Gamba et al. 2014; Damgaard et al. 2015), especially because they procedure. Similar less destructive methods have been reported
are particularly numerous in osteological collections, due to the in previous PCR-based mitochondrial ancient DNA studies
fact that individuals have many more teeth than petrous bones (Rohland et al. 2004; Bolnick et al. 2012; Hofreiter 2012) and in fo-
and to their resistance to taphonomic decomposition. Despite rensic contexts (Correa et al. 2019). However, the ancient DNA ob-
this, little has been published outlining optimal practices for sam- tained using these strategies was typically less well preserved and of
pling from teeth. Traditionally, the standard practice has been to a lesser quantity than DNA obtained using more destructive meth-
grind or drill large chunks of the tooth root to a powder ods. Additionally, in some cases (Rohland et al. 2004; Hofreiter
(Rohland and Hofreiter 2007), as the crown enamel is largely inor- 2012), the hazardous chemicals used during sampling may have
ganic and is therefore unlikely to contain a substantial amount of compromised safe handling and future chemical analyses of the re-
endogenous DNA (Higgins and Austin 2013). In an attempt to mains. In this study, we conduct a systematic evaluation of the ap-
minimize potential external contaminants, the surface layer is of- plication of a minimally destructive sampling technique in a
ten removed to access the “untouched” dentine and pulp. massively parallel sequencing context.
However, this practice removes some, if not all, of the thin layer
of cementum that coats the inferior portion of dental roots.
The cellular cementum is rich in cementocytes, which are
Results
DNA-containing cells that remain encased in the mineral structure We selected thirty ancient individuals (Table 1; Supplemental
of the tooth after death (Bosshardt and Selvig 1997). Cementum Table S1) for a comparative analysis of the quality of ancient
also shares several histological properties with the cochlear region DNA—as measured through metrics such as the proportion of en-
of the petrous that are thought to contribute to its high level of dogenous molecules of shotgun data, sample complexity, and con-
DNA preservation, including similarities between cementocytes tamination rate—that could be obtained from an individual using
(Zhao et al. 2016) and osteocytes, which are hypothesized to serve this minimally destructive extraction method versus standard
2 Genome Research
www.genome.orgDownloaded from genome.cshlp.org on February 13, 2021 - Published by Cold Spring Harbor Laboratory Press
Minimally destructive DNA extraction from teeth
Figure 1. Examples of teeth before and after minimally destructive extraction. Teeth which have been sampled using this minimally destructive extrac-
tion protocol were photographed prior to (top) and ∼24 h after (bottom) extraction. Through the use of parafilm to protect regions of the tooth that are not
targeted during sampling, such as the crown, sample degradation is primarily restricted to the lower portion of the targeted tooth roots, and the overall
morphology of the tooth remains intact. The region targeted for sampling (i.e., not covered by parafilm) is indicated by a transparent box in the after im-
ages. Note that these are representative examples of the typical impact of sampling using this method on ancient teeth of high quality (two left-most teeth)
or moderate quality (three right-most teeth). Data from these teeth are not reported in this study. For before and after images of the tooth roots upon which
sequencing was done during this study, see Supplemental Figure S1.
sampling procedures that rely on cutting and powdering tooth for some analyses to produce results for the tooth root that under-
samples. From each individual, we sampled a single multirooted went Method WTR, the relatively low rate of mitochondrial match
tooth, from which the roots were removed via cutting (note that to the consensus (0.860) suggests that this sample is likely contam-
the tooth roots were cut in order to make it possible to process inated. Based on these results, we also chose to exclude individual
the samples using several independent methods, but cutting is 22 from statistical analyses. However, we note that there are no sig-
not required by the minimally destructive sampling protocol) nificant changes to the reported statistics when the excluded indi-
and each was randomly assigned to undergo one of the following viduals are included in calculations for which metrics from both
extraction treatments. We extracted ancient DNA from a tooth treatments are available (Supplemental Table S2). For all statistical
root that was processed using the minimally destructive extraction calculations, we included data from all other samples, which were
protocol described in this paper (Method “MDE” for “Minimally processed as either double-stranded (samples 1–10) or single-
Destructive Extraction”) and a second whole tooth root of the stranded (samples 11–30) libraries. Results where each of these
same tooth, that was completely powdered via milling (Method methods was analyzed separately are reported in Supplemental
“WTR” for “Whole Tooth Root”). In four cases where a third tooth Table S2.
root was available, we extracted ancient DNA using the cementum-
targeting approach described by Damgaard et al. (2015) (Method Physical impact of minimally destructive extraction protocol
“D” for “Damgaard”). We also generated extracts from powder pro-
We photographed each tooth root processed using the minimally
duced from petrous bones for 10 of the same individuals using the
destructive extraction protocol immediately prior to extraction
method described by Pinhasi et al. (2019) (Method “P” for
and 24 h after extraction to allow for the complete drying of the
“Petrous”). In one case (individual 3), we discovered through sub-
roots (Supplemental Fig. S1). A slight degradation of the outer
sequent bioinformatic analyses that the petrous bone and tooth
tooth root surface is visible for many of the samples, as the portion
sampled did not originate from the same individual, and we there-
of the tooth root exposed to extraction buffer shows a visible
fore exclude the petrous bone results from further analyses. DNA
change in color and/or diameter relative to the unexposed portion.
preservation in two individuals (5 and 6) was uniformly poor,
In the case of two of the most poorly preserved samples (individu-
with no more than 10,000 sequences aligning to the 1.24 million
als 5 and 6), the tooth roots—one of which broke in two when cut
sites captured through targeted enrichment (out of ∼5 million
from the tooth crown—crumbled during removal of the parafilm
unique reads sequenced) from any of the libraries generated.
that covered the tops of the roots after the incubation in extraction
Furthermore, all of these double-stranded libraries exhibited C-
buffer. These results suggest that users should exercise caution
to-T damage rates at the terminal ends of molecules of less than
when applying this method to very friable teeth that are already
3%—the recommended minimum threshold for assessing ancient
susceptible to crumbling or being crushed.
DNA authenticity in partially UDG-treated libraries (Rohland et al.
2015). These samples are considered to have “failed” screening for
authentic ancient DNA and are not included in the statistical anal- Comparison of minimally destructive extraction protocol
yses. Additionally, individual 22 yielded relatively poor results for versus powder-based extraction protocols
both treatments. Only 533 reads (out of ∼4 million unique reads Following bioinformatic processing, we generated summary statis-
sequenced) aligned to the 1.24 million sites targeted in the nuclear tics for each extract, including metrics of sample complexity and
genome for the MDE treatment, making it impossible to calculate contamination rates (Table 1; Supplemental Table S1). In the fol-
several of the reported metrics. Although we did obtain enough lowing section, for each individual we compare the quality of an-
reads (23,239 reads out of ∼18 million unique reads sequenced) cient DNA yielded by the minimally destructive extraction
Genome Research 3
www.genome.org4
Harney et al.
Genome Research
Table 1. Sample information
www.genome.org
Number
of C-to-T
sequences Median damage Complexity Rate of
Downloaded from genome.cshlp.org on February 13, 2021 - Published by Cold Spring Harbor Laboratory Press
aligning length of rate at the (percentage mitochondrial
to the sequences 5′ end of of unique match to the Contamination
1240k Coverage aligning to molecules reads out of consensus Autosomal rate (assessed
targeted on 1240k the human aligning to 1,000,000 (95% contamination in genetic
Method Percent nuclear autosomal genome the human sequenced Complexity confidence rate males via
applied/ Sample origin endogenous sites targets (bp) genome reads) (informative interval) (contamLD) ANGSD)
Element and age (years (precapture (captured (captured (precapture (precapture (captured sequence (captured (captured (captured
Individual typea before present) libraries) libraries) libraries) libraries) libraries) libraries) content) libraries)b libraries)b libraries)b
1 P Urziceni, 68.23% 732,856 2.94 44 0.111 92.10% 1.72 × 10¹⁰ 0.992 ± 0.006 −0.003 ± 0.005 0.007
MDE Romania 34.22% 422,192 0.37 48 0.072 30.50% 1.12 × 10⁹ 0.990 ± 0.008 −0.008 ± 0.023 0.025
WTR 6300–6050 BP 12.50% 648,760 0.88 46 0.055 51.80% 8.74 × 10⁹ 0.997 ± 0.004 0.008 ± 0.011 0.006
D 22.36% 319,510 0.26 46 0.060 23.69% 5.37 × 10⁸ 0.986 ± 0.009 0.008 ± 0.023 –
2 P Urziceni, 23.19% 713,660 2.78 44 0.107 91.20% 2.93 × 10¹¹ 0.986 ± 0.010 −0.01 ± 0.006 0.006
MDE Romania 8.51% 507,713 0.51 46 0.055 38.10% 2.74 × 10⁹ 0.976 ± 0.012 −0.033 ± 0.023 0.003
WTR 6300–6050 BP 1.19% 8438 3.32 50 0.045 0.90% 2.03 × 10⁶ 0.984 ± 0.010 −0.097 ± 0.077 –
D 1.39% 107,038 0.07 47 0.054 10.05% 2.03 × 10⁶ 0.990 ±0.007 – –
3c MDE Glăvăneşti, 2.01% 29,234 0.02 39 0.102 2.80% 1.24 × 10⁷ 0.803 ± 0.087 – –
WTR Romania 0.65% 62,005 0.04 39 0.128 6.30% 4.60 × 10⁸ 0.946 ± 0.029 – –
5450–3050 BP
4 P Glăvăneşti, 1.65% 165,145 0.12 39 0.147 14.30% 9.78 × 10⁸ 0.936 ± 0.024 – –
MDE Romania 72.77% 624,069 0.91 47 0.055 53.00% 1.52 × 10¹⁰ 0.979 ± 0.011 −0.010 ± 0.014 0.010
WTR 5450–3050 BP 19.69% 633,735 0.87 47 0.047 52.30% 5.73 × 10⁹ 0.993 ± 0.005 0.000 ± 0.017 0.002
5c P Ras al Hamra, 0.10% 6226 0 60 0.000 – 2.90 × 10⁶ – – –
MDE Oman 2.74% 8364 0.01 59 0.000 0.90% 2.00 × 10⁶ – – –
WTR 5650–5150 BP 1.48% 6655 0 61 0.000 0.70% 2.15 × 10⁶ – – –
6c P Ras al Hamra, 0.17% 6530 0 58 0.000 0.70% 3.61 × 10⁶ – – –
MDE Oman 0.97% 8860 0.01 58 0.019 1.00% 1.61 × 10⁶ – – –
WTR 5650–5150 BP 0.24% 7846 0.01 58 0.029 0.90% 2.84 × 10⁶ – – –
7 P Cimișlia, Rep. of 2.74% 185,208 0.15 38 0.282 16.40% 6.36 × 10⁹ 0.988 ± 0.009 0.004 ± 0.018 –
MDE Moldova 57.34% 486,828 0.49 44 0.135 34.50% 3.81 × 10⁹ 0.983 ± 0.009 0.022 ± 0.009 –
WTR 2050–1850 BP 8.34% 530,939 0.58 45 0.064 39.80% 4.50 × 10⁹ 0.993 ± 0.006 −0.013 ± 0.011 –
D 27.53% 651,791 0.91 46 0.069 51.75% 2.40 × 10¹⁰ 0.969 ±0.026 0.001 ± 0.008 –
8 P Ciumai, Rep. of 51.70% 712,417 2.76 44 0.149 90.20% 2.73 × 10¹¹ 0.994 ± 0.005 −0.009 ± 0.003 0.004
MDE Moldova 0.74% 223,292 0.17 45 0.077 19.00% 3.92 × 10⁸ 0.997 ± 0.003 −0.002 ± 0.023 –
WTR 4000–1000 BP 31.64% 683,354 2.54 42 0.147 87.40% 1.39 × 10¹¹ 0.954 ± 0.014 −0.01 ± 0.005 0.007
9 P Polgár-Ferenci- 43.68% 716,356 2.53 45 0.130 86.70% 1.73 × 10¹¹ 0.989 ± 0.007 −0.003 ± 0.006 –
MDE hát, Hungary 0.69% 33,735 0.02 44 0.163 3.40% 1.20 × 10⁷ 0.936 ± 0.028 – –
WTR 7280–7035 BP 6.81% 335,725 0.32 39 0.196 27.10% 2.22 × 10⁹ 0.987 ± 0.007 0.011 ± 0.011 –
D 5.59% 158,345 0.12 39 0.229 13.74% 4.09 × 10⁸ 0.977 ± 0.010 0.007 ± 0.021 –
10 P Polgár-Ferenci- 35.59% 726,484 2.67 45 0.124 88.60% 1.88 × 10¹¹ 0.992 ± 0.006 −0.002 ± 0.006 0.008
MDE hát, Hungary 38.90% 654,431 0.92 50 0.080 53.70% 8.43 × 10⁹ 0.988 ± 0.008 −0.008 ± 0.011 0.008
WTR 7280–7035 BP 1.92% 425,428 0.41 47 0.068 33.70% 3.32 × 10⁹ 0.990 ± 0.007 −0.001 ± 0.006 0.009
(continued)Table 1. Continued
Number
of C-to-T
sequences Median damage Complexity Rate of
aligning length of rate at the (percentage mitochondrial
to the sequences 5′ end of of unique match to the Contamination
1240k Coverage aligning to molecules reads out of consensus Autosomal rate (assessed
Downloaded from genome.cshlp.org on February 13, 2021 - Published by Cold Spring Harbor Laboratory Press
targeted on 1240k the human aligning to 1,000,000 (95% contamination in genetic
Method Percent nuclear autosomal genome the human sequenced Complexity confidence rate males via
applied/ Sample origin endogenous sites targets (bp) genome reads) (informative interval) (contamLD) ANGSD)
Element and age (years (precapture (captured (captured (precapture (precapture (captured sequence (captured (captured (captured
Individual typea before present) libraries) libraries) libraries) libraries) libraries) libraries) content) libraries)b libraries)b libraries)b
11 MDE Kesznyéten- 44.35% 501,547 0.57 51 0.122 34.30% 5.09 × 10⁹ 0.985 ± 0.008 0.013 ± 0.019 –
WTR Szérű skert, 24.54% 454,947 0.5 50 0.135 31.20% 2.63 × 10⁹ 0.983 ± 0.008 −0.008 ± 0.022 –
Hungary
2600–2400 BP
12 MDE Kesznyéten- 38.54% 203,330 0.19 45 0.187 14.00% 1.83 × 10⁹ 0.972 ± 0.019 −0.059 ± 0.03 –
WTR Szérű skert, 4.64% 223,768 0.21 46 0.176 15.60% 3.15 × 10⁹ 0.994 ± 0.005 −0.083 ± 0.044 –
Hungary
2600–2400 BP
13 MDE Kesznyéten- 25.12% 478,265 0.56 41 0.177 32.40% 1.58 × 10⁹ 0.995 ± 0.004 0.015 ± 0.017 0.009
WTR Szérű skert, 2.52% 56,389 0.05 46 0.190 4.70% 7.08 × 10⁸ 0.994 ± 0.005 – –
Hungary
2600–2400 BP
14 MDE Kesznyéten- 69.20% 645,264 0.91 45 0.145 45.80% 1.48 × 10¹⁰ 0.983 ± 0.010 0.006 ± 0.014 –
WTR Szérű skert, 29.45% 487,615 0.55 48 0.144 32.80% 5.61 × 10⁹ 0.982 ± 0.010 −0.016 ± 0.021 –
Hungary
2600–2400 BP
15 MDE Kesznyéten- 4.02% 9275 0.01 50 0.190 1.00% 3.43 × 10⁸ 0.845 ± 0.076 – –
WTR Szérű skert, 2.16% 2523 0 62 0.144 0.00% 4.28 × 10⁸ 0.886 ± 0.075 – –
Hungary
2600–2400 BP
Minimally destructive DNA extraction from teeth
16 MDE Mező keresztes- 6.30% 48,824 0.04 45 0.225 4.00% 6.69 × 10⁸ 0.954 ± 0.022 – –
WTR Cethalom, 1.55% 5369 0.01 59 0.162 0.00% 1.95 × 10⁹ 0.983 ± 0.014 – –
Hungary
2770–2494 BP
17 MDE Hajdúdorog- 54.62% 213,244 0.2 51 0.148 15.10% 1.99 × 10⁹ 0.978 ± 0.011 0.026 ± 0.038 –
WTR Szállásföld, 25.66% 443,564 0.55 37 0.299 33.20% 1.69 × 10¹⁰ 0.992 ± 0.006 0.003 ± 0.011 –
Hungary
3700–2800 BP
18 MDE Polgár 12.27% 198,726 0.19 44 0.184 14.20% 1.50 × 10⁹ 0.987 ± 0.009 −0.045 ± 0.033 –
WTR Kenderföld, 37.08% 409,177 0.43 47 0.181 26.60% 4.55 × 10⁹ 0.991 ± 0.006 0.011 ± 0.021 0.012
Hungary
4300–3600 BP
Genome Research
19 MDE Köröm- 25.75% 116,478 0.11 46 0.161 8.80% 8.29 × 10⁸ 0.974 ± 0.016 – –
www.genome.org
WTR Kápolnadomb, 1.16% 83,929 0.07 48 0.179 6.80% 9.45 × 10⁸ 0.985 ± 0.008 – –
Hungary
3700–2800 BP
20 MDE Besenyszög 63.90% 230,522 0.22 55 0.081 16.30% 1.29 × 10⁹ 0.989 ± 0.008 0.062 ± 0.015 –
WTR Berek-ér partja, 59.50% 500,669 0.66 39 0.155 37.20% 1.58 × 10⁹ 0.971 ± 0.015 −0.029 ± 0.015 –
Hungary
2250–2150 BP
(continued)
56
Harney et al.
Genome Research
www.genome.org
Table 1. Continued
Number
Downloaded from genome.cshlp.org on February 13, 2021 - Published by Cold Spring Harbor Laboratory Press
of C-to-T
sequences Median damage Complexity Rate of
aligning length of rate at the (percentage mitochondrial
to the sequences 5′ end of of unique match to the Contamination
1240k Coverage aligning to molecules reads out of consensus Autosomal rate (assessed
targeted on 1240k the human aligning to 1,000,000 (95% contamination in genetic
Method Percent nuclear autosomal genome the human sequenced Complexity confidence rate males via
applied/ Sample origin endogenous sites targets (bp) genome reads) (informative interval) (contamLD) ANGSD)
Element and age (years (precapture (captured (captured (precapture (precapture (captured sequence (captured (captured (captured
Individual typea before present) libraries) libraries) libraries) libraries) libraries) libraries) content) libraries)b libraries)b libraries)b
21 MDE Dereivka, Ukraine 71.06% 750,807 1.2 45 0.236 51.90% 1.41 × 10⁹ 0.959 ± 0.014 −0.011 ± 0.009 –
WTR 8392–7927 BP 3.90% 150,735 0.14 44 0.229 11.00% 2.21 × 10⁹ 0.978 ± 0.011 – –
22 MDE Dereivka, Ukraine 0.42% 533 0 42 0.152 0.00% – – – –
WTR 7500–6800 BP 1.38% 23,239 0.02 37 0.291 2.10% 4.07 × 10⁸ 0.860 ± 0.062 – –
23 MDE Ekven, Russia 51.31% 615,980 0.83 51 0.045 44.40% 9.50 × 10⁸ 0.987 ± 0.009 0.034 ± 0.012 0.000
WTR 1400–900 BP 16.37% 314,638 0.32 44 0.103 22.40% 3.99 × 10⁹ 0.990 ± 0.008 −0.048 ± 0.033 0.008
24 MDE Ekven, Russia 3.44% 306,064 0.31 52 0.062 22.20% 3.38 × 10⁹ 0.983 ± 0.008 −0.03 ± 0.046 0.007
WTR 1030–790 BP 26.22% 636,393 0.85 56 0.043 44.20% 7.79 × 10⁹ 0.979 ± 0.008 0.071 ± 0.015 0.003
25 MDE Ekven, Russia 36.82% 284,448 0.28 49 0.044 19.80% 1.65 × 10⁸ 0.992 ± 0.005 0.006 ± 0.018 –
WTR 1380–1010 BP 65.86% 821,749 1.57 53 0.051 62.80% 2.04 × 10⁹ 0.989 ± 0.006 −0.03 ± 0.017 0.001
26 MDE Uelen, Russia 34.43% 496,909 0.59 45 0.049 34.60% 9.06 × 10⁸ 0.991 ± 0.005 0.038 ± 0.029 –
WTR 1100–750 BP 1.38% 236,589 0.23 52 0.071 17.70% 2.41 × 10⁹ 0.997 ± 0.003 0.109 ± 0.049 –
27 MDE Ekven, Russia 59.86% 470,046 0.52 50 0.039 31.10% 3.98 × 10⁸ 0.995 ± 0.005 0.004 ± 0.034 0.008
WTR 1310–930 BP 48.05% 486,910 0.55 50 0.082 33.10% 5.27 × 10⁹ 0.998 ± 0.003 −0.022 ± 0.031 0.006
28 MDE Ekven, Russia 62.18% 288,212 0.28 50 0.107 19.40% 2.17 × 10⁹ 0.995 ± 0.004 −0.047 ± 0.036 −0.001
WTR 6350–6260 BP 15.19% 238,870 0.23 49 0.092 17.20% 1.33 × 10⁹ 0.998 ± 0.002 0.061 ± 0.043 –
29 MDE Ust Belaya,Russia 26.08% 359,586 0.37 43 0.065 24.40% 5.41 × 10⁸ 0.990 ± 0.006 −0.01 ± 0.027 −0.002
WTR 4840–4490 BP 18.30% 241,115 0.23 50 0.071 17.60% 3.39 × 10⁸ 0.991 ± 0.005 −0.069 ± 0.026 –
30 MDE Volosovo- 62.43% 220,045 0.21 46 0.080 15.40% 1.60 × 10⁹ 0.992 ± 0.008 −0.032 ± 0.045 –
WTR Danilovo, 40.05% 448,058 0.49 48 0.119 29.90% 6.04 × 10⁹ 0.997 ± 0.003 0.003 ± 0.013 0.015
Russia
4000–2000 BP
All estimates are made based on data produced from libraries that underwent the 1240k capture unless otherwise specified.
a
Sampling/extraction methods: (P) Powdered petrous bone (Pinhasi et al. 2019), standard extraction (Dabney et al. 2013a); (MDE) tooth root processed via Minimally Destructive Extraction; (WTR)
Whole Tooth Root, powdered with standard extraction (Dabney et al. 2013a); (D) Damgaard cementum extraction (Damgaard et al. 2015). Extracts for individuals 1–10 were processed entirely man-
ually and underwent partial UDG treatment followed by double-stranded library preparation, whereas extracts for individuals 11–30 were processed robotically following incubation in extraction
buffer (Rohland et al. 2018, buffer D) and processed using USER treatment followed by single-stranded library preparation.
b
Contamination estimates are not reported for samples which did not produce sufficient quality data to generate a contamination estimate based on either mitochondrial, autosomal, or X
Chromosome data. For X Chromosome–based contamination estimates, ANGSD can only estimate contamination rates for individuals determined to be genetically male. Individuals who are female
or for whom sex cannot be determined (sex ND) are noted.
c
Note that sample 3P was excluded from comparisons as it was determined bioinformatically that the petrous bone and tooth sampled did not originate from the same individual. Note also that the
DNA preservation in samples 5 and 6 was too poor for further analysis.Downloaded from genome.cshlp.org on February 13, 2021 - Published by Cold Spring Harbor Laboratory Press
Minimally destructive DNA extraction from teeth
method (Method MDE) to that produced by the destructive, tradi- tooth root, which is targeted by the MDE method, contains a high-
tional sampling methods (Methods WTR and P), using a Wilcoxon er proportion of endogenous molecules than other portions of the
signed-rank test. The null hypothesis is that the difference be- tooth root (Damgaard et al. 2015). In contrast, we do not observe a
tween pairs of data generated using Method MDE and Method significant difference in the proportion of endogenous molecules
WTR or P follows a symmetric distribution around zero. The alter- between Methods MDE and P (P-value = 1.000) (Supplemental
native hypothesis is that the difference between the paired data Fig. S2A), with an average of 36.4% endogenous molecules ob-
does not follow a symmetric distribution around zero. A threshold served when sampling from the petrous. These results are again
of P-value = 0.05 is used to denote significance which can only be consistent with claims that the petrous and tooth cementum
achieved if there are a minimum of six samples represented in each both contain relatively high proportions of endogenous molecules
test for which the data can be compared. As there were only four (Damgaard et al. 2015; Hansen et al. 2017). Although the high pro-
samples processed using Method D, we were unable to perform portion of endogenous molecules obtained using the MDE meth-
statistical comparisons involving these data. od is promising, measuring the fraction of endogenous molecules
in a sample does not tell us about the total amount of DNA ob-
tained using each method.
Extraction efficiency We therefore consider the overall complexity—the number of
In order to assess the efficiency of the minimally destructive ex- unique molecules contained within a single library—using two
traction method, we first compare the proportion of endogenous metrics. In the first metric, we consider the proportion of unique
molecules (i.e., molecules that align to the human reference ge- molecules sequenced in each sample, after down-sampling to
nome, hg19) in samples produced using each extraction method 1,000,000 sequences that align to the 1.24 million SNPs targeted
and sequenced via shotgun (i.e., precapture) sequencing. during capture (Fig. 2B). This is a useful metric for comparison be-
Although we observe a high degree of variability (Fig. 2A; Table tween samples as it is not biased by differences in sequencing
1) between treatment types for each individual, there is a statisti- depth across samples. However, as this metric is calculated using
cally significant difference in the proportion of endogenous mol- sequence data for samples that underwent targeted enrichment
ecules sequenced using the MDE and WTR methods (P-value = capture, a process that may introduce bias into the data, we there-
0.004), with an average of 35.8% and 18.8% endogenous mole- fore also consider a second complexity metric, the informative
cules for each extraction method, respectively. These results sup- sequence content (Fig. 2C; Glocke and Meyer 2017). This me-
port previous assertions that the outer cementum layer of the tric quantifies the relative proportion of molecules that were
A B
C D
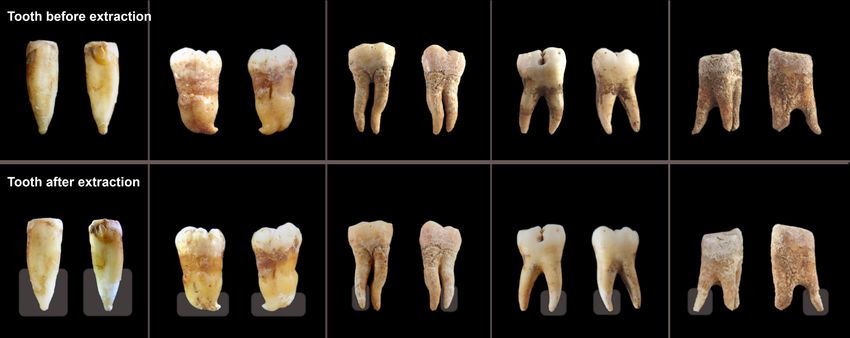
Figure 2. Sample quality. A comparison of the quality of data produced by WTR (Whole Tooth Root) and MDE (Minimally Destructive Extraction) meth-
ods in samples that passed quality filtering. (A) The proportion of endogenous molecules in data obtained via shotgun sequencing. (B) The complexity of
each sample, as measured by the proportion of unique reads out of 1,000,000 reads sequenced. Asterisks indicate that the total number of unique reads
sequenced was below 1,000,000 for the specified sample, and therefore complexity estimates could not be generated. (C) The complexity of each sample,
as measured by informative sequence content. (D) The rate of contamination is compared by considering the rate of matching to mitochondrial consensus
sequence. Error bars indicate the 95% confidence interval. Only samples that passed quality screening are shown. Plots showing comparisons with samples
generated using Method P are shown in Supplemental Figure S2.
Genome Research 7
www.genome.orgDownloaded from genome.cshlp.org on February 13, 2021 - Published by Cold Spring Harbor Laboratory Press
Harney et al.
successfully amplified from each sample using quantitative PCR breakdown of linkage disequilibrium in a sequenced individual,
(qPCR) analysis. The results are calibrated using the proportion a process which is accelerated by increased contamination. We
of endogenous molecules and average length of molecules mea- again estimate relatively low rates of contamination across all
sured in the shotgun sequencing data, reflecting the number of se- samples and find no significant difference in contamination rates
quences in the DNA extracts that can be aligned to the human between Methods MDE and WTR (P-value = 0.490) or between
genome. Methods MDE and P (P-value = 0.893).
Neither complexity metric finds a statistically significant dif- We also estimate contamination rates in the individuals who
ference between complexity measured in samples prepared using are identified as genetically male using ANGSD (Korneliussen et al.
Method MDE versus Method WTR (P-value = 0.792 and 0.107, for 2014). We obtain low estimates of contamination (≤2.5%) across
the first and second complexity metrics, respectively), suggesting all male samples (Table 1). Comparing the X Chromosome con-
that using a minimally destructive extraction method does not re- tamination estimates for the six genetically male individuals for
sult in loss of genetic data when sampling from teeth (Fig. 2B; Table whom there was enough data to produce estimates for both treat-
1). Although we find no statistically significant difference between ment types, we do not detect a significant difference between the
samples prepared using Method MDE versus Method P using the MDE and WTR methods (P-value = 0.293). Taken together, these
first complexity metric (P-value = 0.091), we do detect a significant three estimates of contamination suggest that, in practice, the
difference using the second metric (P-value = 0.043) (Supplemental UV and bleach decontamination protocol used for the MDE
Fig. S2B,C). We note that the power of this analysis is limited due method performs similarly to the physical surface removal decon-
to the low number of comparisons we were able to make (N = tamination steps implemented in the destructive protocols and is
7); therefore, this comparison may warrant further study, parti- sufficient to produce ancient DNA data of analyzable quality.
cularly because previous studies have found that the rates of an- We considered the read length distribution and frequency of
cient DNA preservation in cementum versus petrous samples are C-to-T damage in the terminal bases of reads that aligned to the
dependent upon sample preservation (Hansen et al. 2017). human genome (hg19) that were obtained via shotgun sequencing
(i.e., precapture). Authentic ancient DNA is thought to consist of
characteristically short fragments, with very few reads longer
Contamination rate than 100 base pairs (Sawyer et al. 2012; Dabney et al. 2013b;
We were concerned that extracting ancient DNA directly from the Glocke and Meyer 2017); therefore, the read length distribution
outer layer of the tooth root might result in a higher rate of con- is used as a general metric to assess ancient DNA authenticity.
tamination in the sample, especially due to the increased potential We find that all samples appear to have read length profiles char-
for exposure of this region to contaminants during handling. acteristic for authentic ancient DNA (Supplemental Fig. S3), and
Standard sampling protocols typically involve the physical remov- we do not observe a significant difference in median length of
al of the outermost layer of bone or tooth prior to sampling, using a reads obtained using methods MDE and WTR (P-value = 0.375).
sanding disc or a sandblaster, whereas the minimally destructive A weakly significant difference is observed between reads obtained
extraction method specifically targets this outer layer following a using Methods MDE and P (P-value = 0.034) (Table 1), consistent
superficial chemical (bleach) and brief (5–10 min) ultraviolet with previous observations of systematic differences between
decontamination. We therefore compare the relative contamina- DNA preservation in petrous and cementum samples (Parker
tion rates between sampling methods using a variety of metrics. et al. 2020); however, we also note that the use of a bleach-based
First, we compare the rate of matching to the mitochondrial con- decontamination step in the MDE protocol may have contributed
sensus sequence (Fu et al. 2013). A minimum threshold of 95% to this observed pattern.
is typically applied during screening of ancient DNA for popula- Endogenous ancient DNA samples are also thought to exhibit
tion genetic studies. We observe substantial variability in contam- a high rate of C-to-T damage, particularly in the terminal bases.
ination rate between and within individuals for all treatment Using a partial or USER UDG treatment for double-stranded
methods (Fig. 2D; Table 1). Although we detect a significant differ- and single-stranded libraries, respectively (Rohland et al. 2015;
ence between mitochondrial match to consensus rates between Gansauge et al. 2020), we removed this damage in the interior
the MDE and WTR methods (P-value = 0.004), the average differ- of each molecule, while retaining it in the terminal bases.
ence between these two methods is small (97.0% and 98.2%, re- Therefore, we are able to use the frequency of these errors to assess
spectively). Notably, this signal appears to be driven by less well- ancient DNA authenticity. For samples processed using methods
preserved samples. If we restrict to only comparisons where both MDE and WTR (P-value = 0.249), we observe no significant differ-
samples have a minimum of 10% endogenous DNA (n = 13), we ence in the frequencies of C-to-T damage in terminal bases at the
do not detect a significant difference in mt match to the consensus 5′ end of molecules that aligned to the human genome (hg19), ob-
rate between the two extraction methods (P = 0.09), and if we raise tained via shotgun sequencing. However, the distribution of dam-
this minimum threshold to 20% endogenous (n = 7), the compar- age rates in samples processed using Method P is significantly
ison becomes even less significant (P = 0.87). Conversely, if we ex- different from Method MDE (P-value = 0.028), with higher rates
amine only the most poorly preserved specimens by restricting to of damage observed in libraries produced using Method P in
cases where both samples have a maximum percent endogenous of most (8/9) cases, again suggesting that there may be systematic dif-
30% (n = 9), we still observe a significant difference between the ferences between DNA preservation in petrous and tooth samples
two treatments (P = 0.03), suggesting that the loss of significance (Table 1; Supplemental Figs. S4, S5).
observed in the most well-preserved samples is not the result of a Although we were unable to perform statistical comparisons
loss of statistical power due to the smaller number of samples an- between the two cementum targeting methods (MDE and D) due
alyzed. Further, we observe no significant difference between to the small sample size, we note that we observed substantial var-
Methods MDE and P (P = 0.310) (Supplemental Fig. S2D). iability between the performance of these two methods across all
Next, we estimate the autosomal rate of contamination, using metrics (Supplemental Fig. S1; Supplemental Table S1). For all of
the tool ContamLD (Nakatsuka et al. 2020), which measures the the comparisons that we highlight (endogenous proportion, mt
8 Genome Research
www.genome.orgDownloaded from genome.cshlp.org on February 13, 2021 - Published by Cold Spring Harbor Laboratory Press
Minimally destructive DNA extraction from teeth
contamination rate, and both measures of complexity), neither contamination rates between samples processed using this mini-
method outperformed the other for all individuals in any category. mally destructive decontamination and sampling method and
These results suggest that both of these approaches are capable of those processed using standard destructive methods. Further,
producing high quality ancient DNA data, although further study these results suggest that this protocol, which includes a bleach-
would be required to determine whether either method is optimal based decontamination step, does not significantly reduce DNA
from a data quality perspective. However, we emphasize that our yields as compared to the WTR protocol, which does not involve
primary concern in describing Method MDE is to produce the use of bleach. These results contrast with previously described
an alternative, minimally destructive ancient DNA sampling bleach-based decontamination methods that involve soaking the
approach. Like Method WTR, Method D involves the complete sample in bleach for an extended period of time (e.g., Higgins
morphological destruction of the sampled tooth root and is there- et al. 2013), in which a substantial reduction in DNA yield was ob-
fore not comparable to Method MDE from a preservation served. By targeting the outer cementum tooth surface directly,
standpoint. this method maximizes the proportion of cementum matrix
Finally, we were concerned that the use of parafilm to cover which is being digested and minimizes the amount of dentine
portions of the tooth roots that we did not want exposed to the ex- sampled when compared to other cementum-targeting methods
traction buffer could serve as a possible source of contamination. (Damgaard et al. 2015) which sample a significant proportion
We therefore created a parafilm extraction control, in which a of the inner dentine layer in addition to the cementum.
small strip of parafilm (comparable in size to that used for covering Furthermore, we find that parafilm can be used to protect portions
the tooth roots) was added to a tube of extraction buffer and under- of the tooth that users do not wish to sample (i.e., the tooth crown)
went sample processing along with the MDE samples and regular from significant exposure to the extraction buffer without increas-
extraction blanks. We observe very few reads associated with this ing contamination rates.
parafilm blank (Supplemental Table S1), suggesting that the use Although these results show that this minimally destructive
of parafilm does not serve as a significant source of contamination approach is a promising alternative to destructive sampling meth-
in the MDE method. ods that are traditionally applied to ancient teeth, we stress that
further research is needed to determine whether it is recommend-
ed to opt for this sampling method in all circumstances.
Discussion Particularly, we note that the majority of teeth chosen for this
This minimally destructive sampling protocol enables extraction analysis were of moderate to excellent preservation status. The
of ancient DNA from the cementum portion of tooth roots that two most poorly preserved individuals included in this study con-
is of similar quality to ancient DNA obtained from teeth using tra- tained too little DNA to allow for comparisons to be made between
ditional, destructive sampling methods that rely on powder pro- Methods MDE and WTR, and the tooth roots processed via
duced through drilling or cutting and powdering. This is true Method MDE sustained damage during processing. Further study
with regard to both the amount of DNA that it is possible to obtain of the utility of this method on less well-preserved teeth is there-
and the levels of contamination detected in the samples. In con- fore of great interest.
trast, our results suggest that DNA sampled from the petrous We also note that this method may not be optimal for re-
bone exhibits more complexity than DNA sampled from the tooth searchers who are interested in co-analyzing ancient pathogen
cementum, indicating that there is still justification for choosing DNA. This minimally destructive protocol targets the outer cemen-
to sample from petrous bones over teeth when trying to maximize tum layer of the tooth root, whereas ancient pathogen DNA is of-
the chances of successfully sequencing ancient DNA, particularly ten best preserved in the inner pulp layer of teeth, which is highly
in cases where sample preservation is poor—a circumstance in vascularized and therefore more likely to be exposed to pathogens
which ancient DNA sampled from petrous has previously been that are carried in the blood during the individual’s life (Margaryan
found to be of higher quality than in cementum (Hansen et al. et al. 2018). Therefore, sampling the entire tooth root (or the den-
2017). However, the physical damage to the sampled tooth is sub- tal pulp specifically) may be a better option for researchers who
stantially reduced and the overall morphological integrity of the hope to obtain pathogen DNA in their analyses. This is another im-
sampled tooth is retained (with minimal degradation of the outer portant factor that custodians of skeletal remains should consider
layer of the tooth root that is exposed to the extraction buffer) when making decisions about which ancient DNA sampling pro-
when using this minimally destructive sampling protocol, making tocol best fits their needs.
this an optimal sampling method of teeth in cases where sample As the impact on gross dental morphology is minimal, this
preservation is of the highest priority. The decision to use this min- approach enables the preservation of samples for future morpho-
imally destructive method therefore requires an assessment of cu- logical analyses. Furthermore, previous studies have shown that
ratorial needs to maximize preservation versus the likelihood of exposure to the chemicals used for ancient DNA extraction (name-
obtaining analyzable data from the specimen. ly EDTA and Proteinase K) do not affect a specimen’s suitability for
One of the major concerns surrounding an extraction proto- subsequent biochemical analyses, such as radiocarbon (AMS C14)
col that targets the outer surface of an ancient sample is the poten- dating (Korlević et al. 2018). Therefore, teeth processed using this
tial for an increase in contamination, as this outer surface may minimally destructive protocol would remain suitable for future
come in direct contact with various contaminants, particularly biochemical analyses.
during handling. Because the majority of samples selected for an- This minimally destructive extraction method significantly
cient DNA analysis have been excavated and manipulated without reduces the amount of physical destruction caused by ancient
any consideration for potential future genetic studies, this is of par- DNA extraction, creating no holes or cuts in the sampled tooth
ticular concern. Although destructive methods physically remove or bone, while also shortening the overall length of the extraction
the outermost layer of bones and teeth to reduce contamination, protocol, without meaningfully increasing the amount of contam-
we instead applied a bleach and UV decontamination procedure ination. This method therefore may make it possible to extract an-
to the tooth before processing. We detected little difference in cient DNA from individuals that would otherwise be unavailable
Genome Research 9
www.genome.orgDownloaded from genome.cshlp.org on February 13, 2021 - Published by Cold Spring Harbor Laboratory Press
Harney et al.
for ancient DNA study due to the destructive nature of traditional 2007) with the exposed portion pointing down and incubated
sampling methods. for 2.5 h at 37°C, shaking gently. Following incubation, the roots
were removed from the extraction buffer, which was then pro-
cessed according to standard ancient DNA extraction procedures.
Methods Samples from individuals 1–10 underwent manual ancient
DNA extraction, as described in Dabney et al. (2013a), with mod-
All ancient DNA analyses were performed in dedicated clean
ifications. The MinElute columns were replaced with a pre-assem-
rooms at the University of Vienna and Harvard Medical School.
bled spin column device (Roche) (as described in Korlević et al.
For individuals 1–10, skeletal sampling, preparation, and DNA ex-
2015). We washed with 650 µL of PE buffer (Qiagen) and spun at
traction were performed at the University of Vienna. Library prep-
6000 rpm for 1 min. Following dry spin, we isolated the DNA by
aration, targeted enrichment capture, and sequencing were
placing the spin column in a fresh 1.5-mL collection tube, and
performed at Harvard Medical School. For individuals 11–30, skel-
25 µL TET buffer was pipetted onto the column’s silica membrane,
etal sampling was performed at the University of Vienna, while all
which was incubated at room temperature for 10 min and then
other processing was performed at Harvard Medical School.
spun at maximum speed for 30 sec. We repeated this step, produc-
ing a total of 50 µL of DNA extract. Samples from individuals 11–
Sampling 30 underwent robotic extraction following incubation, using the
We selected skeletal elements from 30 ancient individuals of vary- robotic protocol described in Rohland et al. (2018), using binding
ing archaeological age, geographic origin, and degree of preserva- buffer D.
tion for analysis (Table 1). From each individual, we selected a For samples processed using Methods WTR, P, and D, sam-
single multirooted tooth for sampling. For the first 10 individuals, pled powders were incubated overnight (∼18 h) in extraction buff-
we also selected a temporal bone for sampling. We UV-irradiated er at 37°C, with gentle shaking. For samples from individuals 1–10,
each tooth in a cross-linker for 5–10 min on each side, in order up to 50 mg powder was incubated in 1 mL extraction buffer,
to remove as much surface contamination as possible. We then which then underwent manual extraction, as described above.
cut off the roots of each tooth using a diamond cutting disc and For samples from individuals 11–30, ∼37 mg of bone powder
a hand-held Dremel drill, treating each root separately in all subse- was incubated in 750 µL extraction buffer and then underwent ro-
quent analyses. From each individual, we randomly selected one botic extraction, as described above.
tooth root (Method MDE) for minimally destructive extraction. Negative controls were prepared alongside ancient DNA ex-
These tooth roots were subject to additional surface cleaning by tracts for all extraction batches. In each case, extraction buffer
wiping the teeth clean with a 2% bleach solution and rinsing was added to an empty tube prior to incubation, and the negative
with 95% ethanol, followed by UV-irradiation for 5–10 min on control was treated identically to all other samples during subse-
each side. We prepared the second set of tooth roots (Method quent processing. Additionally, we generated one parafilm extrac-
WTR) by removing the extreme outer surface of each tooth root us- tion control, by incubating a piece of UV-decontaminated
ing a sanding disc and drill, and milling the root in a Retsch parafilm in extraction buffer overnight in order to determine
MM400 mixer mill for a total of 60 sec with a 10-sec break after whether the parafilm coverings used to protect the ends of the
30 sec to produce a powder. For the four triple-rooted teeth includ- tooth roots might be a potential source of contamination.
ed in the first round of sampling (from individuals 1, 2, 7, and 9), Following incubation in the extraction buffer, the roots were
we performed a drilling-based targeted cementum extraction as de- rinsed with 95% ethanol in order to remove any remaining extrac-
scribed in Damgaard et al. (2015), first removing the extreme outer tion buffer and air-dried at room temperature for 24 h. The samples
surface of the tooth root using a sanding disc and dentistry drill, were then reweighed to assess the total amount of dental material
and then removing as much of the interior pulp and dentine por- digested.
tion of the tooth root as possible using a dental drill and burr. The
remaining outer portion of the tooth root, which is enriched in ce-
Library preparation, enrichment, and sequencing
mentum relative to the root as a whole, was milled to produce a
powder. We note that, although there may be underlying differ- We prepared double-stranded (samples 1–10) or single-stranded
ences in the DNA preservation in the individual roots of each (samples 11–30) libraries from 10 µL of each extract using UDG-
tooth, due to the random assignment of each individual’s tooth treatment methods, as described in Rohland et al. (2015) and
roots to each treatment, we do not expect this preservation vari- Gansauge et al. (2020), respectively. These methods remove an-
ability to bias the results of subsequent statistical analyses. cient DNA damage at the interior of each DNA sequence, while
Additionally, we obtained ∼50 mg of bone powder from the pe- preserving characteristic ancient DNA damage at the terminal
trous portion of each of the 10 selected temporal bones, using stan- ends of the molecules, to be used for ancient DNA authentication
dard methods (Method P) (Pinhasi et al. 2019). during bioinformatic processing. We enriched libraries for human
DNA via targeted enrichment of the mitochondrial genome
and at 1.24 million SNP sites that are informative for population
DNA extraction genetic analyses (Fu et al. 2015; Haak et al. 2015; Mathieson
We prepared selected tooth roots (Method MDE) for minimally de- et al. 2015). Following enrichment, libraries were sequenced on
structive extraction by recording the initial weight of the tooth an Illumina NextSeq 500 machine, with 2 × 76 or 2 × 101 cycles,
root, then isolating the targeted portion of the tooth root using with an additional 2 × 7 or 2 × 8 cycles used for identification
parafilm (Supplemental Fig. S6; see Supplemental Note S1 for a of indices, for double-stranded and single-stranded libraries,
step-by-step description of the minimally destructive extraction respectively.
method). We targeted the lower portion of the tooth root, where
cellular cementum is concentrated. All other surfaces were
wrapped in UV-decontaminated parafilm in order to prevent sig- Bioinformatic processing
nificant contact with the extraction buffer. The tooth roots were We trimmed molecular adapters and barcodes from sequenced
placed in 750 µL–1 mL of extraction buffer (0.45 M EDTA, 0.25 reads, and the merged paired-end reads, requiring an overlap of
mg/mL Proteinase K, pH 8.0) (defined in Rohland and Hofreiter 15 base pairs (allowing up to three mismatches of low base quality
10 Genome Research
www.genome.orgYou can also read