Characterizing Bushfire Occurrences over Jamaica Using the MODIS C6 Fire Archive 2001-2019
←
→
Page content transcription
If your browser does not render page correctly, please read the page content below
atmosphere

Article
Characterizing Bushfire Occurrences over Jamaica Using the
MODIS C6 Fire Archive 2001–2019
Candice S. Charlton * , Tannecia S. Stephenson *, Michael A. Taylor and Christina A. Douglas

                                          Department of Physics, The University of the West Indies, Kingston 07 JMAAW15, Jamaica;
                                          michael.taylor@uwimona.edu.jm (M.A.T.); christina.douglas02@uwimona.edu.jm (C.A.D.)
                                          * Correspondence: candice.charlton02@uwimona.edu.jm (C.S.C.);
                                            tannecia.stephenson02@uwimona.edu.jm (T.S.S.)

                                          Abstract: There is an increasing need to develop bushfire monitoring and early warning systems for
                                          Jamaica and the Caribbean. However, there are few studies that examine fire variability for the region.
                                          In this study the MODIS C6 Fire Archive for 2001–2019 is used to characterize bushfire frequencies
                                          across Jamaica and to relate the variability to large-scale climate. Using additive mixed model and
                                          backward linear regression, the MODIS represents 80% and 73% of the local Jamaica Fire Brigade
                                          (JFB) data variability for 2010–2015, respectively. However, the MODIS values are smaller by a factor
                                          of approximately 30. The MODIS climatology over Jamaica reveals a primary peak in March and a
                                          secondary maximum in July, coinciding with months of minimum rainfall. A significant positive
                                          linear trend is observed for July-August bushfire events over 2001–2019 and represents 29% of the
                                          season’s variability. Trends in all-island totals in other seasons or annually were not statistically
                                          significant. However, positive annual trends in Zone 2 (eastern Jamaica) are statistically significant
                                and may support an indication that a drying trend is evolving over the east. Significant 5-year and 3.5-

                                          year periodicities are also evident for April–June and September–November variability, respectively.
Citation: Charlton, C.S.; Stephenson,     Southern Jamaica and particularly the parish of Clarendon, known for its climatological dryness,
T.S.; Taylor, M.A.; Douglas, C.A.         show the greatest fire frequencies. The study provides evidence of linkages between fire occurrences
Characterizing Bushfire Occurrences       over Jamaica and oceanic and atmospheric variability over the Atlantic and Pacific. For example,
over Jamaica Using the MODIS C6           all-island totals show relatively strong association with the Atlantic Multidecadal Oscillation. The
Fire Archive 2001–2019. Atmosphere
                                          study suggests that development of an early warning system for bushfire frequency that includes
2021, 12, 390. https://doi.org/
                                          climate indices is possible and shows strong potential for fire predictions.
10.3390/atmos12030390

                                          Keywords: Caribbean; bushfires; MODIS; wavelet; climate; Jamaica; fire variability; SIDs
Academic Editor: Luis Gimeno

Received: 20 February 2021
Accepted: 11 March 2021
Published: 17 March 2021                  1. Introduction
                                                Bushfires are a growing concern for small island developing states (SIDs) like Jamaica
Publisher’s Note: MDPI stays neutral      and other Caribbean islands and their occurrence each year has immense social, economic
with regard to jurisdictional claims in   and environmental impacts. From 2016 to 2019, the number of bushfires across Jamaica
published maps and institutional affil-   increased from 3716 to 5838 [1]. Fire activity may be triggered or exacerbated by the
iations.                                  prevailing climate conditions with other important influences including fuels, ignition
                                          agents and human activity [2–4]. Some climate conditions promoting fire activity include
                                          rainfall deficits, extreme temperatures, heat waves and dry windy conditions that may
                                          occur in relation to large-scale modes such as the El Niño South Oscillation (ENSO). These
Copyright: © 2021 by the authors.         promote the availability of fuels for fire as well as mechanisms for fire spread. A summary
Licensee MDPI, Basel, Switzerland.        of some major fire events in Jamaica for 2014–2019 including costs and associated prevailing
This article is an open access article    climate is shown in Table 1. While the impacts of fire events are apparently increasing
distributed under the terms and           within the Caribbean, there are few studies and reports that examine fire variability for this
conditions of the Creative Commons        region (e.g., [5–8]). Robbins [7] indicates that the Caribbean lags areas in the United States
Attribution (CC BY) license (https://     in terms of fire prediction, monitoring, education, prevention, and analysis of the effects of
creativecommons.org/licenses/by/          fire on ecosystems and society.
4.0/).

Atmosphere 2021, 12, 390. https://doi.org/10.3390/atmos12030390                                        https://www.mdpi.com/journal/atmosphere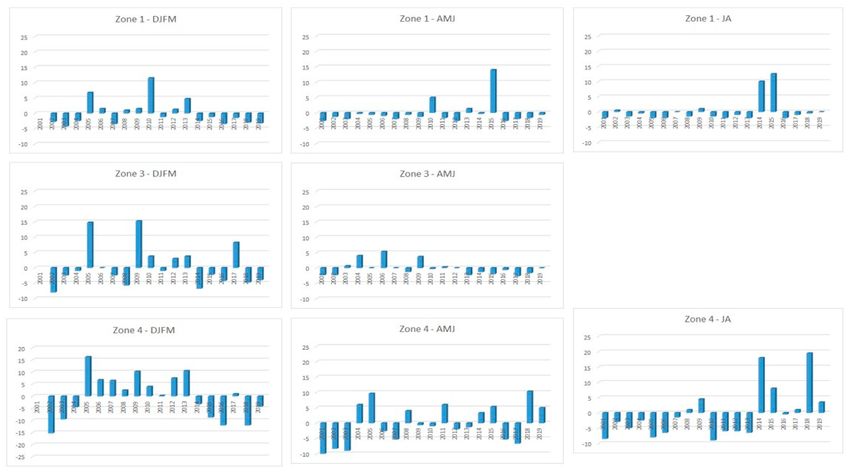
Atmosphere 2021, 12, 390                                                                                                    2 of 23

      Table 1. Some bushfire events in Jamaica between 2014–2019 as reported by The Gleaner, the Jamaica Observer and Jamaica
      Information Service. The total area burned, estimated loss at time of reporting in Jamaica Dollars and the background
      climate event are also indicated.

    Year                   Location              Total Area Burned          Estimated Loss                Climate Event
                                                                                                   Meteorological Drought (MD)
                Bull Bay, St Thomas to Mavis                              Approximately JMD         Source: CIMH Caribbean
    2014                                             200 Acres
                      Bank, St Andrew                                        136 Million           Drought Bulletin Vol 1 Issue
                                                                                                        6 November 2014
                                                                                                        Very Strong El Nino
                                                                          Approximately JMD
                                                                                                               Source:
                        St Thomas                    >247 Acres              146 Million
    2015                                                                                             http://www.bom.gov.au/
                Blue Mountain (Mavis Bank)            500 Acres           Approximately JMD
                                                                                                        climate/enso/enlist/
                                                                             300 Million
                                                                                                   (accessed on 18 August 2020)
                   Bull Bay, St Thomas
    2016         Mount Charles, St Andrew                 -                        -                             -
                  Craig Hill, St Andrew
                    Roselle, St Thomas
    2017        Pangully-Glengoffe, Cassava          >100 Acres                    -                             -
                    River St Catherine
                                                                                                             El Niño
                                                                                                              Source:
                                                                                                   https://origin.cpc.ncep.noaa.
    2019           Flagaman, St Elizabeth            >200 Acres             JMD 45 Million           gov/products/analysis_
                                                                                                   monitoring/ensostuff/ONI_
                                                                                                  v5.php (accessed on 18 August
                                                                                                               2010)

                                        Linkages between bushfire characteristics (e.g., occurrence, ignition, intensity, burned
                                  area and pattern, potential spread) and climate variability and extremes have been exam-
                                  ined globally including for North America [9], Australia [10], Portugal [11], Alaska [12],
                                  Mediterranean [13] and Hawaii [14]. These studies link wildfire frequency and area burned
                                  to droughts, heat waves, climate modes such as the ENSO and anthropogenic influences
                                  (Table 2). These studies are executed using land-based observations and satellite products
                                  such as the NASA Moderate Resolution Imaging Spectroradiometer (MODIS) fire archives
                                  to represent fire activity data. The MODIS has presented an attractive option for fire studies
                                  since ground-based observations (e.g., Burned Area) are commonly affected by periods
                                  of unavailable or poor-quality data [15,16]; difficulties in the estimations of Burned Area
                                  from field observations [17,18] and protocol changes over time [19].
                                        In this research the following questions are explored: How representative is the
                                  MODIS C6 fire archive of bushfire variability in Jamaica? What are some temporal and
                                  spatial characteristics of bushfire occurrences across the island? What are some local and
                                  large-scale climate features or phenomena that may be associated with bushfire variability
                                  across the island? The importance of this study, then, lies firstly in its contribution to
                                  the limited body of knowledge on bushfire variability and its linkages to climate in the
                                  Caribbean and SIDS in general. The work is critical as some of the hotter and drier extremes
                                  that may promote increased bushfire variability are already evident in the Caribbean. An
                                  analysis of weather and climate extremes for the Caribbean over 1961–2010 reveal increases
                                  in the annual means of daily minimum (0.28 ◦ C decade−1 ) and maximum temperatures
                                  (0.1 ◦ C decade−1 ), increased frequencies of warm days, warm nights and extreme high
                                  temperatures and decreases in the frequency of cool days, cool nights and extreme low
                                  temperatures. Small but significant positive trends were found in annual total precipitation,
                                  daily intensity, maximum number of consecutive dry days and heavy rainfall events
                                  particularly during the latter period 1986–2010 [20,21]. Other investigations have indicated
                                  an increase in the occurrence of extreme events including droughts [22].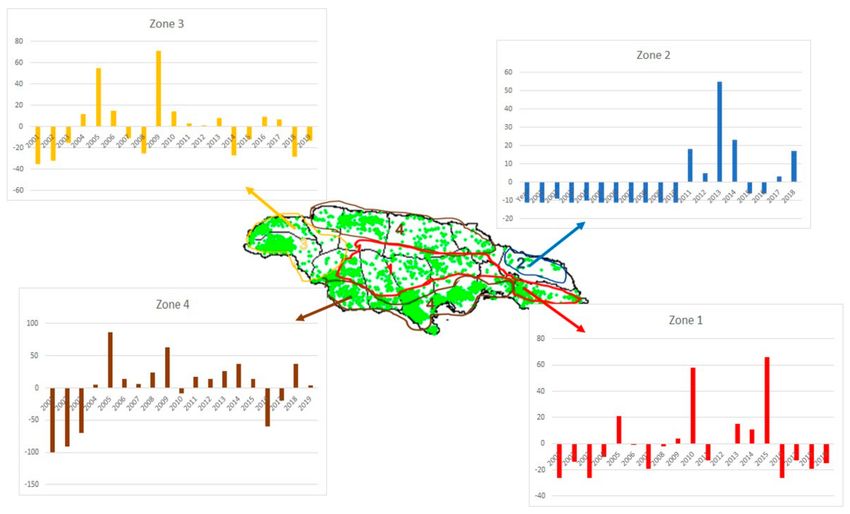
Atmosphere 2021, 12, 390                                                                                           3 of 23

                                The climate conditions that may exacerbate increased bushfire frequency are also ex-
                           pected to continue and intensify towards the middle to end of century through increases in
                           warm day and warm night occurrences and decreases in cool days and cool nights [23–26].
                           A future trend of increased daily rainfall intensity and a decrease in the proportion of total
                           rainfall from heavy rainfall events were also noted in these studies. For example, by the
                           end of the century, the Caribbean is projected to be 1.08 to 3.58 ◦ C warmer [24,27,28], with
                           95% of all days and nights considered “hot” (i.e., exceeding the 90th percentile of current
                           temperatures; [23]). Annual rainfall totals are projected to decrease by up to 30% with the
                           most pronounced drying during the Caribbean wet season from May and October [27–29].
                           This latter projected drying would have serious implications for an extension of the “fire
                           season” within the Caribbean.
                                Jamaica, through its meteorological service and the Jamaica Fire Brigade, is currently
                           undertaking efforts to develop a Bush Fire Warning Index to track, manage and record
                           bushfires. This effort is funded under the African Caribbean Pacific-European Union-
                           Caribbean Development Bank Natural Disaster Risk Management (ACP-EU-CDB NDRM)
                           program. The Index will act as a predictive tool to encourage pre-emptive action and
                           prevent fires from destroying forests, farms and the livelihoods of families across the
                           country. This is one of many efforts within Caribbean SIDS that recognizes the perceived
                           increasing impact of bushfires on Caribbean lives and livelihoods.
                                This study, therefore, is also significant as it provides baseline information in support
                           of this effort, through the quantification of fire, frequency and variability across Jamaica.
                                Data and methodology for characterizing fire activity in Jamaica are presented in
                           Section 2. Section 3 describes bushfire spatial and temporal characteristics and investigates
                           linkages with several large-scale climate phenomena that are important to climate variabil-
                           ity within the Caribbean and some local climate features important to Jamaica. Section 4
                           discusses the results and implications, including for the wider Caribbean.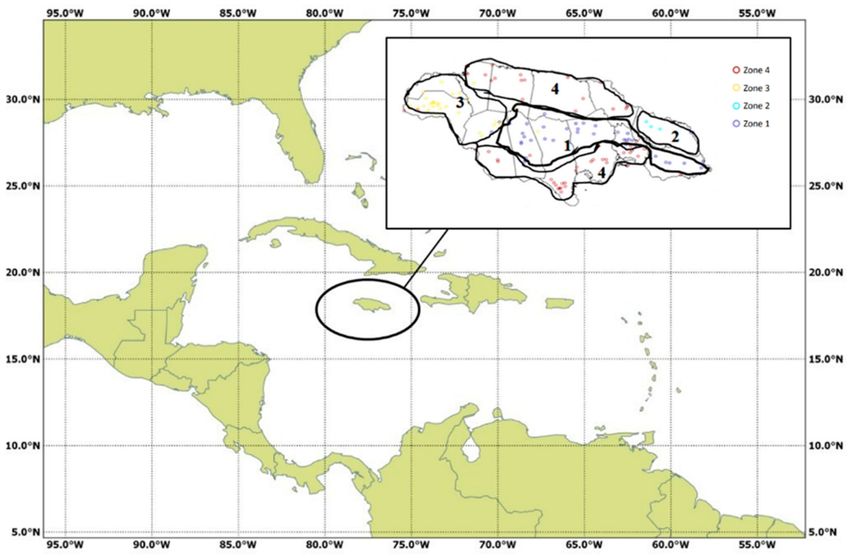
Atmosphere 2021, 12, 390                                                                                                                                                                  4 of 23

                                 Table 2. Fire characteristics and their relation to climate for some regions. Data sources and references are also shown.

             Region                               Fire Data Source/Fire Indices                                        Observations in Relation to Climate                      References
                                                                                                           •   Above normal summer temperatures linked with increased
                                                                                                               convection amounts, resulting in higher number of
                                                                                                               lightning strikes. Dry conditions in adjacent areas facilitate
                                                                                                               the spread of wildfires started by the lightning.
             Alaska                           Alaska Fire Service Data (1955–2009)                         •   Correlation between the Palmer Drought Severity Index               [12]
                                                                                                               and Canada Drought Code against number of wildfires and
                                                                                                               area burnt yielded relatively low values with some
                                                                                                               statistically significant.
                                                                                                           •   El Niño Southern Oscillation (ENSO) is the main driver for
                                                                                                               interannual variability of fire weather, as defined by FFDI.
                            Daily meteorological data (1973–2017) including maximum temperature            •   In New South Wales, particularly along the central coast,
                            (◦ C), relative humidity (%), wind speed (kmh−1 ); derived drought factor          negative Southern Annular Mode (SAM) is a primary
            Australia                                                                                          influence for elevated fire weather in late-winter and              [10]
                           calculated using the Keetch Byram Drought Index (KBDI) for calculation of
                                             McArthur Forest Fire Danger Index (FFDI)                          spring. In southeast Australia, the El Niño-like impact is
                                                                                                               exacerbated when positive Indian Ocean Dipole (IOD)
                                                                                                               conditions are simultaneously observed.
                            Three local repositories of territorial and state reports of area burnt for    •   Ignitions occurred year-round with peaks in the summer
                                                            1901–2004.                                         (June, July, August) and winter months (January,
                              Fire occurrences from Hawai’i Wildfire Management Organization
            Hawai’i                                                                                            December).                                                          [14]
                                                           (1967–2003).                                    •   Area burned showed a large increase during the summer
                           Wildfire conditions obtained from HWMO records (2005–2011) for which                months.
                                       complete records from all agencies are available
                            Four state-of-the-art satellite fire products related to Moderate Resolution
                           Imaging Spectroradiometer (MODIS) (2001–2016) and fourth generation of          •   Burned area showed strongest periodicity in the summer
        Mediterranean                    the Global Fire Emissions Database (1995–2016).                       months across datasets.                                             [13]
                            Gridded, ground-based European Forest Fire Information System (EFFIS)
                                                          dataset (1985–2015)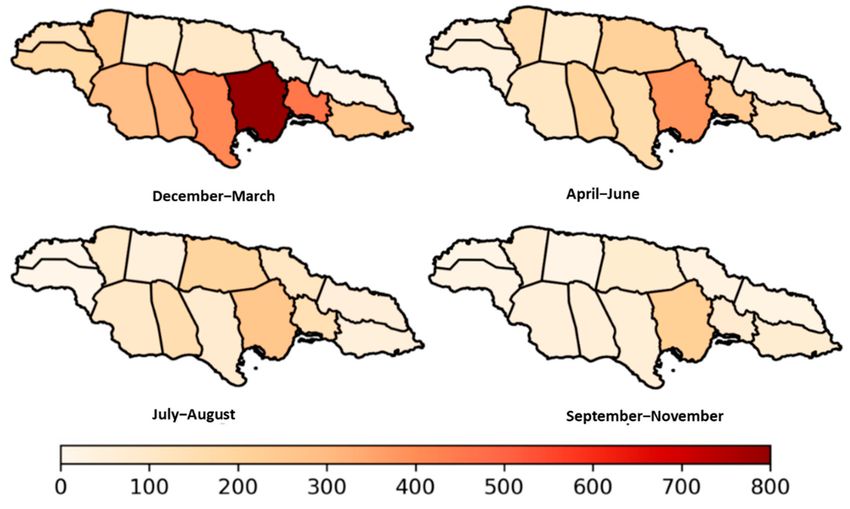
Atmosphere 2021, 12, 390                                                                                                                                                        5 of 23

                                                                                Table 2. Cont.

             Region                          Fire Data Source/Fire Indices                                   Observations in Relation to Climate                      References
                                                                                                 •   Drought increases probability of fire occurrence in forest
                                                                                                     ecosystems, but other biotic and abiotic disturbances and
                                                                                                     stressors interact with drought and fire.
                           Palmer Drought Severity Index; Standard Precipitation Index; KBDI;    •   Temperature increases are a predisposing factor causing
        North America                                                                                                                                                    [9]
                                          Fosberg fire weather index (FFWI).                         often lethal stresses on forest ecosystems acting both
                                                                                                     directly through increasingly negative water balances, and
                                                                                                     extent of disturbances, chiefly fire and insect outbreaks
                                                                                                 •   Intra and inter-annual variability in the heat waves
                                                                                                     characteristics are clearly associated to the spatial-temporal
                                                                                                     distribution of the extreme wildfires.
                                                                                                 •   Total extreme wildfire days were also heat wave days.
            Portugal                                 Local records                                                                                                       [11]
                                                                                                 •   Extreme wildfire had duration completely contained in the
                                                                                                     duration of a heat wave.
                                                                                                 •   Extreme wildfires occurred during and in the area affected
                                                                                                     by heat waves.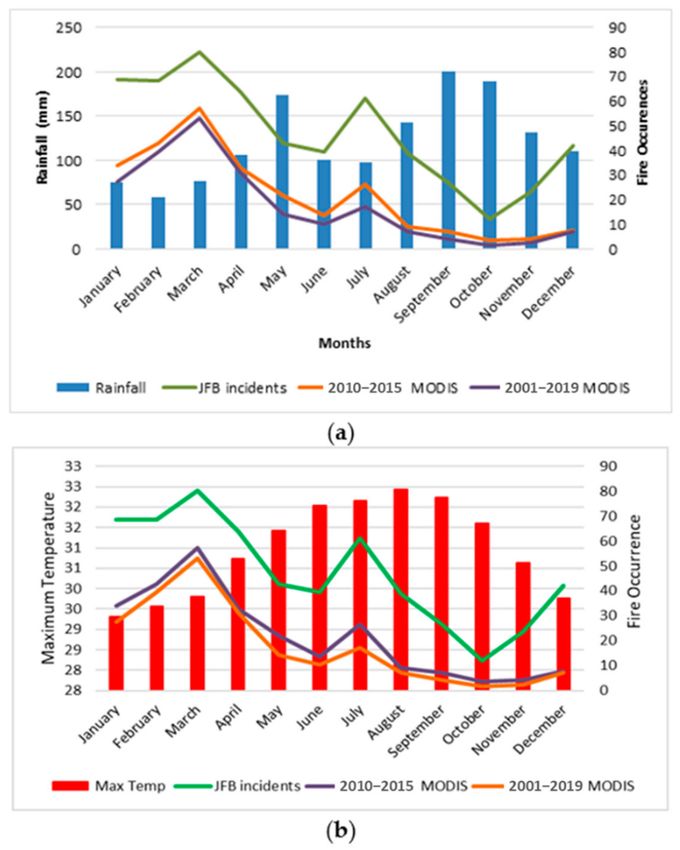
Atmosphere 2021, 12, 390                                                                                          6 of 23

                           2. Materials and Methods
                           2.1. Materials
                           2.1.1. Study Area
                                 Jamaica is the third largest Caribbean island and is divided into fourteen parishes.
                           Walters [30] and Douglas [31] suggest that there are four rainfall zones which they classify
                           as: Interior (zone 1); East (zone 2); West (zone 3) and North and South Coasts (zone 4). See
                           Figure 1. Zones were deduced from the cluster analysis of 129 stations across Jamaica for
                           1971–2010 to which Young’s Estimation data infilling technique was applied and that were
                           validated against the 1971–2000 mean annual rainfall map produced by the Meteorological
                           Service Jamaica [30]. Douglas [31] confirmed the 4 zones using cluster analysis of 23
                           stations across Jamaica chosen for their length and completeness over 1971–2010. Zones 1, 3
                           and 4 show bimodal patterns with an early season peaking in May and late season peaking
                           in September with a mid-summer minimum in July [31]. The bimodality is very similar to
                           the double peak pattern noted across islands in the main Caribbean [32,33]. The zones are
                           however differentiated by their seasonal and annual totals. In contrast, zone 2 in the east
                           shows a different climatology, recording its highest rainfall in November and a secondary
                           peak in April–May. This zone also has the highest rainfall totals of all zones [30,31].

                           Figure 1. Map of the Caribbean. Inset diagram adapted from State of the Jamaican Climate 2015
                           showing a map of Jamaica with the approximate bounds for the four rainfall zones.

                           2.1.2. Fire and Climate Data
                                 Fire occurrence data are obtained from records compiled by the Jamaica Fire Brigade
                           (JFB) over 2010–2015 and from the NASA MODIS C6 fire archives over 2001–2019. The
                           fire data include both human induced and natural fires across the rainfall zones as no
                           differentiation was made in the archives. The JFB data is a monthly compilation of bushfire
                           occurrences across the island that were reported to the JFB and that required their response
                           (even if no intervention). The dataset includes fire locations to the nearest street. The
                           NASA MODIS active fire archive [34] is a global dataset that has a spatial resolution of
                           1 km and daily data over Jamaica are extracted for 2001–2019. MODIS is an optical sensor
                           on board the Terra and Aqua satellites that were launched on 18 December 1999 and 4 May
                           2002, respectively. Terra travels on a descending path (north to south, crossing the equator
                           in the morning, while Aqua travels on an ascending path (south to north), crossing the
                           equator in the afternoon. Correspondingly on the other side of their orbit Terra travels an
                           ascending path (south to north), crossing the equator in the afternoon, while Aqua travels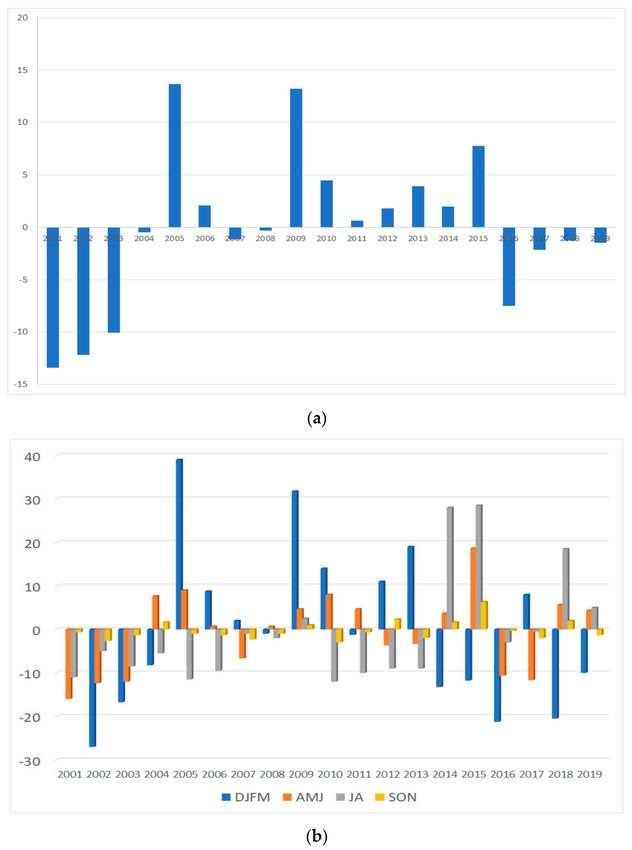
Atmosphere 2021, 12, 390                                                                                                         7 of 23

                                  a descending path (north to south), crossing the equator in the morning. This allows for
                                  the collection of the entire surface of Earth every 1 to 2 days. The MODIS sensor collects
                                  data in 36 spectral bands with a swath of 2330 km (across track) by 10 km (along track)
                                  and has a spatial resolution from 0.25 to 1 km dependent on the band. Bands 1 and 2 (red
                                  and infrared) offer a spatial resolution of 0.25 km, bands 3 to 7 offer a spatial resolution
                                  of 0.50 km, and the remaining bands 8–36 collect imagery at 1 km spatial resolution. The
                                  MODIS active fire products were developed using active fire detection algorithms based on
                                  heritage algorithms previously developed for Advanced Very High-Resolution Radiometer
                                  and Tropical Rainfall Measuring Mission–Visible and Infrared Scanner [7,35].
                                        The climate indices used in this study and their sources are summarized in Table 3.
                                  The indices include all island monthly rainfall, Niño3 sea surface temperature anoma-
                                  lies (SSTA), Tropical North Atlantic (TNA) SSTA, Tropical South Atlantic (TSA) SSTA,
                                  Caribbean low level winds (LLW) anomalies, North Atlantic Oscillation (NAO), Atlantic
                                  Multidecadal Oscillation (AMO) and Pacific Decadal Oscillation (PDO). The climate in-
                                  dices have been identified in previous studies as important to climate variability over the
                                  Caribbean [20,36–38].

              Table 3. Some climate indices used in correlation analyses. Anomalies are calculated relative to 2001–2019.

     Climate Indices                                           Definition                                            Reference
                               Area average of monthly sea surface temperature (SST) anomalies over    5.5◦
                                 N–23.5◦ N and 15◦ W–57.5◦ W. Data: HadISST and NOAA OI 1◦ × 1◦ .
           TNA                                                                                                          [36]
                                        Source: https://psl.noaa.gov/data/correlation/tna.data
                                                     (accessed on 10 February 2020)
                                 Area average of monthly SST anomalies over 0◦ –20◦ S and 10◦ E–30◦ W.
                                                 Data: HadISST and NOAA OI 1◦ × 1◦
            TSA                                                                                                         [36]
                                  Source: https://psl.noaa.gov/data/correlation/tsa.data (accessed on
                                                           10 February 2020)
                               Area average of monthly SST anomalies over 5◦ N–5◦ S and 150◦ W–90◦ W.
                                              Monthly ERSSTv5 are used to create index.
         NINO 3.0                                              Source:                                                 [39,40]
                               https://www.cpc.ncep.noaa.gov/data/indices/ersst5.nino.mth.81-10.ascii
                                                   (accessed on 10 February 2020)
                             Area average of monthly zonal wind anomalies over 70◦ –80◦ W, 12.5◦ –17.5◦ N
     Low level winds                                                                                                   [41,42]
                                              Data: NCEP/NCAR Reanalysis 2.5◦ × 2.5◦
                             The index is obtained by projecting the NAO loading pattern, 1st mode of the
                            Rotated Empirical Orthogonal Function, to the daily anomaly 500 mb height field
           NAO                                               over 0◦ –90◦ N.                                            [43]
                            Source: https://www.cpc.ncep.noaa.gov/data/teledoc/nao.shtml (accessed on
                                                           10 February 2020)
                            An area weighted average of anomalies calculated over the North Atlantic Ocean
                            (0◦ to 70◦ N) on the Kaplan SST dataset (5◦ × 5◦ ) and the 1951–1980 interpolated
                             NOAA ERSST V2 SST climatology was added back in. Data is unsmoothed and
           AMO                                                                                                          [44]
                                                             not detrended.
                                    Source: https://www.esrl.noaa.gov/psd/data/timeseries/AMO/
                                                      (accessed on 25 March 2020)
                               Standardised values of the PDO index are derived as the leading Principal
                             Component of monthly sea surface temperature anomalies in the North Pacific
           PDO                                         Ocean (poleward of 20◦ N).                                      [45,46]
                                   Source: http://research.jisao.washington.edu/pdo/PDO.latest.txt
                                                      (accessed on 25 March 2020)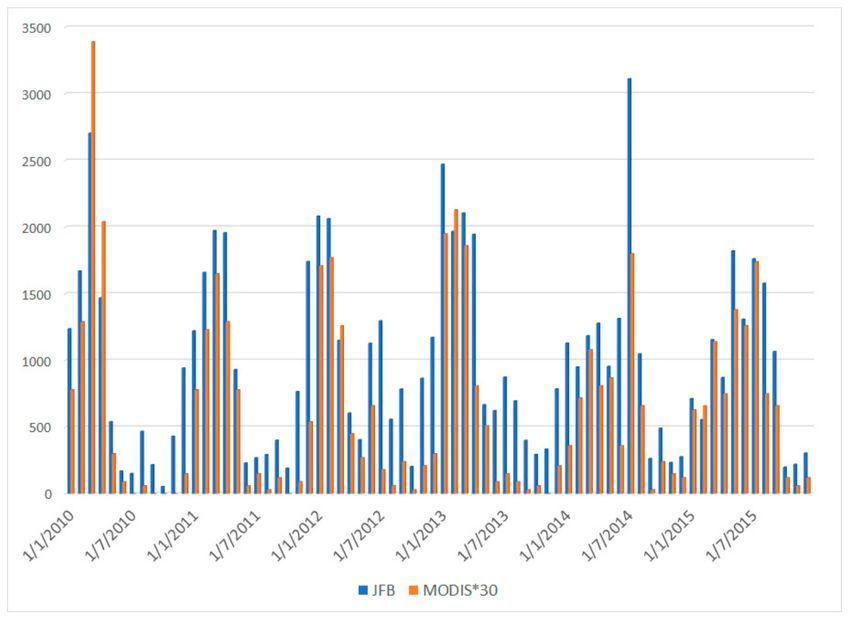
Atmosphere 2021, 12, 390                                                                                             8 of 23

                           2.2. Methods
                           2.2.1. Validation of the MODIS Data
                                 The JFB dataset is compared with the MODIS to determine the representativeness of
                           the MODIS data given the limited 6-year time span of the JFB data. An all island monthly
                           bushfire frequency timeseries is calculated for each dataset using total fire occurrences per
                           month and is used for the following analyses. Firstly, the correlation coefficient between
                           the JFB and MODIS timeseries is calculated over the 2010–2015 period and the statistical
                           significance is determined. The climatologies of the JFB and the MODIS are calculated
                           over a common 2010–2015 period. The climatology for the MODIS over 2001–2019 is
                           also calculated. The data are also compared with the 2010–2015 rainfall and maximum
                           temperature climatology. The raw monthly timeseries of both fire datasets over 2010–2015
                           are also plotted. Finally, a Generalized additive mixed model (GAMM) was applied to
                           explore the strength of the relationship between the two fire timeseries. The model indicates
                           how well the MODIS (variable x) is able to predict for the JFB (variable y). The GAMM
                           generally uses cross-validation and includes both spatial and temporal correlations, as well
                           as multiple homogeneity tests [47]. The model explored a direct linear relationship between
                           the indices as well as a spline smoothed random effects relationship. The skill of the model
                           is indicated using Spearman and Pearson Correlations with statistical significance given by
                           p value and F-value.

                           2.2.2. Characterizing Temporal and Spatial Variability
                                 Average monthly fire occurrences on annual and seasonal timescales are calculated
                           for 2001–2019. Seasons examined are December to March (DJFM), April to June (AMJ), July
                           to August (JA) and September to November (SON) similar to seasons used by CSGM [48].
                           Seasons are chosen to coincide with Jamaica’s wet seasons (AMJ and SON) and dry seasons
                           (DJFM and JA). Trend values and statistical significance are determined using the Mann-
                           Kendall Test [49–51] and Sen’s Slope [52]. The Mann-Kendall Test is used to determine
                           whether a timeseries has a monatomic upward and downward trend at a 0.05 alpha level.
                           The test does not require the data to be normally distributed or linear but that there is no
                           autocorrelation. This latter condition however is likely not satisfied in bushfire frequency
                           data given that, for example the atmospheric conditions influencing bushfire variability
                           have some autocorrelation. The Sen’s slope is used to determine the magnitude of the trend
                           in a univariate timeseries. The technique does not require any probability distribution. The
                           variability explained is determined using linear regression analyses.
                                 Secondly, annual and seasonal fire frequency anomalies for 2001–2019 are calculated.
                           Annual anomalies for the JFB data for 2010–2015 are also calculated. Annual and seasonal
                           anomalies are further disaggregated by rainfall zones and plotted. Wavelet analyses are
                           then applied to the normalized annual and seasonal averages for 2001–2019 as well as to
                           the normalized annual means over each rainfall zone to quantify the periodicities that are
                           observed. Wavelet decomposes the timeseries into time-frequency space and identifies
                           the dominant modes of variability and how these modes vary in time. Wavelet is also an
                           efficient approach to analyse nonstationary signals [53]. The wavelet-transform of a real
                           signal X(t) used to extract time and frequency information from the X(t) climate data with
                           a mother wavelet ψ, is a convolution integral given as
                                                                        Z T
                                                                                              t−n

                                                                1
                                                       Wn (s) = √             X ( t )ψ∗             dt,                 (1)
                                                                    s    0                     s

                           where ψ* is the complex conjugate of ψ, t is the time, T is the total length of the time series,
                           s is the scale, n is translated position along the t axis and Wn (s) is a wavelet spectrum, a
                           matrix of energy coefficients of the decomposed time series [54].
                                 The distribution of the fire activity over 2001–2019 is plotted over Jamaica with four
                           rainfall zones shown. The interpolated fire activity is also represented by seasons to
                           highlight the seasonality of fire activity over the island spatially.
Atmosphere 2021, 12, 390 9 of 23
2.2.3. Exploring Climate Linkages
Annual and seasonal all island timeseries are correlated with the suite of indices in
Table 3. The indices are calculated on annual timescales. Concurrent and lag correlations
are calculated to identify those phenomena related to fire variability over Jamaica and that
may be useful in a predictive scheme. Correlations are also calculated between the annual
and seasonal fire activity timeseries and low pass filtered AMO, NAO and PDO. The AMO,
NAO and PDO timeseries were normalized and filtered using a Butterworth low pass filter
set to a frequency of 0.1 and to an order of 1 to isolate decadal/multidecadal variability.
Additional post-processing was undertaken to correct the lagged outcome of the filtered
timeseries [31]. Correlations are also calculated with respect to local mean temperature and
precipitation. The significance of correlation coefficients at the 0.05 p-value significance
level is tested.
To further investigate climate linkages, plots of sea surface temperature and wind
speed anomalies are created over an Atlantic and Pacific domain (0◦ –180◦ W, 10◦ S–60◦
N) for composites of four years of strongest above normal fire incidence (2005, 2009, 2010
and 2015) versus four years of strongest below normal incidence (2001, 2002, 2003 and
2016) to identify the dynamical features that may contribute to years of extreme bushfire
variability. SSTA are obtained from the 2◦ × 2◦ NOAA Extended Reconstructed Sea
Surface Temperature (ERSST) v5 [55]. The latest ERSST estimates have more realistic
spatiotemporal variations, better representation of high-latitude SSTs, and ship SST biases
are now calculated relative to more accurate buoy measurements, while the global long-
term trend remains about the same. Anomalies of zonal wind at 925 mb are obtained from
ERA Interim [56]. ERA Interim is a global atmospheric reanalysis from 1979 to 2019 with a
spatial resolution of approximately 80 km on 60 levels in the vertical from surface up to
0.1 hPa. Anomalies are calculated with respect to 2001–2019.
3. Results
3.1. Validating MODIS: Models and Climatology
Figure 2 shows a plot of the monthly fire activity over Jamaica from MODIS and the
JFB over their overlapping period 2010–2015. The plot shows that there is strong similarity
between the variabilities represented by the datasets. The correlation between the monthly
timeseries is 0.86. However, the MODIS underestimates monthly fire frequency by a factor
of up to 30 likely due to the restriction of the frequency of the satellite passing the area,
the distance and impact of cloud cover. Figure 3 shows the climatology of the datasets
over 2010–2015 including the rainfall and maximum temperature climatology over the
corresponding period as well as the MODIS 2001–2019. The climatologies are almost
identical albeit with the MODIS underestimating mean monthly fire frequencies. Notably
the MODIS and JFB displays a primary peak in March and a secondary maximum in July,
coinciding with months of minimum monthly rainfall. Minima in fire occurrences are
noted for June and October during peaks in the rainy season. Generalized additive mixed
model (GAMM) and backward linear regression (BLR) analyses are used to investigate
the predictive skill of MODIS in relation to the JFB. The GAMM and BLR suggest that the
MODIS represents 80% and 73% of the JFB data variability, respectively. Together these
analyses indicate that the MODIS is a suitable representation of the JFB and can be used for
investigating fire activity over Jamaica.Atmosphere 2021, 12, 390 10 of 23
Figure 2. Monthly variations in Jamaica fire frequency data for 2001–2015. The JFB data (blue) and
the MODIS data (orange) are shown. The MODIS data is multiplied by a factor of 30 for comparison
with the JFB.
Figure 3. Climatologies of monthly fire frequency for Jamaica from JFB and MODIS and (a) rainfall
and (b) maximum temperature for 2010–2015. Climatology of MODIS fire frequency for 2001–2019 is
also shown.Atmosphere 2021, 12, 390 11 of 23
3.2. Temporal and Spatial Variability
Annual and seasonal monthly means are analysed to determine trends in fire activity.
Table 4 shows that annually and for all seasons except December–March (DJFM) increases
in monthly mean fire frequency are observed. The trend is strongest for July August
(0.9 monthly fires/year) and with the trend representing 30% of the variability. Recall that
the MODIS underestimates monthly fire frequencies by a factor of up to 30 suggesting
that for July-August (JA) the true trend may be 27 monthly fires/year. The annual trend is
0.3 monthly fires/year. The weakest positive trend is observed in September-November
(0.1 monthly fires/year) which explains 9% of the variability. December-March shows neg-
ative trend values of 0.5 monthly fires/year which represents 2%. Trends in annual totals
by zones are positive except for zone 3 (western Jamaica) where a weak negative near zero
trend is observed (Table 5). Trends are strongest for zone 2 (eastern Jamaica) (0.1 monthly
fires/year) and zone 4 (northern and southern Jamaica) (0.2 monthly fires/year) explaining
29% and 11%, respectively.
Table 4. Trend values for the all-island fire frequency monthly means calculated annually and for each
season December−March, April−June, July−August, and September–November. Values in bold are
significant at the 95% level. R2 is the coefficient of determination and represents the proportion of
variance explained by the trend.
Trend in Monthly Mean (per
Periods R2
year)
Annual 0.3 0.06
DJFM −0.6 0.02
AMJ 0.4 0.09
JA 0.9 0.30
SON 0.1 0.09
Table 5. Trends in monthly means per year per zones. Values in bold are significant at the 95%
level. R2 is the coefficient of determination and represents the proportion of variance explained by
the trend.
Trend in Monthly
Zones Location R2
Mean (per year)
1 Interior 0.6 0.03
2 East 0.1 0.29
3 West 0 0
4 North and South 0.2 0.11
Figure 4 shows the annual and seasonal bushfire frequency anomalies for 2001–2019.
Interestingly cycles of above normal and below normal monthly fire activity emerge.
Annual total fire frequency appears to exhibit a 10-year positive phase switching to its
latest negative phase in 2016 (Figure 4a). DJFM appears to show a 9-year positive phase in
2005–2013 with negative phases 2001–2004 and again since 2014 (Figure 4b). A secondary
cycle with a smaller periodicity is also observed. AMJ shows fire variability that exhibits a
change in phase every 2–3 years. JA exhibits a 13-year negative fire activity phase between
2001–2013, with largely positive values since 2014. SON variability cycle is not as clear.Atmosphere 2021, 12, 390 12 of 23
Figure 4. Anomalies of (a) annual means and (b) seasonal means of all island bushfire frequency.
Seasons shown are DJFM, AMJ, JA and SON.
In general, there is some evidence of periodicities in the annual and seasonal fire
activity and these may in part be related to linkages to climate influences. A longer dataset
is required to identify the cycles more definitively. The wavelet analyses on normalized
annual and seasonal fire frequency contributes to the evidence that there are periodicities
in fire occurrence over Jamaica (Figure 5). The wavelet analysis illustrates regions within
the cone of influence where the spectral information is considered reliable. Additionally,
the statistical significance of peaks in wavelet power is determined at the 5% significance
level by comparing the wavelet power with a red-noise background power spectrum. The
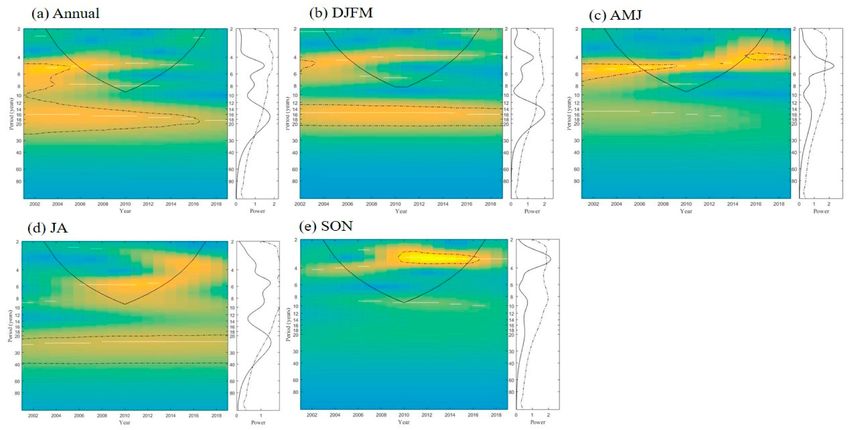
results are significant for AMJ and SON where 5 year and 3.5-year cycles, respectively
are observed and are within the cone of influence. The AMJ fire variability is particularly
strong over 2008–2010. The SON variability shows high intensity peaks in 2010–2015.Atmosphere 2021, 12, 390 13 of 23
Figure 5. Wavelet analysis of normalized (a) annual and seasonal fire frequency: (b) December–March; (c) April–June; (d) July–August; (e) September–November. The line is the Cone of
Influence beyond which the energy is contaminated by the effect of zero padding and the dashed contour line (on spectrum on the right) represents the 95% confidence level of local power
relative to a red-noise background.Atmosphere 2021, 12, 390 14 of 23
Periodicities are also evident in annual and seasonal anomalies over each of the four
rainfall zones (Figures 6 and 7). Zone 1 (Interior) like DJFM shows a largely positive
phase over 2005–2013. Zone 2 (eastern Jamaica) shows very little fire occurrences for
2001–2010 displaying 9 of 11 years with no fires. Fire occurrences show increases and some
variability from 2011 onwards. Zone 3 (western Jamaica) displays a 6–7-year cycle over
2001–2019. Zone 4 (northern and southern Jamaica) which accounts for most of the annual
fire variability largely mirrors the variability observed for the all island timeseries. An
examination of seasonal variability by zone shows most distinct cyclic variability for Zone 4
DJFM where ~4/5 and 9-year cycles are suggested (Figure 7). Zone 2 (eastern Jamaica) and
SON for all zones are not shown given that fire frequencies in these instances is minimal.
This is expected given that rainfall activity is prevalent for Zone 2 and during SON (the
primary rainfall season for much of the island). However, the fire patterns emerging over
eastern Jamaica, known for its wetness, may be an indication that a drying trend has been
evolving since 2011 over this subregion and has important implications for the island. A
wavelet analysis on normalized annual fire frequency by zones reveals a 6-year cycle over
Zone 3 (western Jamaica) with high intensity peaks for 2006–2010 (not shown). While other
periodicities were identifiable for other zones these lie outside the cone of influence.
Figure 6. Map showing anomalies of annual fire occurrences for 2001–2019 by zones from the MODIS data. The approximate
bounds for the four rainfall zones over Jamaica and the spatial distribution of fires are also shown.Atmosphere 2021, 12, 390 15 of 23
Figure 7. Anomalies of Seasonal fire frequency for zones 1, 3 and 4 for the seasons DJFM, AMJ and JA. Zone 3—JA is omitted since no fire is recorded for most years.Atmosphere 2021, 12, 390 16 of 23
The proliferation of fire activity during December−March is observed spatially in
Figure 8. Southern Jamaica shows the greatest intensities during this season and particularly
over Clarendon in Southern Jamaica known for its climatological dryness.
Figure 8. Distribution of Fire Frequencies by seasons for 2010–2015.
3.3. Climate Variability and Fire Frequency Activity
The association between bushfire frequency activity and climate is first explored
using correlations. The results are shown in Tables 6 and 7. Some of the key points are
noted below:
• Significant correlations are noted in relation to annual and July to November rainfall
and temperature. Correlations peak for rainfall in September−November (−0.52) and
for temperature in July-August (0.54). Lagged correlations are significant with respect
to rainfall (−0.48) and temperature (0.49) for July−August. The low frequency rainfall
timeseries showed significant correlations for JA (−0.64) and SON (−0.58).
• Annual and AMJ fire activity exhibits variability similar to the Atlantic Multidecadal
Oscillation (0.63 and 0.50, respectively) and exhibits some association with the Pacific
Decadal Oscillation (−0.50) for DJFM. Correlations are also significant with respect to
low level winds for DJFM (0.47). These associations are likely through the influence of
the AMO and PDO on Jamaica’s rainfall variability.
• JA fire variability correlates significantly with Nino-3 (0.57) and the TNA (−0.59) with
a gradient index combining the two indices showing a correlation of 0.68.
• SON fire variability appears to be related to Nino-3 (0.69), the gradient index (−0.72)
and low-level wind in the region of the Caribbean low-level jest (−0.54).
When annual bushfire frequency activity is explored by zone, Zone 1 (interior Jamaica)
shows some linkage with the TNA (0.45). Zone 2 (eastern Jamaica) shows strong linkage
with the gradient index (−0.46) and Caribbean low-level winds (−0.47) with Zone 3 (west-
ern Jamaica) showing some linkage with AMO (0.47) and TNA (0.43). Zone 4 (northern and
southern Jamaica) showing strong linkage with the AMO (0.66) and NAO (−0.46) (Table 5).Atmosphere 2021, 12, 390 17 of 23
Table 6. Concurrent and lagged correlations between bushfire frequency and climate indices for
annual and seasonal periods calculated over 2001–2019. One year/season lags are calculated with
climate leading (2000–2018). “−f” are the low pass filtered components. The correlations with LLW
are over 2001–2018. Values in bold are significant at the 95% level.
Annual DJFM AMJ JA SON
Lag-0 Lag-1 Lag-0 Lag-1 Lag-0 Lag-1 Lag-0 Lag-1 Lag-0 Lag-1
Rainfall −0.05 0.16 −0.27 0.19 −0.08 0.12 −0.43 −0.48 −0.52 −0.38
Temp 0.01 −0.44 −0.45 0.57 0.04 −0.27 0.54 0.49 0.43 0.31
Rainfall-f 0.34 0.53 0.14 −0.34 −0.04 0.32 −0.64 −0.55 −0.58 −0.49
NAO −0.15 −0.15 −0.45 −0.29 −0.02 0.03 −0.52 0.34 0.41 0.17
TNA 0.25 0.13 0.47 0.19 0.14 0.00 −0.59 −0.18 −0.41 −0.04
Nino3 0.10 −0.21 −0.34 −0.14 0.35 −0.23 0.57 −0.12 0.69 −0.13
TNA-
0.01 −0.22 0.45 0.19 −0.22 0.19 0.68 −0.03 0.72 0.09
Nino3
TSA −0.10 −0.03 0.08 −0.20 0.04 0.11 0.10 0.01 −0.27 −0.02
LLW 0.20 0.33 0.47 0.44 0.09 0.14 −0.66 −0.33 −0.54 −0.02
PDO-f −0.30 −0.33 −0.50 −0.47 −0.16 −0.17 0.45 0.37 0.32 −0.20
AMO-f 0.63 0.47 0.39 0.35 0.50 0.30 0.22 0.22 0.20 0.18
NAO-f −0.39 −0.41 −0.32 −0.47 −0.36 −0.27 0.08 0.25 0.27 0.16
Table 7. Correlations between annual bushfire frequency and some annual climate indices calculated
over 2001–2019 for concurrent periods. “−f” are the low pass filtered components. Calculations with
LLW and PDO are up to 2018 and 2017, respectively. Values in bold are significant at the 95% level.
All Island Zone 1 Zone 2 Zone 3 Zone 4
NAO −0.15 −0.31 0.18 −0.32 0.05
TNA 0.25 0.45 −0.36 0.43 0.05
Nino 0.10 0.32 0.39 −0.01 −0.05
TNA-Nino3 0.01 −0.10 −0.46 0.17 0.06
TSA −0.10 −0.01 −0.16 −0.01 −0.14
LLW 0.20 0.12 −0.47 0.34 0.16
PDO-f −0.30 −0.05 0.36 −0.26 −0.34
AMO-f 0.63 0.33 0.17 0.47 0.66
NAO-f −0.39 −0.06 0.11 −0.27 −0.46
Years of above normal fire variability are generally observed during El Niño events and
below normal fire years are typically evident during La Niña years (See Table 8). Notably
the super El Niño in 2015–2016 was observed alongside the 3rd highest fire anomalies
recorded over 2001–2019. Composite analysis of Atlantic and Pacific SSTA shows a strong
warming over the North middle to high latitude Atlantic with the warming extending over
most of the North Atlantic during years of high bushfire frequency (Figure 9a). This is
very similar to the characteristic AMO pattern [43,57]. During low fire years, a weakened
warming is evident over much of the North Atlantic but with stronger warming over
the Gulf of Mexico through the northern Caribbean and along a south-west to north east
axis (Figure 9b). Notably oppositely signed SST anomalies over the Gulf of Mexico and
the northern Caribbean emerge for the difference composite with Jamaica located in the
transition zone (Figure 9c). This composite map is similar to the SST composite map
obtained for high minus low years of the AMO [31]. The other dominant SST signal
evident is the strong warming over the North Pacific through to the equatorial PacificAtmosphere 2021, 12, 390 18 of 23
during high years and below normal SSTAs in these regions in low years. The difference in
North Pacific SSTAs is statistically significant. The warming pattern during high fire years
shows some similarities to the PDO pattern. However, the PDO pattern shows negative
SST anomalies over much of the north Pacific (with positive anomalies distributed in a
horseshoe pattern from the equatorial Pacific and along the west coast of North America).
See for example [58]. High fire years appear to have an ENSO like warming signal over the
equatorial Pacific but a cool tongue (consistent with La Niña) was not observed for low
fire years.
Table 8. Contingency table showing the occurrence of high and low fire years for Jamaica relative to El
Niño and La Niña events identified using http://www.bom.gov.au/climate/enso/enlist/ (accessed
on 18 August 2020). Values in bold (underlined) are high (low) bushfire years used in the composite
calculations.
Events High Fire Years Low Fire Years
2006–2007, 2009–2010,
El Niño 2002–2003
2015–2016
La Niña 2010–2012 2001, 2007–2008, 2008–2009
Neutral 2005 2004
Zonal winds during high years (Figure 9d) are positive over the Caribbean versus
near zero anomalies over Jamaica and Cuba during low years (Figure 9e). The difference
composite of zonal winds (Figure 9f) indicates positive values over the region and suggests
a strengthening of low-level easterlies over the Caribbean during high fire years versus
low years as represented in Figure 9d–f. Additionally, observed in the difference composite
is an area of strong positive wind anomalies in the Caribbean low-level jet region (south
of Jamaica) likely indicative of strengthened jet in this region during high years (positive
values) versus low years (negative values) (Figure 9). Only small regions over the tropical
Pacific and the United States are identified as statistically significant in the difference maps.Atmosphere 2021, 12, 390 19 of 23
Figure 9. Composites of SSTA (K) and zonal wind anomalies (ms−1 ) over the Pacific and Atlantic for high and low years of Jamaica fire frequency anomalies. (a–c) SSTA high, low and
high minus low composite. (d–f) 925 mb zonal wind anomalies high, low and high minus low composite. Stippled areas show regions where composite differences are statistically
significant at 95% confidence level.Atmosphere 2021, 12, 390 20 of 23
4. Conclusions
In this study the variability of fire frequency over Jamaica is characterized using
MODIS C6 data archive for 2001–2019. The data are found to be representative of fire
occurrences for the island although values are below the land based JFB data by a factor of
up to 30. Fires vary seasonally peaking in March and July. Positive trends in fire frequency
are noted on average on annual and seasonal timescales except for December–March. The
trend is strongest for July-August and represents 29% of the variability. Periodicities are
significant for AMJ and SON where 5 year and 3.5-year cycles, respectively, are evident.
Wavelet analysis on annual timescales by zones reveals a 6-year cycle over Zone 3 (western
Jamaica). Southern Jamaica shows the greatest frequencies during December to March and
particularly over Clarendon. Southern Jamaica is known for its climatological dryness.
Significant and fairly strong correlations were observed with rainfall for September-
November (−0.52) and with temperature for July-August (0.54) with lagged correlations
significant for JA temperatures. JA fire variability also showed some association with NAO
(0.52), TNA (−0.59), Niño3 (0.57), TNA-Niño3 (0.68) and LLW (−0.66). Annual and DJFM
and AMJ fire frequency exhibits variability similar to the Atlantic Multidecadal Oscillation
(0.63) and some connection with the Pacific Decadal Oscillation (−0.50). The suggestion is
that the influence of the large-scale climate features may be directly through wind patterns
over the island and indirectly through interaction with rainfall.
Annual fire frequency activity explored by zone reveals correlations between Zone
1 (interior Jamaica) and TNA (0.45). Zone 2 (eastern Jamaica) shows some relationship
with TNA-Niño3 (−0.46) and LLW (−0.47) with Zone 3 (western Jamaica) showing some
association with AMO (0.47). Zone 4 (northern and southern Jamaica) showing strong
linkage with the AMO (0.66) and NAO (−0.46). The significant correlations with filtered
AMO, PDO and NAO suggest that some decadal variability is at work in Jamaica’s fire
frequency. The AMO has dominant periods at 20–30 years and 65–80 years [46]; the PDO at
15–25 and 50–70 years [59]; and NAO at 7–11 and 37–40 years [60,61]. Shorter term bushfire
variability appears to be through the influence of the El Niño Southern Oscillation. Years
of above normal fire variability are generally observed during El Niño events and below
normal fire years are typically evident during La Niña years. It is useful to note that the
positive correlations observed in relation to the AMO are obtained since bushfire frequency
anomalies track the AMO but does so across positive and negative values while the AMO
remains entirely positive.
Composite analysis of Atlantic and Pacific SSTA shows warming over the North
middle to high latitude Atlantic consistent with the characteristic AMO pattern [44,57].
Oppositely signed SST anomalies over the Gulf of Mexico and the northern Caribbean
also emerge for the difference composite with Jamaica located in the transition zone. This
composite map is similar to the SST composite map obtained for high minus low years of
the AMO [31]. The relationship observed between fire frequency anomalies and climate
suggest that an early warning system for bushfires in Jamaica and perhaps the Caribbean
should include monitoring some key climate variables temporally and spatially. These
‘predictors’ need not be the only triggers in the system but can serve to validate the
expected bushfire anomalies given the large-scale synoptic patterns. The early warning
mechanism being investigated for Jamaica will also look at fire potential using indices
such as the Keetch Byram Drought Index (KBDI) and the Forest Fire Danger Index (FFDI).
These indices incorporate rainfall, evapotranspiration, temperature and humidity. These
indices will be instructive in determining how fire potential has been changing for Jamaica,
assessing their correlation with large-scale modes such as ENSO, and determining whether
the expectation that the potential increases in the future, i.e., toward the end of century, is a
justifiable one. The final predictive framework will therefore allow for seasonal outlooks
for bushfires as well as long term projections.
Notably the current fire observation data suggests that the JA bushfire trend is most
significant in comparison to other seasons. Can we anticipate that the trend for this and
other seasons will change in the future and what large-scale features will facilitate suchAtmosphere 2021, 12, 390 21 of 23
changes? This study demonstrates that even with bushfires there are different timescales
at work, i.e., interannual, decadal and trend patterns and more work will be necessary
to be able to attribute bushfire variability for Jamaica and the Caribbean. Expanding the
countries under investigate will be useful in better understanding bushfire variability for
the region. Furthermore, including total area burned and cause of fire in the data recorded
as well as updating geocoded observed fire occurrences would be useful in advancing this
research. Since the aim of this study is to advise planning and decision making it is also
suggested that improved data collection and warning protocols be established to further
develop bushfire management on the island.
Author Contributions: Conceptualization, C.S.C. and T.S.S.; methodology, C.S.C.; validation, C.S.C.,
T.S.S.; formal analysis, C.S.C. and C.A.D.; investigation, C.S.C.; resources, C.S.C.; data curation,
C.S.C.; writing—original draft preparation, C.S.C.; writing—review and editing, T.S.S. and M.A.T.;
visualization, C.S.C., C.A.D.; supervision, T.S.S. and M.A.T.; project administration, T.S.S. and M.A.T.
All authors have read and agreed to the published version of the manuscript.
Funding: This research received no external funding.
Institutional Review Board Statement: Not applicable.
Informed Consent Statement: Not applicable.
Data Availability Statement: Please refer to suggested Data Availability Statements in section “MDPI
Research Data Policies” at https://psl.noaa.gov/data/correlation/tna.data (accessed on 10 February
2020); https://psl.noaa.gov/data/correlation/tsa.data (accessed on 10 February 2020); https://www.
cpc.ncep.noaa.gov/data/indices/ersst5.nino.mth.81-10.ascii (accessed on 10 February 2020); low-
level winds: NCEP/NCAR Reanalysis 2.5◦ × 2.5◦ ; https://www.cpc.ncep.noaa.gov/data/teledoc/
nao.shtml (accessed on 10 February 2020); https://www.esrl.noaa.gov/psd/data/timeseries/AMO/
(accessed on 25 March 2020); http://research.jisao.washington.edu/pdo/PDO.latest.txt (accessed
on 25 March 2020); Source for MODIS dataset: https://firms.modaps.eosdis.nasa.gov/download/
(accessed on 29 January 2020).
Acknowledgments: For their support one author (C.S.C.) would like to acknowledge the Jamaica Fire
Brigade (JFB), especially Nicholas Ogilvie and Ricardo Young, as well as Kwesi Osborne. The author
would also like to acknowledge the Meteorological Service Jamaica (MSJ), especially Jacqueline
Spence-Hemmings and the data acquisition section. The authors (C.S.C., T.S.S., M.A.T. and C.A.D.)
would like to acknowledge Jayaka Campbell from the Department of Physics, The University of the
West Indies Mona.
Conflicts of Interest: Authors declare no conflict of interest.
References
1. The Jamaica Gleaner. Jamaica Fire Brigade Reporting an Increase in the Number of Bushfires. 18 April 2020. Available
online: https://www.jamaica-gleaner.com/article/news/20200418/jamaica-fire-brigade-reporting-increase-number-bush-fires
(accessed on 9 September 2020).
2. Countryman, C.M. The Fire Environment Concept; Pacific Southwest Forest and Range Experiment Station: Berkeley, CA, USA, 1972.
3. Johnson, E.A. Fire and Vegetation Dynamics; Cambridge University Press: Cambridge, UK, 1992.
4. Swetnam, T.W. Fire History and Climate Change in Giant Sequoia Groves. Science 1993, 262, 885–889. [CrossRef] [PubMed]
5. Weaver, P.; Gonzalez, K. (Eds.) Wildland Fire Management and Restoration: Proceedings of the 12th Meeting of the Caribbean Foresters in
Puerto Rico, 7–11 June 2004; International Institute of Tropical Forestry, USDA Forest Service (IITF): Rio Piedras, Puerto Rico, 2005.
6. Robbins, A.M.J. Global Forest Resources Assessment 2005—Report on Fires in the Caribbean and Mesoamerican Regions. Fire Management
Working Paper 12; FAO—Food and Agriculture Organization: Rome, Italy, 2006.
7. Robbins, A.M.J.; Eckelmann, C.-M.; Quinones, M. Forest Fires in the Insular Caribbean. Ambio 2008, 37, 528–534. [CrossRef]
[PubMed]
8. Akpinar-Elci, M.; Coomansingh, K.; Blando, J.; Mark, L. Household bush burning practice and related respiratory symptoms in
Grenada, the Caribbean. J. Air Waste Manag. Assoc. 2015, 65, 1148–1152. [CrossRef] [PubMed]
9. Litell, J.S.; Peterson, D.L.; Riley, K.L.; Liu, Y.; Luce, C.H. A review of the relationships between drought and forest fire in the
United States. Glob. Change Biol. 2016, 22, 2353–2369. [CrossRef] [PubMed]
10. Harris, S.; Lucas, C. Understanding the variability of Australian fire weather between 1973 and 2017. PLoS ONE 2019, 14, e0222328.
[CrossRef] [PubMed]Atmosphere 2021, 12, 390 22 of 23
11. Parente, J.; Pereira, M.; Amraoui, M.; Tedim, F. Negligent and intentional fires in Portugal: Spatial distribution characterization.
Sci. Total Environ. 2018, 624, 424–437. [CrossRef]
12. Wendler, G.; Conner, J.; Moore, B.; Shulski, M.; Stuefer, M. Climatology of Alaskan wildfires with special emphasis on the extreme
year of 2004. Theor. Appl. Climatol. 2011, 104, 459–472. [CrossRef]
13. Turco, M.; Llasat, M.-C.; von Hardenberg, J.; Provenzale, A. Climate change impacts on wildfires in a Mediterranean environment.
Clim. Chang. 2014, 125, 369–380. [CrossRef]
14. Trauernicht, C.; Pickett, E.; Giardina, C.P.; Litton, C.M.; Cordell, S.; Beavers, A. The Contemporary Scale and Context of Wildfire
in Hawaii. Pac. Sci. 2015, 69, 427–444. [CrossRef]
15. Mouillot, F.; Field, C. Fire history and the global carbon budget: A 1◦ × 1◦ fire history reconstruction for the 20th century. Glob.
Change Biol. 2005, 11, 398–420. [CrossRef]
16. Koutsias, N.; Xanthopoulos, G.; Founda, D.; Xystrakis, F.; Nioti, F.; Pleniou, M.; Mallinis, G.; Arianoutsou, M. On the relationships
between forest fires and weather conditions in Greece from long-term national observation (1894–2010). Int. J. Wildland Fire 2013,
22, 493–507. [CrossRef]
17. Pereira, M.; Malamud, B.; Trigo, R.; Alves, P. The history and characteristics of the 1980–2005 portuguese rural fire database. Nat.
Hazards Earth Syst. Sci. 2011, 11, 3343–3358. [CrossRef]
18. Short, K. Sources and implications of bias and uncertainty in a century of US wildfire activity data. Int. J. Wildland Fire 2015, 24,
883–891. [CrossRef]
19. Turco, M.; Llasat, M.; Tudela, A.; Castro, X.; Provenzale, A. Decreasing fires in a Mediterranean region (1970–2010, NE Spain).
Nat. Hazards Earth Syst. Sci. 2013, 13, 649–652. [CrossRef]
20. Stephenson, T.; Vincent, L.; Allen, T.; Van Meerbeeck, C.; Mclean, N.; Peterson, T.; Taylor, M.A.; Aaron-Morrison, A.P.; Auguste, T.;
Bernard, D.; et al. Changes in extreme temperature and precipitation in the Caribbean region. Int. J. Climatol. 2014, 34, 2957–2971.
[CrossRef]
21. Peterson, T.C.; Taylor, M.A.; Demeritte, R.; Duncombe, D.L.; Burton, S.; Thompson, F.; Porter, A.; Mercedes, M.; Villegas, E.;
Semexant Fils, R.; et al. Recent changes in climate extremes in the Caribbean region. J. Geophys. Res. Space Phys. 2002, 107, 4601.
[CrossRef]
22. IPCC. Managing the Risks of Extreme Events and Disasters to Advance Climate Change Adaptation; Cambridge University Press:
Cambridge, UK, 2012.
23. McSweeney, C.; Lizcano, G.; New, M.; Lu, X. The UNDP Climate Change Country Profiles: Improving the accessibility of
observed and projected climate information for studies of climate change in developing countries. Bull. Am. Meteorol. Soc. 2010,
91, 157–166. [CrossRef]
24. Hall, T.C.; Sealy, A.M.; Stephenson, T.; Kusunoki, S.; Taylor, M.; Chen, A.; Kitoh, A. Future climate of the Caribbean from a
super-high-resolution atmospheric general circulation model. Theor. Appl. Climatol. 2013, 113, 271–287. [CrossRef]
25. Mclean, N.; Stephenson, T.; Taylor, M.; Campbell, J. Characterization of Future Caribbean Rainfall and Temperature Extremes
across Rainfall Zones. Adv. Meteorol. 2015, 2015, 1–18. [CrossRef]
26. Jones, P.D.; Harpham, C.; Harris, I.; Goodess, C.M.; Burton, A.; Centella-Artola, A.; Taylor, M.A.; Bezanilla-Morlot, A.; Campbell,
J.D.; Stephenson, T.S.; et al. Long-term trends in precipitation and temperature across the Caribbean. Int. J. Climatol. 2016, 36,
3314–3333. [CrossRef]
27. Karmalkar, A.V.; Taylor, M.A.; Campbell, J.; Stephenson, T.; New, M.; Centella, A.; Benzanilla, A.; Charlery, J. A Review of
Observed and Projected Changes in Climate for the Islands in the Caribbean. Atmosfera 2013, 26, 283–309. [CrossRef]
28. Campbell, J.D.; Taylor, M.A.; Stephenson, T.S.; Watson, R.A.; Whyte, F.S. Future climate of the Caribbean from a regional climate
model. Int. J. Climatol. 2011, 31, 1866–1878. [CrossRef]
29. Taylor, M.A.; Clarke, L.A.; Centella, A.; Bezanilla, A.; Stephenson, T.S.; Jones, J.J.; Campbell, J.; Vichot, A.; Charlery, J. Future
Caribbean Climates in a World of Rising Temperatures: The 1.5 vs 2 Dilemma. J. Clim. 2018, 31, 2907–2926. [CrossRef]
30. Walters, R.N. Examining Drought in Jamaica and the Caribbean. Unpublished Master’s thesis, University of the West Indies,
Mona, Kingston, Jamaica, 2016.
31. Douglas, C.A.; Stephenson, T.S.; Taylor, M.A.; Brown, A.A.; Campbell, J.D.; Stennett-Brown, R.K.; Walters, R. Investigating
decadal variability in Jamaica’s Rainfall: A Case Study for the Caribbean. Theoret. Appl. Climatol. 2020. Submitted.
32. Chen, A.A.; Roy, A.; McTavish, J.; Taylor, M.; Marx, L. Using sea surface temperature anomalies to predict flood and drought
conditions for the Caribbean. COLA Rep. 1997, 49, 24.
33. Taylor, M.A.; Enfield, D.B.; Chen, A.A. Influence of the tropical Atlantic versus the tropical Pacific on Caribbean rainfall. J.
Geophys. Res. Space Phys. 2002, 107, 3127. [CrossRef]
34. Justice, C.; Gigliob, L.; Korontzia, S.; Owens, J.; Morisette, J.; Roy, D.; Descloitres, J.; Alleaume, S.; Petitcolin, F.; Kaufman, Y. The
MODIS fire product. Remote Sens. Environ. 2002, 83, 244–262. [CrossRef]
35. Giglio, L.; Descloitres, J.; Justice, C.O.; Kaufman, Y.J. An Enhanced Contextual Fire Detection Algorithm for MODIS. Remote Sens.
Environ. 2003, 87, 273–282. [CrossRef]
36. Enfield, D.B.; Mestas-Nunez, A.M.; Mayer, D.A.; Cid-Serrano, L. How ubiquitous is the dipole relationship in the tropical Atlantic
Sea Surface Temperatures? J. Geophys. Res. Ocean 1999, 104, 7841–7848. [CrossRef]
37. Jury, M.; Malmgren, B.A.; Winter, A. Subregional precipitation climate of the caribbean and relationship with ENSo and NAO. J.
Geophys. Res. Space Phys. 2007, 112. [CrossRef]You can also read