Mashup Mania with Google Maps
←
→
Page content transcription
If your browser does not render page correctly, please read the page content below
Mashup Mania with Google Maps
                            Version 5: Updated January 2009

Chapter 1: Introduction to Google Maps
A number of new geospatial viewing tools from major players in the Internet industry have
recently appeared on the scene and are taking the geospatial world by storm. Google,
Yahoo, Microsoft, and Amazon have all released web-based mapping tools in the recent
past, and collectively these new players to the industry have raised the bar for Internet
mapping. Although their functional capabilities don‘t provide anything we haven‘t seen in
web offerings from traditional GIS vendors, their emergence has been significant in that they
have managed to capture a wider audience. Google, in particular, has emerged as the leader
of this pack with its Google Maps product which provides a slick, highly responsive visual
interface built using AJAX technologies along with detailed street and aerial imagery data,
and an open API allowing customization of the map output including the ability to add
application specific data to the map.

Many of the barriers to entry into the world of web mapping have been removed by Google
Maps. To understand how this technology has the potential to change the way web mapping
is implemented you must understand the traditional approach to publishing dynamic maps in
a web based environment. Traditional web mapping products have relied on a sophisticated
infrastructure of data, hardware, software, and human resources.

Data for a traditional web mapping application can be broken into two distinct categories:
base data and application specific data. Base data or background data usually includes the

Copyright 2007- 2009: Geospatial Training Services, LLC                                      1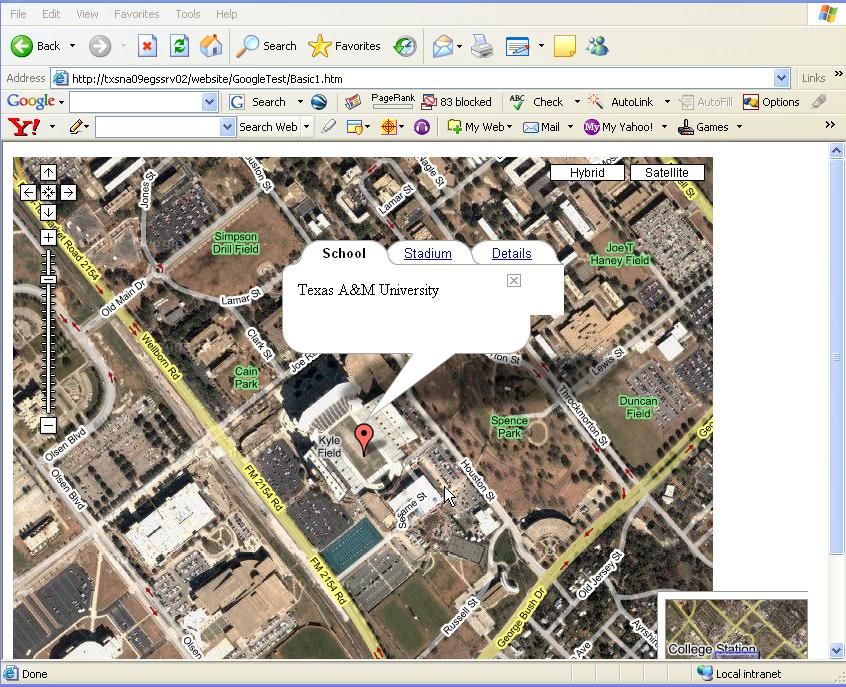
geographic region covered by the application and often includes layers such as aerial imagery
and photos, streets, and organizational boundaries. Application specific data would include
geographic data layers specific to the application being developed. For instance, in a web
mapping application hosted by a city you might have data layers such as parcel and
subdivision boundaries, school locations, public office locations, and many other application
specific layers. Each of these data layers must be located, loaded onto a server managed by
the organization, and updated periodically. With Google Maps you no longer have to worry
about obtaining and managing your own base data. Aerial imagery and street data is
included with Google Maps thus removing the need to obtain and manage these large data
sets. However, you are still required to manage your application specific data in either XML
or database format.

In addition to the complex data requirements of traditional web mapping products you must
also contend with hardware, software, and human resource issues. Hardware and software
must be purchased and effectively managed while human resources are necessary for
managing the software installations, administering the software, and programming the web
applications. Although these requirements are not completely removed through the
introduction of Google Maps, they are greatly reduced. Hardware is still needed to host the
application specific data and web sites, but the software requirements are essentially removed
from the equation. Google Maps is currently a free product and requires no installation or
management. However, because this product is a programmer‘s toolkit or API you will
either need to have some programming expertise or know someone who does. Specifically
you will need skills in JavaScript and possibly another Internet programming language such
as PHP, ASP.NET, or ColdFusion.

1.1 What is Google Maps?
As mentioned in the introduction, Google Maps provides a highly responsive, intuitive
mapping interface with detailed street and aerial imagery data embedded. In addition, map
controls can be embedded in the product to give users full control over map navigation and
the display of street and imagery data. Additionally, users can also perform map panning
through the user of the ―arrow‖ keys on a keyboard as well as dragging the map via the
mouse. These capabilities combine to provide a compelling product, but the primary driver
behind its rapid acceptance as a Internet mapping viewer is the ability to customize the map
to fit application specific needs. For instance, a real estate agency might develop a web
based application that allows end user searching for residential properties the results of
which could be displayed on a Google Maps application. This ability to customize the map
display through the addition of application specific data is the true driver of it‘s acceptance
as a geospatial viewing tool. To get a good idea of the diversity of applications that are
possible through Google Maps, spend some time at the Google Maps Mania Blog.

1.2 Getting a Google Maps Key
At this time, the Google Maps API is a free beta service for Internet applications that are
free to consumer. However, Google reserves the right to put advertising on the map at any
point in the future so keep this in mind as you begin to develop Google Maps applications.

Copyright 2007- 2009: Geospatial Training Services, LLC                                           2
Intranet applications or applications that are not publicly accessible can b created through
the Google Maps Enterprise program and Google Maps API Premier. For more
information on Google Maps Premier please click here.

Before you can get started developing Google Maps applications you will need to sign up for
an API key. When you sign up for an API key you must specify a web site URL that will be
used in your development, and you must also have a Google Account to get the key. A
single Maps API key is valid for a single ―directory‖ or domain. See this FAQ for more
information. There are some additional limitations associated with the key including a
limited number of pages views per day (currently 500,000) and geocoding requests.
Recently, Google also began requiring that you indicate whether your application is using a
sensor such as a GPS to determine the user‘s location. Google Maps will generate a unique
keycode for the directory that you specify when you sign up for the key. You must use this
keycode in each script that accesses the Google Maps API.

1.3 Google Maps Documentation
Google also provides documentation for using its product including full documentation of
the classes, methods, and events available for the Google Maps objects as well as code
examples to get you started. In addition, Google provides a blog and discussion group for
additional information on using the API.

1.4 Creating a Basic Google Map with Controls
When you sign up with Google Maps, an API key will be generated. Make sure you save this
key as you will need it for all Google Maps applications that you develop for the particular
URL directory that was specified. The key should appear similar to the figure you see below.

 In addition to the API key, Google will also generate the code for an example web page
near the Palo Alto area in the vicinity of the Google Headquarters. You can copy and paste
the HTML and JavaScript generated into a plain text file, save it to the web server directory
you specified when you generated the key, and then display the map in your web browser.

As you begin working with the Google Maps API you will notice how easy it is to create a
basic, navigable map with just a few lines of code. Let‘s begin by creating a basic Google
Map and then we‘ll expand on that by adding navigation and map type controls as well as
markers and info windows. First, take a look at the basic example map below.

Copyright 2007- 2009: Geospatial Training Services, LLC                                         3
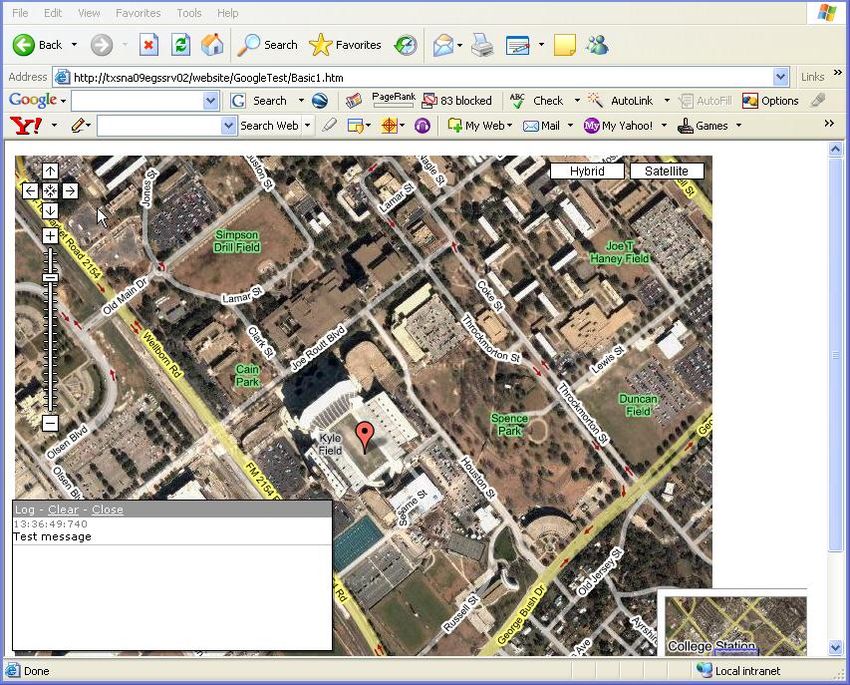
Figure 1: Basic Google Map

Let‘s take a look at the code that was used to generate this simple map. All the code
examples that you will see in this book will be written in JavaScript.

The  tags are used to designate an area that will be used to write JavaScript code.
The first  tag that you see in this example imports the Google Maps library. The
key that you generated must be inserted here. In addition, you must also specify a Google
Maps version id. Notice in our code sample that we‘re using version 2 of the Google Maps
API.

Here is the full code used to generate the basic Google Map.

Copyright 2007- 2009: Geospatial Training Services, LLC                                       4
The  tag serves as a placeholder for your map. You‘ll want to give the tag a name
through the id attribute. In this case we‘ve simply named our placeholder ―map‖.

The second  tag is where all the work of creating your Google Map occurs.

This line creates the Google Map. In the constructor for GMap2 you simply pass in the
 specifying where the map will appear.

This line centers the map at a particular latitude, longitude and zooms to the level specified.
Google uses a 17 point scale with zoom level 0 showing the entire world and zoom level 16
zoomed to the street level.

Now that you‘ve seen a basic Google Map let‘s take the next step and add the navigation and
map type components. We will add each of these components through the addControl( )
method on the GMap2 object.

Copyright 2007- 2009: Geospatial Training Services, LLC                                           5
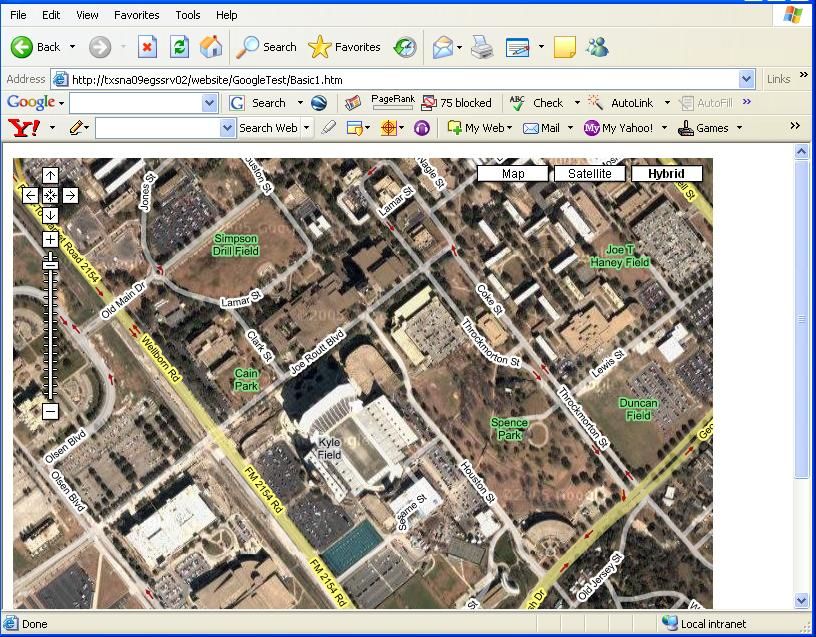
Notice in the code example that we‘ve added two controls to our map.

GLargeMapControl adds a map zoom control that allows the user to change the zoom level
of the map. This control is always located on the left hand side of the map.

GMapTypeControl adds a control to the top right hand corner of the map that allows the
user to flip between the Map, Satellite, and Hybrid views.

These two lines of code result in a map that now looks like the figure below.

Copyright 2007- 2009: Geospatial Training Services, LLC                                  6
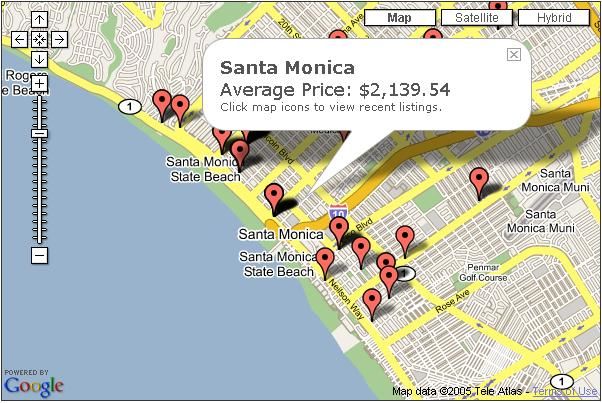
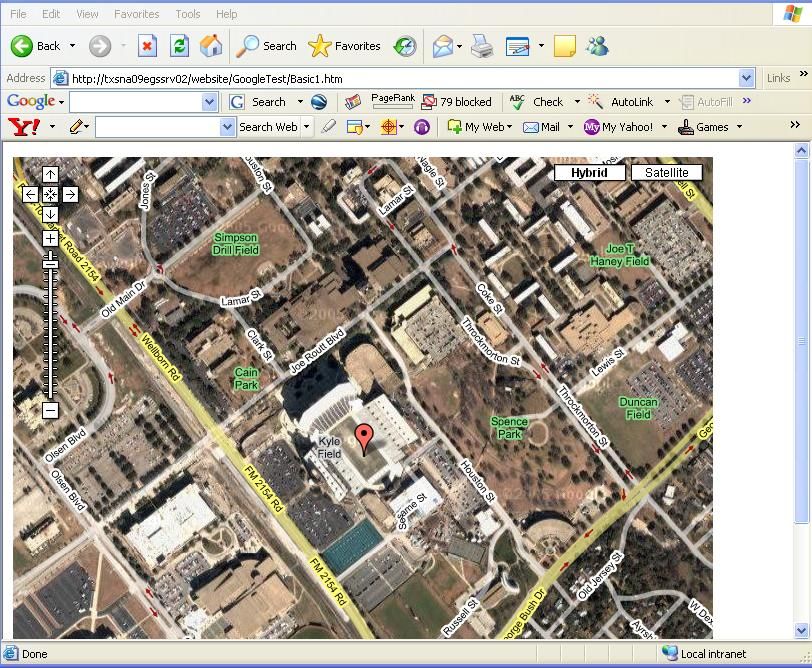
Figure 2: A Basic Google Map with Controls

By default, the Normal view will be displayed when you create a new instance of a Google
Map. However, you can change this to any of several map types, and you can create your
own map types. For instance, if you‘d like the initial display of your map to be a hybrid
display of satellite imagery and streets you could do so with the code that you see below.

The resulting map of the code is shown below.

Copyright 2007- 2009: Geospatial Training Services, LLC                                      7
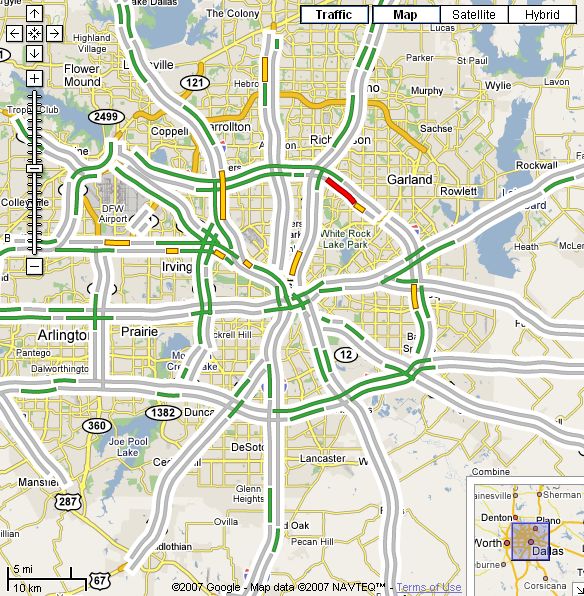
Figure 3: Google Map with Display Changed to Hybrid

Although it is relatively simple we now have a fully functional web mapping application with
just a few lines of code. We can pan, zoom in and out, and change the display style of the
map. Next, let‘s add some point data to our map and attach an info window that we‘ll use to
display attribute information about the point. This is where the true power of Google Maps
really comes into play. By giving you the ability to add points of interest, polylines, and
polygons you can supplement Google Maps with your own user specific data sets. In
addition, the Google Maps API provides classes and methods that allow you to read your
user specific data from an XML file stored on your server making it easy to centralize the
storage of your points of interest. This ability to plot user specific data has truly opened the
world of dynamic web applications to the masses. Although mapping applications have
existed on the web for roughly a decade they have remained largely in the domain of large
organizations with the resources available to purchase and support the infrastructure
necessary to run these applications. However, Google Maps greatly simplifies the task of
creating web based mapping applications and at a mere fraction of the cost in both monetary
and human resource terms. With that said let‘s take a look at how you can add points of
interest and info windows to your Google Maps application. Examine the code example
below to see how to add points of interest and info windows.

Copyright 2007- 2009: Geospatial Training Services, LLC                                       8
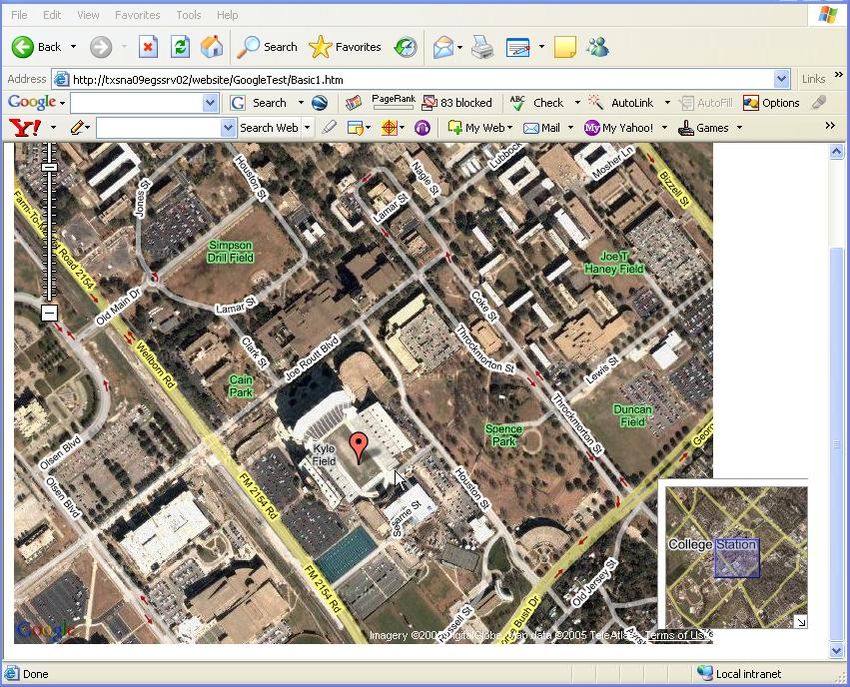
Let‘s take a look at some of the code required to add points of interest and info windows to
your Google Map.

The GLatLng and GMarker classes work together to produce a point of interest that can be
plotted on your map.

This creates a GLatLng object centered at the longitude, latitude coordinate specified, and is
used as the constructor for a new GMarker object.

Now that we have a marker object we can create an info window and attach it to the marker
for display.

We first create a string and assign it to the variable ‗html‘ which will be displayed in the info
window. Any valid html can be used in your info windows. Next, we create a listener for a
particular event. This is accomplished through the GEvent.addListener method. In this
instance, the marker will now respond to the click event. This means that the code specified
in the function will run in response to a user click on the marker. In this case it will display
the html we specified.

Finally, we add the new marker to our map with map.addOverlay(marker)

Copyright 2007- 2009: Geospatial Training Services, LLC                                         9
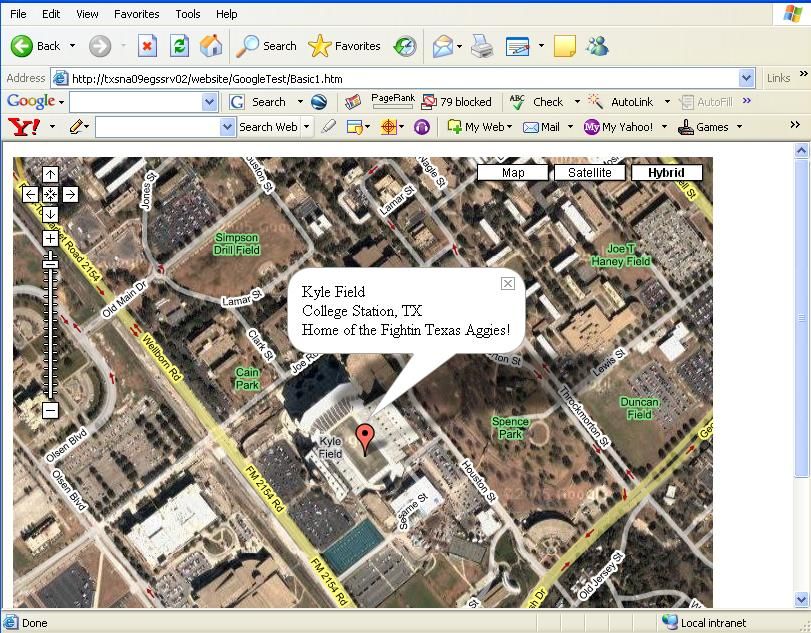
All of this combines to produce an image similar to what you see below.

Figure 4: Google Map with Info Window

Chapter 2: The Google Maps API
Now that you‘ve seen how simple it is to create a Google Maps application let‘s dive into the
details of the Google Maps API so that you can get a much deeper understanding of how
you can manipulate the API in your web mapping applications.

In Figure 5 you will see a visual depiction of some of the commonly used objects in the
Google Maps API. Obviously all Google Maps applications will have a map as the main
display object. This map is represented in the API by the GMap2 object. A number of map
navigation controls can be added to the map including GLargeMapControl,
GSmallMapControl, GMapTypeControl, and GOverviewMapControl. These controls are
used to zoom in and out, pan the map, enable the display of aerial photography, streets, and
other background information, and provide the ability to include an overview map.
GMarker refers to a geographic point of some type and is represented with an icon. You
can use the default icons provided by Google or define your own custom icons. Typically,

Copyright 2007- 2009: Geospatial Training Services, LLC                                   10
these markers refer to an address stored in a database or XML file. Info Windows are often
used in conjunction with GMarker to display attribute information about the marker. For
instance, in a real estate application you might display a photo of a home along with other
relevant details such as the sales price, square footage, number of bedrooms and baths.
These are some of the most commonly used objects, but there are others that we will
explore as well throughout this course.
GMap2
Controls
GLargeMapControl
GSmallMapControl
Info Window
GMarker
Figure 5: Common Google Map Objects
2.1 GMap2
Like the original GMap class, the GMap2 class enables you to create map instances. You
can create as many map instances as necessary for your application although most commonly
this will only be a single instance. Maps are typically embedded within an HTML container
called a tag. The size of the map will default to the size specified in your tag.
Once you‘ve generated an instance of GMap2 you can use the various methods and
properties available on this object to manipulate other aspects of the map such as the
controls, the display of points of interest, polylines, or polygons, and many other things.
Everything in Google Maps flows through an instance of the GMap2 class.
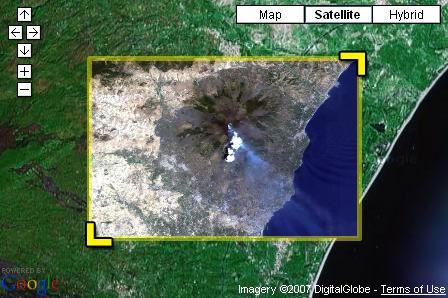
Copyright 2007- 2009: Geospatial Training Services, LLC 11GMap2 Figure 6: GMap2 GMap2 can also respond to a whole host of events. Events are simply an external stimulus to the map and are usually triggered by the user. Typical events might include the user dragging the map or clicking the map, an overlay marker being added to the map, or the map type changing from regular to aerial. You can write code that responds to any of these and other events. For instance, you might want to add a marker at the point where the user clicks the map, or perhaps you could display the latitude, longitude coordinates of the center of the map after a pan event has occurred. The constructor for GMap2 can take a container as its only required argument. In addition, several optional arguments can also be supplied including a list of map types to include with the map and the width and height of the map. Notice in the code example above that we use the HTML document object model to find our tag that has been given the name ―map‖. We can control the map types that are displayed on our map through the use of a second argument. By default, the Map, Satellite, and Terrain map types will be available. However, Copyright 2007- 2009: Geospatial Training Services, LLC 12
you can control the available map types through a list that is provided in the GMap2
constructor.

Notice in the code example above that we are restricting the map types that can be displayed
to hybrid and satellite only, the Map button will be suppressed as seen in the figure below.

Figure 7: Google Map with Satellite and Hybrid Options Only

The final optional parameters control the width and height of the map. If these arguments
are not included in the constructor, the map will default to the size specified in your
container. These numeric parameters specify the pixel height and width of the map.

Once you‘ve created a map object you will have access to a number of methods that can be
used to control the configuration, state, controls, overlays, info windows, and events that can
be associated with a map. We‘ll explore many of these methods throughout the course of
this book.

Copyright 2007- 2009: Geospatial Training Services, LLC                                     13
A number of configuration methods can be used to alter the pan and zoom states for the
display. By default, map dragging (panning) which allows the end user to drag the map in
any direction is enabled. To test the current state of panning in Google Maps the
draggingEnabled( ) method can be used to return a true/false value reflecting the current
state of dragging for a GMap2 object. The enableDragging( ) method enables panning of
the map and the disableDragging( ) method disables panning of the map.

A number of methods related to zooming in and out on the map display are also provided.
For users with a scroll wheel, the enableScrollWheelZoom( ) method can be used to enable
zooming through the use of the mouse‘s scroll wheel. This functionality is disabled by
default, and can be turned off through the API through the use of the
disableScrollWheelZoom( ) method. Finally, the ability to zoom by double clicking the
mouse can be enabled or disabled through the enableDoubleClickZoom( ) and
disableDoubleClickZoom( ) methods.

2.2 GPoint and GLatLng
Prior to Version 2 of the Google Maps API, the GPoint class was used to represent a single,
2-dimensional longitude/latitude point of interest somewhere on the face of the earth.
However, with Version 2 of the API, geographic coordinates are now being represented by a
new class: GLatLng. GPoint now represents a point on a map by its pixel coordinates.

The GLatLng constructor takes two required parameters; y and x. The y parameter
represents latitude while the x parameter represents longitude.

In this code example, -96.340264 represents the x or longitude value while 30.609682
represents the y or latitude value.

GLatLng is normally used for two different yet important functions in Google Maps. The
first reason for using GLatLng is to set the center point of your map. In the code example
below you‘ll see an example of using GLatLng to set the center point of your map. The
setCenter( ) method on GMap2 takes a parameter that centers the map at a given
latitude/longitude coordinate. The setCenter( ) method can also take a second parameter
that sets the zoom level of your map. This will be a numeric value between 0 and 16.
However, it‘s the GLatLng object that is used to set the center of your map.

GLatLng is also used in conjunction with GMarker to create points of interest that are
displayed as markers on your map. GMarker must have a coordinate defined by GLatLng to
know where to place itself on the map. Notice how GMarker uses an instance of GLatLng
in the code example below.

Copyright 2007- 2009: Geospatial Training Services, LLC                                     14
Let‘s examine the GMarker class in more detail to get a better understanding of how it works
with GLatLng to create markers on your Google Map.

2.3 GMarker
The GMarker class is used to create icons showing points of interest on your Google Map.
GMarker takes a single required parameter in its constructor. This parameter is an instance
of GLatLng which we saw in the last code example. A second, optional parameter can be
specified in the event that you need to display custom icons. By default, Google will display
the icon shown here:

The Google Maps Utility library includes a GMarkerManager class which is used to
efficiently manage the visibility of hundreds of markers on a map. The Marker Manager is
used when you need to display a large number of markers on your map. Without the use of
Marker Manager the performance of your application can be very poor when attempting to
display a large number of markers. In addition, Marker Manager can also be used to reduce
the clutter of these markers when viewed at certain map scales. You have the ability to
specify the zoom scale at which markers will appear. The manager monitors the map's
current viewport and zoom level, dynamically adding or removing markers from the map as
they become active. In addition, by allowing markers to specify the zoom levels at which
they display themselves, developers can implement marker clustering. Such management can
greatly speed up map rendering and reduce visual clutter.

To use a marker manager, create a GMarkerManager object simply by passing a map into its
constructor.

After a marker manager object has been created you can add individual markers to the
manager through the addMarker( ) method or you can add a collection of markers as an
array through the addMarkers( ) method. The use of addMarkers( ) is more efficient, but
markers do not become visible on the display until you make an explicit call to the refresh( )
method on GMarkerManager.

The GMarkerManagerOptions object can be used in conjunction with GMarkerManager to
fine-tune the manager‘s performance. The maxZoom, borderPadding, and trackMarkers
fields are used with GMarkerManagerOptions.

       maxZoom – Used to specify the maximum zoom level monitored by the manager.
       The default is the highest zoom level supported by Google Maps.
       borderPadding – Specifies the extra padding, in pixels, monitored by the manager
       outside the current viewport. This allows for markers just out of sight to be
       displayed on the map, and improves panning over small ranges.

Copyright 2007- 2009: Geospatial Training Services, LLC                                     15
trackMarkers – Specifies whether the movement of markers should be tracked by the
marker manager.
In addition to being clickable, marker objects can also be dragged to a new location.
However, this is not the default functionality so you must specify that the marker is to be
draggable in the constructor for a new GMarker. See the following code for an example of
how to do this:
Notice the {draggable: true} statement which is used to enable a draggable marker. By
default, draggable markers are ―bouncy‖, but this behavior can be disabled. Four kinds of
events are supported by draggable markers including click, dragstart, drag, and dragend. To
see an example of a draggable marker please click here.
2.4 GPolyline
A polyline represents a vector line drawn on the map. GPolyline uses two or more instances
of GLatLng to create a vector line between the two points. The vector lines generated by
GPolyline can be created in various colors, weights, and transparency.
Let‘s examine the code above to get a better understanding of how to create polylines in
Google Maps. The first parameter in the GPolyline constructor is an array of GPoint
objects. For our purposes you can think of an array as a list. You must include at least two
points in the array so that GPolyline can create the vector line between the points. Typically
you‘ll also include a number of points between the start and end point. The rest of the
parameters are optional and include the ability to specify the line color, width of the line, and
transparency of the line. The color is specified as a hex HTML color such as #ff0000 for
blue. The width of the line is specified as a numeric value that controls the size of the line in
pixels. Finally, you can control the transparency of the line by including a float value
between 0 and 1 with a value of 1 indicating full transparency.
Copyright 2007- 2009: Geospatial Training Services, LLC 16If you want to show polylines on your map you need to include the VML namespace and some CSS code in your XHTML document to make everything work properly in Microsoft Internet Explorer. The beginning of your XHTML document should look something like this for IE browsers: 2.5 GPolygon The GPolygon class, which is very similar to GPolyline, can be used to create polygonal areas from an array of points. Fill color and opacity attributes can also be applied to the polygon. Here is a quick code example that details how you can use GPolygon to create a polygonal object. In this case, the variable ‗polyPoints‘ has already been created and is an array of points that defines the circular polygon. In addition to the GPolygon constructor you can also use a factory method called fromEncoded to create a polygon (consisting of a number of polylines) from encoded strings of aggregated points and levels. Copyright 2007- 2009: Geospatial Training Services, LLC 17
2.6 GSize
The GSize class represents a two-dimensional size in pixels and is used when defining
custom icons. We‘ll take a closer look at this class later in the book when we examine
custom icons.

2.7 GLatLngBounds
The GLatLngBounds class represents a box or envelope that contains the current
geographic extent of the map. This extent is represented by minimum and maximum x
(longitude) and y (latitude) values whose values change each time a pan or zoom action
occurs. The map.getBounds( ) method returns a GLatLngBounds object.

Chapter 3: Map Controls
The ability to interact with a map is a core function provided by any web mapping
application. Google Maps provides this functionality through the use of map controls which
allow the user to pan, zoom in or out, and change the map type.

3.1 Panning
By default, every Google Map that you create in your application has the ability to pan.
Panning simply gives you the ability to move the map in any direction by ―dragging‖ in that
direction. Google provides a number of ways to accomplish this task. Panning is most
commonly performed simply by using the mouse to drag the map in a particular direction.
In addition, Google provides a map control that can be used for panning the map.

Simply clicking one of the directional arrows will pan the map in the direction selected.

Panning can also be controlled programmatically. As mentioned, panning is enabled
automatically, but through the use of the map.disableDragging( ) method you can disable the
ability to pan. Panning is not typically disabled in most applications, but there are times
when you may have a need to turn off this functionality. For instance, if you are using an
overview map in your application it probably makes sense to disable panning in the overview
map while allowing panning to remain enabled in the main map.

The Google Maps API can also be used to programmatically pan a map. You can use the
panTo(GLatLng) method on GMap2 to programmatically pan the map to a
latitude/longitude coordinate. The panBy(distance) method on GMap2 is used to
programmatically pan the map by a specified distance. Finally, the panDirection(dx, dy )
method is to programmatically pan the map in a direction specified by dx and dy.

Copyright 2007- 2009: Geospatial Training Services, LLC                                     18
3.2 Zooming
The Google Maps API provides the ability to attach zoom controls to your application
thereby giving your users control over the zoom level at which they view your map. The
zoom controls are automatically added to the left side of your map. You have several
choices available when coding your application. The default map control is the
GLargeMapControl object. GLargeMapControl shows all levels of zoom on the slider along
with a plus and minus button at the top and bottom of the slider. In addition to clicking the
various levels on the control you can also drag the slider to the desired level.

If you need to conserve real estate in your application, you can use the GSmallMapControl
which discards the full slider in favor of the plus/minus zoom buttons. It also provides the
pan buttons.

Finally, the smallest possible control available is the GSmallZoomControl which displays
only the plus/minus buttons without the zoom slider or pan controls.

To add any of the three map controls to your application, simply use the addControl( )
method on GMap2 along with the name of the control. For instance, this code example
shows how to add GLargeMapControl to a map:

In the figure below you see an example of all three zoom controls.

            GLargeMapControl              GSmallMapControl           GSmallZoomControl

Figure 8: Zoom Map Controls

In addition to the basic map controls available through the Google Maps API, a new
extended large map control is available through the Google Maps Utility library. This
control is available through the ExtLargeMapControl class. The ExtLargeMapControl utility
class is capable of panning in four directions, zooming in and out, and contains a zoom
slider as seen in the figure below. This control is now part of the default interface at

Copyright 2007- 2009: Geospatial Training Services, LLC                                    19
http://maps.google.com. Figure 9: ExtLargeMapControl 3.3 Map Type Controls Map type controls can be added to your Google Maps to allow users to change the background data displayed by the map. By default, the normal ‗Map‘ mode is displayed showing vector, line drawings of streets, water bodies, parks, and other points of interest. In addition to the default Normal mode, several other map types are available including Satellite, Terrain, and Hybrid. Satellite mode shows aerial imagery of the area while Hybrid mode displays streets and labels semi-transparently over a satellite image. By default, all three map types are displayed similar to what you see below with the Normal mode being the default type. As mentioned earlier in the book, you have control over which map types are displayed in your application through the mapTypes argument on the GMap2 constructor. The mapTypes argument is an array containing the map types you‘d like to display. An array in Javascript is similar to a list. Notice that the creation of the array is specified with opening and closing brackets. In the code example above, only the Hybrid and Satellite map types will be displayed. Several additional methods on GMap2 can be used manipulate map types. The map.setMapType(map_type) method is used to specify the currently visible map type. For instance, the following code example would set the current map type to Hybrid. Copyright 2007- 2009: Geospatial Training Services, LLC 20
In addition to the G_HYBRID_MAP you may also specify values for Satellite
(G_SATELLITE_MAP), Map (G_NORMAL_MAP), Terrain (G_PHYSICAL_MAP), and
a few others that display terrain for the Earth‘s moon, Mars, and Google Earth.

The map.getCurrentMapType( ) method can be used to get the active map type while
map.getMapTypes( ) returns an array containing all the map types available in the map.
Now, the interesting thing with both these methods is that neither method returns a
descriptive string for the map types. They both return objects and neither object contains
helper functions that return the textual name of the map type(s). You will have to write a
simple helper function to return this information in a human readable format. I am
including just such a function in the code sample below.

3.4 OverView Map Control
You can also add an overview map to your application. As is the case with the other types
of map controls, GOverviewMapControl can be added through the addControl( ) method
on GMap2 as you see in the code sample below.

This will add a collapsible overview map to the corner of the screen which displays the
geographic extent of the main map. The geographic extent of the main map can be
controlled by dragging the rectangular extent in the overview map. See Figure 10 below for
an example of an application with an overview map included.

Copyright 2007- 2009: Geospatial Training Services, LLC                                      21
Figure 10: GOverviewMapControl

3.5 Scale Control
The Scale Control which provides a scale bar for your map can also be added to your
application. This control is added to your application in the same way as any other map
control and provides a visual depiction of distance.

3.6 Positioning Controls
You also have the ability to control the positioning of your controls relative to the map.
This is accomplished through the GMap2.addControl( ) method. The addControl method
takes an instance of GControlPosition, and an optional offset. GControlPosition can be set
to one of the four values that you see below which are used to control the position of the
control. The optional offset is set in pixel units and determines how far from the edge of
the map to place the control.

Copyright 2007- 2009: Geospatial Training Services, LLC                                   22
Chapter 4: Adding User Data
We briefly touched on the subject of adding application specific data in a previous chapter,
but let‘s delve into this subject in greater detail in this section. As I mentioned, the ability to
add user specific application data has been one of the main drivers in the widespread use of
Google Maps for the development of web mapping applications. In this chapter we‘ll take a
look at the various objects that you can use to add user data and info windows to your
Google Maps application.

4.1 GMarker
The GMarker class is used to create icons showing points of interest on your Google Map.
In the Google Maps API chapter we introduced GMarker, and we said that GMarker is used
in conjunction with GLatLng to plot points of interest on a map. Let‘s provide a bit of a
refresher on the GLatLng object before going into more detail on GMarker. Remember that
GLatLng stores a latitude/longitude coordinate representing the geographic coordinates of a
point of interest.

However, GLatLng does not provide the capability of plotting points on a map. This
functionality is provided by the GMarker object which uses an instance of GLatLng to plot
an icon at the coordinates specified in an instance of GLatLng. The constructor for
GMarker takes a single required parameter containing an instance of GLatLng.

GMarker will display the default icon provided by Google Maps if you do not specify the
second (optional) parameter in the GMarker constructor.

Once you‘ve created an instance of GMarker you need to call the map.addOverlay( ) method
to actually plot the icon on the map.

Copyright 2007- 2009: Geospatial Training Services, LLC                                          23
Icons can be removed from a map through the use of one of two methods provided on
GMap2. The map.removeOverlay(marker) method can be used to remove a single instance
of GMarker while map.clearOverlays( ) is used to remove all markers that have been added
to a map.

One thing that you will want to keep in mind is that although you can theoretically add an
unlimited number of markers to your map you will find that performance starts to suffer
when you attempt to add more than a couple hundred markers. The previously discussed
GMarkerManager class should be used in instances where you need to efficiently add large
numbers of markers to the map display.

4.2 GIcon
In many instances you may not want to use the default marker icon provided by Google
Maps. Perhaps you have your own set of icons that accurately represent the user data you
are attempting to present in your application. In Figure 11 you will see an sample of an
application that was created using custom GIcons. Fortunately, Google Maps provides the
ability to customize the look and feel of the user data in your application. Through the use
of the GIcon object your can attach any PNG file to create a custom marker. Theoretically
your icon files can be of any size, but for practical purposes you should keep the size
between 20-30 square pixels. For example, the default marker provided by Google Maps is
24x30. Anything larger makes the icons appear too large in relation to the map. It is beyond
the scope of this book to go into great detail on how to create these icons, but we‘ll show
you how to use them once you (or a graphic artist) create them.

Many additional customizations of your icons are possible. Most custom icons also come
with an additional icon that represents the shadow of an icon. Through the use of the
icon.shadow( ) and icon.shadowSize( ) methods you can add these shadow files to your
icons. At a minimum you should specify the icon, iconSize, shadow, and shadowSize
properties as you see in the code example below.

In addition to these properties the icon.iconAnchor and icon.infoWindowAnchor properties
can be used to specify anchor points. The icon.iconAnchor property is used to specify the
exact pixel that will be attached to the instance of GLatLng. For example, if you want the
upper left hand corner of an icon to be placed at the point of interest you specify a value of
0,0. When your application is going to use Info Windows you will also want to specify the
icon.infoWindowAnchor property which will be used as the origination point of the Info
Window.

For browser compatibility reasons, specifying custom icons can become very complex and
there are a number of other properties that can be set to account for the differences in
browser types. For more details on these additional properties please see the Google Maps

Copyright 2007- 2009: Geospatial Training Services, LLC                                      24
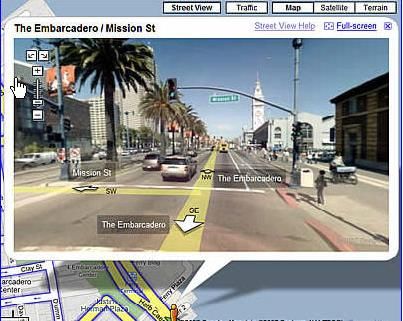
API Documentation for the printImage, mozPrintImage, printShadow, transparent, and
imageMap properties on GIcon.

Figure 11: Custom Icons Created with GIcon

4.3 Info Windows
Info Windows are used to display attribute information about points. You can display an
Info Window through the use of one of the openInfoWindow methods on GMap2.
Normally, Info Windows are opened just above a marker, but can be placed anywhere on a
map. Usually, Info Windows hold HTML information such as text, links, and images.

The openInfoWindowHtml( ) method can be called from either an instance of GMap2 or
GMarker, and simply takes a string containing HTML markup and displays it in an Info
Window. Let‘s take a look at how to use this method with both GMap2 and GMarker.
With GMarker you can use openInfoWindowHtml( ) to open an Info Window directly
above the marker.

Notice in this case that we first defined a variable called html that we use to define the
HTML markup that will be displayed in the Info Window. This isn‘t absolutely necessary,
but it‘s perhaps a bit cleaner. The marker.openInfoWindowHtml method is then called and
the html variable is passed in as the only parameter. You‘ll also notice that we used a new

Copyright 2007- 2009: Geospatial Training Services, LLC                                  25
class that we haven‘t discussed up to this point. The GEvent class is used to register event
listeners. We‘ll go into much greater detail on the GEvent class in a later chapter, but for
now you can think of events as user initiated actions. In this case the event we are
registering is a mouse click on the marker. When the user clicks the marker the Info
Window will be displayed with the contents of the html variable displayed inside the window
as you see in the figure below.

Figure 12: Google Map with Info Window

The map.openInfoWindowHtml( ) method also opens an Info Window containing an
HTML string, but it differs slightly from marker.openInfoWindowHtml( ) in that you must
pass in a point as the required first parameter along with an html string. Several optional
parameters are also available including a pixelOffset parameter that controls where the Info
Window originates. Basically this is the anchor of the Info Window. The
map.openInfoWindowHtml( ) method is normally used to automatically display an Info
Window without any sort of user initiated event like a mouse click. Take a look at the code
below to see an example of how to use map.openInfoWindowHtml( ) to automatically open
an Info Window when the map is displayed.

Copyright 2007- 2009: Geospatial Training Services, LLC                                   26
Notice that we use a GLatLng instance (pt) already defined elsewhere in our code along with
an offset to automatically display the html code in an Info Window when the map is created.

Several other methods are also available through GMap2 and GMarker for displaying Info
Windows. These include the openInfoWindow( ) method which is used to display an
HTML DOM element and openInfoWindowXslt( ) which displays XML in an Info
Window.

One exciting new method introduced at Version 2 of the Google Maps API is the
openInfoWindowTabsHtml( ) method. openInfoWindowTabsHtml( ) gives you the ability
to include tabs in your Info Windows through the GInfoWindowTab class similar to what
you see in Figure 13.

Figure 13: New Tabbed Info Window

The following code was used to produce this new, tabbed version of the Info Window.

Copyright 2007- 2009: Geospatial Training Services, LLC                                  27
The openInfoWindowTabsHtml( ) method is supplied with an array (infoTabs) of
GInfoWinowTab objects that specify the tab name and HTML that will be included on each
tab.

Should the need arise you can also suppress the display of Info Windows at the map level
through the use of the map.disableInfoWindow( ) method. By default, the display of Info
Windows is enabled so you shouldn‘t call this method unless you have a specific need to
suppress their display.

Chapter 5: Events
For those of you new to programming, events can be described as actions that take place
within an application. Typically these actions are invoked by the user and could include
things such as clicking a point on the map, dragging the map in an effort to pan, and
changing map types from map to satellite. These are all examples of user generated events.
In any case, an event is a user or system generated action. You can write application code
that responds to these events in some way. For example, when the user clicks the map, you
could add a GMarker at the point where the user clicked. Another example could include
displaying the latitude, longitude coordinates where the user clicked the map. The GMap2
and GMarker classes in the Google Maps API have a list of events that they can respond to
and we‘ll examine these in more detail soon, but first let‘s look at the mechanics of how you
register an event.

5.1 GEvent
All registration and handling of events occurs through the GEvent class which exposes a
number of static methods for these purposes. A static method is simply a method that is
called on the class itself rather than an instance of the class. In other words, you don‘t need
to create an instance of GEvent to call its methods.

The addListener( ) method is used to register an event with the system. For instance, the
following code can be used to register the ―click‖ event on GMarker.

Copyright 2007- 2009: Geospatial Training Services, LLC                                      28
Three required parameters are included with the addListener( ) method. The first parameter
is the source or object that will be responding to the event. The second parameter is the
event that it will listen for. In this case we‘re registering the click event with a marker object.
Our final parameter is a function that will run in response to the event. In our example, the
marker will display an Info Window when clicked.

Removal of listeners can be accomplished through either the removeListener( ) method
which removes an individual event or the clearListeners( ) method which will remove all
currently active events.

In cases where you need to trigger an event without user input you can call the trigger( )
method which can be used to trigger the function for a particular event.

Chapter 6: Geocoding
Plotting points of interest on a map is perhaps the most commonly used function in Google
Maps. In Figure 14 you will see a visual example of an application that plots various address
points on a map. To plot these points, you must have latitude, longitude coordinates for
each point of interest or address. These coordinates are generated through a process known
as geocoding which can be defined as an interpolation of the geographic location (latitude,
longitude) of an address.

Figure 14: Geocoded Addresses

Copyright 2007- 2009: Geospatial Training Services, LLC                                         29
Let‘s examine a real world geocoding example. Assume for a moment that we have a point
of interest located at 150 Main St. What we need to do is determine the geographic
coordinates for this address. In the real world, Main Street could be a road segment with an
address range of 100 to 200. Geocoding software is used to interpolate the relative location
of 150 Main St. in relation to the existing Main Street segment that runs from 100 to 200
Main St. In this simple case, the geocoding software would interpolate 150 Main St. as being
exactly half way between 100 and 200 Main St. The software will then assign a latitude,
longitude coordinate to this address. After an address has been geocoded it can then be
plotted as a map overlay in Google Maps similar to what you see in Figure 13 where multiple
addresses have been geocoded and plotted on the map.

6.1 GClientGeocoder
The next logical question at this point would be ―How do I obtain geocoding software so
that I can geocode my addresses?‖ The Google Maps API contains geocoding functionality
in the form of a GClientGeocoder object which allows you to submit addresses for
geocoding via JavaScript. In addition, this functionality can also be accessed via HTTP
requests directly from a client browser. Some nice features of the geocoding functionality
include:
         No need to break up the address into street components such as street name, city,
         country. The address can be submitted as a single string.
         No need to worry about capitalization or punctuation
         Geocoder returns a nicely formatted version of the address you sent
         Geocoder returns the address broken up into components like street, country,
         province, prefecture, postal code, etc.
         Simpler version that returns a GLatLng
         Built-in cache to make the user experience faster response times on commonly used
         addresses
         Street level geocoding for many countries around the world

At this time you are limited to 50,000 geocode requests per day per API key. According to
Google if you have a fairly stable database of addresses (e.g. a list of properties for sale), it is
recommended that you geocode them once using the HTTP request method and cache the
coordinates in your own database. This means your site will be faster for your users and also
uses up less of your daily quota of geocode requests. Let‘s focus on the functionality
provided by the GClientGeocoder object.

An instance of GClientGeocoder can be created with the following line of code:

This instance of a geocoder talks directly to Google servers to fulfill geocoding requests. An
optional cache parameter allows you to specify a custom client-side cache of known
addresses. GClientGeocoder has two methods that can be used to send an address to
Google for geocoding: getLatLng( ) and getLocations( ).

Copyright 2007- 2009: Geospatial Training Services, LLC                                           30
The getLatLng( ) method sends a request to Google servers to geocode the specified
address. If the address is successfully located, the user-specified callback function is invoked
with a GLatLng point. Otherwise, the callback function is given a null point. In the case of
an ambiguous address, only the point for the best match is passed to the callback function.
Take a look at the code example below for more information on how to call getlatLng( ). In
this example, we geocode an address, add a marker at that point, and open an info window
displaying the address.
The getLocations( ) method also sends a request to Google to geocode a specified address.
However, getLocations( ) differs in that it returns a JSON object containing a status code
and one or more Placemark objects. The status code is a response indicating whether the
geocode request was successful or not. Below you will see a partial listing of result codes.
For a full list please see the Google Maps documentation.
G_GEO_SUCCESS No errors ocurred; the address was successfully parsed
and its geocode has been returned. (Since 2.55)
G_GEO_SERVER_ERROR A geocoding request could not be successfully
processed, yet the exact reason for the failure is not
known. (Since 2.55)
G_GEO_MISSING_ADDRESS The HTTP q parameter was either missing or had no
value. (Since 2.55)
G_GEO_UNKNOWN_ADDRESS No corresponding geographic location could be found
for the specified address. This may be due to the fact
that the address is relatively new, or it may be
incorrect. (Since 2.55)
G_UNAVAILABLE_ADDRESS The geocode for the given address cannot be returned
due to legal or contractual reasons. (Since 2.55)
G_GEO_BAD_KEY The given key is either invalid or does not match the
domain for which it was given. (Since 2.55)
Copyright 2007- 2009: Geospatial Training Services, LLC 31For successfully geocoded addresses the API also returns information about how accurately
the address has been geocoded. The Accuracy attribute in the response will be one of the
following values:
Value Description
0 Unknown Location
1 Country level accuracy
2 Region (state, province, prefecture) level
accuracy
3 Sub-region (county, village) level accuracy
4 Town (city, village) level accuracy
5 Post Code (zipcode, postal code) level
accuracy
6 Street level accuracy
7 Intersection level accuracy
8 Address level accuracy
In addition to the status code, one or more Placemark objects are returned. Multiple
Placemark objects are returned in the event that the geocoder finds more than one match.
Each Placemark object is composed of an address (nicely formatted and capitalized),
AddressDetails, and a Point representing the location of the geocoded address. For an
example of a typical JSON object returned by the getLocations( ) method as well as a code
example please see the Google documentation.
6.2 Caching Geocodes with GGeocodeCache
Performance of the geocoder can be improved through the use of the caching functionality
built into GClientGeocoder. This cache stores geocoded responses so that if the same
address is geocoded again, the response will be returned from the cache rather than the
Google geocoder. This improves the performance of your application and lessens the
number of requests sent to the geocoding service. By default, caching is enabled, but can be
turned off by passing a null value to the setCache( ) method on GClientGeocoder. Caching
is controlled through the GGeocodeCache class. A new instance of GGeocodeCache is
created through the GGeocodeCache( ) constructor which immediately calls the reset( )
method to empty the cache. Addresses can then be placed into the cache with the
put( address,reply) method which stores the given reply under the given address. Addresses
can be retrieved from the cache through the get(address) method which returns the reply
stored under the given address. As we mentioned, the reset( ) method purges all addresses
from the current cache.
One of the useful aspects of caching functionality is the ability to pre-build a cache to
account for commonly used addresses in an application. For example, if you have an
application that displays common tourist attractions you would want to pre-build a client
cache containing the geocoded address for each of the attractions. This would remove the
need to continually query the Google geocoder for the point of interest.
Copyright 2007- 2009: Geospatial Training Services, LLC 326.3 HTTP Geocoding Requests
In addition to the GClientGeocoder object you can also access the Maps API geocoder
functionality through HTTP requests. Combined with the XmlHttpRequest AJAX object,
this gives you the ability to send geocode requests through server-side scripting. A request
should be sent to http://maps.google.com/maps/geo? with the following parameters:
q - The address that you want to geocode
key – Your Google Maps API key
output – The format option (xml, kml, json)
For example:
http://maps.google.com/maps/geo?q=21734+Longwood,+San+Antonio+TX&output
=xml&key=ABQIAAAA7_kD1t_m22HBF9feCaDPZxQZuc26M5nLyzIhAY0gIOH-
LGKPdxQ6r3IzloZck1JnK6eAB02QGYg4Tg
In this case, we have specified a return type of ―xml‖ which returns an XML output. Open a
web browser and paste the code above into the address bar and hit the ―Enter‖ key to see
the XML output returned by an HTTP request to the geocoder. It should look something
like what you see below in Figure 14.
Figure 15: XML returned by an HTTP request to Google Maps Geocoder
Copyright 2007- 2009: Geospatial Training Services, LLC 336.4 Reverse Geocoding The Google Maps API can also perform reverse geocoding which converts a point location to an address. This point location is represented in Google Maps as an instance of GLatLng. This GLatLng instance is passed into the GClientGeocoder.getLocations( ) method instead of an address as you can see in the code example below. A JSON object containing the closest addressable location is returned. Please note that in some cases the nearest address may be quite some distance from the point that was passed into the method. To plot the address on Google Maps you will need to parse the JSON object. The response, returned as a JSON object, can then queried for the Placemark and plotted to the map. To view a reverse geocoding example please click here. Chapter 7: Using AJAX At this point we‘ve covered all the major bases related to the Google Maps API save for one all important topic; AJAX. AJAX is what makes Google Maps such an attractive platform for building interactive web mapping applications. The traditional web mapping application model works something like this: Most user actions in the interface trigger an HTTP request back to a web server. The server does some processing — retrieving data, crunching numbers, talking to various legacy systems — and then returns an HTML page to the client. It‘s a model adapted from the Web‘s original use as a hypertext medium, but what makes the Web good for hypertext doesn‘t necessarily make it good for software applications (James, Copyright 2007- 2009: Geospatial Training Services, LLC 34
Jesse, 2005). The traditional approach to web application development makes sense from a
technical point of view, but from a practical standpoint it leaves much to be desired in that it
forces the user to wait while the server completes its processing and refreshes the display
with a new page. AJAX changes this traditional model.

7.1 What is AJAX?
AJAX (Asynchronous JavaScript + XML) isn‘t a technology, but rather several technologies
working in concert to produce the capability of creating highly interactive, rich, and
responsive web applications. AJAX incorporates the following technologies:
       standards-based presentation using XHTML and CSS
       dynamic display and interaction using the Document Object Model
       data interchange and manipulation using XML and XSLT
       asynchronous data retrieval using XMLHttpRequest
       JavaScript to bind everything together

An AJAX application eliminates the start-stop-start-stop nature of interaction on the Web by
introducing an intermediary — an AJAX engine — between the user and the server. It
seems like adding a layer to the application would make it less responsive, but the opposite is
true (James, Jesse, 2005)

Instead of loading a webpage, at the start of the session, the browser loads an AJAX engine
— written in JavaScript and usually tucked away in a hidden frame. This engine is
responsible for both rendering the interface the user sees and communicating with the server
on the user‘s behalf. The AJAX engine allows the user‘s interaction with the application to
happen asynchronously — independent of communication with the server. So the user is
never staring at a blank browser window and an hourglass icon, waiting around for the
server to do something (James, Jesse, 2005).

7.2 XMLHttpRequest

Part of the AJAX equation is the XMLHttpRequest object which is the technical component
that makes asynchronous server communication possible. Basically, the XMLHttpRequest
object provides a method for client side JavaScript to make HTTP requests. Even though
the object is called XMLHttpRequest, this object is not limited to being used just with XML.
It can request or send any type of document. So what‘s the big deal you say? Well, here is a
partial list of what can be accomplished through this object.
         Call server-side scripts without refreshing the page

            o This ability alone is a huge benefit for web application interactivity.

            o Typically you would call server-side scripts in HTML through forms.
              However, forms require a page reload which is not user friendly.

            o Calling server-side scripts through XMLHttpRequest allows you to call the
              script without refreshing the page.

Copyright 2007- 2009: Geospatial Training Services, LLC                                       35
Load and read XML files
o This is important for Google Maps applications because it allows you to read
in points of interest stored in XML files and plot them to the map without
refreshing the display.
Make HEAD requests
Does a URL exist?
Let‘s take a closer look at the XMLHttpRequest object for more details on how it works.
The GXmlHttp object in the Google Maps API is used to create a cross-browser
XmlHttpRequest so you‘ll be using the same methods and properties.
New instances of the XMLHttpRequest class are created in slightly different ways depending
upon the browser. For Safari and Mozilla browsers, the following call creates a new instance
of XMLHttpRequest.
For IE, you‘ll need to pass in the name of the object to the ActiveX constructor as you see
below.
In Google Maps the GXmlHttp class exports a factory method called GXmlHttp.create( )
that creates a cross-browser XmlHttpRequest instace so you won‘t have to distinguish
between the browser types when creating mapping applications built with Google.
Object Methods
All instances of the XMLHttpRequest object share a list of methods and properties.
Table 1. Common XMLHttpRequest Object Methods
Method Description
abort() Stops the current request
getAllResponseHeaders() Returns complete set of headers (labels and values) as a
string
getResponseHeader("headerLabel") Returns the string value of a single header label
open("method", "URL"[, asyncFlag[, "userName"[, Assigns destination URL, method, and other optional
"password"]]]) attributes of a pending request
Copyright 2007- 2009: Geospatial Training Services, LLC 36You can also read