Tropical cyclones vertical structure from GNSS radio occultation: an archive covering the period 2001-2018 - ESSD
←
→
Page content transcription
If your browser does not render page correctly, please read the page content below

Earth Syst. Sci. Data, 12, 1–15, 2020
https://doi.org/10.5194/essd-12-1-2020
© Author(s) 2020. This work is distributed under
the Creative Commons Attribution 4.0 License.

           Tropical cyclones vertical structure from GNSS radio
          occultation: an archive covering the period 2001–2018
                Elżbieta Lasota1,2 , Andrea K. Steiner3,4 , Gottfried Kirchengast3,4 , and Riccardo Biondi2
                                           1 Institute
                                                    of Geodesy and Geoinformatics,
                       Wrocław University of Environmental and Life Sciences, Wrocław, 50356, Poland
                       2 Dipartimento di Geoscienze, Università degli Studi di Padova, Padua, 35131, Italy
             3 Wegener Center for Climate and Global Change (WEGC), University of Graz, Graz, 8010, Austria
              4 Institute for Geophysics, Astrophysics, and Meteorology/Institute of Physics, University of Graz,

                                                      Graz, 8010, Austria
                               Correspondence: Riccardo Biondi (riccardo@biondiriccardo.it)

                                     Received: 21 May 2020 – Discussion started: 18 June 2020
                                Revised: 24 August 2020 – Accepted: 17 September 2020 – Published:

       Abstract. Tropical cyclones (TC) are natural destructive phenomena, which affect wide tropical and subtropical
       areas every year. Although the correct prediction of their tracks and intensity has improved over recent years,
       the knowledge about their structure and development is still insufficient. The Global Navigation Satellite System
       (GNSS) radio occultation (RO) technique can provide a better understanding of the TC because it enables us
       to probe the atmospheric vertical structure with high accuracy, high vertical resolution and global coverage
       in any weather conditions. In this work, we create an archive of co-located TC best tracks and RO profiles
       covering the period 2001–2018 and providing a complete view of the storms since the pre-cyclone status to the
       cyclone disappearance. We collected 1822 TC best tracks from the International Best Track Archive for Climate
       Stewardship and co-located them with 48 313 RO profiles from seven satellite missions processed by the Wegener
       Center for Climate and Global Change. We provide information about location and intensity of the TC, RO
       vertical profiles co-located within 3 h and 500 km from the TC eye centre, and exact information about temporal
       and spatial distance between the TC centre and the RO mean tangent point. A statistical analysis shows how the
       archive covers all the ocean basins and all the intensity categories well. We finally demonstrate the application
       of this dataset to investigate the vertical structure for one TC example case. All the data files, separately for each
       TC, are publicly available in NetCDF format at https://doi.org/10.25364/WEGC/TC-RO1.0:2020.1 (Lasota et
       al., 2020).

1   Introduction                                                    sphere with high vertical resolution and high accuracy (An-
                                                                    thes et al., 2008). The GNSS RO technique uses GNSS sig-
The tropical cyclones (TCs), known also as hurricanes in the        nals and low Earth orbit (LEO) receivers to profile the at-
North Atlantic Ocean and northeast Pacific, typhoons in the         mospheric refractivity, from which profiles of temperature,
northwest Pacific, and simply as cyclones in the South Pacific      pressure and humidity (Kursinski et al., 1997) are retrieved
and Indian Ocean, are extreme weather events affecting the          in the moist atmosphere by using background information.
social lives of many people and the economy of entire coun-         The RO technique was developed for observing the Earth’s
tries. The understanding of the development of TCs have in-         atmosphere and climate (Anthes et al., 2008; Steiner et al.,
creased with the availability of satellite measurements, but        2011). It became important for the analyses and forecast of
a decisive improvement was given in the last decade by the          extreme atmospheric events (Bonafoni et al., 2019) motivat-
use of the Global Navigation Satellite System (GNSS) radio
occultation (RO) technique allowing us to profile the atmo-

Published by Copernicus Publications.
2                                           E. Lasota et al.: Tropical cyclones vertical structure from GNSS radio occultation

ing the interest and the launch of several new public and pri-      in 2001. The results revealed that the RO temperature pro-
vate missions (Cirac-Claveras, 2019).                               files were consistent within 1 K, whilst RO water vapour ob-
   Cardinali (2009) showed the high impact of RO to im-             servations tended to be slightly drier than radiosonde mea-
prove weather forecast, especially in remote areas of the           surements above the middle troposphere. A similar agree-
globe where no other instruments are available with high ver-       ment between RO and dropsonde observations was presented
tical resolution. Several studies demonstrated the impact of        by Anthes (2011) for the Typhoon Jangmi in 2008. Anthes
RO profiles to improve the TC track forecast with assimila-         et al. (2008) demonstrated the importance of RO tempera-
tion in numerical weather prediction (NWP) models. Huang            ture and WV assimilation to forecast Hurricane Ernesto in
et al. (2005), for the first time, assimilated RO refractivity      2006 (Chen et al., 2014; Liu et al., 2012). Winterbottom
profiles to forecast the typhoons Nari in 2001 and Nakri in         and Xiao (2010) showed that the quality and the horizontal
2002, which developed in the northwestern Pacific Ocean.            resolution of RO was high enough to study TCs, even be-
This study was followed by many others, focusing on cy-             fore the Constellation Observing System for Meteorology,
clone events: Hurricane Ernesto in 2006 (Liu et al., 2012),         Ionosphere and Climate (COSMIC) six-satellite mission was
Typhoon Usagi in 2007 (Kunii et al., 2012), typhoons Jangmi         launched. However, thanks to the higher number of RO ob-
in 2008, Hagupit in 2008 and Sinlaku in 2008 (Hsiao et al.,         servations provided from COSMIC after 2006, it has been
2012), Super-cyclone Gonu in 2007 (Anisetty et al., 2014),          possible to get a better understanding of the TCs’ thermal
and Tropical Cyclone Phailin in 2013 (Hima Bindu et al.,            structure: a warm core in the troposphere (Zou and Tian,
2016). Huang et al. (2010) were the first who analysed a com-       2018), a cooling corresponding to the TC anvil top height
plete TC season followed by Chen et al. (2015). In a recent         (Biondi et al., 2013; Rivoire et al., 2016) and an increase in
study, Chen et al. (2020) assimilated RO data during the gen-       WV in the lower stratosphere (LS) above the outermost rain-
esis of 10 TCs in the northwestern Pacific Ocean in the period      bands (Venkat Ratnam et al., 2016). Vergados et al. (2013)
2008–2010. The results confirmed the benefit of assimilation        for the first time used more than 1500 RO temperature, water
of RO refractivity improving the humidity estimation in the         vapour and refractivity profiles to study the moist thermo-
lower and the middle troposphere and thus the forecast of           dynamic structure in the lower and the upper troposphere of
the TCs. However, RO data are now widely used to study              42 North Atlantic TCs in the period 2002–2010. The anal-
the TCs’ structure and their impact on the surrounding atmo-        ysis showed that the RO observations are able to capture
sphere. Biondi et al. (2011a) investigated for the first time the   the dimension, eyewall and rainbands of the TCs at different
vertical structure of Typhoon Hondo in 2008 and Hurricane           stages. In particular, the gradual decrease and wavelike pat-
Bertha in 2008 and found a clear signature of the TC cloud          tern of water vapour was observed with increasing distance
top height. Biondi et al. (2011b) demonstrated that the pres-       from the TC centre. Furthermore, a drop of WV was noticed
ence of a TC creates a large positive bending angle anomaly         in the lower and upper troposphere when the TCs develop
in the upper troposphere and lower stratosphere (UTLS) cor-         from a tropical depression to Category 1 intensity.
responding to the TC anvil cloud top. The validation of these          The tropopause layer is often affected by the presence of
results with radiosondes and the Cloud-Aerosol Lidar with           the TC, and this is easily detectable by using the RO pro-
Orthogonal Polarization (CALIOP) revealed that the bending          files. In particular, the high vertical resolution of RO profiles
angle can be used to detect the cloud top (Biondi et al., 2013)     shows that the TC anvil top generates a double tropopause
and the possible overshooting (Biondi et al., 2015). In a more      effect when it does not reach the tropopause level (Biondi
recent study, Lasota et al. (2018) analysed the RO bending          et al., 2011b, 2013; Vergados et al., 2014) and the tropical
angle sensitivity to the presence of clouds in TCs showing a        tropopause layer (TTL) thickness is reduced (Ravindra Babu
significant signature of clouds between 8 and 14 km of alti-        et al., 2015; Venkat Ratnam et al., 2016). Deep convective
tude.                                                               towers, usually developed within the TC eyewall and rain-
   With the advent of the RO, the scientific community was          bands, generate gravity waves (GWs) transporting energy to
able to better understand the TC inner thermal structure            the upper atmosphere. The high vertical resolution of RO can
and water vapour (WV) content at different layers. The TC           reveal the GW spectral characteristics (Chane Ming et al.,
track and intensity predictions, until 2006, were almost com-       2014) associated with the presence of the TC and show how
pletely based on parameters such as surface temperature,            the intensification of the TC creates LS GWs (Chane Ming et
cloud top temperature and surface winds at the outer radius         al., 2014; Rakshit et al., 2018). A comprehensive review on
(Brueske and Velden, 2003; Demuth et al., 2004; Dvorak,             the use of RO observations to study TCs is given by Bonafoni
1975; Kidder et al., 1978; Velden et al., 2006) from different      et al. (2019).
remote sensing techniques such as infrared and microwave               GNSS RO data are processed by several processing centres
sounders and imagers (King et al., 1992), lidar (Poole et           (Danish Meteorological Institute – DMI, EUMETSAT, Ger-
al., 2003), reflected light polarization (Knibbe et al., 2000),     man Research Centre for Geosciences – GFZ, Jet Propulsion
and oxygen A-band technique (Koelemeijer et al., 2002).             Laboratory – JPL, University Corporation for Atmospheric
Anthes et al. (2003) were the first, comparing RO sound-            Research – UCAR, Wegener Center for Climate and Global
ings with radiosonde observations during the Typhoon Toraji         Change – WEGC) each using a different processing scheme.

Earth Syst. Sci. Data, 12, 1–15, 2020                                                    https://doi.org/10.5194/essd-12-1-2020

E. Lasota et al.: Tropical cyclones vertical structure from GNSS radio occultation                                             3

Regular inter-comparison studies of RO products from dif-          ancillary information from the weather model is required
ferent centres (Ho et al., 2009; Steiner et al., 2013) are per-    to retrieve the physical atmospheric parameters. The details
formed to improve the data and to understand differences.          of the OPS v5.6 tropospheric retrieval scheme is described
Latest results showed that RO data from different processing       by Li et al. (2019) introducing the moist air retrieval algo-
centres are highly consistent in the UTLS, and differences         rithm, inter-comparing it with the UCAR/COSMIC and EU-
become larger above 25 km altitude (Steiner et al., 2020). In      METSAT Radio Occultation Meteorology Satellite Applica-
this work, we use the WEGC RO dataset.                             tion Facility (ROM SAF) retrievals, and showing that in the
   The aim of this work is to provide a comprehensive archive      lower to middle troposphere the moisture information is pre-
covering the period 2001–2018 collecting all the available         dominantly coming from the RO data. These results are also
information about TCs together with co-located RO observa-         confirmed by Rieckh et al. (2018), who inter-compared tro-
tions to be used as a background for future studies to improve     pospheric humidity profiles from four retrievals (including
the knowledge of TC structure and development, to better           OPS v5.6) with radiosondes.
understand the pre-TC environment, and to study the effect            Furthermore, we made use of global monthly mean multi-
of TCs in the UTLS structure. For each TC, the information         satellite climatologies processed by the WEGC (based on
about track and intensity is combined with all the RO vertical     OPS v5.6 profiles in the period 2001–2017). The climato-
profiles available within 500 km and 3 h. The paper describes      logical profiles of bending angle, specific humidity and tem-
the datasets used to create the archive, explains the method-      perature are available with 2.5◦ × 2.5◦ horizontal resolution.
ology to co-locate the different datasets, shows the statistical
analysis of data spatial distribution, highlights an example of    2.2   TC tracks
possible use of the dataset, and finally remarks the uncertain-
ties and capabilities.                                             In this work, we focused on the TCs that occurred in the
                                                                   period 2001–2018 overlapping with the RO data availabil-
                                                                   ity. The comprehensive information of TC best track data
2     Data and methods
                                                                   was downloaded from the International Best Track Archive
2.1    RO profiles
                                                                   for Climate Stewardship (IBTrACS) version 04 (Knapp et
                                                                   al., 2010, 2018). The IBTrACS collects and combines the
We have used the GNSS RO products level 1b (L1b) and level         best track data from each World Meteorological Organiza-
2 (L2) processed by the Wegener Center for Climate and             tion (WMO) Regional Specialized Meteorological Center
Global Change (WEGC) through the Occultation Processing            (RSMC) and Tropical Cyclone Warning Center (TCWC), but
System (OPS) version 5.6, which use University Corporation         also from other meteorological agencies, who trace the TCs
for Atmospheric Research (UCAR) version orbit and phase            in the regions of the interest.
data (Schwärz et al., 2016; Angerer et al., 2017, see Table 1).       In this dataset, we store the wind speeds and central pres-
Out of this archive, we have selected the data of the CHAl-        sures obtained from the WMO responsibility agency for the
lenging Minisatellite Payload (CHAMP) from 2001 to 2008            particular ocean basin. The RSMC and the TCWC participate
(Wickert et al., 2001); the Satélite de Aplicaciones Cientıfi-     in the Tropical Cyclone Programme (World Meteorological
cas (SAC-C) form 2001 to 2013 (Hajj et al., 2004); the Grav-       Organization, 1980) and are officially required to forecast
ity Recovery and Climate Experiment A (GRACE-A) from               and report the information about TC position, movement and
2007 to 2017 and GRACE-B from 2014 to 2017 (Beyerle et             intensity in the designated area of responsibility (Table 1).
al., 2005); the Constellation Observing System for Meteorol-          The IBTrACS dataset is disseminated in different formats,
ogy, Ionosphere and Climate (COSMIC) from 2006 to 2018             CSV, netCDF or shapefile formats, for various subsets such
(Anthes et al., 2008); the Meteorological Operational satel-       as for separate ocean basins, time periods, or for all TCs in
lite (MetOp) from 2008 to 2018 (Luntama et al., 2008); and         the record. The archive is based on post-seasonal reanaly-
the Communication/Navigation Outage Forecasting System             ses and comprises information about storm name, position,
(C/NOFS) from 2010 to 2011 (de La Beaujardière, 2004).             maximum sustained wind speed or minimum central pres-
The WEGC RO OPS v5.6 product includes vertical profiles            sure, mostly reported with 6 h temporal resolution, as well
of various variables including specific humidity, temperature,     as some additional parameters interpolated to 3 h resolution.
refractivity and bending angle of the atmosphere with 100 m        The RSMC and TCWC compute and average the maximum
vertical sampling from near the surface altitude up to 60 km       sustained wind speed in different periods and hence cannot
height with global coverage.                                       be directly compared. The US agencies use a 1 min averag-
   In the regions where the water vapour is negligible (usu-       ing period, the Indian RSMC uses a 3 min averaging period,
ally above 10 km of altitude), the refractivity profiles can be    whilst the rest of RSMC and TCWC (Brisbane, La Réu-
transformed in dry temperature and dry pressure profiles by        nion, Nadi, Tokyo, Wellington) use a common 10 min av-
using a reduced refractivity equation (Scherlling-Pirscher et      eraging period. The IBTrACS does not perform any wind
al., 2011). In the lower troposphere, the abundant amount of       speed transformations and provides original data from each
water vapour makes the dry air assumption not valid, and           agency, leaving to the users the choice of method for inter-

https://doi.org/10.5194/essd-12-1-2020                                                  Earth Syst. Sci. Data, 12, 1–15, 2020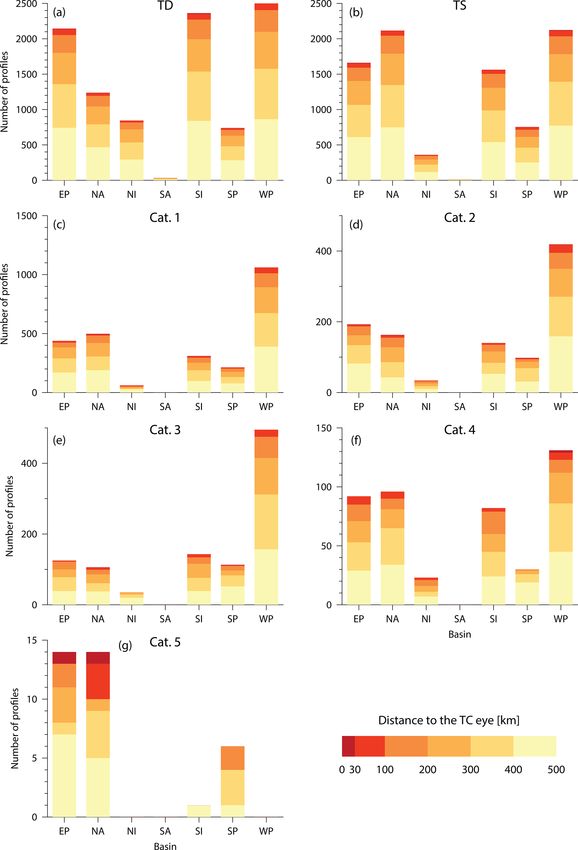
4                                             E. Lasota et al.: Tropical cyclones vertical structure from GNSS radio occultation

Table 1. The list of main agencies included in the IBTrACS dataset in the different ocean basins: North Atlantic (NA), eastern North Pacific
(EN), western North Pacific (WP), north Indian (NI), south Indian (SI), South Pacific (SP), South Atlantic (SA).

         Agency                                                                                      Abbreviation    Ocean basin
         National Hurricane Center (NHC) of National Oceanic and Atmospheric Administration          hurdat_atl      NA
         (NOAA, USA) as RSMC Miami                                                                   hurdat_epa      EN
         Japan Meteorological Agency as RSMC Tokyo                                                   tokyo           WP
         India Meteorological Department as RSMC New Delhi                                           newdelhi        NI
         Météo-France as RSMC La Réunion                                                             reunion         SI
         Australian Bureau of Meteorology as TCWC Perth, Darwin, Brisbane                            bom             SI, SP
         Meteorological Service of New Zealand, Ltd as TCWC Wellington                               wellington      SP
         Fiji Meteorological Service as RSMC Nadi                                                    nadi            SP
         Automated Tropical Cyclone Forecasting System for U.S. Department                           atcf            SA, NA, EP
         of Defense and National Weather Service TCWC

agency comparison. However, for the statistics and analyses
presented in this paper, we follow the guidelines given by
the WMO (Harper et al., 2010). Conversion factors between
the 10 and 3 min sustained wind speed into 1 min wind speed
are calculated using the equation E-2 from the World Me-
teorological Organization (WMO) “Guideline for converting
between various wind averaging periods in tropical cyclone
conditions” (Harper et al., 2010). Next, to unify reported
wind speeds to 1 min sustained wind speed, the original wind
speeds are multiplied by the calculated conversion factors of
1.08 and 1.05 for 10 and 3 min averaging periods, respec-
tively. The resulting values are used as a reference to catego-
rize the TC intensity according to the commonly used Saffir–
Simpson hurricane scale (Simpson, 1974), which identifies
seven levels based on the wind speed (Table 2).

2.3   Co-location of TC and RO observations

Retrieving RO profiles demands the appropriate knowledge                Figure 1. An example of co-location of TC with RO profiles (black
of geometry between the low Earth orbit (LEO) receiver and              stars) based on Hurricane Rick developed between 14 and 21 Octo-
                                                                        ber 2009. Dots present the TC eye position, whilst circles mark the
GNSS satellites, which results in the random distribution of
                                                                        500 km co-location criterion. Colours indicate the intensity of TC.
profiles in the time and space. Furthermore, the retrieved tan-
gent point trajectory is curved and diverges from the vertical
line since the GNSS and LEO satellites move with different              classified it to each TC track position, which meets the spa-
speeds on non-coplanar orbits (Foelsche et al., 2011). In this          tial and time condition.
work, we use the latitudes and longitudes of mean tangent                  As an example, we report in Fig. 1 the best track of Hur-
points provided in the WEGC RO products. We co-locate                   ricane Rick in 2009, which developed from 14 October 2009
each TC best track position with RO profiles which occurred             to 21 October 2009 in the eastern Pacific Ocean basin close
within 3 h and 500 km from the TC eye centre. The tempo-                to the Mexican shore. The dots represent the TC eye centre,
ral window has been chosen as half temporal resolution of               the circle indicates the 500 km radius that we have chosen as
the TC best track reports, while the space window is chosen             reference and the colours show the TC intensity (from TD in
as a commonly used average TC radius of influence (Bar-                 blue to Category 5 in red). The stars denote the position of
low, 2011; Knaff et al., 2013), which also corresponds to the           the co-located RO mean tangent point, and it becomes clear
half maximum path covered by a TC in 6 h. In fact, we have              how a RO profile can be associated with more than one TC
computed in our dataset maximum, minimum and average                    stage.
distances covered in 6 h by a TC as 969.2, 0 and 110.4 km,
respectively. Thus, a single RO profile could be co-located
with more than one TC best track position. In this case, we

Earth Syst. Sci. Data, 12, 1–15, 2020                                                         https://doi.org/10.5194/essd-12-1-2020
E. Lasota et al.: Tropical cyclones vertical structure from GNSS radio occultation 5
Table 2. TC intensity based on the Saffir–Simpson Hurricane Wind Scale.
Category Tropical depression Tropical storm Category 1 Category 2 Category 3 Category 4 Category 5
(TD) (TS) (Cat. 1) (Cat. 2) (Cat. 3) (Cat. 4) (Cat. 5)
1 min maximum sustained ≤ 17 18–32 33–42 43–49 50–58 58–70 > 70
wind speed (m s−1 )
2.4 Data structure of the archive occurring in the period 2001–2018 (1822 in total, Table 4).
In the early period 2001–2006, the number of co-locations
For each TC, at every single step reported by the IBTrACS,
is limited to a few hundred because only CHAMP and SAC-
we store the information about the co-locations between the
C were in orbit. CHAMP started measuring in May 2001,
TC and the RO, the vertical structure of the TC provided by
and thus the year with the lowest number of co-locations was
RO data, and the background environment (Table 3). The TC
2001 (only 50). In 2006, the COSMIC six-satellite constella-
is described by the basin of development; the name of the
tion was launched, and the number of co-locations increased
responsible recording WMO agency; the distance of the TC
to some thousands per year. The year with the largest num-
from land; the date, time and coordinates at each 6 h best
ber of co-locations was 2008, with 5482 coming from 99
track stage; the nature of the storm; the storm translation
TC tracks. The highest number of co-located profiles comes
speed; the minimum central pressure; and the maximum sus-
from the MetOp-A receiver (Table 5) due to the largest time
tained wind speed provided by the responsible WMO agency
range availability (11 years). The ocean basin with the high-
and stored in wmo_pres and wmo_wind variables, respec-
est number of co-locations (Table 6) is the western Pacific,
tively. The co-locations between TCs and ROs are detailed
due to the larger number of TCs which are lasting for a longer
with date, time and coordinates of the RO; the temporal dif-
period than the other ocean basins.
ference between the co-located RO profile and the TC best
The co-locations are well distributed in all the ocean
track time; and the spatial distance between the RO mean
basins (Fig. 2), with a small number very close to the TC eye
tangent point and the TC best track coordinates. The TC ver-
centre (172 in total), 1793 co-locations very close to or into
tical structure is given by the vertical profile from the surface
the eyewall, and an increasing number moving away from
(0 km) to 60 km with 10 m sampling for specific humidity,
the centre (Table 6). Since the TCs have different intensity
pressure, temperature, refractivity and bending angle. As a
and different characteristics according to the area where they
reference, we also report the climatological profiles of spe-
develop (Biondi et al., 2015), we also report the statistics by
cific humidity, temperature and bending angle in the same
ocean basin and by categories (Table 6 and Fig. 3). The west-
area in order to compute the vertical anomaly structure with
ern Pacific Ocean basin has the largest number (14 310) of
respect to the climatology.
co-locations, covering all the categories except Cat. 5 well. In
The NetCDF format has been developed to share the array-
the eastern Pacific Ocean and North Atlantic Ocean basins,
oriented scientific data; therefore, the structure of the TC-RO
we found the largest number of co-locations for the highest
archive is arranged to fulfil the array structure requirement.
intensity Cat. 5 (14).
All the data are stored in the up to 3D arrays with particular
Demonstrating the use of the provided archive for an ex-
dimensions: NTC , NmaxRO and Nalt . NTC refers to the total
ample case study, we report in Fig. 4 the case of Typhoon
number of the TC best track positions, separately for each
Hondo in 2008, which developed in the south Indian Ocean
analysed TC, whilst NmaxRO corresponds to the maximum
and reached the maximum intensity of Cat. 4. Hondo started
number of co-located RO profiles with a single TC track po-
as a tropical depression on 2 February 2008. Two days later
sition. Since not every TC track position has as many RO
it intensified to a TS and quickly reached TC intensity (red-
co-locations as the value of NmaxRO , the variables such as
dish dots Fig. 4a) on 5 February 2008. The status of a TC
latRO, lonRO, bending angle and others may contain empty
persisted for 5 d, and then it weakened to a TD until the end
values, which are filled with appropriate filling values. The
of its life on 29 February 2008. Hondo is the TC for which
dimension, Nalt , is the number of available RO vertical levels
we found the highest number of RO co-locations (Fig. 4a,
(refractivity, pressure, temperature or specific humidity) and
black stars), with a total of 212 profiles, just 2 into the TC
by default is equal to 600.
eye, 10 close to the eyewall, and 200 distributed between
All the details of data structure are reported in the Supple-
100 and 500 km from the TC centre. Thirty-eight profiles
ment.
are co-located with the TC status, 15 with TS and 159 with
TD. The maximum number of profiles for a single stage was
3 Results four, co-located with the TD on 12 February 2008. Figure 4b
shows the temperature profile evolution with the time and al-
We have collected 48 313 co-locations between ROs and TCs titude. The black profiles mostly indicate the TC stages and
from 1570 TCs, with at least one profile for 86 % of the TCs
https://doi.org/10.5194/essd-12-1-2020 Earth Syst. Sci. Data, 12, 1–15, 20206 E. Lasota et al.: Tropical cyclones vertical structure from GNSS radio occultation
Table 3. Parameters stored in the dataset files for each TC separately. NTC denotes the number of TC track positions, Nalt denotes the number
of altitude levels (600 by default) and NmaxRO stands for the maximum number of RO profiles found for a single TC best track position.
Parameter (unit) Dimension Description
altitude (m) Nalt × 1 Altitudes above geoid between 0 and 59.9 km with 100 m spacing.
latTC (◦ N) NTC × 1 Latitude of current TC track position.
lonTC (◦ E) NTC × 1 Longitude of current TC track position.
basin NTC × 1 Flag values (1–7) indicating the ocean basin for the current storm posi-
tion: 1 = east Pacific, 2 = North Atlantic, 3 = north Indian, 4 = South Atlantic,
5 = south Indian, 6 = South Pacific, 7 = western Pacific.
dist2land (km) NTC × 1 Distance between current TC position and land.
landfall (km) NTC × 1 Minimum distance of TC to land over next 3 h (0 means landfall).
nature NTC × 1 Flag values (1–6) indicating the nature of the current TC stage: 1 = not reported,
2 = disturbance, 3 = tropical system, 4 = extratropical system, 5 = subtropical
system, 6 = mixed (occurs when agencies reported inconsistent types not re-
ported).
storm_dir (◦ ) NTC × 1 Storm translation direction.
storm_speed (m s−1 ) NTC × 1 Storm translation speed.
subbasin NTC × 1 Flag values (1–9) indicating ocean sub-basin for the current storm position:
1 = Arabian Sea., 2 = Bay of Bengal, 3 = central Pacific, 4 = Caribbean Sea,
5 = Gulf of Mexico, 6 = North Atlantic, 7 = eastern Australia, 8 = western Aus-
tralia, 9 = no sub-basin for this position.
wmo_agency NTC × 1 Flag values (1–10) indicating name of the responsible WMO agency:
1 = not provided, 2 = atcf, 3 = bom, 4 = hurdat_atl, 5 = hurdat_epa, 6 = nadi,
7 = newdelhi, 8 = reunion, 9 = Tokyo, 10 = wellington.
wmo_pres (Pa) NTC × 1 Minimum central pressure from the responsible WMO agency.
wmo_wind (m s−1 ) NTC × 1 Maximum sustained wind speed from the responsible WMO agency.
RO_datetime (seconds since NTC × NmaxRO Date and time of RO profile.
1 January 1970 00:00:0.0)
RO_ID NTC × 64 × NmaxRO ID of collocated RO profile.
latRO (◦ N) NTC × NmaxRO Latitude of mean RO tangent point.
lonRO (◦ E) NTC × NmaxRO Longitude of mean RO tangent point.
QC NTC × NmaxRO RO overall retrieval quality control (0 and 1 stand for good and bad profiles).
datediff_RO_TC (s) NTC × NmaxRO Time difference between collocated RO profile and TC track position.
dist_RO_TC (km) NTC × NmaxRO Distance between positions of TC track and mean RO tangent point.
bending_angle (rad) Nalt × NTC × NmaxRO Ionosphere-corrected RO bending angle profile.
bending_angle_climatology Nalt × NTC × NmaxRO Corresponding monthly climatological RO bending angle profile, interpolated
(rad) from grid with 2.5◦ × 2.5◦ spatial resolution.
pressure (Pa) Nalt × NTC × NmaxRO RO air pressure profile.
refractivity (N units) Nalt × NTC × NmaxRO RO refractivity profile.
specific_humidity (kg kg−1 ) Nalt × NTC × NmaxRO RO specific humidity profile.
specific_humidity_climatology Nalt × NTC × NmaxRO Corresponding monthly climatological RO specific humidity profile, interpo-
(kg kg−1 ) lated from grid with 2.5◦ × 2.5◦ spatial resolution.
temperature (K) Nalt × NTC × NmaxRO RO air temperature profile.
temperature_climatology (K) Nalt × NTC × NmaxRO Corresponding monthly climatological RO air temperature profile, interpolated
from grid with 2.5◦ × 2.5◦ spatial resolution.
Earth Syst. Sci. Data, 12, 1–15, 2020 https://doi.org/10.5194/essd-12-1-2020E. Lasota et al.: Tropical cyclones vertical structure from GNSS radio occultation 7
Figure 2. Map with distribution of RO profiles collocated with (a) tropical depressions, (b) tropical storms, (c) Category 1 TCs, (d) Category
2 TCs, (e) Category 3 TCs, (f) Category 4 TCs and (g) Category 5 TCs. Colours denote the distances between the RO profile and the nearest
TC eye.
the yellow profiles indicate the TD final stages. Figure 4c area from the individual profile. The anomaly profiles rep-
represents the temporal and vertical behaviour for specific resent signatures created by the presence of the storm. Fig-
humidity. The RO data clearly reveal the temporal develop- ure 5a shows the averaged bending angle anomalies for the
ment of the storm’s vertical structure. For the case of Hondo, TD, TS and TC status of Hondo. In the lower troposphere, a
we find that during the TC stages the mid-tropospheric ther- large negative anomaly in bending angle (relative to the cli-
mal structure is warmer (warm TC inner core) and the up- matology) is present due to the increase in humidity (Fig. 5c),
Please note the remarks at the end of the manuscript.
per troposphere is colder. Figure 5 shows how to use the while in the mid-troposphere the negative bending anomaly
full dataset, including information of the TC best tracks, is due to the storm’s warm core (Fig. 5b). In the upper tropo-
the anomaly profiles and climatology profiles from RO for sphere, a positive anomaly in bending angle is caused by the
analysing the vertical thermal structure and understanding cold cloud top. The TD moves less humidity than TS and TC
the behaviour of the storm. First, we use the TC best tracks (Fig. 5c). The warm core and cold cloud top are more distinct
to distinguish between the different storm stages (TD, TS for TS and TC than for TD (Fig. 5b).
and TC in Fig. 5). Then, we evaluate the anomaly profiles
of the different RO variables bending angle, temperature and
specific humidity, which have been computed by subtracting
the reference monthly climatology profile in the respective
https://doi.org/10.5194/essd-12-1-2020 Earth Syst. Sci. Data, 12, 1–15, 20208 E. Lasota et al.: Tropical cyclones vertical structure from GNSS radio occultation Figure 3. Histograms of collocated RO profiles with (a) tropical depressions, (b) tropical storms, (c) Category 1 TCs, (d) Category 2 TCs, (e) Category 3 TCs, (f) Category 4 TCs and (g) Category 5 TCs for different ocean basins. Colours denote the distances between the RO profile and the TC eye. Earth Syst. Sci. Data, 12, 1–15, 2020 https://doi.org/10.5194/essd-12-1-2020
E. Lasota et al.: Tropical cyclones vertical structure from GNSS radio occultation                                                  9

Figure 4. Temporal evolution of the Typhoon Hondo in 2008. Hondo best track and co-located ROs (a). Temperature (b) and specific
humidity (c) profiles from the surface to 25 km of altitude since the beginning to the end of the storm.

Figure 5. Averaged bending angle anomaly (a), temperature anomaly (b) and specific humidity anomaly (c) profiles for the TD, TS and TC
status of Hondo 2008.

4   Data availability                                                file transfer protocol (ftp) or secure file transfer protocol
                                                                     (sftp) according to the instructions and links also provided
                                                                     via the cited EOPAC Team (2019) DOI link CE1 . Detailed
All the data used to create this archive are publicly                information on the retrieval and on data quality is given
available. The WEGC GNSS RO record OPS v5.6 with                     by Angerer et al. (2017). The RO reference climatology
high-quality atmospheric profiles is available online                was computed from OPS v5.6 profiles, which were av-
(https://doi.org/10.25364/WEGC/OPS5.6:2019.1, EOPAC                  eraged to a 2.5◦ × 2.5◦ latitude and longitude grid (each
Team, 2019) and archived at the Earth Observation Data               grid point containing profiles within a 300 km radius).
Centre (EODC) in Vienna, where it can be downloaded via

https://doi.org/10.5194/essd-12-1-2020                                                      Earth Syst. Sci. Data, 12, 1–15, 2020
10 E. Lasota et al.: Tropical cyclones vertical structure from GNSS radio occultation
Table 4. Number of collocated RO profiles with TCs with regard to et al., 2020). It can be downloaded via file transfer protocol
the acquisition year. (ftp) or secure file transfer protocol (sftp), and the instruc-
tions for data download with different operating systems are
Year Number of Number of Number of also provided via the Lasota et al. (2020) DOI link cited at the
profiles TCs TCs with at beginning of this paragraph. The dataset consists of yearly
least 1 folders, which refer to the year of the start of the storm. Each
co-located TC is saved in a separate file in NetCDF-4 format in the cor-
RO profile
responding yearly directory. Filenames are self-explanatory
2001 50 107 23 with the format string NAME_year_IBTrACSuniqueID.nc.
2002 222 100 56 For example, file MERANTI_2016_2016253N13144.nc in-
2003 310 107 74 cludes all atmospheric RO profiles co-located with the TC
2004 335 105 73 Meranti of IBTrACS ID 2016253N13144, which occurred
2005 310 115 71 in 2016. The description of the variables included in each
2006 1969 100 98
dataset file can be found in Table 3 and the Supplement.
2007 4187 94 94
2008 5482 99 99
2009 5119 100 99
2010 3640 88 88 5 Discussion and conclusions
2011 3739 95 95
2012 3585 93 93 In this work, we provide a comprehensive archive of TCs’
2013 4471 103 103 vertical structure for the period 2001–2018. Three main
2014 3932 91 91 products are provided, co-located in time and space: global
2015 4339 112 111 TC best tracks, RO profiles and RO climatological profiles.
2016 2909 95 95 The archive can be used for different purposes for analysing
2017 2017 107 101 the vertical thermodynamic structure of cyclones and the pre-
2018 1697 111 106
cyclone environment.
Total 48 313 1822 1570
The distance between the GNSS RO and TC best track is
computed using as reference the RO mean tangent point co-
Table 5. Number of collocated RO profiles with TC for different ordinates, which usually corresponds to an altitude of about
RO satellites. 12.5 km above the mean sea level, with a vertical resolution
of about 100 m (Zeng et al., 2019) and a horizontal resolu-
Satellite Number of tion of about 60 to 300 km (Gorbunov et al., 2004; Kursinski
profiles et al., 1997). The uncertainty given by the RO location must
be summed to the TC best track position uncertainty, which
CHAMP 1881
CNOFS 519 mainly depends on the intensity of the storm and on the num-
F3C-FM1 6644 ber and type of instruments used for monitoring (Landsea
F3C-FM2 3954 and Franklin, 2013). The TC best tracks are post-storm anal-
F3C-FM3 1693 yses relying on many different observations (ground-based,
F3C-FM4 4969 aircraft, satellite, radiosondes). The more intense the storm
F3C-FM5 5499 the more accurate the determination of the position is. The
F3C-FM6 4918 more observations are available the lower the uncertainty is.
GRACE-A 1836 As an example, Landsea and Franklin (2013) report a posi-
GRACE-B 562 tion uncertainty of about 55 km (30 miles) for storms in the
MetOp-A 9416
Atlantic Ocean observed just by satellite and a position un-
MetOp-B 4704
certainty of about 15 km (8 miles) for major hurricanes ob-
SAC-C 1718
served by satellite, aircraft and ground-based instruments. In
the worst case, the total co-location error between GNSS RO
and TC best track could be up to 200 km in remote areas of
The monthly mean climatology was computed for the the globe where just the satellite measurements are available
period for August 2006 to September 2017. The TC best and where storm intensities are low.
tracks were obtained from the NOAA IBTrACS web page Part of this archive has already been used for studying the
(https://www.ncdc.noaa.gov/ibtracs/, last access: 31 August TC cloud top altitude (Biondi et al., 2013), to provide a char-
2020; Knapp et al., 2018) in CSV, netCDF or shapefile acterization of the TC thermal structure and to detect TC
format for all available storms. overshooting for different ocean basins (Biondi et al., 2015).
The created RO–TC dataset is available online at This demonstrates that, despite the uncertainties reported
https://doi.org/10.25364/WEGC/TC-RO1.0:2020.1 (Lasota above, this archive is well suited for deepening our knowl-
Earth Syst. Sci. Data, 12, 1–15, 2020 https://doi.org/10.5194/essd-12-1-2020E. Lasota et al.: Tropical cyclones vertical structure from GNSS radio occultation 11
Table 6. Number of collocated RO profiles with TCs with regard to the TC intensity and the distance to the TC eye on different ocean basins.
Basin Distance (km) Intensity
Total TD TS Cat. 1 Cat. 2 Cat. 3 Cat. 4 Cat. 5 Not available
NA 0–30 31 2 3 5 1 1 0 1 18
31–100 280 43 69 10 7 6 6 3 136
101–200 1021 149 254 63 27 13 9 0 506
201–300 1698 253 443 114 42 25 16 1 804
301–400 2243 324 597 116 43 23 31 4 1105
401–500 2926 467 750 190 43 38 34 5 1399
Total 8199 1238 2116 498 163 106 96 14 3968
EP 0–30 31 6 7 0 1 0 0 1 16
31–100 346 85 62 15 5 3 7 0 169
101–200 1109 252 188 40 25 22 14 2 566
201–300 1920 442 338 93 28 22 18 3 976
301–400 2666 616 455 120 52 39 24 1 1359
401–500 3407 743 611 170 82 39 29 7 1726
Total 9479 2144 1661 438 193 125 92 14 4812
WP 0–30 52 8 10 1 1 0 2 0 30
31–100 567 98 79 48 23 20 6 0 293
101–200 1722 307 252 119 45 60 11 0 928
201–300 2787 521 390 219 79 103 26 0 1449
301–400 4043 714 620 284 112 155 41 0 2117
401–500 5139 863 773 390 159 157 45 0 2752
Total 14310 2511 2124 1061 419 495 131 0 7569
NI 0–30 7 1 1 0 0 0 0 0 5
31–100 88 27 15 8 2 0 2 0 34
101–200 282 98 51 9 6 1 5 0 112
201–300 486 184 72 10 8 5 5 0 202
301–400 590 241 103 7 8 9 4 0 218
401–500 823 294 118 27 10 20 7 0 347
Total 2276 845 360 61 34 35 23 0 918
SA 0–30 0 0 0 0 0 0 0 0 0
31–100 1 0 0 0 0 0 0 0 1
101–200 16 7 1 0 0 0 0 0 8
201–300 17 6 4 0 0 0 0 0 7
301–400 27 9 3 0 0 0 0 0 15
401–500 27 11 3 0 0 0 0 0 13
Total 88 33 11 0 0 0 0 0 44
SP 0–30 13 2 2 1 1 1 0 0 6
31–100 175 26 38 9 3 2 0 0 97
101–200 538 81 101 27 7 13 1 2 306
201–300 860 150 152 44 18 14 3 0 479
301–400 1212 198 209 54 38 31 7 3 672
401–500 1634 283 252 78 31 52 19 1 918
Total 4432 740 754 213 98 113 30 6 2478
SI 0-30 38 12 5 2 0 0 0 0 19
31–100 336 79 53 13 5 9 3 0 174
101–200 1171 277 196 42 19 18 19 0 600
201–300 1929 458 321 64 32 40 15 0 999
301–400 2759 697 447 91 31 37 21 0 1435
401–500 3296 840 541 98 53 39 24 1 1700
Total 9529 2363 1563 310 140 143 82 1 4927
Total 0–30 172 31 28 9 4 2 2 2 94
31–100 1793 358 316 103 45 40 24 3 904
101–200 5859 1171 1043 300 129 127 59 4 3026
201–300 9697 2014 1720 544 207 209 83 4 4916
301–400 13 540 2799 2434 672 284 294 128 8 6921
401–500 17 252 3501 3048 953 378 345 158 14 8855
Total 48313 9874 8589 2581 1047 1017 454 35 24 716
https://doi.org/10.5194/essd-12-1-2020 Earth Syst. Sci. Data, 12, 1–15, 202012 E. Lasota et al.: Tropical cyclones vertical structure from GNSS radio occultation
edge of TCs. This is the first comprehensive archive collect- References
ing information of TC vertical structure, including profiles
with a high vertical resolution from the surface to the TC
cloud top and above, and providing high accuracy for all the
Angerer, B., Ladstädter, F., Scherllin-Pirscher, B., Schwärz, M.,
main atmospheric parameters determining the development
Steiner, A. K., Foelsche, U., and Kirchengast, G.: Quality as-
and the dynamics of the TCs. pects of the Wegener Center multi-satellite GPS radio occul-
This dataset allows gaining a better understanding of the tation record OPSv5.6, Atmos. Meas. Tech., 10, 4845–4863,
TC inner structure especially in remote areas where ground- https://doi.org/10.5194/amt-10-4845-2017, 2017.
based sensors or radiosondes are not available and which are Anisetty, S. K. A. V. P. R., Huang, C.-Y., and Chen, S.-Y.: Impact
difficult to reach by aircraft. The independency of the ROs of FORMOSAT-3/COSMIC radio occultation data on the pre-
from the weather conditions provides a unique opportunity diction of super cyclone Gonu (2007): a case study, Nat. Haz-
to profile extreme weather events without any risk and with ards, 70, 1209–1230, https://doi.org/10.1007/s11069-013-0870-
global coverage. 0, 2014.
The GNSS RO technique is well established, and the Anthes, R. A.: Exploring Earth’s atmosphere with radio occulta-
RO acquisitions are increasing thanks to the successfully tion: contributions to weather, climate and space weather, Atmos.
Meas. Tech., 4, 1077–1103, https://doi.org/10.5194/amt-4-1077-
launched COSMIC 2 mission, which will contribute to a
2011, 2011.
better understanding of TCs, provide the necessary informa- Anthes, R. A., Kuo, Y.-H., Rocken, C., and Schreiner, W.: Atmo-
tion to forecast the TC tracks with high accuracy and enable spheric sounding using GPS radio occultation, MAUSAM, 54,
studying the diurnal changes of temperature during the ex- 25–38, 2003.
treme events. We believe that this archive is useful to get a Anthes, R. A., Bernhardt, P. A., Chen, Y., Cucurull, L., Dymond,
better understanding of the TC development and intensifica- K. F., Ector, D., Healy, S. B., Ho, S.-P., Hunt, D. C., Kuo,
tion, as well as to increase our knowledge of the impact of Y.-H., Liu, H., Manning, K., McCormick, C., Meehan, T. K.,
TCs on the atmospheric structure. Randel, W. J., Rocken, C., Schreiner, W. S., Sokolovskiy, S.
V., Syndergaard, S., Thompson, D. C., Trenberth, K. E., Wee,
T.-K., Yen, N. L., and Zeng, Z.: The COSMIC/FORMOSAT-3
Supplement. The supplement related to this article is available Mission: Early Results, B. Am. Meteorol. Soc., 89, 313–334,
online at: https://doi.org/10.5194/essd-12-1-2020-supplement. https://doi.org/10.1175/BAMS-89-3-313, 2008.
Barlow, M.: Influence of hurricane-related activity on North Amer-
ican extreme precipitation, Geophys. Res. Lett., 38, L04705,
https://doi.org/10.1029/2010GL046258, 2011.
Author contributions. EL downloaded the data, developed the
Beyerle, G., Schmidt, T., Michalak, G., Heise, S., Wickert, J., and
software and analysed the dataset. EL and RB designed the work
Reigber, C.: GPS radio occultation with GRACE: Atmospheric
and wrote the manuscript. RB supervised the project and acquired
profiling utilizing the zero difference technique, Geophys. Res.
the funding. GK and AKS provided the RO data, supported the
Lett., 32, L13806, https://doi.org/10.1029/2005GL023109, 2005.
data archiving, contributed to the manuscript text and reviewed the
Biondi, R., Neubert, T., Syndergaard, S., and Nielsen, J.:
manuscript.
Measurements of the upper troposphere and lower strato-
sphere during tropical cyclones using the GPS radio
occultation technique, Adv. Space Res., 47, 348–355,
Competing interests. The authors declare that they have no con- https://doi.org/10.1016/j.asr.2010.05.031, 2011a.
flict of interest. Biondi, R., Neubert, T., Syndergaard, S., and Nielsen, J. K.: Radio
occultation bending angle anomalies during tropical cyclones,
Atmos. Meas. Tech., 4, 1053–1060, https://doi.org/10.5194/amt-
Acknowledgements. The work is accomplished in the frame of 4-1053-2011, 2011b.
the VESUVIO project funded by the Supporting Talent in ReSearch Biondi, R., Ho, S.-P., Randel, W., Syndergaard, S., and Neu-
(STARS) grant at Università degli Studi di Padova, IT. We thank bert, T.: Tropical cyclone cloud-top height and vertical tem-
Florian Ladstädter (WEGC) for providing the RO reference clima- perature structure detection using GPS radio occultation
tologies. We thank Armin Leuprecht (WEGC) for his support and measurements, J. Geophys. Res.-Atmos., 118, 5247–5259,
guidance on all technical aspects of the archive files. https://doi.org/10.1002/jgrd.50448, 2013.
Biondi, R., Steiner, A. K., Kirchengast, G., and Rieckh, T.:
Characterization of thermal structure and conditions for over-
Financial support. This research has been supported by the Uni- shooting of tropical and extratropical cyclones with GPS
versità degli Studi di Padova (VESUVIO). radio occultation, Atmos. Chem. Phys., 15, 5181–5193,
https://doi.org/10.5194/acp-15-5181-2015, 2015.
Bonafoni, S., Biondi, R., Brenot, H., and Anthes, R.: Radio occul-
Review statement. This paper was edited by David Carlson and tation and ground-based GNSS products for observing, under-
reviewed by two anonymous referees. standing and predicting extreme events: A review, Atmos. Res.,
230, 104624, https://doi.org/10.1016/j.atmosres.2019.104624,
2019.
Earth Syst. Sci. Data, 12, 1–15, 2020 https://doi.org/10.5194/essd-12-1-2020E. Lasota et al.: Tropical cyclones vertical structure from GNSS radio occultation 13 Brueske, K. F. and Velden, C. S.: Satellite-Based Tropical Harper, B. A., Kepert, J. D., and Ginger, J. D.: Guidelines for Cyclone Intensity Estimation Using the NOAA-KLM Se- converting between various wind averaging periods in trop- ries Advanced Microwave Sounding Unit (AMSU), Mon. ical cyclone conditions, World Meteorological Organization, Weather Rev., 131, 687–697, https://doi.org/10.1175/1520- Geneva, Switzerland, available at: https://www.wmo.int/pages/ 0493(2003)1312.0.CO;2, 2003. prog/www/tcp/documents/WMO_TD_1555_en.pdf (last access: Cardinali, C.: Monitoring the observation impact on the short- 25 February 2020), 2010. range forecast, Q. J. Roy. Meteor. Soc., 135, 239–250, Hima Bindu, H., Venkat Ratnam, M., Yesubabu, V., Narayana Rao, https://doi.org/10.1002/qj.366, 2009. T., Kesarkar, A., and Naidu, C. V.: Characteristics of cyclone Chane Ming, F., Ibrahim, C., Barthe, C., Jolivet, S., Keckhut, P., generated gravity waves observed using assimilated WRF model Liou, Y.-A., and Kuleshov, Y.: Observation and a numerical study simulations over Bay of Bengal, Atmos. Res., 180, 178–188, of gravity waves during tropical cyclone Ivan (2008), Atmos. https://doi.org/10.1016/j.atmosres.2016.05.021, 2016. Chem. Phys., 14, 641–658, https://doi.org/10.5194/acp-14-641- Ho, S.-P., Kirchengast, G., Leroy, S., Wickert, J., Mannucci, T., 2014, 2014. Steiner, A. K., Hunt, D., Schreiner, W., Sokolovskiy, S. V., Ao, Chen, S.-Y., Wee, T.-K., Kuo, Y.-H., and Bromwich, D. H.: An Im- C. O., Borsche, M., von Engeln, A., Foelsche, U., Heise, S., pact Assessment of GPS Radio Occultation Data on Prediction of Iijima, B., Kuo, Y.-H., Kursinski, E. R., Pirscher, B., Ringer, a Rapidly Developing Cyclone over the Southern Ocean, Mon. M., Rocken, C., and Schmidt, T.: Estimating the uncertainty of Weather Rev., 142, 4187–4206, https://doi.org/10.1175/MWR- using GPS radio occultation data for climate monitoring: Inter- D-14-00024.1, 2014. comparison of CHAMP refractivity climate records from 2002 to Chen, S.-Y., Kuo, Y.-H., and Huang, C.-Y.: The Impact of GPS 2006 from different data centers, J. Geophys. Res.-Atmos., 114, RO Data on the Prediction of Tropical Cyclogenesis Using a D23107, https://doi.org/10.1029/2009JD011969, 2009. Nonlocal Observation Operator: An Initial Assessment, Mon. Hsiao, L.-F., Chen, D.-S., Kuo, Y.-H., Guo, Y.-R., Yeh, T.-C., Hong, Weather Rev., 148, 2701–2717, https://doi.org/10.1175/MWR- J.-S., Fong, C.-T., and Lee, C.-S.: Application of WRF 3DVAR D-19-0286.1, 2020. to Operational Typhoon Prediction in Taiwan: Impact of Outer Chen, Y.-C., Hsieh, M.-E., Hsiao, L.-F., Kuo, Y.-H., Yang, M.- Loop and Partial Cycling Approaches, Weather Forecast., 27, J., Huang, C.-Y., and Lee, C.-S.: Systematic evaluation of the 1249–1263, https://doi.org/10.1175/WAF-D-11-00131.1, 2012. impacts of GPSRO data on the prediction of typhoons over Huang, C.-Y., Kuo, Y.-H., Chen, S.-H., and Vandenberghe, the northwestern Pacific in 2008–2010, Atmos. Meas. Tech., 8, F.: Improvements in Typhoon Forecasts with Assimilated 2531–2542, https://doi.org/10.5194/amt-8-2531-2015, 2015. GPS Occultation Refractivity, Weather Forecast., 20, 931–953, Cirac-Claveras, G.: Weather Satellites: Public, Private and Data https://doi.org/10.1175/WAF874.1, 2005. Sharing. The Case of Radio Occultation Data, Space Policy, 47, Huang, C.-Y., Kuo, Y.-H., Chen, S.-Y., Terng, C.-T., Chien, F.-C., 94–106, https://doi.org/10.1016/j.spacepol.2018.08.002, 2019. Lin, P.-L., Kueh, M.-T., Chen, S.-H., Yang, M.-J., Wang, C.-J., de La Beaujardière, O.: C/NOFS: a mission to forecast and Prasad Rao, A. S. K. A. V.: Impact of GPS radio occultation scintillations, J. Atmos. Sol.-Terr. Phy., 66, 1573–1591, data assimilation on regional weather predictions, GPS Solut, 14, https://doi.org/10.1016/j.jastp.2004.07.030, 2004. 35–49, https://doi.org/10.1007/s10291-009-0144-1, 2010. Demuth, J. L., DeMaria, M., Knaff, J. A., and Vonder Haar, Kidder, S. Q., Gray, W. M., and Vonder Haar, T. H.: Es- T. H.: Evaluation of Advanced Microwave Sounding Unit timating Tropical Cyclone Central Pressure and Outer Tropical-Cyclone Intensity and Size Estimation Algorithms, Winds from Satellite Microwave Data, Mon. Weather J. Appl. Meteorol., 43, 282–296, https://doi.org/10.1175/1520- Rev., 106, 1458–1464, https://doi.org/10.1175/1520- 0450(2004)0432.0.CO;2, 2004. 0493(1978)1062.0.CO;2, 1978. Dvorak, V. F.: Tropical Cyclone Intensity Analysis and Fore- King, M. D., Kaufman, Y. J., Menzel, W. P., and Tanre, D.: Re- casting from Satellite Imagery, Mon. Weather Rev., 103, 420– mote sensing of cloud, aerosol, and water vapor properties from 430, https://doi.org/10.1175/1520-0493(1975)103< 0420:TCI- the moderate resolution imaging spectrometer (MODIS), IEEE AAF>2.0.CO;2, 1975. T. Geosci. Remote, 30, 2–27, 1992. EOPAC Team: GNSS Radio Occultation Record Knaff, J. A., Longmore, S. P., and Molenar, D. A.: An Objective (OPS 5.6 2001–2018), University of Graz, Austria, Satellite-Based Tropical Cyclone Size Climatology, J. Climate, https://doi.org/10.25364/WEGC/OPS5.6:2019.1, 2019. 27, 455–476, https://doi.org/10.1175/JCLI-D-13-00096.1, 2013. Foelsche, U., Syndergaard, S., Fritzer, J., and Kirchengast, G.: Er- Knapp, K. R., Kruk, M. C., Levinson, D. H., Diamond, H. J., and rors in GNSS radio occultation data: relevance of the measure- Neumann, C. J.: The International Best Track Archive for Cli- ment geometry and obliquity of profiles, Atmos. Meas. Tech., 4, mate Stewardship (IBTrACS), B. Am. Meteorol. Soc., 91, 363– 189–199, https://doi.org/10.5194/amt-4-189-2011, 2011. 376, https://doi.org/10.1175/2009BAMS2755.1, 2010. Gorbunov, M. E., Benzon, H.-H., Jensen, A. S., Lohmann, M. S., Knapp, K. R., Diamond, H. J., Kossin, J. P., Kruk, M. C., and Nielsen, A. S.: Comparative analysis of radio occultation and Schreck, C. J. I.: International Best Track Archive processing approaches based on Fourier integral operators, Radio for Climate Stewardship (IBTrACS) Project, Version 4, Sci., 39, 1–11, https://doi.org/10.1029/2003RS002916, 2004. https://doi.org/10.25921/82ty-9e16, 2018. Hajj, G. A., Ao, C. O., Iijima, B. A., Kuang, D., Kursinski, E. R., Knibbe, W. J. J., de Haan, J. F., Hovenier, J. W., Stam, D. M., Koele- Mannucci, A. J., Meehan, T. K., Romans, L. J., de la Torre Juarez, meijer, R. B. A., and Stammes, P.: Deriving terrestrial cloud M., and Yunck, T. P.: CHAMP and SAC-C atmospheric occulta- top pressure from photopolarimetry of reflected light, J. Quant. tion results and intercomparisons, J. Geophys. Res.-Atmos., 109, Spectrosc. Ra., 64, 173–199, https://doi.org/10.1016/S0022- D06109, https://doi.org/10.1029/2003JD003909, 2004. 4073(98)00135-6, 2000. https://doi.org/10.5194/essd-12-1-2020 Earth Syst. Sci. Data, 12, 1–15, 2020
14                                          E. Lasota et al.: Tropical cyclones vertical structure from GNSS radio occultation

Koelemeijer, R. B. A., Stammes, P., Hovenier, J. W., and Haan, J.         MIC GPS RO data, Atmos. Chem. Phys., 15, 10239–10249,
   F. de: Global distributions of effective cloud fraction and cloud      https://doi.org/10.5194/acp-15-10239-2015, 2015.
   top pressure derived from oxygen A band spectra measured by         Rieckh, T., Anthes, R., Randel, W., Ho, S.-P., and Foelsche, U.:
   the Global Ozone Monitoring Experiment: Comparison to IS-              Evaluating tropospheric humidity from GPS radio occultation,
   CCP data, J. Geophys. Res.-Atmos., 107, AAC 5-1–AAC 5-9,               radiosonde, and AIRS from high-resolution time series, At-
   https://doi.org/10.1029/2001JD000840, 2002.                            mos. Meas. Tech., 11, 3091–3109, https://doi.org/10.5194/amt-
Kunii, M., Seko, H., Ueno, M., Shoji, Y., and Tsuda, T.: Impact           11-3091-2018, 2018.
   of Assimilation of GPS Radio Occultation Refractivity on the        Rivoire, L., Birner, T., and Knaff, J. A.: Evolution of the upper-level
   Forecast of Typhoon Usagi in 2007, J. Meteorol. Soc. Jpn., 90,         thermal structure in tropical cyclones, Geophys. Res. Lett., 43,
   255–273, https://doi.org/10.2151/jmsj.2012-207, 2012.                  10530–10537, https://doi.org/10.1002/2016GL070622, 2016.
Kursinski, E. R., Hajj, G. A., Schofield, J. T., Linfield, R.          Scherllin-Pirscher, B., Kirchengast, G., Steiner, A. K., Kuo,
   P., and Hardy, K. R.: Observing Earth’s atmosphere with                Y.-H., and Foelsche, U.: Quantifying uncertainty in clima-
   radio occultation measurements using the Global Position-              tological fields from GPS radio occultation: an empirical-
   ing System, J. Geophys. Res.-Atmos., 102, 23429–23465,                 analytical error model, Atmos. Meas. Tech., 4, 2019–2034,
   https://doi.org/10.1029/97JD01569, 1997.                               https://doi.org/10.5194/amt-4-2019-2011, 2011.
Landsea, C. W. and Franklin, J. L.: Atlantic Hurricane Database        Schwärz, M., Kirchengast, G., Scherllin-Pirscher, B., Schwarz, J.,
   Uncertainty and Presentation of a New Database Format, Mon.            Ladstädter, F., and Angerer, B.: Multi-Mission Validation by
   Weather Rev., 141, 3576–3592, https://doi.org/10.1175/MWR-             Satellite Radio Occultation–Extension Project, Final Report for
   D-12-00254.1, 2013.                                                    ESA/ESRIN No. 01/2016, Wegener Center, University of Graz,
Lasota, E., Rohm, W., Liu, C.-Y., and Hordyniec, P.:                      Austria, 2016.
   Cloud Detection from Radio Occultation Measure-                     Simpson,       R.     H.:     The      Hurricane      Disaster      Po-
   ments in Tropical Cyclones, Atmosphere, 9, 418,                        tential       Scale,       Weatherwise,         27,       169–186,
   https://doi.org/10.3390/atmos9110418, 2018.                            https://doi.org/10.1080/00431672.1974.9931702, 1974.
Lasota, E., Steiner, A. K., Kirchengast, G., and Biondi, R.: A         Steiner, A. K., Lackner, B. C., Ladstädter, F., Scherllin-Pirscher,
   comprehensive archive of Tropical cyclones vertical structure          B., Foelsche, U., and Kirchengast, G.: GPS radio occultation for
   covering the period 2001–2018, University of Graz, Austria,            climate monitoring and change detection, Radio Sci., 46, 1–17,
   https://doi.org/10.25364/WEGC/TC-RO1.0:2020.1, 2020.                   https://doi.org/10.1029/2010RS004614, 2011.
Li, Y., Kirchengast, G., Scherllin-Pirscher, B., Schwaerz, M.,         Steiner, A. K., Hunt, D., Ho, S.-P., Kirchengast, G., Mannucci,
   Nielsen, J. K., Ho, S.-P., and Yuan, Y. B.: A New Algorithm for        A. J., Scherllin-Pirscher, B., Gleisner, H., von Engeln, A.,
   the Retrieval of Atmospheric Profiles from GNSS Radio Occulta-         Schmidt, T., Ao, C., Leroy, S. S., Kursinski, E. R., Foelsche,
   tion Data in Moist Air and Comparison to 1DVar Retrievals, Re-         U., Gorbunov, M., Heise, S., Kuo, Y.-H., Lauritsen, K. B., Mar-
   mote Sens., 11, 2729, https://doi.org/10.3390/rs11232729, 2019.        quardt, C., Rocken, C., Schreiner, W., Sokolovskiy, S., Synder-
Liu, H., Anderson, J., and Kuo, Y.-H.: Improved Analyses and              gaard, S., and Wickert, J.: Quantification of structural uncer-
   Forecasts of Hurricane Ernesto’s Genesis Using Radio Occul-            tainty in climate data records from GPS radio occultation, At-
   tation Data in an Ensemble Filter Assimilation System, Mon.            mos. Chem. Phys., 13, 1469–1484, https://doi.org/10.5194/acp-
   Weather Rev., 140, 151–166, https://doi.org/10.1175/MWR-D-             13-1469-2013, 2013.
   11-00024.1, 2012.                                                   Steiner, A. K., Ladstädter, F., Ao, C. O., Gleisner, H., Ho, S.-P.,
Luntama, J.-P., Kirchengast, G., Borsche, M., Foelsche, U., Steiner,      Hunt, D., Schmidt, T., Foelsche, U., Kirchengast, G., Kuo, Y.-
   A., Healy, S., von Engeln, A., O’Clerigh, E., and Marquardt,           H., Lauritsen, K. B., Mannucci, A. J., Nielsen, J. K., Schreiner,
   C.: Prospects of the EPS GRAS Mission For Operational At-              W., Schwärz, M., Sokolovskiy, S., Syndergaard, S., and Wickert,
   mospheric Applications, B. Am. Meteorol. Soc., 89, 1863–1876,          J.: Consistency and structural uncertainty of multi-mission GPS
   https://doi.org/10.1175/2008BAMS2399.1, 2008.                          radio occultation records, Atmos. Meas. Tech., 13, 2547–2575,
Poole, L. R., Winker, D. M., Pelon, J. R., and McCormick, M. P.:          https://doi.org/10.5194/amt-13-2547-2020, 2020.
   CALIPSO: global aerosol and cloud observations from lidar and       Velden, C., Harper, B., Wells, F., Beven, J. L., Zehr, R., Olan-
   passive instruments, in Sensors, Systems, and Next-Generation          der, T., Mayfield, M., Guard, C. “CHIP,” Lander, M., Edson,
   Satellites VI, International Society for Optics and Photonics,         R., Avila, L., Burton, A., Turk, M., Kikuchi, A., Christian, A.,
   vol. 4881, 419–226, available at: https://www.spiedigitallibrary.      Caroff, P., and McCrone, P.: The Dvorak Tropical Cyclone Inten-
   org/conference-proceedings-of-spie/4881/0000/                          sity Estimation Technique: A Satellite-Based Method that Has
   CALIPSO--global-aerosol-and-cloud-observations-from-lidar-and/         Endured for over 30 Years, B. Am. Meteorol. Soc., 87, 1195–
   10.1117/12.462519.short?SSO=1 (last access: 7 April 2020),             1210, https://doi.org/10.1175/BAMS-87-9-1195, 2006.
   2003.                                                               Venkat Ratnam, M., Ravindra Babu, S., Das, S. S., Basha, G., Kr-
Rakshit, G., Jana, S., and Maitra, A.: Gravity Wave Be-                   ishnamurthy, B. V., and Venkateswararao, B.: Effect of tropi-
   havior in Lower Stratosphere During Tropical Cyclones                  cal cyclones on the stratosphere–troposphere exchange observed
   Over the Bay of Bengal, Radio Sci., 53, 1356–1367,                     using satellite observations over the north Indian Ocean, At-
   https://doi.org/10.1029/2018RS006614, 2018.                            mos. Chem. Phys., 16, 8581–8591, https://doi.org/10.5194/acp-
Ravindra Babu, S., Venkat Ratnam, M., Basha, G., Krishnamurthy,           16-8581-2016, 2016.
   B. V., and Venkateswararao, B.: Effect of tropical cyclones         Vergados, P., Mannucci, A. J., and Su, H.: A validation study for
   on the tropical tropopause parameters observed using COS-              GPS radio occultation data with moist thermodynamic structure

Earth Syst. Sci. Data, 12, 1–15, 2020                                                        https://doi.org/10.5194/essd-12-1-2020
You can also read