Moving to Personalized Learning - Instructional Software Implementation, Teacher Practice and Student Growth - LearnLaunch Institute
←
→
Page content transcription
If your browser does not render page correctly, please read the page content below

Moving to
      Personalized
        Learning
Instructional Software Implementation,
 Teacher Practice and Student Growth

        MassNET Research Report Year 2

           Academic Year 2016-2017

                           Steve Newton, Ph.D., Ph.D.
                               Megan Smallidge, MEd
                         Ann Koufman-Frederick, Ph.D.
                                 Eileen Rudden, MBA
Executive Summary
The MassNET Research Report, Year 2, seeks to identify the conditions for successful use of digital
instructional tools in the context of Boston Public Schools (BPS). The MassNET project brought
instructional software along with professional development and support to teams of teachers in Boston
who volunteered to use software focused on English Language Arts (ELA), with a desire to move toward
blended and personalized learning. The goal of this study is to increase understanding of which factors
play into effective incorporation of instructional tools. Along with this more general understanding of
implementation, the study also evaluates strengths and weaknesses of particular software products. A
large amount of data was collected throughout the 2016-2017 school year regarding the
implementation of the Mass NET project, teacher thinking, classroom environments, and actual usage of
software by students and their growth.

MassNET brought software to 68 teachers and approximately 1,300 students in eight BPS elementary, K-
8, and middle schools in 2016-2017. Over the course of three years, MassNET supported 200 Boston
Public School teachers in eleven schools, who taught 3600 students.

Key Findings

The results for this year’s study largely were consistent with our first
year’s findings regarding which factors supported higher implementation       Teachers who changed
by teachers:                                                                  practice to incorporate
                                                                              recommended levels of
   •   The piloting process helped almost all teachers take steps to
       move to blended and personalized learning. Teachers who                 instructional software
       continued with the program tended to increase usage.                 usage (usually less than 40
   •   Higher product usage was correlated with greater progress and
       achievement growth, as measured by each product.                     minutes weekly) were able
   •   Key factors supporting higher implementation included                       to devise more
       professional teacher mindset factors, prior experience working
       with instructional technology, and technological infrastructure.
                                                                             personalized instruction
   •   In the second year, almost all teachers indicated that they            for their students, who
       increased their personalized instruction and intended to continue     grew academically more
       to personalize instruction in the future.
   •   Net Promoter Score was a helpful global measure of a product’s          than their lower using
       usefulness and predicted whether schools chose to continue with                  peers.
       the product after the pilot year.

Results Summary and Conclusion
This study of implementation confirmed several main themes we identified in our first year and
expanded them as well. High implementation of blended and personalized learning requires the

                                                                                        February, 2018 | Page 1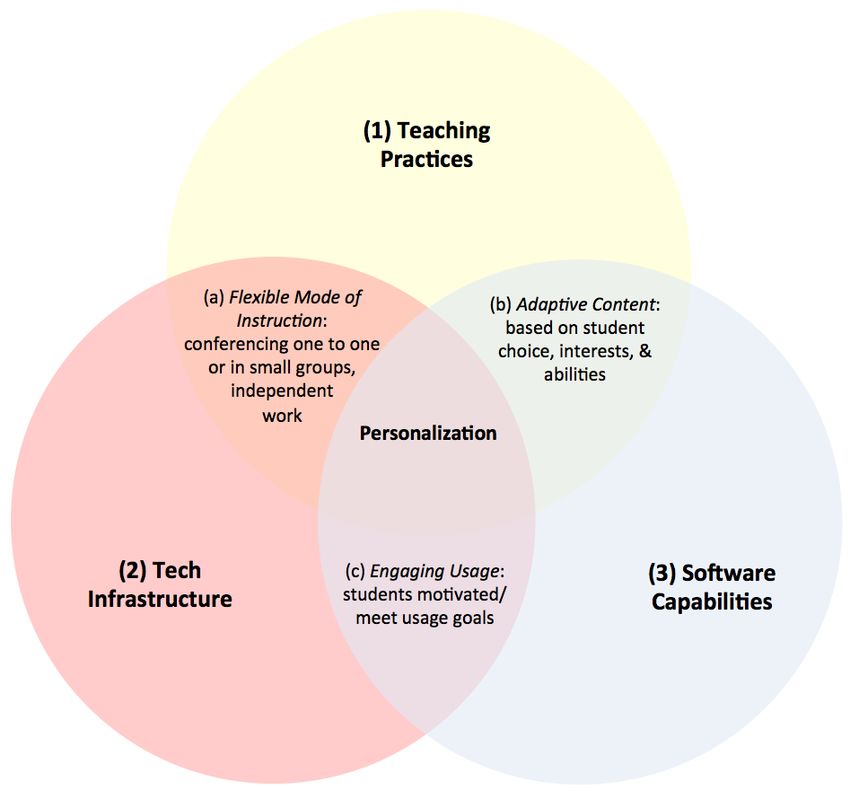
orchestration of many factors outside and inside the classroom. We saw more clearly how access to
devices can lead to almost immediate changes in usage, as teachers and students found it much easier
to engage with the instructional technology when they had more devices that could be used throughout
the day and more headphones to limit distractions. Teachers could then provide students with multiple
opportunities to work toward their target minutes, and students could then take ownership of their own
learning in new ways. Support for teachers came from a variety of sources, but informal talking among
teachers was by far the largest resource.

 As teachers used instructional technology, they began to see how it enabled them to meet students’
unique needs by providing differentiated content and also the data for teachers to sometimes meet
individually or in small groups. In the second year of the study, more nuanced insights into “teacher
mindset” were observed. While all teachers thought instructional tech might increase student
engagement, the high using teachers focused more on how to personalize instruction for students, using
data more often, and reflecting more deeply on the relationship between the software and the content
and pedagogy.

From these results, we can recommend two key strategies for increasing the likelihood of successful
pilots.

        •   First, it is important to prepare teachers in advance to identify their specific instructional
            goals and the strategies for reaching their goals. Ideally, this professional development and
            planning would take place prior to implementation. Given the complexity of the task of
            moving to blended and personalized learning, preparation increases the chances of success.
        •   Second, it is imperative to match the scale of the pilot with the availability of devices
            because of the importance of technical infrastructure.

In other words, it is better to start small and then scale up only as more devices can be purchased. This
study showed that matching the scale of the pilot with device availability can make the difference
between a successful experience of technology that makes instruction easier versus a constant struggle
to incorporate instructional technology. When teachers and students can rely on the availability of
devices they can plan accordingly. When devices are not consistently available, teachers must do much
more planning and then any problems that come up can be even more disruptive to attempts to meet
usage goals. Students can also be given more ownership of their own usage targets when devices are
more available. Finally, headphones can also play a key role affecting whether students are distracting to
each other or can focus on their work.

Net Promoter Score, a method of measuring teacher willingness to recommend software to a colleague,
predicted the likelihood of a school’s continuing to use the software to personalize instruction in a
subsequent year. This may be useful to administrators monitoring an instructional software pilot.

The MassNET experience shows that three key components are major resources that contribute to the
move to personalizing instruction: Teaching Practices, Software Capabilities, and Tech Infrastructure.

                                                                                           February, 2018 | Page 2
(See Appendix C for MassNET’s detailed Conceptual Model). These resources work together to create
instructional change through a flexible mode of instruction, adaptive content, and engaging usage - all of
which combine to create personalization for students.
Why Personalize?
Many in the field are asking for evidence regarding the impact of personalized learning strategies. This is
not a product efficacy study, but rather an implementation study that indicates that those teachers who
changed practice to incorporate recommended levels of instructional software usage (usually less than
40 minutes weekly) were able to devise more personalized instruction for their students, who grew
academically more than their lower using peers. Almost all teachers indicated a desire to continue to
personalize learning for students, with high implementers indicating a strong desire to have appropriate
data to differentiate instruction, and to support student choice. Measurement by the LEAP Innovations
Teacher survey indicated changes in these areas.
Although large-scale research studies can be important for studying product efficacy, smaller-scale
research, such as this MassNET research, has a place for informing decision-makers about their own
local context and helping build an evidence base for products. This study contributes to a richer
understanding of how context can affect the implementation of blended and personalized learning. It
also identifies key factors and conditions which underlie effective use.
February, 2018 | Page 3Table of Contents
EXECUTIVE SUMMARY ............................................................................................................... 1
INTRODUCTION .......................................................................................................................... 5
RESEARCH DESIGN...................................................................................................................... 6
DATA ANALYSIS ........................................................................................................................ 12
RESEARCH QUESTION 1A .......................................................................................................... 12
TO WHAT EXTENT DID PARTICIPATING TEACHERS IMPLEMENT DIGITAL TOOLS AS RECOMMENDED BY PRODUCTS? ............................12
RESEARCH QUESTION 1B .......................................................................................................... 15
WHAT FACTORS WERE RELATED WITH DIFFERENCE IN IMPLEMENTATION? ............................................................................15
RESEARCH QUESTION 2 ............................................................................................................ 24
WHAT WAS THE RESULT OF IMPLEMENTING INSTRUCTIONAL SOFTWARE, ESPECIALLY, TO WHAT EXTENT DID TEACHERS PERSONALIZE
THEIR INSTRUCTION? ..............................................................................................................................................24
APPENDIX A.............................................................................................................................. 31
RESEARCH CALENDAR .............................................................................................................................................31
APPENDIX B .............................................................................................................................. 33
QUALITATIVE TEACHER LOG DATA .............................................................................................................................33
APPENDIX C .............................................................................................................................. 34
CONCEPTUAL MODEL: KEY FACTORS FOR PERSONALIZED LEARNING IN THE CLASSROOM .........................................................34
REFERENCES ............................................................................................................................. 37
February, 2018 | Page 4Introduction
This MassNET Research Report, Year 2 (AY2016-2017), follows on the Year 1 (AY2015-2016) report by
further assessing the factors related to effective implementation of instructional software in Boston
Public Schools. The report includes additional research measures and is based on a larger number of
schools, both new and continuing from Year 1, as well as new instructional technology products. As a
study of implementation, this report seeks to identify the conditions for successful use of digital
instructional tools in the context of Boston Public Schools. This study is a part of the MassNET project,
which brought instructional software along with professional development and support to teams of
teachers in Boston who volunteered to use instructional software focused on English Language Arts
(ELA) to move toward blended and personalized learning. The goal of the analysis is to increase
understanding of how various factors can play into effective incorporation of these tools and help
teachers move toward personalized learning. Along with this more general understanding of
implementation, the study also evaluates strengths and weaknesses of particular software products. A
large amount of data was collected throughout the school year regarding the implementation of the
MassNET project, teacher thinking, classroom environments, and software usage.
The Learning Assembly
Starting in AY 2014-15, the Bill & Melinda Gates Foundation established The Learning Assembly, seven
non-profits across the country that connected teachers with digital instructional tools while providing
support and conducting research. This study is a built-in research component of the program located in
Boston named LearnLaunch MassNET, under the direction of LearnLaunch Institute. As stated in the
Gates RFP (Bill & Melinda Gates Foundation, 2015), the purpose of the grant driving this program is as
follows:
● Focus the development and adoption of personalized learning products on helping students
achieve desired learning outcomes.
● Put teachers and school decision-makers at the center of the shift towards personalized
learning.
● Lower risks and barriers to all parties of adopting new, potentially transformative products.
● Encourage the rapid development of a healthy, transparent market for highly effective learning
technologies.
In collaboration with Boston Public Schools (BPS), MassNET sought to create a process to engage
teachers as co-creators of educational software, while providing insight to the educators and the edtech
developers on the software products and the piloting process.
In the second year of the project, MassNET brought software to 68 teachers and approximately 1,300
students in eight BPS elementary, K-8, and middle schools, an increase from 38 teachers and about
1,100 students in the first year. In the second year the MassNET project:
February, 2018 | Page 5• Set up schools with software that is appropriate for addressing the educational goals specified
by each school team in four new schools and for new teachers in four schools that returned
from Cohort 1 (AY 2015-16).
• Supported teachers with professional development in their use of the educational software.
• Consisted of two "sprints" each lasting approximately 12 weeks beginning in October and
continuing through the end of March.
Research Design
Goals of Study
This study seeks to build on MassNET’s first year research, so it is helpful to begin with that study’s key
results regarding implementation and piloting (MassNET Implementation Evaluation, Year 1):
● The piloting process helped almost all teachers take steps to move to blended and personalized
learning.
● Product usage was correlated with greater progress and achievement growth on product
measures.
● Key factors supporting higher implementation included Professional Learning Communities,
teacher mindset, prior experience working with instructional technology, perception that
products were engaging, and technological infrastructure.
● Net Promoter Score was a helpful global measure of a product’s usefulness and predicted
whether schools chose to continue with the product after the pilot year.
This study will also look at the same issues, to see if they were replicated in the second cohort or to see
if different results were observed.
Building on the first year’s implementation study, this second year of research continued to assess
implementation of digital instructional tools in the classroom and also explore how implementation
relates to student learning progress. The central concern of this study was to continue to explore the
conditions related to how software use in the classroom promotes personalized learning, including
teacher characteristics, software used, and other contextual factors. In this way, the study seeks to
deepen understanding of how teachers can effectively incorporate digital instructional tools in the
Boston context, exploring patterns of practice that lead to instructional change toward personalized
learning. Because we were unable to access administrative data regarding student demographics and
achievement growth, our focus is on data collected as part of the study and on data collected by
products. As a result, we are not currently able to explore student achievement outcomes except for
those measured by products and cannot disaggregate results by student demographic characteristics.
Furthermore, since we only collected data from our participating teachers, we do not have a comparison
group for these analyses. We may include these additional analyses in the future, as data allows.
February, 2018 | Page 6Review of the Literature
Building skills in English Language Arts (ELA) and mathematics is a critical focus of elementary education.
Despite this, across the US, only 36% of fourth graders are determined by the 2015 NAEP (National
Assessment of Educational Progress) to be proficient in ELA, and only 40% in math, while 34% of eighth
graders are proficient in ELA, and 33% in math. While Massachusetts as a whole has shown relatively
high rates of proficiency, significant disparities are also evident, particularly for rural and urban districts.
On the 2016 PARCC end-of-year test, statewide 56% of 4th graders were proficient in ELA and 53% in
math, and 60% of 8th graders were proficient in ELA and 50% were proficient in math or Algebra 1.
However, in Boston Public Schools, students showed lower proficiency than in the state as a whole. Only
37% of fourth graders were proficient in ELA and 38% were proficient in math. In eighth grade, students
in BPS remained behind the state, as 42% of eighth graders were proficient in ELA and 37% were
proficient in math or Algebra 1.
Instructional technology tools have begun to show promising results for improving student learning
growth in both ELA (LEAP Innovations, 2016; Cheung & Slavin, 2013; Schechter et al., 2015; Macaruso,
Hook, & McCabe, 2006). By using instructional technology in the classroom, a trained educator can
understand in much more detail the learning needs of each student, and the software can provide the
educator supports with individualized lessons or student assignments. Rather than “teaching to the
middle,” teachers describe a greater ability to work with students at a range of capabilities.
Furthermore, instructional technology has the capacity to support a variety of practices to create a
personalized learning environment, and can be especially effective when used in this way (Pane et al.,
2015). Seldom does any teacher or school employ all of these practices, but they reflect desirable
characteristics of learning environments (US Dept. of Education, 2014) and instructional software can
facilitate these practices by providing teachers with the knowledge of students and flexibility to assign
different tasks.
Despite the promise of instructional software for promoting desirable practices and improving student
achievement, the research base on effectiveness is thin. There is increasing recognition about the
importance of having sufficient scale to measure effectiveness, and assessing effectiveness across
various contexts (Kane, 2017; Means, Murphy, & Shear, 2017). Furthermore, because software use can
often involve significant changes to teacher practice, it is important to consider context and
implementation in efficacy studies in order to determine the conditions for a product’s effectiveness
(Means, Murphy, & Shear, 2017). Although large-scale research studies can be important for studying
product efficacy, smaller-scale research, such as this MassNET research, also has a place for informing
decision-makers about their own local context and helping build an evidence base for products (Luke et
al., 2017). This study contributes to a richer understanding of how context can affect the
implementation of blended and personalized learning. It also identifies key factors and conditions which
underlie effective use. If data becomes available, we will also include analysis of student achievement
growth as well.
Statement of Hypotheses and Research Questions
The study will center on two research questions focused on the implementation of the digital
instructional tools and the move toward personalized learning practices.
February, 2018 | Page 7The first research question focuses on whether teachers changed their practices to incorporate digital
instructional tools in their classrooms. That is, to what extent did participating teachers implement
digital tools as recommended by products, and under what conditions?1 Second, what was the result of
implementing instructional software, especially; to what extent did teachers personalize their
instruction?
These research questions build on our first year’s study in a few ways. First, we have a larger and
different sample of participating teachers and schools. This sample of teachers includes four schools
continuing from our first cohort, mostly with new teachers, as well as four new schools. We also added
new products with different challenges for integrating with other ELA curricula. We also added new
measures that more closely track teacher reports of changes in instruction and were able to implement
the full LEAP teacher survey as a pre and post measure. We continued to collect data from teachers in
periodic teacher logs, focus groups, classroom observations, and end-of-year reflections. In these ways,
we sought to have a more thorough understanding of implementation of software in this urban school
context.
Analysis Approach
Our research design is based on an understanding of how classroom use of instructional technology
functions within a school and district context, what types of practice changes we anticipate being
implemented, and how these relate to outcomes. The logic model posits how various contextual factors
can relate to effective use of instructional software. Analysis of data was guided by this conceptual
model which is depicted in a logic model format in “LearnLaunch MassNET Project Logic Model (AY2016-
2017)” presented below. Context reflects key contextual factors that can affect incorporation of
technology. Inputs reflect resources that are brought to BPS through the project, principally the
characteristics of the technology products used, along with support from education technology
companies, as well as the resources brought by LearnLaunch Institute to support teachers and schools.
Outputs are the activities that are engaged in by participating teachers and students as a result of their
participation. The major categories are changes in how teachers prepare lessons (either facilitated by
technology or added time and effort required to make use of technology), the actual use of products in
classrooms, and changes in instructional practices related to technology or other classroom practices
facilitated by it. Outcomes are measures that reflect desired results from the program, and these are
principally distinguished by their time-frame, short, medium, or long-term. We will not be able to
measure long-term results, but these goals may help provide another lens for interpreting changes in
student experience.
Note that this form of logic model provides a program logic whereby the factors build on each other to
lead to the intended outcome, moving in a causal progression from left to right. In particular, inputs
(resources) provide for outputs (program activities), which are presumed to lead to outcomes, which are
the desired goals of the program. Also, note that the logic model differs from many in that it includes
contextual factors. This is because we believe that it is important both for BPS and for edtech companies
to know whether products work across different situations in the same way, so context is an important
part of the model.
1This was broken into two sub-questions in the analysis: “To what extent did participating teachers implement digital tools as recommended by
products” and “What factors were related with difference in implementation.”
February, 2018 | Page 8LearnLaunch MassNET Project Logic Model (AY 2016-2017)
Context Inputs Outputs Outcomes
Sample Tech Product(s) Teacher Lesson Planning/Prep Short Term Evidence of Learning
Characteristics
• Product characteristics • Student experience of
• District Tech o Teacher usefulness Technology Use personalized learning
Support o Student usefulness • Product assessments
• Amount (Days, minutes)
• Schools • Matching with school • Work products
• Challenge matched to
• Teachers • Professional • Formative assessments
students
• Classrooms development • District assessments
• Relation with other
• Students • Ongoing support • Teacher assessments
instruction
• Rigor/Challenge of content
LearnLaunch Support • Groupings (blended, 1 to 1, Medium-Term Learning Growth
etc.)
• Standardized test performance
• Supports provided • Ease of starting
• Standardized test growth
• Frequency of support
Long-Term Preparation
• Intrinsic motivation to learn
• Self-efficacy/growth mindset
about ability to make progress
• Academically prepared for college
Note:
or career work, without needing
Italicized elements included for conceptual importance remediation
but may be too difficult to measure
Tech Product Improvement
• Modify product based on
feedback
Data Collection
For this study we collected a range of qualitative and quantitative data. In addition to product data on
usage and student progress, teachers completed all and spring surveys regarding personalized learning
in their classrooms, six months of online logs with both quantitative and qualitative components, and a
final online reflection. Researchers conducted two teacher focus groups at each school and observed up
to two classrooms where teachers used technology or led ELA lessons without technology. All of these
data components included high rates of participation, and so they provide a rich and detailed picture of
teacher thinking and practice as well as the instructional practices surrounding the use of digital
instructional tools. Furthermore, they provide a longitudinal perspective over the course of the school
year.
The details of data collection are shown in the following Data Collection Calendar (Appendix A):
Before analyzing results for 2016-17, it is helpful to recall the key results regarding implementation and
piloting from the first year study in Boston (MassNET Implementation Evaluation, Year 1):
● The piloting process helped almost all teachers take steps to move to blended and personalized
learning.
February, 2018 | Page 9● Key factors supporting higher implementation included Professional Learning Communities,
teacher mindset factors, prior experience working with instructional technology, perception that
products were engaging, and technological infrastructure.
● Net Promoter Score was a helpful global measure of a product’s usefulness and predicted
whether schools chose to continue with the product after the pilot year.
This study will consider whether these findings were also observed in the second year, as well as looking
for further results as well.
MassNET Program
Model
The MassNET piloting approach, while
developed independently, contains similar
key components to those used by Digital
Promise, another organization that comes
alongside schools to support their move to
innovating personalized learning practices.
Digital Promise identifies eight steps in their
Edtech Piloting Framework, each of which is
shared by MassNET (Digital Promise, 2017):
1. Identify Need
2. Discover & Select
3. Plan
4. Train & Implement
5. Collect Data
6. Analyze & Decide
7. Negotiate & Purchase
8. Summarize & Share
Selection Process
MassNET school participants were selected from among schools that completed an application process
in the spring and summer of 2016. As with the first cohort, schools indicated their desire to move to
personalized learning through the implementation of instructional software for ELA in grades K-8. Each
school selected a team of teachers, ranging in size from 5-15, with the support of the school’s principal,
identifying a key point person to lead the effort, and indicating an academic goal and how to measure it.
MassNET put together a list of ELA instructional products and their characteristics, seeking to make it as
comprehensive as possible. Based on this list, each team was given suggestions of multiple possible
products that aligned with their goals, and they selected either from the list or any other product they
wished to use. New teams received free products for the first year of the study, but committed to
purchasing them if they determined that they were effective. By participating in MassNET, they received
ongoing support and professional development, as well as periodic data analyses. At the end of the year,
they reflected on their experience and the data collected, and thus evaluated the product’s usefulness
for them. Schools were then in position to negotiate with product companies for purchasing. MassNET
helped support communications between schools and products, but left purchasing decisions up to
schools themselves. Finally, the research component of MassNET focused on summarizing results and
February, 2018 | Page 10sharing them, while participating schools also sometimes took the opportunity to share their insights at
conferences such as iNACOL and SXSWedu.
Participating Schools
Eight schools participated in MassNET in 2016-17, four of which continued from Cohort 1 (Sumner,
Roosevelt, McCormack, and TechBoston) and four of which were new (O’Donnell, Timilty, Eliot, and
Holmes). The schools included three elementary schools, two K-8 schools, two middle schools, and a
combination middle and high school.
School Grades Teachers Students Products
Charles Sumner Elementary 2, 4, 5 16 222 Lexia Core5, ThinkCERCA
Franklin D. Roosevelt K-8 K-5 8 178 Lexia Core5
Hugh R. O’Donnell Elementary K, 1 8 107 Lexia Core5
James P. Timilty Middle 6-8 7 154 i-Ready
John Eliot K-8 6-8 10 207 ThinkCERCA
John W. McCormack Middle 6-8 5 119 i-Ready
Oliver Wendell Holmes Elementary 2, 3, 5 9 210 Reading A-Z, Writing A-Z
TechBoston Academy 6-8 5 87 i-Ready
Participating Student Initial ELA Levels
Although we did not have access to achievement data from state-mandated assessments, we had initial
placement results from i-Ready and Lexia, which were typically administered in October 2016. Product
assessments placed students in grade levels in order to set an initial placement for students within the
program. Elementary classrooms were assessed with Lexia and middle school classrooms were assessed
with i-Ready. As can be seen in Charts 1 and 2, only a small percentage of students were performing
within their current grade level or above in elementary school (25.9%) and even fewer in middle school
(3.5%). Furthermore, 29.0% of elementary students and 91.9% of middle school students were placed
two or more grade levels below their actual grade. That is, a strong majority of students were behind in
their content knowledge at the beginning of the year, and in middle school, over 90% of students were
performing multiple years below their actual grade level. In order to teach grade-level content,
therefore, teachers must provide extra supports for most of their students, and also differentiate
according to the range of entering knowledge.
February, 2018 | Page 11DATA ANALYSIS
The first research question focuses on variability in implementation, and which factors were associated
with this variability.
Research Question 1a
To what extent did participating teachers implement digital tools as
recommended by products?
When making sense of implementation, we focused first on how it varied, and how this variability was
related to other factors. Specifically, we first looked at the extent to which teachers implemented
software for the amounts of time recommended. When looking at related factors, we considered the
school context, teacher characteristics upon entering the program, the software used, and how
implementation related with other teaching practices.
Defining Implementation
Implementation was defined based on extent of software use, from which we determined three
categories of classrooms: High Implementing (HI); Medium Implementing (MI); and, Low Implementing
(LI). Conceptually, HI classrooms were defined as those that consistently met the usage recommended
by the products, MI classrooms had usage of at least half the rate recommended but fell short of the
usage targets, and LI classrooms were below half of recommended usage.
Since the formal project ran about 20 weeks, and i-Ready had a target of 45 minutes per week but did
not count time taking the diagnostic, we set the target for HI at 800 total minutes of usage or more, thus
between 400 and 800 minutes was counted as MI, and below 400 minutes was LI. HI for Lexia was
defined as averaging 30% meeting usage throughout the year for HI and 15% for MI. Although it might
intuitively seem that averaging 50% meeting usage would be the definition of HI for Lexia, this would
not account for the fact that (a) the project began after the start of the school year and ended at the
end of March, (b) some weeks students had vacation or were taking standardized tests, and (c) Lexia
targets were often 60 minutes per week. So, taking these factors into account, 30% usage was both
similar to the targets set for other products and to Lexia's usage targets. When applying these cut-offs to
teacher data, classrooms tended to clearly fall into one of the three groups and were seldom near the
boundaries. So, these definitions seemed to meaningfully distinguish between different usage patterns
in classrooms. Each teacher was classified by these criteria (including all students when they taught
multiple classrooms), and 23 of 51 were found to consistently use the product at recommended levels
(HI), 14 of 51 teachers used the product a substantial amount of time but were mostly short of
recommended levels (MI) and 14 of 51 teachers used the products at lower levels (LI). 2
2In defining how to categorize each teacher’s classroom, we faced a few challenges when comparing data across products. First, each product
had different recommended usage targets. i-Ready recommends 45 minutes of use per week. Lexia has a target for students to use Core5 for at
February, 2018 | Page 12i-Ready Usage
Users of i-Ready varied considerably in the amount of time on task, and the related student progress
and achievement growth tracked with usage. Note that this does not include time spent taking
diagnostic exams. As can be seen, time on task with the program averaged about three hours total for
the LI group, and just over 17 hours for the HI group, with the average being just over 10 hours.
i-Ready Product Measures
Measure Implementation
Low (LI) Med (MI) High (HI) All
# of Teachers 2 7 7 16
Average Time on Task (mins.) 174.5 526.5 1025.1 614.5
Average # of Lessons Failed 1.3 4.8 9.1 5.4
Average # of Lessons Completed 6.7 18.4 41.1 22.9
Average Pass Rate 81.5% 74.6% 76.4% 77.1%
Average # of Lessons (Total) 6.8 16.1 33.9 20.2
Average Growth from Fall to Spring Diagnostics 10.6 10.3 21.6 15.4
Number of Days between Assessments 108 111 174 134
HI group passed an average of 34 lessons versus about seven lessons for the LI group, and the HI group
had average growth of 21.6 scale score points between their first and last product assessments. This
growth took place over a larger time span (66 more days on average between first and last assessment)
but that would not account for the growth which was more than double. Interestingly, the pass rates for
the Low group were higher than the others. Because i-Ready lessons are adaptive to student ability, pass
rate is a measure of whether students were appropriately focused; since all students are receiving
material they are capable of learning. So, LI students were not necessarily less focused even though they
tended to use the product less often. LI students would not have gone as deep into their lesson paths as
the HI students, thus encountering a relatively lower difficulty level of lessons.
In sum, HI students showed a great deal more progress in completing levels within the program and
showed higher achievement growth. I-Ready’s criterion-referenced 1-year growth targets are 15, 13,
least 20 weeks and meet weekly usage goals at least 50% of the time. Since our classrooms used the products 30 or more weeks, a 30%
threshold meant that even at the bottom of our HI threshold, students would have averaged 10 or more weeks meeting their usage targets,
which is similar to Lexia's recommendations. ThinkCERCA recommends ten Applied Reading & Writing lessons by the end of the year. A second
challenge was that we had access to different data for each product, with minutes of on-task usage for i-Ready and ThinkCERCA but percent of
students meeting their target in Lexia. When defining implementation across products, the main choice was either (a) use each product’s
unique targets for defining implementation levels, or (b) develop a common metric across products that was as close as possible to each one’s
desired use. Option B seemed better because it allowed for making fairer comparisons across products and also because we did not have access
to all of the data for using option A at the time of this analysis.
February, 2018 | Page 13and 13 points respectively or grades 6, 7, and 8 in Reading. The results we see here therefore show that
the students who used the program with fidelity exceeded the expected 1-year growth targets. 3
Lexia Core5 Usage
With Lexia, the HI group used the product extensively, and included 72% of teachers (13/18). Only two
teachers were classified as LI (11%) and three classified as MI (17%). The three MI teachers were all
taught either Kindergarten or grade 1 and were first time users. At the time of this report, we did not
have access to minutes of usage for Lexia, so percent meeting target usage was used.
Lexia Core5 Usage
Measure Low Medium High All
# of Teachers 2 3 13 18
% of Students Meeting Usage 3.1% 21.2% 74.5% 56.7%
Average # of Minutes Used in School Year N/A N/A N/A N/A
ThinkCERCA Usage
Teachers using ThinkCERCA varied in their usage, but unlike with the first two products, the majority (9
of 15) were classified at a LI level, while 3 were classified as MI and HI, respectively.
Measure Low Medium High All
# of Teachers 9 3 3 15
Average # of minutes used in school year 171 566 838 384
Growth in Words Written 51 37 99 62
Average Percent Reading Growth 11% 22% 21%
Thus, implementation varied considerably for different products. Lexia Core5 had a majority of users
classified as HI, while i-Ready had the largest groups classified as either HI or MI, with only a couple of
teachers classified as LI. ThinkCERCA had the lowest usage, with the majority (9 of 15) classified as LI. It
should be noted that these products were used by different grade levels and at different schools, so our
data does not establish that products cause different usage, but it is worth noting the patterns. In one
school, Lexia (grade 2) and ThinkCERCA (grades 4 and 5) were both used, and Lexia Core5 had all 5
teachers classified HI, while ThinkCERCA had 3 HI, 3 MI, and 3 LI teachers. A distinction here was that all
5 Lexia teachers were returning from Cohort 1, so it is not a comparison that allows causal inference.
3i-Ready’s Technical Manual indicates that its assessments have been shown to be highly correlated with PARCCC, SBAC, and other state
assessments.
February, 2018 | Page 14Research Question 1b
What factors were related with difference in implementation?
The following analyses contrast HI and LI classrooms to seek to identify how they differed both in their
contextual factors and within the classroom. These analyses are descriptive and seek to look for patterns
and cannot establish causal relationships between these various factors and higher or lower
implementation. We cannot control for measured or unmeasured factors to isolate how a given factor
could “cause” implementation due to our small sample size and a design that did not include random
assignment. Consider the issue of products, for example. Each school used only one product or family of
products, with one exception, and in that school the products were used at different grade levels. Our
data is thus not adequate for teasing apart the effects that products have versus the effects of schools in
any rigorous way. Nevertheless, by contrasting HI and LI classrooms using a rich dataset, we can identify
patterns which distinguish them without necessarily being able to make causal claims.
Teaching Context
Implementation Differed by Product
Implementation varied across products. The majority of teachers using Lexia were classified as HI (13 of
18), while the majority of teachers using ThinkCERCA were classified as LI (10 of 17). I-Ready teachers
were weighted toward HI and MI (7 teachers each) as compared with LI (2 teachers). Without product
data, Writing A-Z and Raz-Plus were not classified for implementation, though teacher reports indicated
that they used RAZ-Plus significantly more than Writing A-Z. Since products were used in different
contexts and at different school levels, we cannot conclude that products caused these usage rates.
# of Teachers in Each Implementation Category, by Product
Measure Implementation
Low Medium High Not Classified All
i-Ready 2 7 7 1 17
Lexia Core5 2 3 13 4 22
ThinkCERCA 9 3 3 3 15
Writing A-Z/Raz-Plus 0 0 0 9 9
Total Teachers 13 13 23 17 68
Implementation Differed Somewhat by Use Case
Teachers in the project taught different types of classrooms, including English as a Second Language
(ESL), special education, general education, and other intervention classrooms. The first three types
each had a similar balance of HI, MI, and LI classrooms. Intervention classrooms were defined as classes
that brought together students for additional academic support that were not targeting only English
February, 2018 | Page 15Learners (ELs) or special education students. Both of these intervention classrooms in the study had low
implementation, a finding which warrants further study with larger samples of classes, since this study
included only two.
For each use case, HI classrooms were as frequent or more frequent than LI or MI. ESL classrooms and
Intervention classes had a majority of HI classrooms, though the numbers are too small to make
generalizations.
Measure Implementation
Not
Low Medium High % High All
Classified
# of Teachers - All4 14 14 23 17 45.1% 68
Use Case – ESL 1 2 6 1 66.7% 10
Use Case - Intervention 0 1 2 3 66.7% 6
Use Case - General Education 8 8 10 7 38.5% 33
Use Case – Special Education 4 3 4 4 36.4% 15
Technology Challenges
Teachers also reported quantitative data in their monthly logs, including tech problems encountered
and their grouping practices. HI teachers reported fewer tech problems than LI teachers (.74 per week
vs. .90). Tech problems included a broad range of issues: Wi-Fi issues, logon problems, lack of
headphones, lack of working devices, and software problems.
Technological Challenges Encountered
Measure Implementation
Not
Low Medium High Classified All
Average # of Tech Problems 0.90 0.90 0.74 .99 0.86
Note that higher usage would mean that HI classrooms would have more opportunities to encounter
technical problems, so the lower rates of reported problems may actually underestimate the actual
differences in technological challenges. That is, if HI classrooms used software 4-5 times as much as LI
classrooms, then they would have many more opportunities to encounter problems, but did not report
doing so.
Improved Technological Infrastructure Can Facilitate Implementation
Roosevelt K-8 School used Lexia Core5 for grades K-3 in 2016-17, but the usage patterns were quite
divergent by the end of December 2016. At that point, the upper campus (grades 2-3) had consistently
high usage but the lower campus (grades K-1) did not. The principal became aware that teachers felt
4 We did not know the use case for two teachers.
February, 2018 | Page 16they did not have adequate numbers of headphones or computers, and, with the support of parents,
purchased new headphones and Chromebooks early in 2017. Teachers described to us that they were
newly able to use software with larger groups of students so that they were not disruptive of other
students, and their usage patterns began to change quite substantially, as can be seen below:
Percent of Students Meeting Usage Target, Roosevelt
Elementary Lower Campus
100
50
0
10/3/16 11/3/16 12/3/16 1/3/17 2/3/17 3/3/17 4/3/17 5/3/17 6/3/17
This school had been using a rotation model that does not necessarily require a 1-to-1 match between
students and devices, but this change made a big difference in their flexibility to use devices at any time,
to assign them to larger groups of students, and to use them in a way that was not disruptive to their
other centers. Teachers at Holmes Elementary school described a similar result when they increased
access to devices, in which they said that even though they had been using a rotation model, the new
devices allowed students to feel much more engaged with the program. Here was how a teacher
described this in a focus group:
“LearnLaunch – You went from 6 to 19 computers?
Holmes Teacher – Yes. It made a big difference, they had more exposure to it and they wanted
to do it more with more exposure to it.”
We did not have access to product data to demonstrate this change at Holmes as was seen at Roosevelt.
Thus, technological infrastructure can play a very important role in helping increase usage, even if a
school has moderate infrastructure to begin with.
Implementation and Teacher/Classroom Characteristics
Usage Patterns
Measure Implementation
Low Medium High Not Classified All
Average Mins. (Self-Report) 50.8 59.8 64.8 82.5 65.9
Grouping- 1 to 1 60.8% 47.0% 71.0% 28.3% 54.0%
Grouping - Rotation 35.3% 42.7% 23.0% 64.7% 39.3%
In weekly logs, teachers reported on various factors related to software use, but HI and LI classrooms
differed substantially only on the number of minutes of average use reported. In all categories of
February, 2018 | Page 17implementation, teachers reported students were using products much more than was found with
product data. Teachers’ reports were directionally correct, with HI classrooms reporting the most use
and LI classrooms the least. This finding suggests that it may be difficult to estimate actual use by
students, and that most teachers tend to overestimate the amount of time students are using
instructional software. As a follow-up analysis, if we can obtain weekly, or monthly, usage data from
products, further analyses can compare actual with estimated minutes in a more direct way.
Implementation Differed for New and Returning Teachers
Returning vs. New Teachers
Teacher Participation
Implementation
in MassNET
Low Medium High Not Classified % High All
New 13 12 17 15 40.5% 57
Returning 1 2 6 2 66.7% 11
All 14 14 23 17 45.1% 68
Of the 68 teachers in this year’s study, 57 were new and 11 returned from the first year’s study.
Comparing these groups, returning teachers, despite receiving less support from MassNET, were more
likely to be HI (66.7% vs. 40.5%), and much less likely to be LI (11.1% vs. 31%). This suggests that
experience may make it easier to make extensive use of software in a classroom.
Support Received
In their monthly logs, teachers also indicated who was providing them support and how often. For each
implementation group, the most common support was informal conversations with other teachers,
which happened about half of the weeks overall. LI teachers reported receiving support more frequently
than HI teachers (and about the same as MI teachers). As for specific sources of support, LI teachers and
HI teachers tended to receive their support from similar sources, except that LI teachers reported that
they were helped by coaches more often. Of all the sources of support, coaches are typically more
focused on helping needy teachers, so this is one indication that LI teachers were struggling more than
others. Interestingly, although we observed that schools with Professional Learning Communities (PLCs)
tended to have higher rates of implementation, teachers did not describe receiving much support in
their PLCs that directly addressed instructional technology. Specifically, PLC support was less frequent
than support from any other source besides school administrators, so PLCs did not necessarily provide
substantial direct support to teachers regarding instructional technology.
So, if PLCs are not a frequent source of direct support, are they related in any way to overall support
received? To investigate this issue, we looked at school-level support patterns, specifically those related
to PLCs. For this analysis, we compared teachers in the four schools with the highest rates of support
from their PLCs with the four schools having the lowest rates of support from PLCs. In the high PLC
group, teachers reported having an average of 1.52 sources of support per week, while the low PLC
group had an average of .99 sources of support per week. Furthermore, the high PLC group received
February, 2018 | Page 18more support from each individual source than the low PLC group. So, schools which had more PLC
support also tended to have more support across the board from a variety of sources. We wondered
whether schools with high PLC support would also have more informal teacher support, with the notion
that perhaps PLCs were creating a culture of support among teachers. As it happened, however, teacher
informal support did not differ by much in High PLC schools and Low PLC schools.
Support Received (% of Weeks)
Support Implementation
Low Medium High Not Classified All
School Administrators 14.5% 21.2% 4.7% 0.0% 8.5%
Coaches 33.7% 24.1% 11.4% 10.0% 17.3%
PLC 17.3% 23.8% 8.8% 11.6% 13.9%
Informal Teacher 55.7% 59.4% 44.4% 42.2% 48.8%
Tech Product 25.8% 19.0% 13.2% 9.7% 15.6%
LearnLaunch 20.8% 19.2% 9.7% 16.8% 15.2%
Average Sources Per Week 1.68 1.67 0.92 0.90 1.19
High PLC Schools Low PLC Schools Gap
School Administrators 12.7% 4.6% 8.0%
Coaches 27.9% 8.5% 19.4%
PLC 16.6% 7.8% 8.8%
Informal Teacher 53.1% 51.3% 1.8%
Tech Product 22.4% 11.4% 11.0%
LearnLaunch 18.9% 15.5% 3.5%
Average Sources Per Week 1.52 0.99 0.52
Log Qualitative Responses
Prior Experience
In the first year report, we found that teachers with no prior experience (about 1/3rd of the sample)
averaged lower implementation. In this year’s data, only two teachers (about 3% of the sample)
reported no prior experience with instructional technology, and both were classified as LI. So, the same
finding was observed, but with a sample size that was too small to rule out the effects of chance. This
finding may suggest that more and more teachers are being exposed to instructional technology, as we
would expect the first cohort to have more early-adopters than the second cohort, and thus to be more
experienced on average. Teachers with prior experience rated whether it was positive, negative, or
mixed. No teachers rated their prior experience as negative and out of 37 teachers 23 rated their prior
experience as Positive, and 12 as mixed positive and negative.
February, 2018 | Page 19Initial Intentions
Teachers completed logs both on a monthly basis and a log where they retrospectively described their
initial thoughts and intentions and reflected on their end-of-year progress. Because only four LI teachers
completed these final reflections, there was not sufficient data to do a statistical test between LI and HI
teachers. So, tests contrasted HI teachers with an aggregate of LI and MI teachers. The data summary
tables below provide data for all implementation levels. Contrasts were tested by a two-sample t-test,
testing whether HI teachers differed from LI and MI teachers on each measure. The statistical
significance level was set for 0.05.
HI teachers had a couple of responses that differed from non-HI teachers at a statistically significant
level, though the small sample size meant that only very substantial differences would stand out as
statistically significant and other differences were also observed. When asked about their hopes for the
year, HI teachers were more likely to express a hope to personalize their classroom instruction (100% vs.
69%). The other item where the groups differed was that HI teachers were less likely to be concerned
that the software would be hard to use (0% vs. 38%). It was noteworthy that only a couple of teachers
had no past experience with instructional technology and both ended up being classified as LI for
implementation. In the prior study, one-third of teachers reported no prior experience, so the
proportion of inexperienced teachers decreased in this year. Second, the result was consistent with last
year’s that teachers new to using instructional technology tended to have lower implementation,
though the numbers were too small to give much weight otherwise.
Teacher Intentions for Using Instructional Technology (Retrospective)
Measure Implementation
Low- Gap HI –
High Not classified All
Medium (LI, MI)
Hopes for Using Tech
Student knowledge/ Learning 84.6% 93.3% 88.9% 89.2% 8.7%
Student Personalization 69.2% 100.0% 77.8% 83.8% 30.8%
Student Engagement 84.6% 73.3% 88.9% 81.1% -11.3%
Useful Teacher Tool 38.5% 46.7% 33.3% 40.5% 8.2%
Miscellaneous 7.7% 6.7% 0.0% 5.4% -1.0%
Concerns About Using Tech
Devices 53.8% 46.7% 55.6% 51.4% -7.2%
Wireless 38.5% 33.3% 66.7% 43.2% -5.1%
Integrate with Teaching 30.8% 40.0% 44.4% 37.8% 9.2%
Time 30.8% 13.3% 22.2% 21.6% -17.4%
Hard to Use 38.5% 0.0% 22.2% 18.9% -38.5%
Content 7.7% 26.7% 0.0% 13.5% 19.0%
Other 7.7% 20.0% 0.0% 10.8% 12.3%
None 0.0% 20.0% 11.1% 10.8% 20.0%
February, 2018 | Page 20Past Tech Experience
Positive 46.2% 73.3% 66.7% 62.2% 27.2%
Mixed 38.5% 26.7% 33.3% 32.4% -11.8%
None 15.4% 0.0% 0.0% 5.4% -15.4%
Negative 0.0% 0.0% 0.0% 0.0% 0.0%
*pand LI teachers tended to disagree more than to agree.5 Making sense of this difference, it is important
to note that, all things being equal, we would expect that higher use of software would lead teachers to
rate this item higher. So, the result for HI teachers is consistent with their higher product use.
Product Ratings (Strongly Disagree to Strongly Agree, 1-4)
Measure Implementation
Low Medium High Not Classified All
# of Teachers 23 14 14 17 68
Students focused 2.98 3.05 2.99 2.99 3.00
Software helped learning 2.86 2.98 2.97 2.89 2.94
Software helped personalize 3.10 3.06 3.04 2.84 3.01
Software helped agency 2.94 2.98 2.86 2.91 2.91
Software took time out of class 2.33 2.16 2.68 2.99 2.59
Higher Net Promoter Ratings Associated with Higher Usage
Net Promoter Scores (NPS) represent a good single measure of a teacher’s overall feelings about the
usefulness of a product. The following table summarizes how participants rated each product week-by-
week in their weekly logs, as well as their average ratings for the first half of the project, average for the
last half, and overall ratings. These ratings are then displayed in charts that help illuminate the trends in
ratings over time. This trend data provides further information about how teachers react to products
and whether ratings change over time. In making sense of the patterns of data, a couple of main points
stand out. First, early ratings of positive or negative were consistent with overall positive or negative
ratings. Positive ratings in the first month were consistent with overall positive ratings and negative
ratings after three weeks were predictive of overall negative ratings, and a neutral rating ended up
trending downward over time.
Date Range i-Ready Lexia Raz-Plus ThinkCERCA Writing A-Z
October 22 38 100 -40 -100
November -15 53 86 -25 20
December 33 65 67 -50 17
January 43 60 100 -62 -14
February 43 75 100 -55 -57
March 31 63 67 -82 -50
5 Note that 2.5 is the mid-point of the scale, so ratings above 2.5 indicate more agreement while ratings below 2.5 indicate more disagreement.
February, 2018 | Page 22i-Ready Net Promoter Score Lexia Core5 Net Promoter Score
100 100
50 50
0 0
Oct Nov Dec Jan Feb Mar Oct Nov Dec Jan Feb Mar
-50 -50
-100 -100
Mean: 27, Final: 31 Mean: 60, Final: 63
Raz-Plus Net Promoter Score ThinkCERCA Net Promoter Score
100 100
50 50
0 0
Oct Nov Dec Jan Feb Mar Oct Nov Dec Jan Feb Mar
-50 -50
-100 -100
Mean: 85, Final: 67 Mean: -52, Final: -82
Writing A-Z Net Promoter Score
100
50
0
Oct Nov Dec Jan Feb Mar
-50
-100
Mean: -22, Final: -50
Net Promoter ratings corresponded with usage for each product, such that the highest NP score (Lexia
Core5) had the largest proportion of HI teachers, the next highest NP score (i-Ready), had the next most
HI teachers, while the lowest NP score (ThinkCERCA) had the lowest proportion of HI teachers. This
excludes Learning A-Z products (Raz-Plus and Writing A-Z), which did not provide usage data and thus
did not have teachers classified for extent of implementation.
Two products ended up with NPS scores averaging less than 0—ThinkCERCA and Writing A-Z—but for
quite different, though related, reasons. In both cases, the products were not quite appropriate for the
developmental levels of the students to be used easily. In our work with the schools using these
products, we had the opportunity to hear from teachers in focus groups and numerous other
interactions. ThinkCERCA was used in two schools, and teachers expressed different problems in the
schools. At Sumner, ThinkCERCA was used by students in grade 4 and 5, who mostly were below grade
level in their initial placements. Teachers reported that the content was very challenging for their
students, and they spent a lot of time and effort to prepare students to do the work, including selecting
appropriate texts, creating graphic organizers summarizing the CERCA process (Claim, Evidence,
Reasoning, Counterargument, Audience), and preparing students with the vocabulary needed for the
February, 2018 | Page 23You can also read