DETERMINANTS OF NIGHT MARKET DESTINATION LOYALTY: A STRUCTURAL EQUATION MODEL ANALYSIS
←
→
Page content transcription
If your browser does not render page correctly, please read the page content below
NIGHT MARKET DESTINATION LOYALTY                                                        PJAEE, 18(3) (2021)

      DETERMINANTS OF NIGHT MARKET DESTINATION LOYALTY:
            A STRUCTURAL EQUATION MODEL ANALYSIS

                     Dumrong Bamrongpol 1, Puris Sornsaruht2, Samart Deebhijarn3
                       King Mongkut’s Institute of Technology Ladkrabang (KMITL)
                    1,2,3

             1
                 61618010@kmitl.ac.th, 2drpuris2017@gmail.com, 3drsamart@yahoo.com

 Dumrong Bamrongpol, Puris Sornsaruht, Samart Deebhijarn. Determinants of
 Night Market Destination Loyalty: A Structural Equation Model Analysis.
 A conceptual model. – PalArch’s Journal of Archaeology of Egypt/Egyptology 18(3),
 148-158. ISSN 1567-214X

 Keywords: Bazaars, Destination loyalty, Domestic tourism, Experiential value,
 Hawkerpreneurs, Night markets, Thailand.

ABSTRACT
In a COVID-19 pandemic world, domestic tourism has taken on a crucial role in generating
jobs, national economic wealth, community prosperity, and sustainability. In Thailand, as in
other countries, including China and Japan, policymakers have launched plans to jumpstart
domestic tourism and boost consumption. Therefore, this study set out to investigate which
factors play the greatest role in a night market visitors’ destination loyalty (DL). The study's
empirical data was collected by the use of systematic sampling from ten famous Bangkok
night markets. After an audit of the research instrument, 425 questionnaires were used in the
subsequent analysis. Before structural equation modeling (SEM) of the study's nine
hypotheses, a confirmatory factor analysis (CFA) along with a goodness-of-fit (GOF) was
performed using LISREL 9.1. In this study, a market visitor’s destination loyalty (DL) was
found to be foremost influenced by the visitor's satisfaction (VS). The visitor's experiential
value (EV) also played a key role, which included the market's environment, uniqueness,
sensual perceptions, and value. The market's destination image (DI) was next in importance,
followed by destination attachment (DAt), and the destination's availability (DAv). From
Sweden to China, past studies and current leaders have pronounced the importance of the
entrepreneurial vitality of night markets and street stalls. Public seller spaces in the form of
night markets/bazaars also create tourist destinations from near and far, for both local and
foreign visitors. Employment is created and entrepreneurial skills are learned. Globally,
international tourism has ground to a halt. Governments are desperately trying to create
employment and generate revenue from domestic tourism schemes. Therefore, we suggest
leaders and entrepreneurs focus their time and resources on adapting each community's open
spaces into pleasant, safe, and easily accessible areas for night market type activities, with DL
further enhanced by adopting social media platforms and venues conducive to selfie tourism.

                                                                                                148
NIGHT MARKET DESTINATION LOYALTY PJAEE, 18(3) (2021)
1. INTRODUCTION
Up until the ongoing global health crisis pandemic, nearly 40 million annual international
tourists to Thailand were contributing as much as $62 billion a year to both the local and
national economies (Chandran, 2020; CEIC, 2019). Moreover, the World Bank (2020)
reported that the Thai tourism sector accounted for approximately 15% of the Kingdom’s
GDP, contributing one in every six jobs (Pinchuck, 2020). However, according to a World
Bank (2020) report, over 8 million service and manufacturing jobs were at risk from COVID-
19. In late October 2020, the Thai tourism minister also reported that both the Thai domestic
and international tourism sectors had lost a ‘drastic’ loss of over $50 billion in the first nine
months of the year (“"Drastic" losses to Thai tourism,” 2020). This is exacerbated by the fact
the World Travel & Tourism Council (WTTC) has now increased their global job loss
estimates to a staggering 100 million due to the Covid-19 pandemic (WTTC, 2020).
Thailand and its neighbors are not alone in this catastrophic crash, as countries globally have
closed their borders, airlines have ceased operations, and international hotel bookings have
become almost non-existent. With COVID-19's impact on the global economy a topic of
intense concern and debate, another report in May 2020 from the UNWTO (2020) also helps
us understand the magnitude of the COVID-19 pandemic damage to the world's tourism, as it
projects global job losses reaching 120 million people and $1.2 trillion in international
tourism receipts. Furthermore, the OECD's Secretary-General has also added that the world is
amid the most severe health, economic, and social crisis ever witnessed by anyone today
(Gurría, 2020). Therefore, the Thai and Asian tourism sectors are in dire straits, and solutions
must be found to help them limp back to economic health.
As an economic stop-gap until the restart of international tourism using some form of
'bubbles', 'bridging', or ‘safe-and-sealed’ programs (Chandran, 2020), domestic tourism has
become a solution frequently mentioned as a form of economic recovery. Furthermore, in
mainland China, a proposal has been made to triple each domestic tourist’s tax-free spending
allowance for luxury items purchased on the southern island resort province of Hainan (Song
et al., 2020), which in 2019 saw 83 million total visitors, of which, 1.42 million were foreign
tourists. Also in China, e-vouchers have been proposed to boost domestic tourism, which
allowed Trip.com users to book over 7,000 hotels and homestays at significant discounts.
Other Chinese campaigns such as Go Near and Go by Car are also domestic tourism schemes.
In Japan, destination revival will hopefully come from the central government footing the bill
under an initiative called Go-To Travel. Under this plan, subsidies of $185 per day for
domestic leisure trips will be provided. The Thai government, provinces, municipalities, and
hotels are also generating stimulus packages for domestic tourism. One program entitled
Thais visit Thailand pays Thais to go on domestic holidays, while others called We Travel
Together and Travelling and Sharing Happiness offer discount incentives, travel vouchers,
and government flight subsidies.
Fortunately, in hot and tropical Southeast Asian nations, cooler night markets play an
essential role in destination selection for locals and tourists in nearly every local community
and larger metropolitan areas. Some are world-renowned and have become the destination
target for both international and domestic travelers. Hsieh and Chang (2006) also added that
Taiwanese night markets are in the top three choices for leisure sight-seeing spots. Boudreau
(2012) has also added that Taiwanese night markets are cherished cultural phenomenon,
where fashionable shoppers also remain connected with earlier traditions. Seamon and Nordin
149NIGHT MARKET DESTINATION LOYALTY PJAEE, 18(3) (2021)
(1980) have even referred to these marketplaces as beautiful ‘place ballets,’ whose tempo and
repetition of activity, bustle, and calm, act as essential visitation destinations for visitors near
and far. Prabowo and Rahadi (2015) have also stated that traditional markets exhibit unique
human characteristics that create “family” relationships and intimacy between the
entrepreneurs and their customers.
Iqbal et al. (2017) and Ishak et al. (2012) have also detailed how these community night
market areas helped local economies and entrepreneurs recover from the 1997 recession in
both Thailand and Malaysia. Moreover, as recently as 1 June 2020, the PRC's Premier
Keqiang, in a visit to the port city of Shandong Province, declared the "street-stall economy"
as an "important source of jobs" and "part of China's vitality" (Nakazawa, 2020).
With tourist subsidies and travel stimuli all the rage now to reboot tourism, it now becomes
critical to understand what determinants influences a visitor's destination loyalty (DL) and
their desire to return. Let us now review some of the literature used in the selection of the
latent and manifest variables for the study.
2. REVIEW OF THE LITERATURE
2.1. Destination availability (DAv)
Another potential aspect of DL is the destination’s availability (DAv). Simply stated, if a
visitor cannot get there, how can the visitor be loyal to a destination? No better example of
this concept can be found during the ongoing shutdown of Thailand and the world's tourism,
aviation, and cruise industries during the coronavirus (Covid-19) turmoil starting globally in
January 2020.
Gallego and Font (2019) also reminded us of these factors and stated that tourist destinations
(DAv) are susceptible to the policies of commercial and governmental stakeholders. Proof of
this in Thailand is easy to find as 1,111 Thai tourism operators have turned in their licenses in
the period January through June 2020, with an additional 30% of tourism-related businesses
having exited the market according to the Tourism Council of Thailand (TCT) (Kasemsuk &
Worrachaddejchai, 2020). DAv has also played a role in the bankruptcy filing of Thailand’s
national aviation carrier Thai Airways, as when flights to many major international
destinations ceased on 24 March 2020, so did the approximately $6 billion in annual bookings
and related income. However, Thai Airways is not alone, as numerous regional and
international airlines have ceased operations, many permanently due to the global pandemic
lockdowns. Similarly, aviation consultancy CAPA has warned that the majority of the world's
airlines are heading for bankruptcy without a coordinated government and industry
intervention. Therefore, countries that concentrate on tourism and place a significant level of
importance on critical aviation hubs and airlines increase their strategic risks to DAv, threaten
a destination's competitiveness, or even their survivability (Bieger & Wittmer, 2006; Gallego
& Font, 2019). Therefore, the following two hypotheses were conceptualized for the study:
H1. DAv influences VS both directly and positively.
H2. DAv influences DAt both directly and positively.
150NIGHT MARKET DESTINATION LOYALTY PJAEE, 18(3) (2021)
2.2. Experiential value (EV)
The authors also sought to investigate how EV influences DL, which is defined as “a
perceived, relativistic preference for a product, attributes, or service performances arising
from interaction within a consumption setting that facilitates or blocks achievement of
customer goals or purposes” (Mathwick et al. (2002, p. 53). Camillo (2015) further added that
EV is the sensual and cognitive characteristics that can be experienced through consumption.
Experiential marketing (EM) has also been referred to as engagement marketing (Dhandhnia
& Tripathi, 2018). Smilansky (2009) relates EM to the profitable identification of a
consumer’s aspirations or needs, and the use of social media platforms to bring
product/service value to the target audience. Furthermore, Mathwick et al. (2002) also
indicated that shopping enjoyment, efficiency, and economic value are key elements in EV.
This is consistent with Lee and Overby (2004), which added playfulness and aesthetics as
dimensions of EV. Experiential marketing, therefore, emphasizes excitement, fun, and
entertainment (Fetchko et al., 2019).
Jin et al. (2013) examined the full-service restaurant business EV and determined that EV
perceptions are paramount in a customer’s perception of the quality in their relationship with
each establishment. Woodruff (1997) has also explained that customer perception in the
consumption process involved actual performance and attribute preferences of a service or
product, both during and after. Therefore, the following two hypotheses were conceptualized
for the study:
H3. EV influences VS both directly and positively.
H4. EV influences DI both directly and positively.
2.3. Destination image (DI)
Another potential source in DL is the destination's image (DI). A festival or market DI can
also bring significant numbers and spending to the local economy. An excellent example of a
DI's importance can be found in the 1.5 million-plus residents and visitors who attend the
yearly Cherry Blossom Festival around Washington, D. C.'s Tidal Basin area. In Thailand,
according to the World Atlas, Bangkok's Train Night Market at Ratchada (a.k.a. Talad Nud
Rod Fai) is ranked 10th in the world for popularity, with four zones of bars, shopping,
activities, and food stalls with delicious cuisine selections from Thailand and beyond (Kiprop,
2017). This is consistent with other Thai hospitality research in which Supanun and
Sornsaruht (2019) also determined the importance of the quality of service, a guest's trust, and
a guest's satisfaction on high-end hotel reputations. In Vietnam, Hung (2020) also reported on
the importance of local cuisine of a tourist’s destination intention and desire to return.
Research in Thailand has also suggested that DI and reputation play a critical role in a
traveler's decisions (Kerdpitak, 2019), with destinations needing to do their utmost to attract
and retain their guests to ensure their sustainability (Gursoy et al., 2014). Also, within the
tourism industry, festivals and cultural offering potentially offer a means of commercial
promotion and destination enhancement, with the success of festivals evaluated by the size of
their community’s financial contribution (Deng & Pierskalla, 2011; Do Valle et al., 2001;
Wooten & Norman, 2008). Therefore, the following two hypotheses were conceptualized for
the study:
H5. DI influences VS both directly and positively.
151NIGHT MARKET DESTINATION LOYALTY PJAEE, 18(3) (2021)
H6. DI influences DL both directly and positively.
2.4. Visitor satisfaction (VS)
Further investigation also suggested that VS plays a critical role in a visitor's DL.
According to Suhartanto et al. (2018), within a tourism context, VS is the perceived
discrepancy between a traveler’s expectations and their actual experiences, with VS coming
from a superior experience. Evidence for this comes from an investigation concerning VS on
DL by tourists arriving through Kuala Lumpur's International Airport (KLIA), in which
Mohamad and Ghani (2014) stated that VS greatly influences DL, which also enhances a
traveler’s willingness in spreading positive word-of-mouth (WoM) experiences with other
travelers. In another study on DL from the USA (Arkansas' Eureka Springs), Chi and Qu
(2008) discovered a strong correlation between total satisfaction and attribute satisfaction in
DL. Furthermore, Cui et al. (2019) examined China’s Panda ecotourism and reported that VS
played a critical role in the balance of nature and DL, and as the value for ecotourism
increased, so did visitor DL. Finally, Karyose et al. (2017) reported that VS is essential to a
customer’s loyalty. Therefore, the following two hypotheses were conceptualized for the
study:
H7. VS influences DAt both directly and positively.
H8. VS influences DL both directly and positively.
2.5. Destination attachment (DAt)
Various studies have also discussed the importance of destination attachment (DAt) on an
individual's willingness to visit again. Çevik (2020) investigated the importance of urban
parks and concluded that satisfaction played a significant role in DAt. It was also stated that
VS contributes significantly to the creation of an emotional bond with a destination. Likewise,
in Thailand, Hosany et al. (2017) determined the importance of emotions on DAt. Therefore,
the following final hypothesis was conceptualized for the study:
H9. DAt influences DL both directly and positively.
2.6. Destination loyalty (DL)
Destination loyalty (DL) has been the topic of numerous tourism, traveler, and visitor
research studies globally, which according to Cossío-Silva et al. (2019), define DL as revisit
intention and the intent to recommend. Multiple authors have also suggested that loyalty is a
superior predictor of behavior in the future, competitive advantage, marketplace success
(Gursoy et al., 2014, Sun et al., 2013), and achieving profitability (Yoo & Bai, 2013).
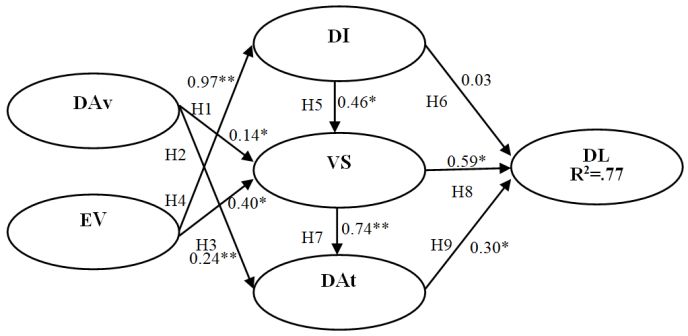
Therefore, from the literature and theory analysis, we established the following research
objectives while also finalizing the conceptual model and its nine proposed hypotheses
(Figure 1).
152NIGHT MARKET DESTINATION LOYALTY PJAEE, 18(3) (2021)
2.7. Model conceptualization
Figure 1. Conceptual model of destination loyalty (DL).
Note: *= p ≤ .05; ** = p ≤ .01.
3. METHODOLOGY
The Human Ethics Committee (HEC) at the authors’ university was consulted prior to the meeting
with experts concerning the questionnaire's design. With the approval from the HEC, an informed
consent form for each of the study’s pilot-survey group and main study’s respondents was also
obtained. Also, during each phase, participant anonymity was considered and ensured.
3.1. Sample size determination
The population selected for the research was night market visitors who visited one of ten Bangkok
night markets in January and February 2020 from 7PM – 10PM. Various scholars and studies have
suggested that a sample size of 200 is sufficient (Kyriazos, 2018; Schumacker & Lomax, 2016),
while a size of 400 assures even greater sampling accuracy (Pimdee, 2020) . Due to anticipated
response errors and a very tight schedule for questionnaire distribution and collection, an initial
target was set at 540 (Table 1).
3.2. Population and sample
Over the survey period, systematic sampling (Mohamad & Ghani, 2014) was used to select every
tenth visitor. Initially, 540 questionnaires were targeted, from which 425 questionnaires were
obtained and determined to be suitable for analysis of the data, representing a 78.70% completion
rate.
3.3. Research tools
The research instrument was a seven section questionnaire in which section 1 contained items
related to each night market visitor’s personal and visitation characteristics (Table 2). Section two -
seven consisted of a seven-level Likert type agreement scale to evaluate each visitor’s opinions, with
‘7’ (6.50 – 7.00) representing the ‘most agreement’, while ‘1’ (1.00 – 1.49) was the ‘least
agreement’. Additionally from the Cronbach α analysis (Tavakol & Dennick, 2011), good reliability
of the items in the questionnaire was determined (0.85 – 0.93) (Table 4).
153NIGHT MARKET DESTINATION LOYALTY PJAEE, 18(3) (2021)
3.4. Data collection
Table 1: Bangkok night market sampling overview.
Bangkok Area Destination Markets Targeted Actual
Ratchada’s Train Night Market 54 48
Liab Duan Night Market at Ram Inthra 54 46
Talad Rot Fai Srinakarin/ Train Market Srinakarin 54 45
Indy Market (Pinklao) 54 37
Chatuchak/JJ Weekend Market (Kamphaeng Phet 2 Road) 54 32
Tawanna Market (Soi 142 Lat Phrao Road) 54 45
Huay Kwang Night Market 54 43
Talad Neon Night Market (Downtown Pratunam) 54 41
Siam Gypsy Junction Night Market (Bang Sue District) 54 43
Khaosan Road or Khao San Road 54 45
Totals 540 425
3.5. Data analysis
LISREL 9.10 was used to conduct the study's final SEM path analysis (Figure 2), which was preceed
by the GOF (Table 3) and a CFA (Table 4).
4. EMPIRIAL RESULTS
4.1. Characteristics of the Bangkok night market visitor
Table 2 presents the responses from the questionnaires, which shows importantly that 97.18%
indicated they visited as groups. Additionally, males were more likely to visit these environments
(59.53%) than females (40.47%). Visitors were also youthful, as 41.65% were 24 – 30, and educated
with 47.05% having achieved an undergraduate degree or higher. Also, most were unattached
(56.24%). Finally, 47.29% of these night market consumers responded that they had visited the
surveyed market 4 - 6 times, while 38.59% responded they had visited over six times.
Table 2: Bangkok night market visitor characteristics (n =425).
Characteristics Frequency %
Gender
-Male 253 59.53
-Female 172 40.47
Age
-23 years of age or less. 124 29.18
-24-30 years of age. 177 41.65
-Over 30 years of age. 124 29.18
Highest education
- Lower than secondary education 88 20.71
- Secondary / Vocational / High Vocational / Diploma 137 32.24
- B.A. or B.Sc. degree 133 31.29
- Graduate studies 67 15.76
Relationship Information
- Single 239 56.24
- Married 136 32.00
- Other 50 11.77
Career
- Government agencies 7 1.65
- General employees 74 17.41
- Private business 68 16.00
- Professional / Private 109 25.65
- Other 167 39.29
Your average monthly income
149NIGHT MARKET DESTINATION LOYALTY PJAEE, 18(3) (2021)
Characteristics Frequency %
- Not more than 10,000 baht ($318 in August 2020) 87 20.47
- 10,001-15,000 baht 244 57.41
- More than 15,000 baht 94 22.12
Nature of traveling to the market
- Independently 12 2.82
- With a group 413 97.18
Market visit frequency
- one - three visits 60 14.12
- four - six visits 201 47.29
- More than six visits 164 38.59
4.2. Results from the GOF and CFA analysis
The CFA analyzed both the external and internal variables, which were determined by the
conceptual framework obtained from studying relevant documents and research. The criteria and
supporting theory for the GOF analysis are detailed in Table 3, which shows good support from the
theory.
Table 3: GOF analysis criteria and results.
Criteria Index Criteria Cited Experts Values
Chi-square: χ2 p ≥ 0.05 (Sahoo, 2019) 0.65
Relative Chi-square: χ2/df ≤ 2.00 (Sahoo, 2019) 0.94
RMSEA ≤ 0.05 (Hu & Bentler, 1999) 0.00
GFI ≥ 0.90 (Jöreskog et al., 2016) 0.97
AGFI ≥ 0.90 (Harlow, (2002) 0.95
RMR ≤ 0.05 (Hu & Bentler, 1999) 0.01
SRMR ≤ 0.05 (Hu & Bentler, 1999) 0.01
NFI ≥ 0.90 (Schumacker & Lomax, 2016) 0.99
CFI ≥ 0.90 (Schumacker & Lomax, 2016) 1.00
Cronbach’s α ≥ 0.70 (Tavakol & Dennick, 2011) 0.85-0.93
Table 4 shows the LISREL 9.1 analysis results of the study's internal latent and manifest variables
(DAv and EV) and external latent and manifest variables (DL, DI, VS, and DAt) and their manifest
variables. Furthermore, each item's Alpha (), average variance extracted (AVE),
composite/construct reliability (CR), loading, and R2 value results are shown in Table 4.
Additionally, Netemeyer et al. (2003) have suggested that CFA reliability and internal consistency
testing for CR should be ≥ 0.80. As CR values were 0.85 - 0.92, this high criterion was met.
Furthermore, Mustofa and Mulyono (2020) have also stated that loading factors should be ≥ 0.6,
with AVE ≥ 0.5 for the variables to be reliable and valid. As such, both these criteria were met from
the CFA.
Table 4: CFA data analysis results.
Latent R2
Variables AVE CR Manifest/Observed Variable Factor Loading
DAv 0.93 0.81 0.92 Completely availability (x1) 0.90 .81
(external) Variety (x2) 0.89 .80
Ability to service (x3) 0.91 .82
EV 0.93 0.72 0.91 Environment (x4) 0.97 .94
(external) Enjoyment (x5) 0.83 .69
Good value for money (x6) 0.78 .60
Uniqueness (x7) 0.81 .65
DL 0.92 0.72 0.91 Destination loyalty (y1) 0.93 .87
(internal) Positive things (y2) 0.90 .82
Recommend to others (y3) 0.77 .59
150NIGHT MARKET DESTINATION LOYALTY PJAEE, 18(3) (2021)
Revisit intention (y4) 0.80 .64
DI 0.88 0.77 0.90 Tangibility (y5) 0.94 .88
(internal) Service quality (y6) 0.84 .70
Price (y7) 0.85 .72
VS 0.85 0.66 0.85 Contentment/enjoyment (y8) 0.84 .69
(internal) Suitable (y9) 0.81 .65
Satisfied (y10) 0.80 .63
DAt 0.93 0.79 0.92 Personal values (y11) 0.95 .90
(internal) Enjoyment (y12) 0.85 .72
Good memories (y13) 0.87 .76
4.3. Results from the latent variable correlation coefficient testing
The analysis results of r for each variable pair are shown in Table 5 below the bold diagonal
numbers of 1.00. From these results, we find significant strength between the pairs DI and VS (.96),
DI and EV (.96), and VS and EV (.96). However, the weakest correlation was between DL and DA
(.82).
Table 5: Latent variable r (Under the bold diagonal).
Latent Variable DL DI VS DAt DA EV
DL 1.00
DI .87** 1.00
VS .90** .96** 1.00
DAt .88** .92** .95** 1.00
DA .82** .87** .89** .90** 1.00
EV .87** .96** .96** .93** .90** 1.00
Note: *= p ≤ .05; ** = p ≤ .01.
4.4. Effect decomposition analysis
From the results shown in Table 6, VS is shown to have a significant role in a visitor’s DL as VS’s
TE = 0.81. Next in importance was EV as TE = 0.71, and then DI with a TE = 0.40. These results
also confirm the critical importance of VS on DL.
Table 6: Effect decomposition analysis.
Dependent Independent variables
R2 Effect
variables DAv EV DI VS DAt
direct effect 0.97**
DI .93 indirect effect -
total effect 0.97**
direct effect 0.14* 0.40* 0.46*
VS .93 indirect effect - 0.44* -
total effect 0.14* 0.84** 0.46*
direct effect 0.24** - - 0.74**
DAt .89 indirect effect 0.10 0.62** 0.34* -
total effect 0.34** 0.62** 0.34* 0.74**
direct effect - - 0.03 0.59* 0.30*
DL .77 indirect effect 0.18** 0.71** 0.37* 0.22* -
total effect 0.18** 0.71** 0.40* 0.81** 0.30*
Note: *= p ≤ .05; ** = p ≤ .01.
4.5. Final hypotheses testing results
The hypotheses testing results are shown in Table 7 as well as Figure 2. Of the nine conceptualized
hypotheses, eight were validated while one was found to be unsupported. The Pearson's r correlation
coefficient interpretation has commonly used 0.1 – 0.3 as showing weakness, 0.4 to 0.6 as
representing moderate strength, and 0.7 to 0.9 as indicaton of the variable relationship strength
151NIGHT MARKET DESTINATION LOYALTY PJAEE, 18(3) (2021)
(Akoglu, 2018). Finally, ‘1’ is considered perfect. Hair et al. (2009) also added that construct
validity could be judged acceptable when t-values ≥ 1.96, with Sharma (1996) adding that when
standardized factor loading ≥ 0.60, further validity can be ascertained.
Table 7: Final hypotheses testing.
Hypotheses r t-Statistic Validation
H1. DAv influences VS both directly and positively. 0.14 2.15* Valid
H2. DAv influences DAt both directly and positively. 0.24 4.35** Valid
H3. EV influences VS both directly and positively. 0.40 2.22* Valid
H4. EV influences DI both directly and positively. 0.97 24.66** Valid
H5. DI influences VS both directly and positively. 0.46 2.89* Valid
H6. DI influences DL both directly and positively. 0.03 0.19 Unsupported
H7. VS influences DAt both directly and positively. 0.74 11.87** Valid
H8. VS influences DL both directly and positively. 0.59 2.52* Valid
H9. DAt influences DL both directly and positively. 0.30 2.12* Valid
Note: *= p ≤ .05; ** = p ≤ .01
Figure 2. Final results of the structural modeling for DL.
Note: *= p ≤ .05; ** = p ≤ .01.
5. DISCUSSION
From the r correlation coefficient strength interpretation and further analysis of other studies, we
interpreted the study's results in the following manner:
In the examination of H1’s results between DAv and VS, a determination was made that a weak but
positive relationship existed (0.14). This is consistent with Suhartanto et al. (2018), which stated that
VS is a complex construct, which includes cognitive, affective, psychological, and physiological
dynamics. In the relationship between DAv and DAt in H2, the relationship was slightly stronger
(0.24), but still weak and positive.
However, the strength between EV and VS in H3 gained strength and was moderate and positive
(0.40). Moreover, in H4, the strongest relationship between the variables was determined, as EV to
DI had a r = 0.97. This is consistent with Ekinci et al. (2008), which found that a visitor’s trust is
directly linked to the destination's personality, which also contributes to their VS. The study also
identified the constructs excitement, conviviality, and sincerity as key aspects. Mehta (2014) also
contended that public spaces are important for the public's well-being and the psychological health
of modern communities. Vishnevskaya et al. (2019) have also added that tourist spaces in the form
of night markets are especially attractive for travelers which are ceaselessly seeking out cultural
heritage experiences. Hendijani (2016) also added that Indonesian markets afford tourists the
opportunity to understand the local culture and ethnic community identity.
152NIGHT MARKET DESTINATION LOYALTY PJAEE, 18(3) (2021)
Concerning a destination’s image (DI), the relationship in H5 between DI and VS was positive and
moderate (0.46). This is consistent with Tarulevicz (2018) whose research on Singaporean street
food hawkers described them in terms of being romanticized icons, essential to a nation’s identity.
Today, the Singapore government has re-focused on the hawker entrepreneur (hawkerpreneur), with
many viewing them as successful entrepreneurs whose image has been enhanced by structural
changes (e.g. Michelin rankings) which represent a new beginning for Singaporean street food.
However, the relationship in H6 between DI and DL was determined to be unsupported as the r =
0.03, with a t-test value of only 0.19.
Another hypothesis that also had a strong and positive relationship was H7, where the relationship
between VS and DAt had r = 0.74, a t-test value of 11.87, and p ≤ 0.01. This is consistent with
Quinn (2006) who examined art festivals in Ireland, and determined that these venues (in many ways
similar to Thai night markets) are socially significant events, inevitability leading to becoming a
draw for domestic visitors as well as international travelers. This is supported by Chou (2013),
whose research in Taiwan on night markets, indicated that DI significantly and positively affected
VS, which enhanced the visitor’s revisit intention and by extension, DL. Bayih and Singh (2020)
also added that tourism as a source of foreign currency generation in many developing countries.
Additionally, tourism preserves culture, protects the environment, and conveys togetherness and
peace, while enhancing economic growth and sustainable development.
However, in H8, the relationship between VS and DL was positive and moderate (0.59), which is
consistent with the analysis of hotels in Penang, Malaysia by Goh (2015) in which a visitor’s attitude
played a key role in their DL. This is consistent with Prayogo and Kusumawardhani (2016) which
also established the importance in Indonesia of a destination’s image, the staff’s service quality, and
social media of DL. Moreover, in H9, the relationship between DAt and DL was weak but positive,
with r = 0.30, a t-test value of 2.12, and p ≤ 0.05.
The study also confirmed that all the model's causal variables had a positive effect on DL, with DL’s
R2 calculated as 77% (Table 6). Moreover, five factors influenced DL, including VS, EV, DI, DA,
and DA, which had respective TE value strengths of 0.81, 0.71, 0.40, 0.30, and 0.18 (Table 6).
Finally, the results or data that support the conclusions shown directly or otherwise are available to
the public in accordance with field standards.
6. CONCLUSUON
The study investigated the interrelationships between DAv, the destination's EV, the DI, the effect
on VS, their DAt after their visit, and finally, how these factors play a role in tourist DL. From the
results of the questionnaire analysis, it was also noted the overwhelming importance of group visits
as opposed to individual visits. Moreover, each individual’s satisfaction played a key role in DL,
with EV of each visit also being essential. Specifically, EV aspect importance when ranked in
importance included the market's environment, overall enjoyment, the market's uniqueness, and
good value for the money. Finally, most night market visitors surveyed indicated an extremely high
DL, with 47.29% stating they had frequented the surveyed market 4 - 6 times, with an additional
38.59% stating they had visited the market over six times.
7. LIMITATIONS AND IMPLICATIONS
According to a May 2020 China Airbnb survey, 81% of the Chinese surveyed indicated that they
preferred destinations within 200 miles of their home. In another China survey by Kantar, 73%
indicated they would prefer to travel by car in the future, which helps avoid infection risks. In
153NIGHT MARKET DESTINATION LOYALTY PJAEE, 18(3) (2021)
Thailand, over 1,100 travel agencies have returned their licenses to the government and 30% of all
tourism establishments have shuttered their business permanently.
This data has staggering consequences to tourist economies such as Thailand, which are counting on
the return of tourism when mechanisms are put in place to allow this to happen. Simply stated, what
does Thailand do if the Chinese do not wish to return? What does Thailand offer to stimulate tourist
visits and DL? Japan is suggesting they will pay 50% of its international visitors' expense to Japan
when they re-open, but what will Thailand do as a regional competitor? How is the 'new normal'
conducive to a new and quickly growing generation of free and independent (FIT) international
Chinese and other foreign travelers? These are difficult questions that require honest answers for a
hospitality entrepreneur's survival and the tourism industry's sustainability.
Therefore, at the moment, domestic tourism seems to be the only real potential stimulus to an
industry on its deathbed. Additionally, one cannot ignore the health of the aviation industry, because
tourism and aviation are joined at the hip. Reports from all directions of the compass, however,
suggest the aviation sector is staggering to survive. How this sector survives is also a topic of critical
importance.
Moreover, Thailand policymakers are daily making pronouncements about the 'new normal,' which
includes individual real-time tracking, bio-metric identification processes, 'sealed destination
holidays' in remote and controlled access areas for foreign tourists (no stops in between), fit-to-fly
medical certificates, and $100,000 of medical insurance to cover any Covid-19 related illness. One
has to ask, however, is this 'new normal' motivational factors to an international traveler's relaxation
and sensual enjoyment? Are these factors that FIT visitors will accept?
The world is a vast place, and tourism is a brutally competitive industry. For many years Thailand
has made many brilliant moves to facilitate tourism with policies such as visa-free travel, but other
countries have grabbed onto this concept as well. Also, the strength of the Thai currency has been
proven to be another limiting factor for selecting a Thai holiday by some nationalities. This has not
changed in the first three quarters of 2020, with the Thai baht only increasing in strength. With
social distancing coming under the 'new normal,' one has to ask, how it will affect ticket pricing for
airlines that are only allowed to operate at 70% capacity or less? At what point do higher prices,
regulatory processes, social control, and social distancing overcome a traveler’s (either foreign or
domestic) desire to visit or return to a destination? Therefore, these questions require in-depth
research as the answers can have either catastrophic or competitive advantage results to a
destination, whether it is a Bangkok night market, a local resort, or the nation's economy.
References
Akoglu, H. (2018). User's guide to correlation coefficients. Turkish Journal of Emergency Medicine,
18(3), 91 – 93. https://doi.org/10.1016/j.tjem.2018.08.001
Bayih, B. E., & Singh, A. (2020). Modeling domestic tourism: motivations, satisfaction and
tourist behavioral intentions. Heliyon, 5, e04839.
https://doi.org/10.1016/j.heliyon.2020.e04839
Bieger, T., & Wittmer, A. (2006). Air transport and tourism—Perspectives and challenges for
destinations, airlines and governments. Journal of Air Transport Management, 12(1), 40 –
46. https://doi.org/10.1016/j.jairtraman.2005.09.007
Boudreau, J. (2012, October 9). Taiwan’s fabled night markets. Mercury News.
https://tinyurl.com/t4k6g8b
Camillo, A. A. (2015). Handbook of research on global hospitality and tourism management. IGI
Global.
CEIC. (2019, December). Thailand tourism revenue. https://tinyurl.com/y8oqozry
Çevik, H. (2020). The relationship between park satisfaction, place attachment and revisit intention
154NIGHT MARKET DESTINATION LOYALTY PJAEE, 18(3) (2021)
in neighborhood parks with physical activity facilities. Journal of Education and Learning,
9(2), 178 – 190. https://doi.org/10.5539/jel.v9n2p178
Chandran, R. (2020). The world's most popular tourist cities may have to rethink their entire model.
World Economic Forum. https://tinyurl.com/y2t2mb77
Chi, C. G-Q., & Qu, H. (2008). Examining the structural relationships of destination image, tourist
satisfaction and destination loyalty: An integrated approach. Tourism Management, 29(4),
624 – 636. https://doi.org/10.1016/j.tourman.2007.06.007
Chou, H-J. (2013). The effect of the visitor’s consumption experience and tourism image on tourist
satisfaction and revisit intention of Taiwan’s night markets. GSTF Journal on Business
Review, 3(1). https://doi.org/10.7603/s40706-013-0006-2
Cossío-Silva, F-J., Revilla-Camacho, N-A., & Vega-Vázquez, M. (2019). The tourist loyalty index:
A new indicator for measuring tourist destination loyalty? Journal of Innovation &
Knowledge, 4(2), 71 – 77. https://doi.org/10.1016/j.jik.2017.10.003
Cui, X., Lee, G., Lee, S.J., & Kim, T.T. (2019). Structural relationships among antecedents to
perceived value of ecotourism for Sichuan giant pandas in China. Sustainability, 11(1), 1 –
17. https://doi.org/10.3390/su11010210
Deng, J., & Pierskalla, C. (2011). Impact of past experience on perceived value, overall satisfaction,
and destination loyalty: A comparison between visitor and resident attendees of a festival.
Event Management, 15(2), 163 – 177. https://doi.org/10.3727/152599511x13082349958235
Dhandhnia, K. A., & Tripathi, S. (2018). Emotional branding through celebrity endorsements. In
Driving customer appeal through the use of emotional branding (pp. 273 – 287). IGI Global.
https://doi.org/10.4018/978-1-5225-2921-7.ch016
Do Valle, P. O., Guerreiro, M., Mendes, J., & Silva, J. A. (2001). The cultural offer as a tourist
product in coastal destinations: The case of Algarve, Portugal. Tourism and Hospitality
Research, 11, 233–247. https://doi.org/10.1177/1467358411420623
"Drastic" losses to Thai tourism with 1.57 TRILLION baht hit, admits tourism minister. (2020,
October 23). Thai Rath. https://tinyurl.com/y5jqgw42
Ekinci, Y., Dawes, P. L., & Massey, G. (2008). An extended model of the antecedents and
consequences of consumer satisfaction for hospitality services. European Journal of
Marketing, 42(1/2), 35 – 68. https://doi.org/10.1108/03090560810840907
Fetchko, M. J., Roy, D. P., & Clow, K. E. (2019). Experiential Marketing. In Sports Marketing (pp.
181 – 211). Routledge. https://doi.org/10.4324/9781315175614-7
Gallego, I., & Font, X. (2019). Measuring the vulnerability of tourist destinations to the
availability of air transport, using multi-criteria composite indexes. Journal of Destination
Marketing & Management, 14, 100382. https://doi.org/10.1016/j.jdmm.2019.100382
Goh, Y-N. (2015). Investigating revisit intentions for the boutique hotels of Penang-A UNESCO
World Heritage Site. Asian Social Science, 11(4), 126 – 134.
http://doi.org/10.5539/ass.v11n4p126
Gurría, A. (2020, June 10). Release of the June 2020 Economic Outlook: Revamping the
international policy architecture to emerge from the pandemic stronger together.
https://tinyurl.com/y4qv5qz2
Gursoy, D., Chen, J. S., & Chi C. G. (2014). Theoretical examination of destination loyalty
formation. International Journal of Contemporary Hospitality Management, 26(5), 809 –
827. https://doi.org/10.1108/IJCHM-12-2013-0539
Hair, J. F., Black, W. C., Babin, B. J., & Anderson, R. E. (2009). Multivariate data analysis.
Prentice Hall.
Han, H., & Kim, Y. (2010). An investigation of green hotel customers’ decision formation:
Developing an extended model of the theory of planned behavior. International Journal of
Hospitality Management, 29(4), 659 – 668. https://doi.org/10.1016/j.ijhm.2010.01.001
Harlow, L. L. (2002). Book review of using multivariate statistics by Barbara G. Tabachnick and
Linda S. Fidell. Structural Equation Modeling: A Multidisciplinary Journal, 9(4), 621 – 636.
https://doi.org/10.1207/s15328007sem0904_9
155NIGHT MARKET DESTINATION LOYALTY PJAEE, 18(3) (2021)
Hendijani, R. B. (2016). Effect of food experience on tourist satisfaction: The case of Indonesia.
International Journal of Culture, Tourism, and Hospitality Research, 10(3), 272 – 282.
https://doi.org/10.1108/ijcthr-04-2015-0030
Hsieh, A-T., & Chang, J. (2006). Shopping and tourist night markets in Taiwan. Tourism
Management, 27(1), 138 – 145. https://doi.org/10.1016/j.tourman.2004.06.017
Hosany, S., Prayag, G., Van Der Veen, R., Huang, S., & Deesilatham, S. (2017). Mediating effects
of place attachment and satisfaction on the relationship between tourists’ emotions and
intention to recommend. Journal of Travel Research, 56(8), 1079 – 1093.
https://doi.org/10.1177/0047287516678088
Hu, L. T., & Bentler, P. M. (1999). Cutoff criteria for fit indexes in covariance structure analysis:
Conventional criteria versus new alternatives. Structural Equation Modeling, 6(1), 1 – 55.
https://tinyurl.com/y5damgpu
Hung, N. T. V. (2020). Assessment of the potential of humanistic tourism resources for community-
based tourism development in the coastal area: The case in Vietnam. PalArch’s Journal of
Archaeology of Egypt/Egyptology, 17(4), 3124 – 3138. https://tinyurl.com/y98s6hkc
Iqbal, M., Karsono, B., Atthaillah, N., & Lisa, N. P. (2017). Night market contribution to
sustainability of urban spaces. Pertanika Journal of Social Sciences and Humanities, 25(S),
131 – 138. https://tinyurl.com/yxwfrhrq
Ishak, N. K., Aziz. K. A., & Ahmad, A. (2012). Dynamism of a night market. Journal of Case
Research in Business and Economics, 4(July), 1 – 15. https://tinyurl.com/vl7w52s
Jin, N., Line, N. D., & Goh, B. (2013). Experiential value, relationship quality, and customer loyalty
in full-service restaurants: The moderating role of gender. Journal of Hospitality Marketing
& Management, 22(7), 679 – 700. https://doi.org/10.1080/19368623.2013.723799
Jöreskog, K. G., Olsson, U. H., & Fan, Y. W. (2016). Multivariate analysis with LISREL. Springer.
Karyose, H., Astuti, W., & Ferdiansjah, A. (2017). Customer loyalty: The effect of service quality,
corporate image, customer relationship marketing and customer satisfaction as intervening
variable-An empirical analysis of bank customers in Malang City. Marketing and Branding
Research, 4(4), 336 – 347. https://doi.org/10.33844/mbr.2017.60334
Kasemsuk, N., & Worrachaddejchai, D. (2020, July 22). Tourism Council of Thailand warns of
operators fleeing sector. Bangkok Post. https://tinyurl.com/y62fxoan
Kiprop, J. (2017, October 20). 10 of the world's greatest night markets. World Atlas.
https://tinyurl.com/ycjyl77t
Kerdpitak, C. (2019). The influence of destination attributes on the MICE tourism industry in
Bangkok, Thailand. International Journal of Innovation, Creativity and Change, 10(1), 76 –
98. https://tinyurl.com/vq34b5e
Kyriazos, T. A. (2018). Applied psychometrics: Sample size and sample power considerations in
factor analysis (EFA, CFA) and SEM in general. Psychology, 9(8), 2207 – 2230.
https://doi.org/10.4236/psych.2018.98126
Lee, E. J., & Overby, J. W. (2004). Creating value for online shoppers: Implications for satisfaction
and loyalty. Journal of Consumer Satisfaction, Dissatisfaction and Complaining Behavior,
17, 54 – 67. https://tinyurl.com/qlzx5g8
Mathwick, C., Malhotra, N. K., & Rigdon, E. (2001). Experiential value: Conceptualization,
measurement and application in the catalog and Internet shopping environment. Journal of
Retailing, 77(1), 39 – 56. https://doi.org/10.1016/s0022-4359(00)00045-2
Mathwick, C., Malhotra, N. K., & Rigdon, E. (2002). The effect of dynamic retail experiences on
experiential perceptions of value: An internet and catalog comparison. Journal of Retailing,
78(1), 51 – 60. https://doi.org/10.1016/s0022-4359(01)00066-5
Mehta, V. (2014). Evaluating Public Space. Journal of Urban Design, 19(1), 53 – 88.
https://doi.org/10.1080/13574809.2013.854698
Mohamad, M., & Ghani, N. I. A. (2014). The impact of tourist satisfaction on destination loyalty
among European tourists visiting Malaysia. International Journal of Management Sciences,
2(8), 362 – 371. https://tinyurl.com/vhw289r
156NIGHT MARKET DESTINATION LOYALTY PJAEE, 18(3) (2021)
Mustofa, M. S., & Mulyono, K. B. (2020). Superior business innovation capability: Antecedent and
its impacts on small business in Indonesia. Humanities & Social Sciences Reviews, 8(4), 147
– 157. https://doi.org/10.18510/hssr.2020.8416
Nakazawa, K. (2020, June 11). China’s street stall debate puts Xi and Li at odds. Nikkei Asian
Review. https://tinyurl.com/y7u8urec
Netemeyer, R. G., Bearden, W. O., & Sharma, S. (2003). Scaling Procedures: Issues and
Applications. Sage Publications.
Pimdee, P. (2020). Antecedents of Thai student teacher sustainable consumption behavior.
Heliyon, 6(8), e04676. https://doi.org/10.1016/j.heliyon.2020.e04676
Pinchuck, J. (2020, May 5). How Covid-19 will change the Thailand tourism sector. Thailand
Business News. https://tinyurl.com/ybmpclv6
Prabowo, F. S. A., & Rahadi, R. A. (2015). David vs. Goliath: Uncovering the future of traditional
markets in Indonesia. Mediterranean Journal of Social Sciences, 6(5), 28 – 36.
https://doi.org/10.5901/mjss.2015.v6n5p28
Prayogo, R. R., & Kusumawardhani, A. (2016). Examining relationships of destination image,
service quality, e-WOM, and revisit intention to Sabang Island, Indonesia. Asia Pacific
Management and Business Application, 5(2), 85 – 96.
https://doi.org/10.21776/ub.apmba.2016.005.02.3
Quinn, B. (2006). Problematising ‘festival tourism’: Arts festivals and sustainable development in
Ireland. Journal of Sustainable Tourism, 14(3), 288 – 306.
https://doi.org/10.1080/09669580608669060
Schumacker, R. E., & Lomax, R. G. (2016). A beginner’s guide to structural equation modeling.
(4th ed.). Routledge.
Sahoo, M. (2019). Structural Equation Modeling: Threshold Criteria for Assessing Model Fit. In R.
N. Subudhi & S. Mishra (Eds.), Methodological issues in management research: Advances,
challenges, and the way ahead (pp. 269-276.). Emerald Publishing Limited.
https://doi.org/10.1108/978-1-78973-973-220191016
Seamon, D., & Nordín, C. (1980). Marketplace as place ballet: A Swedish example. Landscape, 24,
35 – 41. https://tinyurl.com/y8ujqng6
Sharma, S. (1996). Applied multivariate techniques. John Wiley and Sons, Inc.
Smilansky, S. (2009). Experiential marketing: A practical guide to interactive brand experiences.
Kogan Page Publishers Publishers.
Song, H., Chen, J. M., & Chen, Y. (2020). Mediating and moderating effects in golf tourism:
Evidence from Hainan Island. Tourism Economics, 1354816620902331.
https://doi.org/10.1177/1354816620902331
Suhartanto, D., Clemes, M. D., & Wibisono, N. (2018). How experiences with cultural attractions
affect destination image and destination loyalty. Tourism Culture & Communication, 18(3),
176 – 188. https://doi.org/10.3727/109830418x15319363084463
Supanun, K., & Sornsaruht, P. (2019). How service quality, guest trust, and guest satisfaction affect
a five-star hotel's reputation in Thailand. African Journal of Hospitality, Tourism and
Leisure, 8(5), 1 – 14. https://tinyurl.com/y5qvtnyz
Sun, X., Chi, C. G-Q., & Xu, H. (2013). Developing destination loyalty: The case of Hainan Island.
Annals of Tourism Research, 43, 547 – 577. https://doi.org/10.1016/j.annals.2013.04.006
Tarulevicz, N. (2018). Hawkerpreneurs: Hawkers, entrepreneurship, and reinventing street food in
Singapore. Revista de Administração de Empresas, 58(3), 291 – 302.
https://doi.org/10.1590/s0034-759020180309
Tavakol, M., & Dennick, R. (2011). Making sense of Cronbach’s alpha. International Journal of
Medical Education, 2, 53–55. https://doi.org/10.5116/ijme.4dfb.8dfd
UNWTO. (2020, May). Impact assessment of the COVID-19 outbreak on international tourism. The
World Tourism Organization. https://tinyurl.com/vbhq36x
Vishnevskaya, E. V., Klimova, T. B., Koroleva, I. S., Slinkova, O. K., & Yasenok, S. N. (2019). The
157NIGHT MARKET DESTINATION LOYALTY PJAEE, 18(3) (2021)
infrastructure of public catering in the context of tourist city space development. Humanities
& Social Sciences Reviews, 7(5), 975 – 981. https://doi.org/10.18510/hssr.2019.75128
Woodruff, R. B. (1997). Customer value: The next source for competitive advantage. Journal of the
Academy of Marketing Science, 25(2), 139 – 153. https://doi.org/10.1007/bf02894350
Wooten, M. H., & Norman, W. C. (2008). Differences in arts festival visitors based on level of past
experience. Event Management, 11(3), 109 – 120.
https://doi.org/10.3727/152599508784548820
World Bank (2020). Thailand Economic Monitor: Thailand in the time of COVID-19. Washington,
D.C.: World Bank Group. https://tinyurl.com/yy32pg4t
WTTC. (2020, April 24). WTTC now estimates over 100 million jobs losses in the Travel &
Tourism sector – and alerts G20 countries to the scale of the crisis. World Travel & Tourism
Council. https://tinyurl.com/y8jppp6k
Yoo, M., & Bai, B. (2013). Customer loyalty marketing research: A comparative approach between
hospitality and business journals. International Journal of Hospitality Management, 33, 166
– 177. https://doi.org/10.1016/j.ijhm.2012.07.009
158You can also read