Natural processes dominate the pollution levels during COVID 19 lockdown over India
←
→
Page content transcription
If your browser does not render page correctly, please read the page content below
www.nature.com/scientificreports
OPEN Natural processes dominate
the pollution levels
during COVID‑19 lockdown
over India
Venkat Ratnam Madineni1, Hari Prasad Dasari2, Ramakrishna Karumuri2,
Yesubabu Viswanadhapalli1, Prasad Perumal1 & Ibrahim Hoteit2*
The lockdown measures that were taken to combat the COVID-19 pandemic minimized anthropogenic
activities and created natural laboratory conditions for studying air quality. Both observations and
WRF-Chem simulations show a 20–50% reduction (compared to pre-lockdown and same period of
previous year) in the concentrations of most aerosols and trace gases over Northwest India, the Indo
Gangetic Plain (IGP), and the Northeast Indian regions. It is shown that this was mainly due to a
70–80% increase in the height of the boundary layer and the low emissions during lockdown. However,
a 60–70% increase in the pollutants levels was observed over Central and South India including the
Arabian sea and Bay of Bengal during this period, which is attributed to natural processes. Elevated
(dust) aerosol layers are transported from the Middle East and Africa via long-range transport, and a
decrease in the wind speed (20–40%) caused these aerosols to stagnate, enhancing the aerosol levels
over Central and Southern India. A 40–60% increase in relative humidity further amplified aerosol
concentrations. The results of this study suggest that besides emissions, natural processes including
background meteorology and dynamics, play a crucial role in the pollution concentrations over the
Indian sub-continent.
The declaration that SARS-CoV-2 (COVID-19) had reached pandemic proportions by the World Health Organi-
zation (WHO) in early 2020 led to a global standstill in which several countries enforced a complete or partial
lockdown of businesses and movement1. As of March 2021, approximately 124 million COVID-19 positive cases
have been reported globally, 11 millions of which were in India, the country with the second highest popula-
tion in the world. Although the virus was discovered before the end of 2019, COVID-19 was labelled as severe
over the first few months of 2020, across the world. As no medicines have yet been approved for the treatment
of COVID-19 and the global percentage of vaccinated people are low, governments remains continue to imple-
ment containment measures (social distancing) to minimize the spread of the virus. Different countries have
followed different approaches in terms of lockdown measures, including complete lockdowns, the closure of
non-essential services, or shutting specific businesses. As a result, significant improvements in the Air Quality
Index (AQI) have been reported over several countries around the globe2, including Brazil3, China4–9, Ecuador10,
South Korea11, western E urope11, Iran12,13, India14,15, Malaysia16, Spain17, and the U
SA11,18. A reduction of 17% in
global CO2 compared to 2019 levels was reported by Le Quéré et al. , although Safarian et al.20 reported only a 7%
19
reduction. An increase in O 3 levels because of the reduction in N Ox concentrations has also been observed across
several countries5,6,12,16,21,22, but 10% reduction was estimated over rural location. Very few studies [e.g.,23,24] have
reported an increase in the concentration of pollutants as a result of prevailing atmospheric conditions, although
several studies25–30 have stressed the role of meteorological parameters (mostly temperature and humidity) on
outbreaks of COVID-19.
The first positive case of COVID-19 in India was reported in the state of Kerala on January 30, 2020, which
was followed by several cases throughout F ebruary31 and a gradual increase in the number of cases during
March. The peak that occurred around the third week of March forced the government of India to implement
containment measures. This started with a (Bharat/Janatha) curfew on March 22, 2020 followed by a complete
lockdown that was carried out over four phases. Public gatherings were banned, shopping malls, cinema halls,
1
National Atmospheric Research Laboratory, Gadanki, Andhra Pradesh, India. 2Physical Sciences and Engineering
Division, King Abdullah University of Science and Technology, Thuwal, Saudi Arabia. *email: ibrahim.hoteit@
kaust.edu.sa
Scientific Reports | (2021) 11:15110 | https://doi.org/10.1038/s41598-021-94373-4 1
Vol.:(0123456789)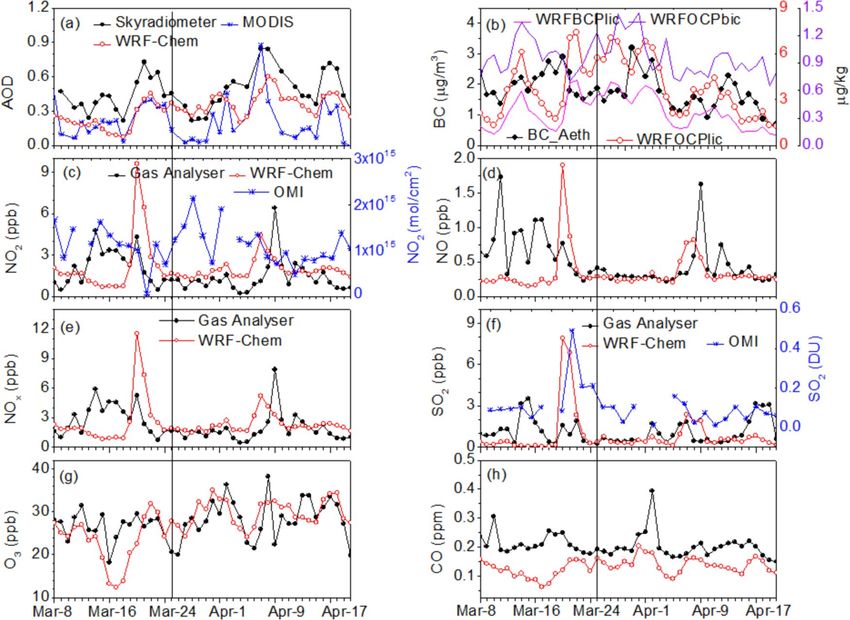
www.nature.com/scientificreports/
and prayer halls were closed, and wedding celebrations were prohibited, with many more restrictions put into
place. A strict countrywide first-phase lockdown (lockdown-1) was implemented for 21 days from March 25 to
April 14, 2020, which included suspension of all business activities as well as industries, transport (air, water,
and road), markets, shops, tourism, construction, and hotels, while retaining essential services. The lockdown
was extended until May 03, 2020 (lockdown-2), after which some restrictions on industrial and construction
activities were relaxed. The lockdown was then extended until May 17 (lockdown-3), and again until May 31,
2020 (lockdown-4), after which the restrictions on most of the activities were relaxed, except for public trans-
portation and mass gatherings.
National Aeronautics and Space Administration (NASA) satellite images (https://earthsky.org/earth/satel
lite-images-air-pollution-india-covid19) showed significant improvements in the air quality over India and the
surrounding regions during the first lockdown. The restrictive measures taken by the government of India to
minimize the spread of COVID-19 improved the air quality standards as a result of the significant reduction in
anthropogenic activities. Nitrogen oxides, also known as NOx, are primary sources of pollutants generated by
vehicles and industry6. Other gaseous pollutants such as carbon monoxide (CO), sulfur dioxide (SO2), methane
(CH4), tropospheric ozone ( O3), PM2.5, and P M10 are all emitted by anthropogenic activities (power plants, oil
refineries, vehicular traffic, mining, etc.). Sharma et al.32 compared the concentration of pollutants over 22 Indian
cities during the lockdown periods to those during the same period in previous years (2017 to 2019) and reported
significant reductions of 43%, 31%, 10%, and 18% in P M2.5, PM10, CO, and N
O2 concentrations, respectively. The
study also reported almost negligible changes in S O2, but an unexpected increase (of 17%) in O 3 concentrations
during the lockdown. A similar analysis performed by Jain and S harma15, in which the concentration of pollutants
in five Indian megacities during the period March–April 2020 were compared with those during the same period
in 2019, reported significant reductions in the concentrations of PM2.5, PM10, NO2, and CO. An AQI assessment
over New D elhi33 also indicated a significant reduction in pollution, such as a 50% reduction in coarse and fine
particulate matter ( PM10 and PM2.5), a 52% reduction in N O2, and a 30% increase in CO concentrations. All
these studies suggested however a clear increase in O 3 during the lockdown, which was attributed to changes in
the amount of N Ox and volatile organic compounds in the atmosphere. This is because O 3 is formed in the lower
atmosphere via the reaction of N Ox with volatile organic compounds in the presence of s unlight34,35. An increase
in O3 was also reported in Rome, Turin, and Wuhan during lockdown, by 14%, 27%, and 36%, r espectively35.
All the studies referred to above are limited to point measurements and the spatial distribution of few param-
eters (Aerosol Optical Depth, NO2, and SO2) obtained from satellite observations. Singh et al.36 reported about
30–70% reduction in NO2, 40–60% in PM2.5 and PM10 and 20–40% in CO, subject to large spatial variations,
after analyzing data from 134 Central Pollution Control Board (CPCB) stations. However, no attempt has yet
been made to understand the underlying physical mechanisms that contribute to the changes in the AQI during
lockdown. In this study, a state-of-the-art advanced Weather Research Forecasting (WRF) model coupled with
a Chemistry module (WRF-Chem) was used along with satellite observations to investigate the possible physical
mechanisms that contributed to the changes in pollution levels over the Indian sub-continent during lockdown.
Materials and methods
WRF-Chem version 3.9.137 was implemented to simulate the meteorological and atmospheric chemistry condi-
tions over the Indian Sub-continent. Several studies38–43 have demonstrated the ability of WRF-Chem to capture
the spatio-temporal distribution of aerosols, air quality at the regional scale, and cloud-chemistry interactions
by resolving the interactions between aerosols, trace gas reactions, emissions, mixing, transport, deposition,
chemical transformations, and photolysis.
In this study, we implemented the WRF-Chem37 with 90 vertical levels and a horizontal resolution of 30 km
covering both Asia and the regions around the Indian Ocean (Fig. S1). The model initial and boundary condi-
tions were extracted from the Final reanalysis (FNL) data, which are available at a 1° × 1° spatial resolution. The
time-varying low boundary conditions of sea surface temperature are taken from the NCEP real-time global
high-resolution data. The model was integrated from 00:00 UTC on February 20 until 00:00 UTC on May 01,
2020. The first 15 day of the simulation were treated as spin-up and thus excluded from the analysis. The remain-
ing period over the different phases of lockdown in India was used for the analysis.
We used the EDGAR-HTAP V2.2 anthropogenic emission data in the WRF-Chem simulations during the
pre-lockdown period. This emission datasets were generated in 2010 by collecting local information from regional
inventories to produce a global inventory of emissions. The resulting emissions are mapped on the model grid
using scaling factors suggested for India by Venkataraman et al.44 to describe the updated emissions scenarios
during the pre-lockdown period. We have further conducted sensitivity experiments with WRF-Chem to esti-
mate the percentage reduction in emissions from different emission sectors over India. The scaling factor was
selected after conducting several experiments in which we changed the percentage of reductions in the emissions
(between 30 and 70%) based on the recent COVID-19 observational studies15,32,36,44,45. From these simulations,
we found that an overall emission reduction of 40% in the anthropogenic emission inventory is able to repro-
duce a realistic estimate of the observed concentrations during the COVID-19 lockdown. We thus utilized this
scaling factor of 40% reduction to represent the changes due to the impact of COVID-19 in the anthropogenic
emissions inventory. The chemical species included in the anthropogenic emissions consists of CO, S O2, NOx,
NH3, NMVOCs, Black Carbon (BC), organic carbon (OC), P M2.5 and PM10. Though the configured scaling fac-
tor used in this study may not represent the real scenarios of emissions during the COVID-19 lockdown, it still
provides a reasonable approximation of the overall reduction associated with the lockdown.
In WRF-Chem, since the emissions inventory acts as a mainly background, the supply of realistic initial
and boundary conditions of chemical fields is critical step in determining the accuracy of the modeling system.
In this study, we have supplied initial and boundary conditions obtained from the assimilated fields of Whole
Scientific Reports | (2021) 11:15110 | https://doi.org/10.1038/s41598-021-94373-4 2
Vol:.(1234567890)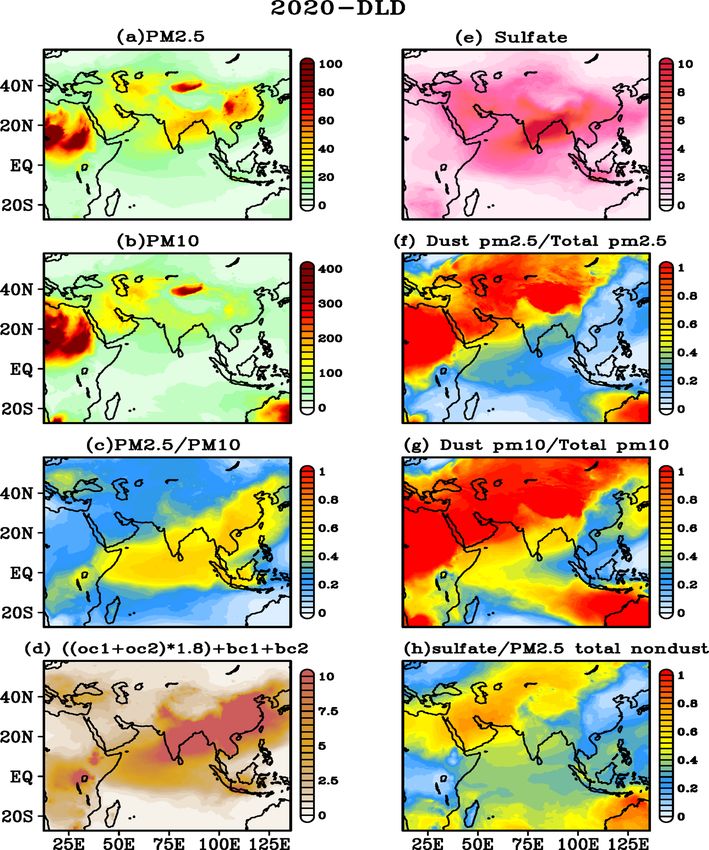
www.nature.com/scientificreports/
Atmosphere Community Climate Model (WACCM). This reanalysis product as one standard data used for the
initialization of WRF-Chem model as it assimilates all available observations of different chemical species using
improved assimilation a lgorithms46. The complete details of the experimental design, model physics, datasets,
and measurements used in this study are provided in the Supplementary Material.
A combination of satellite observations and WRF-Chem simulations were used to investigate the changes
in the aerosol and trace-gas distribution over India and the adjacent regions during lockdown, from March
8 to April 20, 2020, which includes the first phase of total lockdown that was implemented from March 25 to
April 14, 2020. To examine the effect of lockdown on trace gases and aerosols, we separated the total simulation
period (March 1 to May 1, 2020) into two sub-periods; pre-lockdown (hereafter referred to as PLD) (March 8
to 21, 2020) and lockdown (hereafter referred to as DLD) (March 25 to April 20, 2020). The percentage change
in aerosol and trace gas concentrations between PLD and DLD was estimated as:
DLD concentration − PLD concentration
Percentage change(%) = . (1)
PLD concentration
Similarly, the percentage change in aerosol and trace gas concentrations between 2020 and 2019 was esti-
mated as:
2020 concentration − 2019 concentration
Percentage change(%) = . (2)
2019 concentration
The focus of this study is to investigate the effects of lockdown on aerosol and trace gases over India, includ-
ing the Arabian sea and the Bay of Bengal (BoB). The aerosol and trace gas concentrations do not significantly
vary within the boundary layer. To remove the topographic/surface effects, we analyzed the mean concentrations
averaged between 1000 and 800 hPa as simulated by WRF-Chem. The study period falls within the pre-Indian
summer monsoon season, during which the well-mixed boundary layer often reaches 1.5–2 km47. Thus, the
integrated mean model values should not affect the observed major features. Furthermore, the prevailing weather
conditions play a dominant role in the variations observed in the detected emissions, which may exhibit vari-
ability on a seasonal to inter-annual scales. We have therefore provided a detailed analysis of the background
meteorological conditions over the study region in the Supplementary Material.
Results
Validation of WRF‑Chem outputs. The WRF-Chem outputs were first validated using calibrated
ground-based and space-borne measurements. The details of the ground-based measurements, their collective
protocols, and accuracy are included in Supplementary Material. Daily mean aerosol (AOD and Black Carbon)
and trace gas parameters (NO, NO2, NOx, SO2, O3, and CO) obtained for Gadanki (13.5°N, 79.2°E) from surface
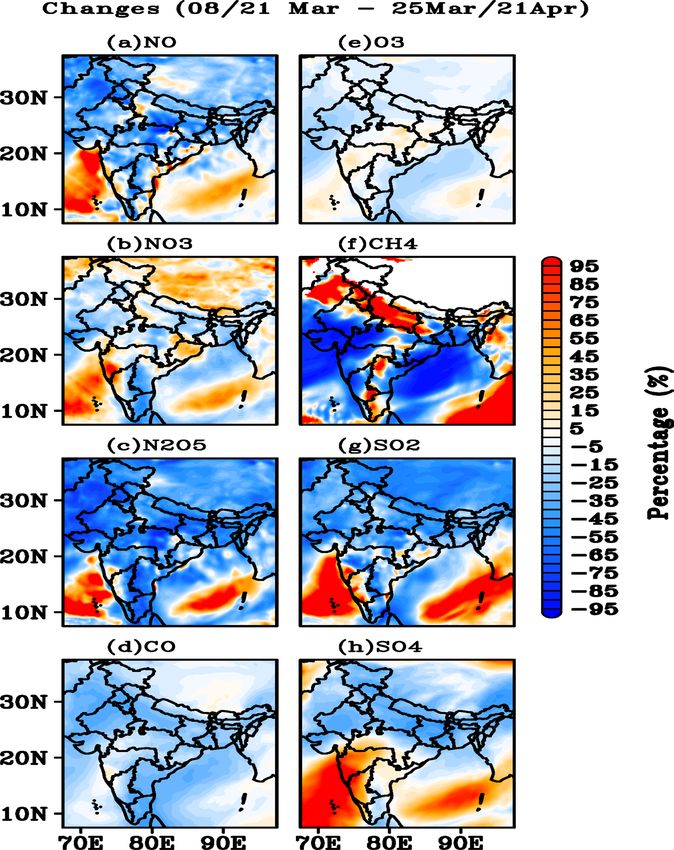
measurements and WRF-Chem show (Fig. 1) that the model is able to capture the day-to-day variations similar
to the ground-based surface observations. The simulated NO2, NO, NOx, and SO2 concentrations and the associ-
ated trends demonstrate very good agreement with the surface observations (Fig. 1c–f). However, although the
simulated O3 and CO reproduced the observed patterns, their concentrations were almost double and half those
of the ground-based observations, respectively (Fig. 1g,h). Small peaks in the surface measurements (except
O3 and CO) that occurred during March 14–20, 2020, were due to local emissions and were not reproduced by
WRF-Chem. A slight time lag is observed in the maximum values simulated by WRF-Chem, which may be due
to the relatively coarse model grid that does not fully resolve the mesoscale p rocesses48. The small differences
between the ground-based observations and WRF-Chem simulations can also be attributed to differences in
sampling size and local emissions.
The instantaneous measurements of AOD and N O2 (SO2) from Moderate Resolution Imaging Spectroradi-
ometer (MODIS) and Ozone Monitoring Instrument (OMI) at the closest point (78.5–80.5°E, 12.5–14.5°N) to
Gadanki (Fig. 1a,c,f) in the model grid indicates that the model is able to reproduce the observed variations,
albeit to a slight overestimation (underestimation) of the AOD compared to MODIS (Sky-radiometer). The
AOD reached as high as 0.6 during the PLD period, which was followed by a gradual decrease during the DLD
before reaching a minimum of 0.2. Interestingly, all the observations show an increase in the AOD during the
first week of April 2020. Although a one-to-one comparison between the observed and the WRF-Chem simulated
hydrophilic and hydrophobic Black Carbon (BC) and Organic Carbon (OC) is not possible (as the BC obtained
using an Aethalometer cannot be separated), it is clear that the hydrophilic BC and OC match (Fig. 1b) well with
the results obtained for BC using the Aethalometer. WRF-Chem outputs slightly overestimates (underestimates)
the concentrations of N O2 (Fig. 1b) and S O2 (Fig. 1f) compared to the ground-based trace gas analyzer (OMI
satellite) measurements; however, the day-to-day variations were successfully reproduced. A large increase in
all concentrations that were observed during March 13–18, 2020 by ground-based instruments was due to a
highly localized event and is therefore not captured by WRF-Chem nor the satellite measurements limited by
the sampling issues from polar orbiting platform. Apart from these limitations, the failure of MODIS and OMI
to capture the peak values can be related to the polar orbits of these platforms (with only two visits per day).
Despite some slight shifting in the peaks, the day-to-day variations match well, particularly during the DLD
period. Moreover, a sharp decrease in the concentrations is noticeable and the values almost reach the limits of
detection during the DLD (Fig. 1c–h).
We further compared different pollutants concentrations ( PM2.5, PM10, NO2, SO2, CO and O3) simulated by
WRF-Chem with observations from different geographical locations across India collected by the Continuous
Ambient Air Quality Monitoring Stations (CAAQMS) (https://app.cpcbccr.com/ccr/#/caaqm-dashboard-all/
caaqm-landing), which are maintained by the Central Pollution Control Board (CPCB). The correlation coef-
ficients between WRF-Chem and CPCB data for the above-mentioned pollutants during 25 March to 1 May
Scientific Reports | (2021) 11:15110 | https://doi.org/10.1038/s41598-021-94373-4 3
Vol.:(0123456789)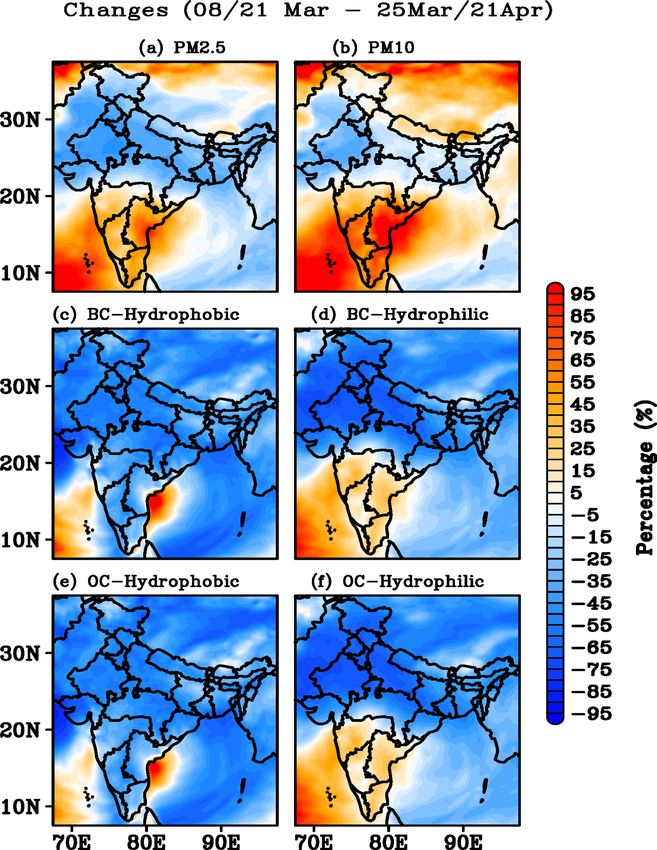
www.nature.com/scientificreports/
Figure 1. Time series for (a) AOD, (b) BC, (c) NO2, (d) NO, (e) NOx, (f) SO2, (g) O3, and (h) CO obtained
from WRF-Chem model simulations for March 8 to April 20, 2020 over the Gadanki region. Trace gases
obtained from a gas analyser at Gadanki are superimposed on the respective panels (c–h). Skyradiometer AOD
and Aethalometer BC are also superimposed in (a) and (b), respectively. Hydrophilic and hydrophobic BC and
OC as simulated by WRF-Chem are also shown in (a). MODIS AOD is superimposed in (a). NO2 and S O2
from OMI are superimposed in (c) and (f), respectively. Note that model simulated O3 and CO are doubled and
halved, respectively. WRF-Chem simulated outputs are represented by red lines, ground-based observations by
black lines, and satellite observations by blue lines. The vertical line indicates the date on which the lockdown
began. The figures are plotted using ORIGIN software (https://www.originlab.com).
2020 at 71 locations, varied between 0.4 and 0.8 (at 95% confidence level) except very few locations (Fig. 2). A
correlation coefficient of about ~ 0.7 is achieved at most of the locations and for all the pollutant concentrations
except for O 3 (~ 0.3). The correlation for NO2 and PM2.5 are reach their maxima of about ~ 0.8 over northwest,
central and south India. Note that we have configured the scale factor to reduce the emissions uniformly across
India by 40% during lockdown in the WRF-Chem simulation even though spatial variations in the reduction of
these pollutants was reported based on g round45 and space borne m easurements44. WRF-Chem simulated and the
observed AODs at three AERosol RObotic NETwork (AERONET) stations, Gandhi College, Kanpur and Lahore,
also suggest good correlations (at 95% confidence level) of about 0.67, 0,62 and 0.54, respectively (Figure S2).
We further computed the correlation coefficients at each grid point between observed tropospheric mean N O2
and SO2 in the planetary boundary layer from OMI and the corresponding WRF-Chem outputs during 1 March
2020 to 1 May 2020 (Figure S3), and presented those between MODIS AOD and WRF-Chem AOD in the same
figure. In general, the WRF-Chem simulated AOD, NO2 and S O2 over the Indian region are significantly (at 95%
confidence level) correlated with the satellite measurements. The WRF-Chem simulated NO2 and OMI derived
NO2 exhibit reasonably good correlation (about ~ 0.6) over the Indian continent except over central India and
the IGP region. The correlation values for S O2 are close to ~ 0.6 over the central and northwest parts of India.
Similarly, WRF-Chem simulated and MODIS derived AOD also show a very good correlation of about ~ 0.8 over
the entire Indian region. This gives further confidence that WRF-Chem is able to capture the variability of these
pollutants reasonably well when compared to the ground and satellite-based measurements.
The spatial distribution of the AOD and trace gases (NO2 and SO2) predicted by WRF-Chem are compared
with the satellite measurements in Figure S4. The composite mean of instantaneous values of AOD from swath
data of MODIS and corresponding values of WRF-Chem obtained during March 8 and April 20, 2020 (Fig. S4a,b)
indicate almost similar spatial distributions as those MODIS AOD over Central India, the IGP, and Northeast
India, with lower values over Northwest India. The tropospheric mean NO2 and S O2 concentrations in the plan-
etary boundary layer derived from the OMI (Fig. S4c,e) and the model (Fig. S4d,f) between March 8 and April
20, 2020 suggests that the N O2 and S O2 hotspots of slightly different magnitudes over Central and Northeast
Scientific Reports | (2021) 11:15110 | https://doi.org/10.1038/s41598-021-94373-4 4
Vol:.(1234567890)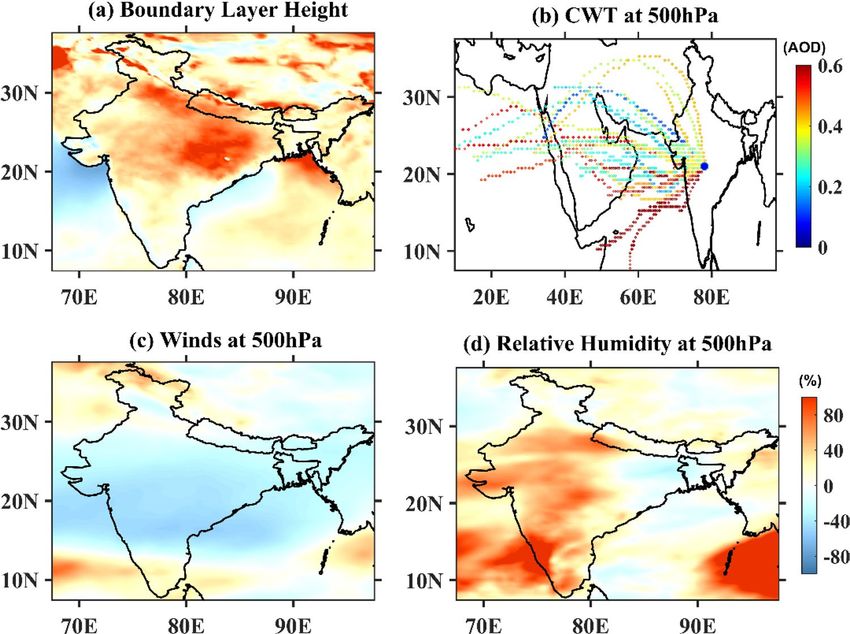
www.nature.com/scientificreports/
Figure 2. Correlation between CPCB data and WRF-Chem model outputs in (a) PM2.5, (b) PM10, (c) NO2,
(d) SO2, (e) CO and (f) O3 obtained during 1 March 2020 to 30 April 2020. Gray color circles represents the
locations that are not accounted for validation due to poor quality of the data. The figures are plotted using
GrADS V2.2.1 software (http://cola.gmu.edu/grads/).
India. In summary, WRF-Chem is clearly able to simulate the gross spatial features over India and adjoining
regions, albeit with slight differences in the magnitude.
The spatial distributions of MODIS AOD over India and the adjoining regions during PLD and DLD
(Fig. S5a,b) exhibit higher concentrations of AOD (> 0.5) during PLD over the IGP (covering Punjab, Haryana,
Uttar Pradesh, Uttarakhand, Bihar, and Central India) and a relatively clean atmosphere is observed over North-
west and South India. In contrast, a large increase in the AOD was observed over the head of the BoB, which
persisted throughout the DLD. Surprisingly, an increase in the AOD (> 0.5) was observed over Central India
and the BoB during DLD. The percentage difference in the AOD computed between the PLD and DLD periods
(Fig. S5c) reveals a decrease (increase) of approximately 50–60% in the AOD over the IGP region (Arabian
Sea, Central India, and BoB). The spatial distributions in the AOD obtained with WRF-Chem during PLD and
DLD show similar distributions to those of MODIS (Fig. S5d,e), except for minor differences in the magnitude
(Fig. S5f). Furthermore, the model shows an increase in the AOD over the entire Southern India including
Arabian Sea while MODIS show reduced AOD over the southern part of India. Amnuaylojaroen et al.49 and
Adedeji et al.50 stressed the need for a high resolution and improved emission inventory in order to obtain more
accurate simulations of AOD over these regions.
Scientific Reports | (2021) 11:15110 | https://doi.org/10.1038/s41598-021-94373-4 5
Vol.:(0123456789)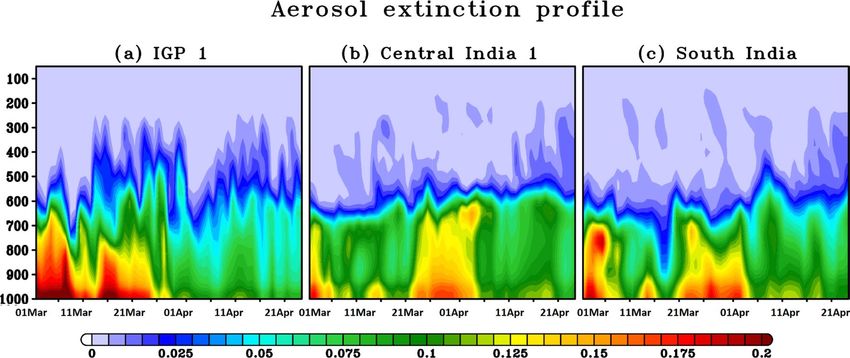
www.nature.com/scientificreports/
NO2 is mainly produced by anthropogenic activities such as the combustion of fossil fuels and production of
power. A drastic reduction in NO2 levels was therefore expected during the lockdown. The spatial distribution
of NO2 from OMI during PLD is shown in Fig. S6a, with several noticeable hotspots of NO2 concentrations, over
North and Northeast India. The intensity of most N O2 hotspots is decreased during the DLD period (Fig. S6b),
following the reduction in fossil fuel burning and the significant reduction in the N O2 emissions from thermal
power plants in Northeast India. A decrease of approximately 50–60% in N O2 levels is observed over both North-
west India and the IGP region, over the PLD and DLD periods (Fig. S6c). A similar percentage increase is also
observed in Central India. Apart from a change in the magnitude of N O2 over the thermal plants, no significant
changes were noticeable in the N O2 simulations over India (Fig. S6d,e). Increased N O2 concentrations were
further observed in both the satellites observations and the model simulations over the Arabian Sea and the BoB.
The various data comparisons clearly suggests that WRF-Chem is able to reproduce well the observed aerosol
and trace gas distributions, supporting the use of its outputs for qualitative analysis in the absence of observations.
Because direct information about other trace gases (NO, NO3, N2O5, CO, O3, CH4, and SO4) and aerosol param-
eters (PM2.5, PM10, and hydrophilic and hydrophobic BC and OC) are not available from satellite measurements,
the WRF-Chem simulations were analyzed to investigate the variability of these parameters during the lockdown.
Changes in aerosol parameters during lockdown. The simulated particulate matter ( PM2.5 and PM10)
concentrations over India and the adjacent regions during DLD (Fig. 3) indicate a decrease of approximately
45–55% (15–25%) over Northwest India (IGP and Northeast India) and an increase of approximately 50–80%
over South India (Fig. 3a,b) as compared to those during PLD. The BC produced in the atmosphere is gener-
ally hydrophobic (non-absorbing), but can be also hydrophilic (coated with water molecules)51 as further dis-
cussed at later stage. A decrease of approximately 45–55% in hydrophobic BC was observed over the Northwest,
Northeast, and IGP regions, with a slight enhancement over South India, the Arabian Sea and BoB (Fig. 3c)
during DLD, compared to PLD. The hydrophilic BC concentrations decreased by approximately 60–70% over
the northwest, northeast, and the IGP regions, while an increase of 35–45% was observed in South India during
DLD (Fig. 3d). Similar changes in the hydrophobic and hydrophilic OC concentrations (Fig. 3e,f) were observed
over India. The observed large reduction in hydrophilic BC compared to hydrophobic BC is mainly due to its
representation in the percentage change. However, the magnitudes of hydrophobic and hydrophilic BC and their
differences indicate (Fig. S7) that both components were reduced in similar magnitudes during the lockdown
period. Further, as expected, high magnitudes of hydrophobic BC are also noticeable.
Since seasonal changes during the PLD and DLD periods may contribute to the observed features, we have
performed an additional simulation for the year 2019 using WRF-Chem, considering the same PLD and DLD
for the analysis. While the simulated particulate matter (PM2.5 and PM10) concentrations over India during DLD
(2020) show (Fig. S8) no significant change over Northwest India, a significant decrease in PM2.5 (35–45%) over
IGP and Northeast India and 15–25% increase over South India (Fig. S8a,b) are noticeable when compared to
2019, whereas P M10 slightly increased (25–35%) throughout India in 2020 compared to 2019. A decrease of
approximately 45–55% in hydrophobic BC was observed throughout India, with a slight enhancement over the
BoB (Fig. S8c) during 2020, compared to 2019. The hydrophilic BC concentrations decreased by approximately
60–70% over the northwest, northeast, and the IGP regions, while an increase of 25–35% was observed in South
India during 2020 (Fig. S8d). Similar changes in the hydrophobic and hydrophilic OC concentrations (Fig. S8e,f)
were observed during 2020 compared to 2019. This clearly suggests that the seasonal changes are relatively small
compared to the observed differences in the aerosol concentrations during the DLD period.
Changes in trace gases concentrations during lockdown. The simulated concentrations of trace
gases over India and the adjacent regions suggest (Fig. 4a) a decrease of approximately 45–55% in the NO con-
centrations over most parts of India, an increase of approximately 25–35% over the IGP region with a few
hotspots, and an increase of approximately 55–65% over the BoB and Arabian Sea during DLD as compared to
PLD. The simulated NO3 concentrations show a decline of approximately 25–35% over Rajasthan, Gujarat, and
Haryana during DLD (Fig. 4b). A sharp increase of approximately 55–65% (25–35%) in NO3 concentrations is
also noticeable over the south west of India and Arabian Sea (IGP). A clear decline of approximately 65–75% in
the N2O5 concentration is observed over the IGP, Northeast, and Northwest India, in contrast with an increase
of similar magnitude over Arabian Sea and BoB during the DLD (Fig. 4c).
A decrease of approximately 15–25% in the concentration of CO was observed over many parts of India, while
CO increased by approximately 5–15% over western part of Maharashtra during DLD (Fig. 4d). The simulated
O3 concentrations increased by 25–35% over Arabian Sea, Central India, and a decrease of a similar magnitude
is noticeable over Northwest and North India (Fig. 4e). Pronounced increase in C H4 concentrations (65–75%)
is observed over IGP and some parts of Central and south India during DLD, despite a sharp decrease (65–75%)
over Rajasthan and Gujarat including a few hot spots crossing from south to northeast India (Fig. 4f). The S O2
levels decreased by 45–55% over several parts of India with a few hotspots in Southwest India, and 75–85%
increase over the Arabian sea during the DLD (Fig. 4g). Surprisingly, the S O4 levels increased by 80–90% between
the Arabian sea and the central parts of India (35–45%) and the BoB, while simultaneously decreasing over
Northwest and Northeast India during DLD (Fig. 4h).
The analysis of WRF-Chem for the year 2020 suggests a significant decrease (45–75%) in all concentrations
(except CH4 and SO4) during the DLD period when compared to the same days during 2019 (Fig. S9). O 3 also
shows a reduction throughout India in 2019 unlike during 2020 (Fig. S9e). An increase in S O4 concentrations
over central and southern India including BoB with slight decrease over IGP is noticeable (Fig. S9h). This again
suggests that the seasonal changes are small compared to the observed differences in the trace gases concentra-
tion during the DLD period.
Scientific Reports | (2021) 11:15110 | https://doi.org/10.1038/s41598-021-94373-4 6
Vol:.(1234567890)
www.nature.com/scientificreports/
Figure 3. Percentage difference in the (a) PM2.5, (b) PM10, (c) BC hydrophobic, (d) BC hydrophilic, (e) OC
hydrophobic, and (f) OC hydrophilic observed between the PLD and DLD periods based on WRF-Chem
simulations for India and adjacent regions. The figures are plotted using GrADS V2.2.1 software (http://cola.
gmu.edu/grads/).
In general, freshly emitted BC and dust aerosols will be hydrophobic and inert. After the aging process, for
which time varies from 1.6 to 2 days depending on the pollutant loading and d ynamics52, they may become
hydrophilic after mixing with the inorganic and organic acidic species. Hydrophobic‐to‐hydrophilic conversion
is controlled by their interaction with more hydrophilic species such as sulphates, nitrates, and secondary organic
aerosols52. Upon emission, all BCs are assumed to be in the insoluble Aitken mode (mean radius 0.03 μm), and
the subsequent aging and growth explicitly depends on the ambient concentrations of sulphate53.
Despite the significant reduction in anthropogenic emissions during the lockdown, however, the emissions
never reduced to zero (practically impossible) because of essential services (power plants, food industries, health
care system, essential transport, agricultural activities etc.). Additionally, there were also natural emissions from
the biogenic sources, biomass burning, agriculture activities, and forest fires (Fig. S10 shows the MODIS fire
counts). Moreover, the observed reductions were not uniform in all the regions (Figs. 3, 4), indicating some active
anthropogenic emissions in certain regions (for example central and southern India). Atmospheric dynamics due
to the formation of anticyclonic condition over central India also played a crucial role in the observed pollutants
(Fig. S12). The results suggest an accumulation of pollutants in this region, suggesting that despite the reduction
Scientific Reports | (2021) 11:15110 | https://doi.org/10.1038/s41598-021-94373-4 7
Vol.:(0123456789)www.nature.com/scientificreports/
Figure 4. Percentage difference in the (a) NO, (b) NO3−, (c) N2O5, (d) CO, (e) O3, (f) CH4, (g) SO2, and (h)
S O42− observed between the PLD and DLD periods based on WRF-Chem simulations for India and adjacent
regions. The figures are plotted using GrADS V2.2.1 software (http://cola.gmu.edu/grads/).
in the anthropogenic emissions during the lockdown, there was a continuous accumulation of pollutants in the
central India likely associated with the dynamical conditions. Once the pollutant concentration increases, the
active chemical conversions take place and forms the acidic species such as sulphates, nitrates and organic acids
(this is clear from Fig. 4b,h, which show a substantial increase in the acidic species such as sulphates and nitrates).
The reduction in N Ox resulted in the increase of O3 concentration (lack of O 3 scavenging by NO, Fig. 4a).
There was also an increase in the relative humidity (RH) (Fig. 6d) and solar irradiance54, which favors OH
formation55. This should increase the oxidative processes (initiated by OH) of the trapped air parcel and result
in the formation of sulphates and nitrates from the precursor species such as S O2, NOx, and NH356. Some reports
suggested that the increase in carbonaceous aerosols resulted from VOC oxidations initiated by O 3 as O
3 con-
centrations increase during the lockdown57. Therefore, accumulation of pollutants and subsequent oxidative
processes under favorable conditions increased the acidic species and upon mixing with BC and dust, led to
their conversion into hydrophilic species. The increased RH may have increased the size of these species, which
resulted in higher AOD.
Changes in the vertical distribution of aerosols during lockdown. The analysis included a com-
parison of the percentage changes in the near-surface-level aerosol and trace gases concentrations during DLD
Scientific Reports | (2021) 11:15110 | https://doi.org/10.1038/s41598-021-94373-4 8
Vol:.(1234567890)www.nature.com/scientificreports/
Figure 5. Vertical distribution of the aerosol extinction coefficient observed over (a) the IGP region, (b)
Central India, and (c) South India during PLD and DLD periods. The figures are plotted using GrADS V2.2.1
software (http://cola.gmu.edu/grads/).
with those during PLD. Despite the observed clean atmosphere over India15,32, the concentration of aerosols
increased over Central India during DLD, which affected the AOD. An increase in the concentration of other
aerosols (PM2.5, PM10, and hydrophilic BC and OC) was also observed over Central and South India despite the
absence of local pollution sources at the surface during the DLD. Because the AOD is an integrated parameter
that reflects aerosol extinction across the column, the increase in the AOD should be related to higher aerosol
concentrations in the column.
Figure 5 outlines the vertical distribution of the aerosol extinction coefficient over selected regions in the
IGP (Fig. 5a), Central India (Fig. 5b), and South India (Fig. 5c) during the PLD and DLD periods. The high
(> 0.15 km−1) vertical aerosol extinction that was observed over the IGP during the PLD period reduced drasti-
cally (< 0.1 km−1) during DLD. This is expected as the complete lockdown reduced the emission of anthropogenic
aerosols from traffic and industrial activities. Interestingly, a low extinction coefficient was observed (< 0.1 km−1)
during PLD over Central and South India, whereas the extinction (> 0.15 km−1) was observed to increase from
the surface and 600 hPa with a slight decrease between the two, particularly over Central India. The elevated
aerosol layers, particularly over Central India, might have contributed to the observed increase in AOD during
the DLD period. The possible reasons behind this increase are discussed in the following Section.
Discussion
The lockdown that was enforced in India between March 25 and April 14, 2020 (Phase 1) due to the COVID-
19 pandemic restricted the movement of people and constrained all businesses and industrial activities, which
helped in the improvement of the air quality. Our analysis indicates that certain parts of India (the northwest,
the IGP, and the northeast) enjoyed a clean environment in line with the results of studies by Jain and S harma15
and Sharma et al.32. However, despite the absence of anthropogenic activities at the surface during the lockdown,
higher aerosol and some trace gases concentrations were observed in some parts of India (Central and South
India), which suggests that other factors might have contributed to the increased concentrations, including
emissions from natural sources (such as forest fires, biomass burning) and long-range transport.
The fire radiative power (FRP) obtained from the MODIS measurements as a proxy for biomass burning over
India and the adjacent regions during PLD and DLD is shown in Fig. S10. Note that the first phase of DLD is
again divided into two periods (March 25 to April 7, 2020 and April 8–20, 2020), as both the model simulations
and the observations show an increase in the concentration of aerosols and trace gases during the first week
of April 2020 (Fig. 1). An FRP of approximately 5–10 MW was observed over South India and the IGP region
during the PLD period, with a relatively weaker FRP observed over Central India. A few hotspots in which the
FRP was particularly high were observed over Northeast India. An increase in FRP was observed over Central
India and the IGP regions, with small changes in other parts of India during DLD. A relatively high FRP was
observed over Central India during the second half of the DLD (April 8–20, 2020) as compared to the first half
(March 25 to April 7, 2020). However, the IGP region remained clear. These intermittent fire activities might
have contributed to the observed increase in some trace gases (Fig. 4) and aerosol (Fig. 3) concentrations over
Central and South India during DLD.
The implemented lockdown (first phase) over India falls during the transition period between winter and
summer, during which the increase in the boundary layer height (BLH) leads to strong vertical mixing, affect-
ing the aerosol and trace gas concentrations at the surface. An increase of approximately 70–80% in the BLH
occurred (Fig. 6a) over the IGP and Northeast India between the PLD and DLD periods, compared to a 5–25%
increase over the rest of India. This may have also been a factor behind the significant reductions in the aerosol
and trace gas concentrations near the surface alongside the low emissions. The southern parts of India experi-
enced negligible changes in the BLH between the PLD and DLD. Very similar changes in BLH are also observed
in ERA-5 reanalysis (Fig. S11).
Scientific Reports | (2021) 11:15110 | https://doi.org/10.1038/s41598-021-94373-4 9
Vol.:(0123456789)www.nature.com/scientificreports/
Figure 6. Percentage difference in the (a) BLH, (c) wind speed at 500 hPa, and (d) RH at 500 hPa observed
between the PLD and DLD periods based on WRF-Chem simulations for India and the adjacent regions. (b)
Concentration weighted trajectory (CWT) map of the AOD for Central India during the DLD period (March
25–April 20, 2020). The blue dot denotes the center of central India. The figures are plotted using GrADS V2.2.1
software (http://cola.gmu.edu/grads/).
A significant decrease (increase) in BLH is noticeable over south and central India (IGP and northeast) dur-
ing 2020 compared to 2019 (Fig. S11c). Besides low emissions, the increase in BLH over IGP and north India
may have resulted in the reduction of the pollutants due to well mixing. Similarly, an increase in these pollutants
(particularly aerosols) over central and south India due to the decrease (or significant reduction when compared
to 2019) in the BLH. We have also retrieved the boundary layer altitude using the network of ground-based
radiosonde measurements over the Indian region to validate the WRF-Chem simulated boundary layer heights
(Fig. S11d). WRF-Chem seems to overestimate the variations in BLH compared to radiosonde data. Despite the
changes in the magnitudes between the WRF-Chem and radiosonde observations, the increase in the BLH by
20–40% (10–20%) in the IGP and northeast region (south and central India) is noticeable in 2020, compared
to 2019. The increase in BLH in 2020 may be one of the reasons for the decrease in pollutant concentrations in
2020 in addition to the reduced emissions. However, the percentage reduction in concentrations does not go
hand-in hand with the BLH changes as the pollutant concentrations cannot interact linearly with the BLH but
several other factors such as mixing efficiency, wind speed (both vertical and horizontal), topography etc., also
influence the pollutant concentrations.
In contrast to the decrease in aerosol concentrations, a significant increase in the AOD was observed both
by the satellite and in the model simulations over Central and South India during the lockdown. The dynamics
and background meteorology might have influenced the high AOD observed over these regions. The dry season,
together with high winds, favors the production and transport of dust which contributes to the AOD, especially
over Central India. The mean wind patterns averaged over the DLD period (at 850, 700, and 500 hPa in Fig. S12),
indicate that the direction of the wind reversed in middle-eastern Africa, where the largest source of desert dust
is located. Dust transported from these regions got trapped in the anti-cyclonic circulation, as indicated by the
wind vectors between 500 and 300 hPa (figure not shown) over Central India and the head of the BoB.
To further investigate the potential transport of aerosols over large geographical scales, Concentration
Weighted Trajectory (CWT) maps of the AOD in Central India were investigated. The CWT includes atmos-
pheric concentrations combined with back-trajectories and information about residence times and can identify
the air parcels that may be responsible for the high concentrations observed over a given region23,58. To identify
the transport pathways of aerosols, 72-h back trajectories were calculated for 850, 700, and 500 hPa. The calcu-
lations were carried out at 06.00 h (UTC) during the DLD period (March 25 to April 14) using a 0.25° × 0.25°
grid. The CWT analysis of the AOD suggests (Figs. S13 and 6b) that the sources of the observed aerosol levels
are located in Africa. Except for the lower pressure level (850 hPa), air pathways from the southeast contribute
to the observed AOD (Fig. S13c), and all the trajectories are long-range (Fig. S13a,b). Thus, the elevated aerosol
Scientific Reports | (2021) 11:15110 | https://doi.org/10.1038/s41598-021-94373-4 10
Vol:.(1234567890)www.nature.com/scientificreports/
Figure 7. Spatial distribution of (a) PM2.5, (b) PM10, (c) ratio between PM2.5 and PM10, (d) organic matter
and black carbon ((OC hyrdrophobic + OC hydrophilic) × OC mass fraction (1.8) + BC hyrdrophobic + BC
hydrophilic), (e) sulfate, (f) ratio between dust P M2.5 and total PM2.5, (g) ratio between dust PM10 and total
PM10, and (h) ratio between sulfate and PM2.5 total non-dust obtained during DLD period based on WRF-Chem
simulations for India and adjacent regions. All units are in μg m −3 except ratios. The figures are plotted using
GrADS V2.2.1 software (http://cola.gmu.edu/grads/).
layers seen in Fig. 5 are the result of long-range transport over Central India that might have get trapped in the
anti-cyclone (Fig. S12a), despite the decrease in particulate matter near the surface during lockdown.
To further assess the contributions from local and long-range transport, we show a wider spatial distribution
of aerosol pollutants in Fig. 7. PM2.5 (Fig. 7a) and PM10 (Fig. 7b) reveals high concentrations over the dust source
regions of Africa and the middle-east. The ratio of PM2.5 and PM10 (Fig. 7c) is low (0.2–0.3) over these regions,
suggesting that these are source regions where both fine and coarse particles are generated. Since coarse particles
cannot be transported far from the source regions compared to fine particles due to their shorter lifetime (related
to dry deposition processes), higher ratio values (0.5–0.7) are observed over the south and central regions of
India and farther from the main dust sources. The sum of combined surface concentrations of organic matter
and black carbon show much smaller values (Fig. 7d). Sulfate concentrations are found to be high (Fig. 7e) over
the south and northeast parts of India where thermal power plants are located. Contributions of dust to PM2.5
and PM10 calculated as their ratio’s further show (Fig. 7f,g) high contribution (> 80%) near the dust sources, and
relatively low contribution (30–40%) over Indian region, particularly over the south and northeast parts of India.
The ratio between the concentration of sulfate aerosol with respect to the total concentration of P M2.5, suggest
that non-dust aerosols are relatively low (< 0.45) over India during lockdown (Fig. 7h). Similar features are also
Scientific Reports | (2021) 11:15110 | https://doi.org/10.1038/s41598-021-94373-4 11
Vol.:(0123456789)www.nature.com/scientificreports/
noticed during the same period of the year 2019, suggesting that long-range transport of aerosols dominates
over India during this season.
To further investigate the role of meteorology and dynamics in the observed increase in aerosol concentrations
over Central India, differences in the wind speeds at 850, 700, and 500 hPa averaged during the PLD and DLD
periods are shown in Fig. S14. The difference in the wind speeds is very small at 850 hPa but increases at higher
levels. An increase of approximately 80–90% in wind speed can be seen over IGP region, South India, which
decreases to 50–60% over central India during DLD. A decrease of approximately 50–60% is also observed in
the wind speed at 500 hPa, particularly over central India during DLD (Figs. 6c and S14c). These reduced wind
speeds mean that pollutants remain longer in central India than they do in the north.
The percentage changes in the relative humidity between the PLD and DLD periods suggest (Fig. S14d–f) an
increase of approximately 70–80% during lockdown over India, particularly at 500 hPa (Figs. 6d and S14f). This
OD59, as reflected in
increase in the relative humidity increases the size of aerosol particles, leading to a higher A
the increase in hydrophilic BC and OC (Fig. 3). Meteorology and dynamics have therefore played an important
role in the observed increase in AOD over Central India during the lockdown.
Conclusions
Observations based analyses have shown that lockdown measures implemented to combat COVID-19 has led
to significant improvement in air quality over India, particularly during the first phase of the lockdown (i.e.,
March 25 to April 14, 2020). WRF-Chem model simulations also revealed similar findings. WRF-Chem outputs
were then analyzed to understand the processes driving the aerosols and trace gas concentrations variability
across India and adjoining regions. Our results revealed that an increase in boundary layer altitude (well mix-
ing) together with an enhancement of the wind speeds (dispersion) played major roles in the observed clean
atmosphere in the north (and northeast) India besides the low emissions during the lockdown. At the same time,
we demonstrated that an elevated aerosol layer (above 600 hPa), through long-range transport, a decrease in
background wind speed (stagnant condition), an increase in relative humidity (hygroscopic), and no significant
change in the boundary layer altitude are the main reasons behind the observed increase in the aerosol optical
depth during lock down over Central I ndia44.
Several recent r eports60 investigated the percentage changes in pollutants due to the reduced mobility of the
traffic during COVID-19 lockdown. A Mobility index was determined from the mobile phone usage at the coun-
try level, which indirectly suggests the human movement. The strong correlation between the decrease in NO2
concentrations and decrease in the mobility index was clear. However, such relation is not found in the particulate
obility60. To illustrate the gross
matter (PM2.5), suggesting that PM2.5 changes are not directly related to human m
traffic volume changes over India, we have considered G oogle61 Community Mobility Report (CMR) data based
on the previous traffic associated pollution studies during the COVID-19 lockdown. This CMR parameter is
computed from the baseline value (median) available for the corresponding day of the week (during COVID-19
lockdown period) from the values prevailed during the 5-week period of study (data period between 3 January
and 6 February 2020). The CMR data indicates a clear reduction in the mobility (at supermarkets and pharmacy
(− 16%), retail and recreation (− 56%), public transport (− 41%), workplaces (− 33%) and park (− 34%) catego-
ries) during the lockdown across India with some spatial variations. However, there was an increase of 20% in
the mobility in the residential areas. Though one-to-one relation cannot be obtained (as these mobility statistics
from mobiles do not fully represent the actual scenario), similar reduction (50–60%) in the pollutants is clearly
observed in N O2 and PM2.5 (and P M10) in the north-west and IGP including the north-eastern parts. However,
such relation is not found over the central India, suggesting the complex nature of these pollutants influenced
by the background meteorology and dynamics.
It is therefore prudent to conclude that large-scale meteorology and dynamics play an important role in the
changes in pollution levels over India and the adjacent regions with respect to the lockdown. The measures
implemented by the Indian government to reduce pollution levels should also consider these facts in their deci-
sion making. COVID-19 provided an opportunity to test this hypothesis by ceasing all major anthropogenic
activities, providing the background for a large-scale natural laboratory experiment.
Received: 18 April 2021; Accepted: 30 June 2021
References
1. World Health Organization. Coronavirus disease (COVID-19) outbreak. https://www.who.int/emergencies/diseases/novel-coron
avirus-2019 (2020).
2. Shrestha, A. M. et al. Lockdown caused by COVID-19 pandemic reduces air pollution in cities worldwide. EarthArXiv Prepr https://
doi.org/10.31223/osf.io/edt4j (2020).
3. Nakada, L. Y. K. & Urban, R. C. COVID-19 pandemic: Impacts on the air quality during the partial lockdown in São Paulo state,
Brazil. Sci. Total Environ. 730, 139087. https://doi.org/10.1016/j.scitotenv.2020.139087 (2020).
4. Filonchyk, M., Hurynovich, V., Yan, H., Gusev, A. & Shpilevskaya, N. Impact assessment of COVID-19 on variations of SO2, NO2,
CO and AOD over East China. Aerosol Air Qual. Res. https://doi.org/10.4209/aaqr.2020.05.0226 (2020).
5. Xu, K. et al. Impact of the COVID-19 event on air quality in central China. Aerosol Air Qual. Res. 20, 915–929. https://doi.org/10.
4209/aaqr.2020.04.0150 (2020).
6. Zhang, J. et al. Temporal variations in the air quality index and the impact of the COVID-19 event on air quality in western china.
Aerosol Air Qual. Res. 20, 1552–1568. https://doi.org/10.4209/aaqr.2020.06.0297 (2020).
7. Bao, R. & Zhang, A. Does lockdown reduce air pollution? Evidence from 44 cities in northern China. Sci. Total Environ. 731,
139052. https://doi.org/10.1016/j.scitotenv.2020.139052 (2020).
Scientific Reports | (2021) 11:15110 | https://doi.org/10.1038/s41598-021-94373-4 12
Vol:.(1234567890)www.nature.com/scientificreports/
8. Chen, Q. X., Huang, C. L., Yuan, Y. & Tan, H. P. Influence of COVID-19 event on air quality and their association in Mainland
China. Aerosol Air Qual. Res. 20, 1541–1551. https://doi.org/10.4209/aaqr.2020.05.0224 (2020).
9. Chen, X. et al. Common source areas of air pollution vary with haze intensity in the Yangtze River Delta, China. Environ. Chem.
Lett. https://doi.org/10.1007/s10311-020-00976-0 (2020).
10. Zalakeviciute, R. et al. Drastic improvements in air quality in Ecuador during the COVID-19 outbreak. Aerosol Air Qual. Res.
https://doi.org/10.4209/aaqr.2020.05.0254 (2020).
11. Bauwens, M. et al. Impact of coronavirus outbreak on NO2 pollution assessed using TROPOMI and OMI observations. Geophys.
Res. Lett. 47, e2020GL087978. https://doi.org/10.1029/2020GL087978 (2020).
12. Broomandi, P. et al. Impact of COVID-19 event on the air quality in Iran. Aerosol Air Qual. Res. https://doi.org/10.4209/aaqr.2020.
05.0205 (2020).
13. Faridi, S. et al. Impact of SARS-CoV-2 on ambient air particulate matter in Tehran. Aerosol Air Qual. Res. https://doi.org/10.4209/
aaqr.2020.05.0225 (2020).
14. Navinya, C., Patidar, G. & Phuleria, H. C. Examining EFFECTS of the COVID-19 national lockdown on ambient air quality across
urban India. Aerosol Air Qual. Res. https://doi.org/10.4209/aaqr.2020.05.0256 (2020).
15. Jain, S. & Sharma, T. Social and travel lockdown impact considering coronavirus disease (COVID-19) on air quality in megacities
of India: Present benefits, future challenges and way forward. Aerosol Air Qual. Res. https://doi.org/10.1016/j.mvr.2017.09.004
(2020).
16. Suhaimi, N. F., Jalaludin, J. & Latif, M. T. Demystifying a possible relationship between COVID-19, air quality and meteorological
factors: Evidence from Kuala Lumpur, Malaysia. Aerosol Air Qual. Res. 20, 1520–1529. https://doi.org/10.4209/aaqr.2020.05.0218
(2020).
17. Tobías, A. et al. Changes in air quality during the lockdown in Barcelona (Spain) one month into the SARS-CoV-2 epidemic. Sci.
Total Environ. 726, 138540. https://doi.org/10.1016/j.scitotenv.2020.138540 (2020).
18. Berman, J. D. & Ebisu, K. Changes in U.S. air pollution during the COVID-19 pandemic. Sci. Total Environ. 739, 139864 (2020).
19. Le Quéré, C. et al. Temporary reduction in daily global CO2 emissions during the COVID-19 forced confinement. Nat. Clim.
Change. 5, 5. https://doi.org/10.1038/s41558-020-0797-x (2020).
20. Safarian, S., Unnthorsson, R. & Richter, C. Effect of coronavirus disease 2019 on C O2 emission in the world. Aerosol Air Qual. Res.
20, 1197–1203. https://doi.org/10.4209/aaqr.2020.0.0151 (2020).
21. Siciliano, B., Dantas, G., da Silva, C. M. & Arbilla, G. Increased ozone levels during the COVID-19 lockdown: Analysis for the city
of Rio de Janeiro, Brazil. Sci. Total Environ. 737, 139765 (2020).
22. Ogen, Y. Assessing nitrogen dioxide (NO2) levels as a contributing factor to coronavirus (COVID-19) fatality. Sci. Total Environ.
726, 138605. https://doi.org/10.1016/j.scitotenv.2020.138605 (2020).
23. Wang, S. et al. A study of characteristics and origins of haze pollution in Zhengzhou, China, based on observations and hybrid
receptor models. Aerosol Air Qual Res 17, 513–528. https://doi.org/10.4209/aaqr.2016.06.0238 (2017).
24. Le, T. et al. Unexpected air pollution with marked emission reductions during the COVID-19 outbreak in China. Science 7431,
eabb7431. https://doi.org/10.1126/science.abb7 (2020).
25. Gunthe, S. S., Swain, B., Patra, S. S. & Amte, A. On the global trends and spread of the COVID-19 outbreak: Preliminary assess-
ment of the potential relation between location-specific temperature and UV index. J. Public Health Theory Pract. https://doi.org/
10.1007/s10389-020-01279-y (2020).
26. Ianevski, A. et al. Low temperature and low UV indexes correlated with peaks of influenza virus activity in Northern Europe during
2010–2018. Viruses 11(3), 207. https://doi.org/10.3390/v11030207 (2019).
27. Ma, Y. et al. Effects of temperature variation and humidity on the death of COVID-19 in Wuhan. China. Sci. Total Environ. 724,
138226. https://doi.org/10.1016/j.scitotenv.2020.138226 (2020).
28. Liu, J. et al. Impact of meteorological factors on the COVID-19 transmission: A multi-city study in China. Sci. Total Environ. 726,
138513. https://doi.org/10.1016/j.scitotenv.2020.138513 (2020).
29. Tosepu, R. et al. Correlation between weather and Covid-19 pandemic in Jakarta, Indonesia. Sci. Total Environ. 725, 138436.
https://doi.org/10.1016/j.scitotenv.2020.138436 (2020).
30. Lal, P. et al. The dark cloud with a silver lining: Assessing the impact of the SARS COVID-19 pandemic on the global environment.
Sci. Total Environ. 732, 139297. https://doi.org/10.1016/j.scitotenv.2020.139297 (2020).
31. Gunthe, S. S. & Patra, S. S. Impact of international travel dynamics on domestic spread of 2019-nCoV in India: Origin-based risk
assessment in importation of infected travelers. Glob. Health 16, 45. https://doi.org/10.1186/s12992-020-00575-2 (2020).
32. Sharma, S., Zhang, M., Gao, J., Zhang, H. & Kota, S. H. Effect of restricted emissions during COVID-19 on air quality in India.
Sci. Total Environ. 728, 138878. https://doi.org/10.1016/j.scitotenv.2020.138878 (2020).
33. Mahato, S., Pal, S. & Ghosh, K. G. Effect of lockdown amid COVID-19 pandemic on air quality of the megacity Delhi, India. Sci.
Total Environ. 730, 139086. https://doi.org/10.1016/j.scitotenv.2020.139086 (2020).
34. Seinfeld, J. H. & Pandis, S. N. Atmospheric Chemistry and Physics. From Air Pollution to Climate Changes (Wiley, 1998).
35. Sicard, P. et al. Amplified ozone pollution in cities during the COVID-19 lockdown. Sci. Total Environ. 735, 139542. https://doi.
org/10.1016/j.scitotenv.2020.139542 (2020).
36. Singh, V. et al. Diurnal and temporal changes in air pollution during COVID-19 strict lockdown over different regions of India.
Environ. Pollut. 266, 115368 (2020).
37. Grell, G. A. et al. Fully coupled “online” chemistry in the WRF model. Atmos. Environ. 39, 6957–6976 (2005).
38. Grell G. et al. Chapter on "On-line chemistry within WRF: description and evaluation of a state-of-the-art multiscale air quality
and weather prediction model". In Integrated Systems of Meso-Meteorological and Chemical Transport Models (eds Baklanov, A. et
al.), ISBN: 978-3-642-13979-6 (Springer, 2011).
39. Archer-Nicholls, S. et al. Gaseous chemistry and aerosol mechanism developments for version 351 of the online regional model.
WRF-Chem. Geosci. Model Dev. 7, 2557–2579. https://doi.org/10.5194/gmd-7-2557-2014 (2014).
40. Marelle, L. et al. Improvements to the WRF-Chem 3.5.1 model for quasi-hemispheric simulations of aerosols and ozone in the
Arctic. Geosci. Model Dev. 10, 3661–3677. https://doi.org/10.5194/gmd-10-3661-2017 (2017).
41. Krishna, R. K. et al. Surface PM2. 5 estimate using satellite-derived aerosol optical depth over India. Aerosol Air Qual. Res 19,
25–37 (2019).
42. Spiridonov, V., Jakimovski, B., Spiridonova, I. & Gabriel, P. Development of air quality forecasting system in Macedonia, based on
WRF-Chem model. Air Qual. Atmos. Health 12, 825–836. https://doi.org/10.1007/s11869-019-00698-5 (2019).
43. Ghude, S. D. et al. What is driving the diurnal variation in tropospheric NO2 columns over a cluster of high emission thermal
power plants in India?. Atmos. Environ. X 5, 100058 (2020).
44. Venkataraman, C. et al. Source influence on emission pathways and ambient PM 2.5 pollution over India (2015–2050). Atmos.
Chem. Phys. 18(11), 8017–8039 (2018).
45. Ratnam, M. V., Prasad, P., Akhil Raj, S. T. & Ibrahim, H. Effect of lockdown due to COVID-19 on the aerosol and trace
gases spatial distribution over india and adjoining regions. Aerosol Air Qual. Res. 21(2), 200397. https://doi.org/10.4209/
aaqr.2020.07.0397 (2021).
46. Marsh, D., Mills, M., Kinnison, D. E. & Lamarque, J.-F. Climate change from 1850 to 2005 simulated in CESM1(WACCM). J. Clim.
26, 7372–7391. https://doi.org/10.1175/JCLI-D-12-00558.1 (2013).
Scientific Reports | (2021) 11:15110 | https://doi.org/10.1038/s41598-021-94373-4 13
Vol.:(0123456789)You can also read