A Comparison of Mainstream Genotyping Platforms for the Evaluation and Use of Barley Genetic Resources
←
→
Page content transcription
If your browser does not render page correctly, please read the page content below
ORIGINAL RESEARCH
                                                                                                                                                 published: 26 April 2019
                                                                                                                                           doi: 10.3389/fpls.2019.00544

                                             A Comparison of Mainstream
                                             Genotyping Platforms for the
                                             Evaluation and Use of Barley
                                             Genetic Resources
                                             Benoit Darrier 1,2† , Joanne Russell 3† , Sara G. Milner 4† , Pete E. Hedley 3 , Paul D. Shaw 5 ,
                                             Malcolm Macaulay 3 , Luke D. Ramsay 3 , Claire Halpin 2 , Martin Mascher 4 ,
                                             Delphine L. Fleury 1 , Peter Langridge 1 , Nils Stein 4,6 and Robbie Waugh 1,2,3*
                                             1
                                               School of Agriculture and Wine, The University of Adelaide, Adelaide, SA, Australia, 2 School of Life Sciences, University
                                             of Dundee, Dundee, United Kingdom, 3 Cell and Molecular Sciences, The James Hutton Institute, Dundee, United Kingdom,
                                             4
                                               Leibniz Institute of Plant Genetics and Crop Plant Research, Gatersleben, Germany, 5 Information and Computational
                                             Sciences, The James Hutton Institute, Dundee, United Kingdom, 6 Center of Integrated Breeding Research, Georg-August
                                             University, Göttingen, Germany
                          Edited by:
                  Laurent Gentzbittel,
         National Polytechnic Institute
                                             We compared the performance of two commonly used genotyping platforms,
                  of Toulouse, France
                                             genotyping-by-sequencing (GBS) and single nucleotide polymorphism-arrays (SNP),
                     Reviewed by:
                   Francois Belzile,         to investigate the extent and pattern of genetic variation within a collection of
           Laval University, Canada          1,000 diverse barley genotypes selected from the German Federal ex situ GenBank
           Marinus J. M. Smulders,
  Wageningen University & Research,
                                             hosted at IPK Gatersleben. Each platform revealed equivalent numbers of robust bi-
                        Netherlands          allelic SNPs (39,733 and 37,930 SNPs for the 50K SNP-array and GBS datasets
                  *Correspondence:           respectively). A small overlap of 464 SNPs was common to both platforms, indicating
                      Robbie Waugh
                                             that the methodologies we used selectively access informative polymorphism in different
          robbie.waugh@hutton.ac.uk
     † These                                 portions of the barley genome. Approximately half of the GBS dataset was comprised
               authors have contributed
                    equally to this work     of SNPs with minor allele frequencies (MAFs) below 1%, illustrating the power of
                                             GBS to detect rare alleles in diverse germplasm collections. While desired for certain
                   Specialty section:
         This article was submitted to
                                             applications, the highly robust calling of alleles at the same SNPs across multiple
                       Plant Breeding,       populations is an advantage of the SNP-array, allowing direct comparisons of data from
               a section of the journal      related or unrelated studies. Overall MAFs and diversity statistics (π) were higher for the
            Frontiers in Plant Science
                                             SNP-array data, potentially reflecting the conscious removal of markers with a low MAF
         Received: 21 January 2019
           Accepted: 09 April 2019           in the ascertainment population. A comparison of similarity matrices revealed a positive
           Published: 26 April 2019          correlation between both approaches, supporting the validity of using either for entire
                               Citation:     GenBank characterization. To explore the potential of each dataset for focused genetic
        Darrier B, Russell J, Milner SG,
   Hedley PE, Shaw PD, Macaulay M,
                                             analyses we explored the outcomes of their use in genome-wide association scans
   Ramsay LD, Halpin C, Mascher M,           for row type, growth habit and non-adhering hull, and discriminant analysis of principal
  Fleury DL, Langridge P, Stein N and        components for the drivers of sub-population differentiation. Interpretation of the results
       Waugh R (2019) A Comparison
 of Mainstream Genotyping Platforms          from both types of analysis yielded broadly similar conclusions indicating that choice of
  for the Evaluation and Use of Barley       platform used for such analyses should be determined by the research question being
                    Genetic Resources.
               Front. Plant Sci. 10:544.
                                             asked, group preferences and their capabilities to extract and interpret the different
         doi: 10.3389/fpls.2019.00544        types of output data easily and quickly. Access to the requisite infrastructure for running,

Frontiers in Plant Science | www.frontiersin.org                                    1                                                 April 2019 | Volume 10 | Article 544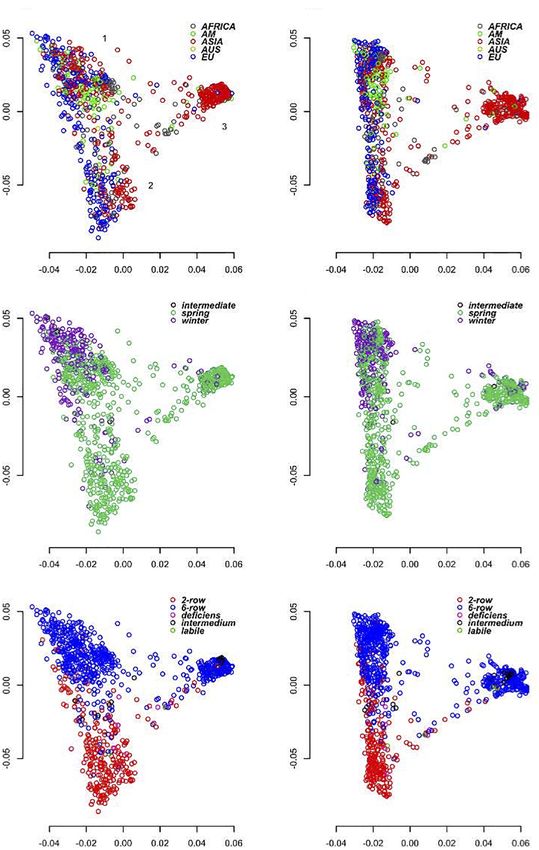
Darrier et al.                                                                                                                             SNP-Array vs. GBS

                                             processing, analyzing, querying, storing, and displaying either datatype is an additional
                                             consideration. Our investigations reveal that for barley the cost per genotyping assay
                                             is less for SNP-arrays than GBS, which translates to a cost per informative datapoint
                                             being significantly lower for the SNP-array.
                                             Keywords: germplasm evaluation, GBS, SNP-array, diversity, GWAS

INTRODUCTION                                                                      cultivars) from across the geographic range of the species, to have
                                                                                  minor allele frequencies (MAFs) of > 5% in the ascertainment
The detection of genome-wide sequence-defined single                              population, be located in annotated, physically and genetically
nucleotide polymorphism-arrays (SNPs) is key to addressing                        mapped positions and to be well-distributed across each of the
a wide range of biological and ecological questions, from                         seven barley chromosomes. We chose the Illumina iSelect SNP
describing and partitioning overall levels of biological diversity                platform as it has proven to be a highly robust technology that
to cloning genes conferring phenotypic traits, and for practical                  yields exceptional data quality with few missing values1 . For
exploitation in animal and crop breeding. Alternative SNP                         many applications this is crucially important because all new
alleles can be detected using a range of technologies that can                    data are backward compatible, easily extracted, quality checked,
be broadly classified into two types, semi-open and closed,                       databased and referenced over time, with the computational load
based on the nature of the data generated. Closed systems can                     between data generation and use for analysis being minimal
be represented by hybridization-based commercial SNP-arrays                       and therefore suited to almost anyone in a research or breeding
(Bayer et al., 2017) where the same panel of SNPs is repeatedly                   environment. Data quality control (QC) and error checking is
assayed for variation across all experiments and all germplasm.                   consistent and straightforward. However, SNP-arrays suffer from
Semi-open systems are typified by RAD-seq (Miller et al., 2007),                  ascertainment issues (Moragues et al., 2010), are species specific
DArTseq (Kilian et al., 2012) or genotyping-by-sequencing                         and therefore need to be developed independently for each
(GBS, Elshire et al., 2011). These are similar in nature and                      crop. Their development and testing can be lengthy requiring
assay new variation in each different set of genetic material                     considerable prior knowledge and adding new SNPs to the
analyzed. They have been widely adopted by plant genetics and                     platform is difficult and expensive. Even after development, the
ecological communities largely due to their generic nature and                    service cost of a single genotyping assay is widely considered to
low establishment costs. We use the term semi-open because all                    exceed that of GBS.
typically involve a genome complexity reduction step, in GBS                         Given that both approaches appear to have certain advantages
for example through use of methylation sensitive restriction                      we were keen to critically explore how they each performed in a
enzymes to selectively avoid highly repetitive genomic regions                    suitably sized comparative experiment focused on the evaluation
(thus introducing bias), and then short read next generation                      of a diverse barley germplasm collection. We also wanted to
sequencing of the regions adjacent to the cleaved restriction                     explore their affinity for subsequent applications of the derived
sites. Their increasing popularity stems from them being species                  data, such as candidate gene identification using population-
and sequencing platform agnostic, as well as being considered                     based approaches. We consider these questions important not
fast, cheap and informative (Lu et al., 2015). However, they                      only in our own research programs and in those of the barley
are notorious for generating noisy data. At lower sequence                        genetics community, but for comparative purposes we were
depth, GBS data includes a large fraction of missing data which                   keen to carefully establish the level of concordance between
requires imputation and sometimes complex computational                           different data types. This is an important and fundamental
interpretation prior to subsequent analysis.                                      question given that large germplasm characterization projects
    Our primary interests focus on the biology of barley (Hordeum                 are currently being undertaken by the plant genetics community
vulgare ssp. vulgare and ssp. spontaneum), a large genome (∼5                     (e.g., Lu et al., 2015; Yu et al., 20162 ) and these are dominated
Gbp) inbreeding diploid (2n = 2x = 14) species that was one of                    by the use of semi-open systems, mainly GBS. We wanted to
the worlds’ first domesticated crop plants (Snape et al., 2013).                  understand and clarify the advantages and caveats associated
Along with large sections of the barley genetics community,                       with each platform and the resulting data types and ask whether
for the last 15 years we have generally favored the application                   the overall values afforded by one approach outweighed those
of robust SNP-based assay platforms (in our case developed                        of the other. We were motivated to do this by the recent
by Illumina) for high throughput genotyping requirements                          genotypic characterization of the entire 22,000 genotypes in
(Close et al., 2009; Comadran et al., 2012). The most recent                      the IPK Gatersleben barley GenBank collection (Milner et al.,
iteration of this platform is a 50K iSelect custom genotyping                     2019) that was achieved using the widely adopted PstI-MspI GBS
array (Bayer et al., 2017) which includes SNPs selected from a                    protocol (Wendler et al., 2014). The use of GBS for ‘germplasm
combination of previously informative ‘legacy’ Illumina platform                  genomics’ could be considered a surrogate for whole genome
SNPs (for backward compatibility), supplemented with a large
cohort derived from comprehensive exome capture sequence                          1
                                                                                    https://www.illumina.com/content/dam/illumina-marketing/documents/
data (Russell et al., 2016). They were chosen to represent the                    products/technotes/technote_iselect_design.pdf
range of diversity observed in domesticated barley (landraces and                 2
                                                                                    http://seedsofdiscovery.org/

Frontiers in Plant Science | www.frontiersin.org                              2                                             April 2019 | Volume 10 | Article 544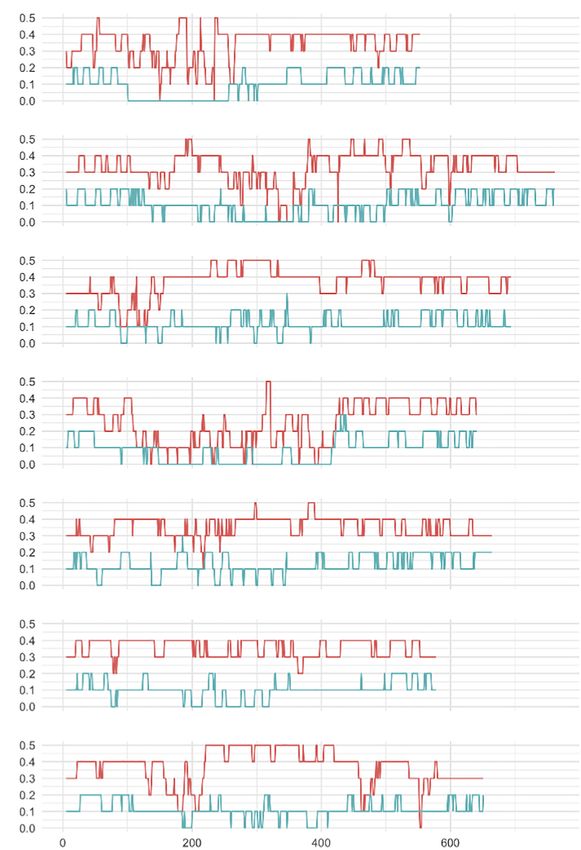
Darrier et al.                                                                                                                       SNP-Array vs. GBS

(shotgun) sequencing (WGS), which at the moment at least, is              SNP Genotyping and Analysis
not considered financially feasible in large genome crops like            We used exactly the same GBS dataset described by Milner
maize (∼2.5 Gbp), barley (∼5 Gbp), and wheat (∼17 Gbp), in                et al. (2019) and exactly the same DNAs as used in that
contrast to rice (∼370 Mbp, Wang et al., 2018) and Arabidopsis            study were submitted for SNP genotyping using the barley
(∼135 Mbp, The 1001 Genomes Consortium, 2016). This is                    Illumina 50K iSelect SNP platform (Bayer et al., 2017). The
because the latter genomes are suitably compact for WGS to be             GBS SNP matrix of Milner et al. (2019) is accessible from
affordable, and for rice in particular, the importance of the crop        https://doi.ipk-gatersleben.de/DOI/ecfbdb3d-4882-406c-9e82-
sufficiently great to justify the ‘gold standard’ investment.             7758ed5395c7/4f58176f-4824-4c32-bca1-3d87500d82f3/2. The
    When GBS was becoming popular in the plant community,                 filter criteria for inclusion of GBS SNPs used by Milner et al.
we evaluated the PstI-MseI GBS protocol in a study aimed at               (2019) were: (i) up to 10% missing genotype calls; (ii) up to 10%
mapping the barley breviaristatum-e (dwarfing) locus in a bi-             heterozygous calls; and (iii) the number of heterozygous calls
parental recombinant inbred line (RIL) population (Liu et al.,            does not exceed the number homozygous minor allele counts.
2014). In that work, after highly conservative and rigorous                   For the 50K data, prior to sample submission, DNA
filtering to remove missing data, low MAF, dominant/null and              quality was assessed using a Nanodrop 2000 (Thermo Fisher
heterozygous SNPs, we ended up with a total of 1,949 robust               Scientific, Waltham, MA, United States) with a requirement
and co-dominant markers that could be confidently used for                for 260/280 and 260/230 ratios to be > 1.8. DNA was then
genetic analysis. Analysis of the same population with the recent         quantified using Picogreen (Thermo Fisher Scientific, Waltham,
50K SNP-array revealed 14,626 robust SNP allele calls (Bayer              MA, United States) and 300 ng DNA per sample lyophilized
et al., 2017), on the face of it a significant improvement on             and sent to Geneseek (Neogen Europe, Ltd., Auchincruive,
marker number, which subsequently provided improved genetic               United Kingdom) for Illumina HTS processing and HiScan array
resolution. While possible explanations for this could be our             imaging (Illumina, San Diego, CA, United States). SNP alleles
conscious bias in SNP ascertainment when developing the 50K               were called using GenomeStudio Genotyping Module v2.0.2
array, or reflect the quality and depth of our GBS data, we               (Illumina, San Diego, CA, United States) and the resulting data
considered the extent of this numerical discrepancy further               investigated and analyzed as previously reported for 9K Illumina
motivation for the current investigation.                                 data (Milne et al., 2010; Comadran et al., 2012). The physical
    As a result, the primary questions we address here are: how           positions of both GBS and 50K SNPs were assigned by BLAST
do these platforms, generic GBS and a species-specific SNP-               (Altschul et al., 1990) according to their position on the 2017
array, perform in relative terms in barley, how concordant are            barley genome assembly (Mascher et al., 2017).
the outputs, how easy are they to compare between datasets
and labs, are there clear cases where one approach provides               Genetic Analyses
significant advantages over the other, and what are realistic cost        Both the GBS and SNP-array genotyping matrices were formatted
comparators? We believe that the answers to these and other               for analysis using PLINK1.93 (Chang et al., 2015). Flags: –maf
questions will be important for both ourselves and others in              was used to compute minor allele frequency value and extract
the barley community who may tend to favor one technical                  selected SNPs; –geno was used to extract SNPs with less than
approach over another. It is also a critical evaluation of how            the desired percentage of missing values; –pca was used to
different data types are being assessed and interpreted in similar,       compute principal components analysis (PCA) with the var-
ongoing studies throughout the plant community. We used                   wts option to extract variant weight; and the –recode flag to
the same PstI-MspI GBS dataset described in Milner et al.                 create the VCF file to compute π in Vcftools (Danecek et al.,
(2019) and the representative diversity sub-set of 1,000 of the           2011). Sliding window analyses were performed using an in-
>22,000 barley genotypes described in their recent IPK GenBank            house Perl script ‘plotDensity,’ obtained from F. Choulet (INRA
study. We genotyped these 1000 lines with the barley 50K                  Clermont Ferrand) with the following parameters: a window of
iSelect array and used the resulting datasets as the basis for            10 Mbp and a step of 1 Mbp. D0 and R2 were computed with
our evaluations.                                                          snpStats R package (Clayton, 2017) and all figures were generated
                                                                          using the R environment with ggplot3 packages (Wickham, 2016).
                                                                          Genome-wide association scan (GWAS) analysis was conducted
MATERIALS AND METHODS                                                     using the compressed mixed linear model (Zhang et al., 2010)
                                                                          implemented in the GAPIT R package (Lipka et al., 2012; Tang
Genetic Materials: 1,000 Genotype Set                                     et al., 2018). The phenotypic data were also the same as used
Selection of a core set of 1,000 genotypes from an extended               in Milner et al. (2019) except for the categorical scores for
collection of 22,626 genotypes lodged in the German Federal               growth habit (winter vs. spring) which were prior genotype
ex situ GenBank hosted at IPK Gatersleben was done exactly                classifications. The FDR-corrected p-values were used to draw
as described by Milner et al. (2019), based on GBS data with              Manhattan plots using qqman R package (Turner, 2014). We
CoreHunter33 and the average entry-to-nearest-entry criterion.            used the first three principal components (PC’s) in the GWAS
It was done after analysis of population structure and genetic            model for population correction. A Mantel test for correlation
similarity, and imputation of missing values in the GBS genotype          between distance matrices computed from GBS and 50K data
matrix using FILLIN with default parameters (Swarts et al., 2014;
Milner et al., 2019).                                                     3
                                                                              COREHUNTER3 http://www.corehunter.org

Frontiers in Plant Science | www.frontiersin.org                      3                                               April 2019 | Volume 10 | Article 544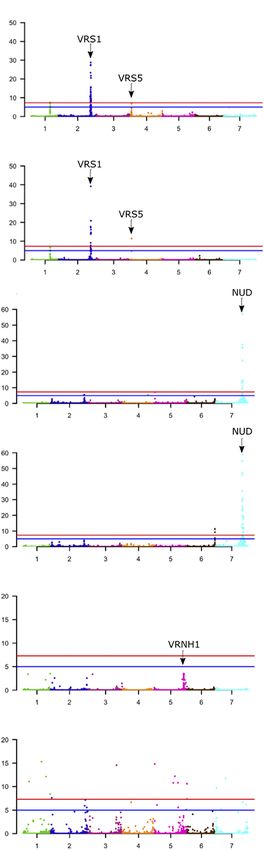
Darrier et al. SNP-Array vs. GBS
was performed using mantel.rtest function of the R package chromosome for both datasets were broadly similar, with only
ade4. Allele counts and frequencies were verified using in- two differences apparent on the short arms of chromosomes 4H
house python script. and 5H where the SNP density was higher on the 50K dataset
Discriminant analysis of principal component (DAPC) was (Supplementary Figure S1).
conducted as described in Jombart and Collins (2015). First, Both datasets revealed a high number of markers in the
clusters were identified using find.clusters function. According of distal regions of each chromosome decreasing markedly in the
the results of the PCA, k = 3 (GP1, GP2, and GP3) was chosen, peri-centromeric/centromeric regions. As this could be biased
and 400 axes (n.pca, accounting for > 80% of the cumulative due to the distribution of genes, we partitioned our analysis
variance) retained for the discriminant analysis. The latter was according to genic and intergenic markers. In accordance with
run using the function dapc with all of the retained eigenvalues. the origin of the information for the 50K assay being from
Cluster assignation was used to create subpopulations. Fst exome capture data we observed a large number of SNPs in
estimates between subpopulations were calculated according to genic regions, with 72% (28,875) associated with genes and
Weir and Cockerham (1984). Regions of genetic differentiation present at higher density in the gene-rich distal regions of each
between subpopulations was displayed as Manhattan plots based chromosome (Supplementary Figure S1). In contrast, the GBS
on −1/log10 Fst values of individual markers plotted linearly dataset showed a reduced representation with 52% (19,436) of
along each chromosome according to physical position. SNPs in genic regions, generating more of a balance between
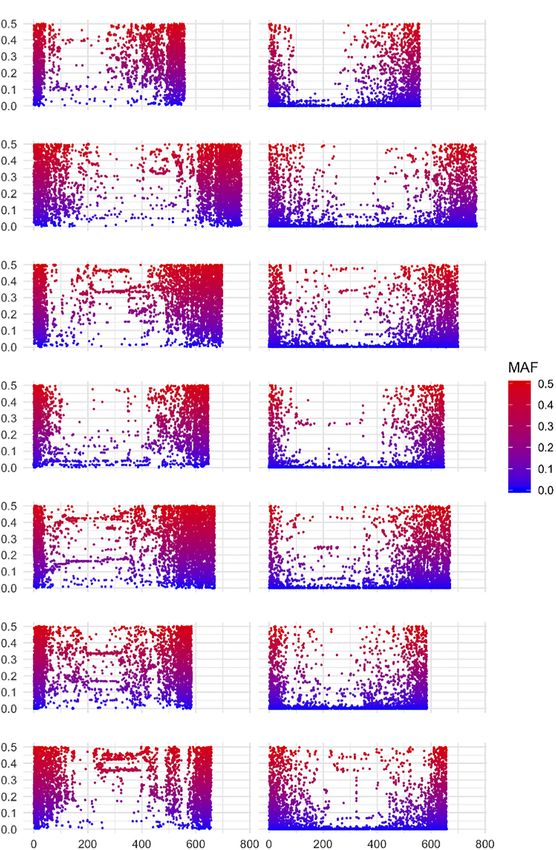
genic and intergenic SNPs. With both platforms, as expected,
gene associated markers remain more frequent in the distal parts
RESULTS of all chromosome arms, a feature that was especially apparent in
the 50K dataset.
SNP Metrics
Among the 43,461 scorable assays on the 50K SNP-array in this Allele Frequencies and Diversity
experiment we extracted 42,300 (96%) robust and polymorphic Statistics
SNPs after examination of genotype clusters in GenomeStudio. A striking difference between datasets was the high proportion
For comparison, the GBS genotype matrix was comprised of the of GBS markers associated with a low minor allele frequency
37,327 high quality polymorphic bi-allelic GBS SNPs described (MAF) compared to the 50K dataset. The percentage of markers
in Milner et al. (2019). We removed 2,567 SNP in the 50K with a MAF < 1 or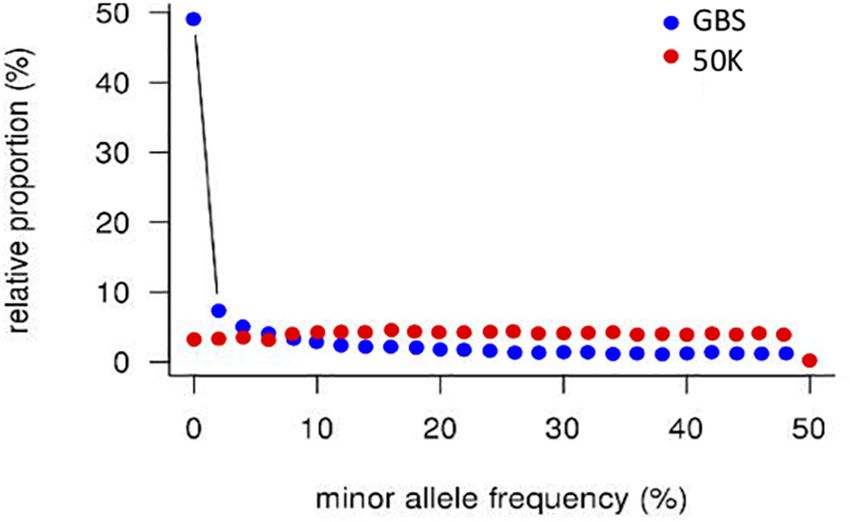
Darrier et al.                                                                                                                         SNP-Array vs. GBS

                                                                                 having a winter growth habit. Overall, the results of PCA on
                                                                                 GBS and 50K data were concordant, and the correlation of
                                                                                 genetic distance matrices was high (r = 0.62, p = 0.0001; 99
                                                                                 permutations, Mantel test).

                                                                                 Genome-Wide Association Scans
                                                                                 One obvious application of high throughput genetic
                                                                                 characterization of germplasm collections is to explore the
                                                                                 possibility of using the data for trait related gene identification
                                                                                 using population genetic approaches. Here, we chose GWAS
                                                                                 initially to investigate two of the traits analyzed by Milner et al.
                                                                                 (2019) (row-type, naked hull) along with binary scores for
                                                                                 seasonal growth habit. In all cases we used legacy phenotypic
                                                                                 data and compared the output from 50K and GBS datasets
  FIGURE 1 | Distribution of minor allele frequencies in GBS and 50K array       (Figure 5 and Supplementary Figure S2). Given the virtual
  data. SNP counts were aggregated in 2% bins.                                   exclusivity of the different marker types we wanted to establish if
                                                                                 the same regions of the genome were identified using different
                                                                                 markers and whether one marker type consistently provided
likely reflecting the 50K chip design strategy that prioritized                  higher resolution or greater support than the other. We chose
markers with MAFs of > 5% in the SNP ascertainment (i.e.,                        these traits because at least some of the causal genes are
landrace and cultivar) genepool. Finally, we examined the degree                 well-established.
of polymorphism along each chromosome within the population                          First, for row-type we detected three significant associations
revealed by each marker type by calculating the nucleotide                       in both datasets (Figure 5A). Those on chromosome 2H were
diversity statistic π (Nei and Li, 1979). Along all chromosomes                  close (∼650 kbp away in each case) to the major row-type gene
the 50K SNP chip data consistently revealed higher levels of                     SIX ROWED SPIKE1 (HvVRS1, Komatsuda et al., 2007) which
diversity than GBS (Figure 3), presumably reflecting the low                     is both necessary and sufficient to induce the two to six row
MAF of the latter.                                                               inflorescence conversion in cultivated barley. Those on 4H were
                                                                                 close to the modifier of lateral spikelet fertility gene HvVRS5 (syn.
Overall Patterns of Genetic Diversity                                            INTERMEDIUM-C, Ramsay et al., 2011) which is epistatic to
As the SNPs on the 50K chip were largely ascertained from                        HvVRS1. In this case GBS outperformed the 50K chip in terms
the European domesticated gene pool (cultivars and landraces),                   of resolution (closest marker 1.3 vs. 223 kbp from the target gene
we expected that its use across a wider spectrum of material                     respectively). As in Milner et al. (2019) we also detected a highly
may reveal biases associated with the origin of the data used                    significant association on chromosome 1H. This is distinct from
in its design. We were therefore keen to investigate the degree                  the HvVRS3 gene (Bull et al., 2017; van Esse et al., 2017) which
of concordance between data generated by the ‘closed’ 50K                        also maps on chromosome 1H. It falls in a region with several
platform with that from the semi-open GBS approach. To                           strong inflorescence development candidate genes (Schnurbush
assess how each platform performs in diversity analyses we ran                   et al., personal communication).
PCAs using the 39,733 (50K) and 37,327 (GBS) SNP marker                              Second, in both wild barley and the majority of domesticated
datasets (Figure 4). We initially compared three different analysis              types, the awn-bearing lemma is firmly bound to the grain
softwares, SNPRelate (Zheng et al., 2012), Eigensoft6 (Price                     through a lipid-based cementing layer between the caryopsis and
et al., 2006), and PLINK1.9 (Chang et al., 2015) in each case                    lemma (Taketa et al., 2008). Driven largely for use as food either
partitioning the diversity into 10, 20, 32, and 50 PC’s. All gave                during or soon after domestication, over time individuals were
virtually identical results with the percentage variation explained              selected where the tough and fibrous hull separated easily from
by the first PC’s decreasing as the number of PC’s increased.                    the harvested grain. These so-called naked barleys carry a loss-
As the spatial distribution of the individuals over the first 3                  of-function allele in the NUDUM (HvNUD) gene, an ethylene
PC’s was otherwise maintained in each treatment of the data,                     response factor required to promote formation of the cementing
we report here only the results from using PLINK1.9 and                          layer. Using lemma adherence to the grain as a binary character
the first 20 PC’s. In this analysis the first two PC’s explained                 we again performed a GWAS with each marker type. The most
together 44.3% of the variance for the 50K array and 33.71%                      highly associated marker on the 50K SNP-array was some 44 kbp
of the variance for GBS (Figure 4). Both datasets show that                      distal to NUD on chromosome 7H, compared to 1,831 kbp in
PC1 broadly separates eastern and western barleys, defining two                  the GBS marker set. However, the GBS marker set had more
distinct genetic pools. PC2 was more, but not exclusively related                supporting markers and identified a second locus at the bottom of
to the differentiation between 2-row and 6-row inflorescence                     chromosome 6H. This locus was also above the threshold p-value
architectures and explained a lower level of variation in the                    in the 50K dataset, but below the adjusted FDR. This region along
GBS data (9.58%) compared to the 50K (19.59%). PC2 is                            with two others on the top and bottom of 2H in both datasets and
also correlated with different growth habits in the western                      top of 5H in the 50K dataset may be worthy of further exploration
barley material with the vast majority of the six row-types                      as modifiers of the naked phenotype.

Frontiers in Plant Science | www.frontiersin.org                             5                                          April 2019 | Volume 10 | Article 544
Darrier et al. SNP-Array vs. GBS FIGURE 2 | Minor allele frequencies according to physical location of markers along barley chromosomes. (A–G) 50K SNP-array data for chromosomes 1H–7H top to bottom respectively (left panel) and (H–N) GBS data chromosomes 1H–7H top to bottom respectively (right panel). SNPs are color coded according to MAF. Frontiers in Plant Science | www.frontiersin.org 6 April 2019 | Volume 10 | Article 544
Darrier et al.                                                                                                                                 SNP-Array vs. GBS

  FIGURE 3 | Sliding window analysis of genetic diversity (π ) (A–G) seven barley chromosomes 1H–7H respectively. Red, 50K data; Blue, GBS data.

Frontiers in Plant Science | www.frontiersin.org                                7                                               April 2019 | Volume 10 | Article 544
Darrier et al.                                                                                                                               SNP-Array vs. GBS

  FIGURE 4 | Principal coordinates analysis. (A,C,E) Shows diversity revealed by the 50K SNP-array and (B,D,F) by GBS. (A,B) Shows genotypes color coded
  according to geographical origin, (C,D) according to growth habit and (E,F) according to row-type.

Frontiers in Plant Science | www.frontiersin.org                               8                                              April 2019 | Volume 10 | Article 544
Darrier et al.                                                                                                                               SNP-Array vs. GBS

                                                                                   FIGURE 5 | Continued
                                                                                   (B,D,F) Use GBS data. (A,B) Data for row-type, (C,D) non-adhering hull, and
                                                                                   (E,F) seasonal growth habit. Horizontal red line = –log10(5e-8), Horizontal
                                                                                   Blue line = –log10(1e-5). The location of known genes associated with each
                                                                                   trait is indicated. Y-axis; −log10(p) values.

                                                                                      Third, we took the same approach to explore growth habit
                                                                                  (flowering dependent upon a period of vernalization) using
                                                                                  both marker types and a categorical classification of winter
                                                                                  versus spring growth type. We observed a single well-supported
                                                                                  (i.e., multiple significant SNPS) association on chromosome 5H
                                                                                  [−log10 (p)∼8.0] in the 50K dataset some 29 kbp from the
                                                                                  vernalization gene HvVRN1 (von Zitzewitz et al., 2005). In
                                                                                  the GBS dataset, we found 29 more significant but less well-
                                                                                  supported single SNPs broadly distributed across the genome
                                                                                  with −log10(p) values of > 8 to < 20. Surprisingly none
                                                                                  convincingly co-located with the HvVRN1 50K peak, with the
                                                                                  closest of 8 markers distributed across 5H chromosome with
                                                                                  −log10(p) > 8 some 50 Mbp from the VRNH1 locus. Based on
                                                                                  this small dataset we conclude that both platforms, in general
                                                                                  terms, perform equally well with any differences being trait-
                                                                                  specific (Table 2). Combining both datasets for GWAS may be
                                                                                  expected to enhance the likelihood of detecting trait-specific
                                                                                  significant and real associations.

                                                                                  Discriminant Analysis of Principal
                                                                                  Components (DAPCs)
                                                                                  To explore genetic drivers of the observed population structure
                                                                                  we used DAPC (Jombart et al., 2010), a multivariate approach
                                                                                  that identifies clusters of genetically related individuals based on
                                                                                  genetic data and the contribution that individual factors (SNP
                                                                                  alleles) make to the observed population subdivision. For each
                                                                                  marker type the first two PC’s clearly distinguish three major
                                                                                  groupings (GP1-GP3) (Supplementary Figure S3). Comparing
                                                                                  the cluster assignment of individuals from DAPC highlighted
                                                                                  30 individuals that appeared to be discordant between the
                                                                                  datasets and these were removed for further analysis. Of
                                                                                  the concordant individuals, 459 fell into group1 (GP1), 246
                                                                                  into GP2 and 265 into GP3 (Supplementary Figure S3 and
                                                                                  Supplementary Table S1). GP1 was comprised of mainly (92%)
                                                                                  6-row genotypes exhibiting both spring and winter growth habit
                                                                                  and were classified as a combination of landraces and cultivars
                                                                                  from across the geographical range (Supplementary Figure S4).
                                                                                  GP2 was principally (78,5%) 2-row spring type landraces and
                                                                                  cultivars from across the geographical range (Supplementary
                                                                                  Figure S5) and GP3 (75,5%) six row spring types mainly from
                                                                                  Asia (Supplementary Figure S6).
                                                                                      In addition to DAPC loading plots (Jombart et al., 2010,
                                                                                  data not shown) we calculated Fst statistics independently
                                                                                  for each marker between groups (GP1/GP2, GP1/GP3, and
                                                                                  GP2/GP3) and displayed the resulting data as Manhattan plots in
                                                                                  order to illustrate the drivers of differentiation (Supplementary
                                                                                  Figure S7). Overall patterns generally appear similar from
  FIGURE 5 | Genome-wide association scans (GWASs) of phenological traits         both datasets, with more support (markers) for differentiated
  segregating in the 1000 core population. (A,C,E) Use the 50K array data.
                                                                (Continued)
                                                                                  regions in the 50K dataset most likely a result of the number
                                                                                  of markers included in the analysis. Between GP1 and GP2

Frontiers in Plant Science | www.frontiersin.org                              9                                               April 2019 | Volume 10 | Article 544
Darrier et al. SNP-Array vs. GBS
TABLE 2 | Genetic resolution of GWAS for row-type, growth habit, and hull adherence.
Traits Associate SNP Chr Position Technology Gene Minimum distance in bp
Row- type JHI-Hv50k-2016-107445 2H 651,372,755 50K VRS1 657,881
2:651372029 2H 651,372,029 GBS 658,607
JHI-Hv50k-2016-231001 4H 17,377,068 50K INT-C 223,056
4:17598761 4H 17,598,761 GBS 1,363
Growth habit JHI-Hv50k-2016-335893 5H 598,787,735 50K VrnH1 339,089
5:648520473 5H 648,520,473 GBS 49,391,201
Grain Hull JHI-Hv50k-2016-491472 7H 546,632,335 50K NUD 44,963
7:548419008 7H 548,419,008 GBS 1,831,636
that contrast mainly for row-type we observed strong signals for each informative bi-allelic SNP is significantly lower for
of differentiation around the row-type genes HvVRS1 (2H) barley using the 50K SNP chip (ca. 1/3 of the cost). Note
and HvVRS5 (4H) and a complex region on chromosome 1H however that this cost comparison excludes the considerable
flanked by the same locus observed in the GWAS analysis for investment required for the development and fabrication of a
row-type (Figures 5A,B). A signal was also observed near the high-quality SNP-array and that all quoted costs are subject to
photo-period response gene HvPPDH2 (Turner et al., 2005). For fluctuations over time.
GP1 and GP3 that contrast mainly by geographical origin, the
Fst revealed a complex set of highly significant signals largely
unrelated to known major genes, with the possible exception of DISCUSSION
HvVRNH1 on chromosome 5H and HvCEN on 2H that may stem
from the mixed growth habits of the individuals in GP1. GP2 The application of DNA based genotypic analyses to efficiently
and GP3 differ largely according to row-type and geographical study genetic diversity in populations of plants underpins
origin and once again revealed complex signals, including those contemporary genetic analyses from germplasm evaluation,
close to HvVRS1, HvVRS5, HvVRNH1, and HvCEN that may high-resolution genetic mapping and genomic prediction. If
be expected to differentiate these groups. In all comparisons a simple pre-requisite is for the genetic data generated to
there was very strong support for differentiation between groups be robust, reproducible and long lived then it is important
at a tractable number of highly specific genomic regions that, that we understand the comparative values and features of
based on our regional gene content analysis, do not contain different genotyping approaches. Here, we set out to compare
well-known or characterized candidate genes which are ripe for two popular methods for genotypic analysis of plants, PstI/MspI
further investigation. GBS and Illumina InfiniumTM SNP-array technology, seeking to
understand how they performed on a common set of 1000 diverse
Relative Costs barley genotypes. When we started this piece of work we were
A widely held opinion in the plant research community is that unaware of any similar comparison having been conducted at
GBS is considerably cheaper than SNP-arrays. We were therefore a comparable scale and reported in the scientific literature. The
interested to compare the relative costs of each technology 1000 barley genotypes that we examined originated from the
when applied to exactly the same set of genetic materials. In German Federal ex situ GenBank hosted at IPK Gatersleben and
our analyses (conducted in the United Kingdom) the cost of represented the breadth of diversity from across the range of the
genotyping a single accession with the barley 50K SNP chip species. GenBanks are vitally important international germplasm
through a commercial vendor is £40 per sample (January 2019). resources and given the considerable long-term investment they
On the basis of the experiment reported here this returned represent, it is important that we understand whether their
approximately 37,000 high quality markers, the vast majority characterization using one molecular approach (in this case
with a MAF > 5% and therefore suitable for most common GBS) provides an accurate overall reflection of genetic diversity.
types of genetic analyses. PstI/MspI GBS can also be provided as A detailed description of the 1000 genotypes and how they were
a commercial service at a current cost of £60.50 per genotype identified and chosen as a core set is given in Milner et al.
(January 2019) based on a 1,000-sample size. We presume (2019) and a description of the design of the 50K SNP-array is
that these cover all necessary operational costs including staff, provided in Bayer et al. (2017).
supplies, the original purchase and annual maintenance of Starting with collections of 39,733 and 37,327 high quality
necessary instrumentation, and in the case of GBS a license for SNPs distributed across the barley genome for 50K SNP-array
commercial use3 , but excludes other than basic data analysis. At and GBS datasets respectively, a number of features immediately
this moment in time we consider this a realistic comparison. became apparent. Firstly, the overlap between the datasets was
As the number of informative bi-allelic SNPs with MAF > 5% restricted to 464 common markers highlighting the different
observed in the current GBS study is approximately half of that type of sequences accessed by each approach. While the 50K
revealed by the 50K platform (following Milner et al., 2019), SNPs were derived from exome capture data and therefore
we conclude that for applications requiring this MAF, the cost focused on coding sequence variation, the GBS data represents a
Frontiers in Plant Science | www.frontiersin.org 10 April 2019 | Volume 10 | Article 544Darrier et al. SNP-Array vs. GBS
wider survey of diversity in low copy genomic regions that are the ascertainment of SNPs on each array (e.g., the barley array
associated with low levels of DNA methylation. Although the used a larger and wider ascertainment dataset than the wheat
latter regions may include many genes, our data indicates that array) (Moragues et al., 2010), the polyploid nature of the wheat
the same SNPs are rarely sampled. Much gene level variation genome, and the distribution of SNPs across the recombination
therefore appears to be excluded from the comparison. Secondly, landscape of the respective genomes.
applying MAF cutoff thresholds of 0.05). In their study, a Mantel test comparison of ideally require high coverage (low missing data) information
genetic diversity matrices revealed a strong positive correlation from representative haplotype panels or very large datasets
(r = 0.77; p-value < 0.0001; 1000 permutations) between the (numbers of individuals) to ensure haplotype generation and
two datasets and PCAs revealed a similar topography across imputation is accurate, particularly as it’s impossible to impute
the main PC’s. Comparing the performance of SNP-arrays and minor alleles correctly if they are not replicated anywhere else in
GBS for genomic selection revealed that GBS data with up to the overall population. While this may be straightforward for very
50% missing values improved genomic prediction accuracies large sample sets in a single study, our impression is that making
and estimated breeding values for four traits when compared subsequent comparisons to much smaller datasets conducted in
to both SNP-arrays and, somewhat curiously, GBS SNPs with a different lab with different germplasm and different filtering
only 10% missing values. These observations led the authors criteria/software may not be completely straightforward. An
to conclude that GBS (with more missing data) is comparable advantage of the 50K chip lies in its robustness and the simple
to or better than SNP-array data for both genetic diversity and comparability of data generated in independent studies.
genomic prediction applications. The authors also commented Missing data and bad calls are also observed on even the
that while SNP-arrays are reliable, robust marker platforms with best SNP chips and can similarly be the result of technical
low missing values, they have relatively high costs. However, or biological factors such as the presence of close sequence-
a realistic cost comparison between the two approaches was related paralogs, sequence polymorphisms in the assay footprint
not provided to support this assertion. There could be several
reasons for the discrepancies between these two studies, including 4
https://www.keygene.com/work-with-keygene/licensing/
Frontiers in Plant Science | www.frontiersin.org 11 April 2019 | Volume 10 | Article 544Darrier et al. SNP-Array vs. GBS
outside of the queried SNP causing the assay to fail, borderline types of questions we raised as motivation for the current study,
quality DNA or the presence of genuine PAVs. Runs of physically may soon become redundant.
adjacent missing datapoints in an otherwise technically sound
SNP chip assay or population-based quality filtering for SNaPs
(Gabur et al., 2018) can provide strong support for genuine PAV CONCLUSION
interpretation which can then be included in genetic analyses. We
identified 623 markers in the 50K dataset that recorded missing Both GBS and SNP-arrays efficiently sample the diversity present
data in more than 10% of the individuals (data not shown) in the domesticated barley genepool but access different regions
while all other markers exhibited robust calls throughout each of the genome and reveal different characteristics. Choice of
individual genome. While these are good PAV candidates, further technology should be carefully considered according to desired
work is required to distinguish which of the above explanations is applications and objectives, along with group preferences,
true. It would also be interesting to test whether their inclusion as available skills and infrastructure. Current commercial cost
rare variants in GWAS (i.e., as a second or third allele) improved comparisons question the widely held view that GBS is
the power to detect genetic components of complex traits in considerably cheaper than SNP-arrays, in barley at least.
barley, as recently shown in oilseed rape (Gabur et al., 2018).
We used two approaches to explore the use of each marker
dataset for identifying the location of genes underlying specific AUTHOR CONTRIBUTIONS
traits, GWAS and DAPC. Similar results were obtained for
GWAS with both marker types, perhaps with the exception RW, NS, JR, LR, and MMas conceived the study. BD, SM, PH,
of growth habit using GBS data which generated several PS, and MMac designed and coordinated the experiments and
poorly supported but highly significant associations. We also conducted the data analysis. NS, MMas, and SM chose and
explored DAPC because we had previously and successfully provided the germplasm. MMac and PH performed the lab
used this approach to investigate the discrimination between the experiments. RW, BD, JR, NS, and MMas wrote the manuscript,
genetically narrow spring and winter 2-row elite NW European while CH, DF, and PL critically reviewed it.
genepools (Comadran et al., 2012). The results revealed signals
associated with genes that would be expected to differentiate
the genepools (Supplementary Figure S7). Perhaps more
FUNDING
significantly, the analysis also highlighted a tractable number of This research was supported by the UK BEIS (Department for
highly significant signals for which no current causal gene has Business, Energy & Industrial Strategy) via a Universities UK
been identified. While these are ripe for further investigation, this International Rutherford Fund Strategic Partner Grant No. RF-
is outside the scope of the current report. 2018-30 to CH and RW and the ERC project 669182 ‘SHUFFLE’
The use of SNP-arrays and GBS has already started to to RW. We acknowledge funding from ARC project No:
give way to (low coverage) whole genome shotgun sequencing DP170103975 to PL, RW, and BD, and the Leibniz Association
in small genome models and crops (Wang et al., 2018). We to NS and MMas (Pakt für Forschung und Innovation: SAW-
attribute this largely to the availability of high-quality reference 2015-IPK-1 ‘BRIDGE’). SM was supported by a Leibniz-
(pan)genome sequences and the generation of an appropriate DAAD fellowship from the German Academic Exchange service
depth of highly accurate sequence coverage that is easily (DAAD). RW, JR, PH, PS, LR, and MMac were supported by
attainable at today’s sequencing costs. However, for many of the Scottish Government Rural and Environment Science and
our major crops, especially those with large genomes, and Analytical Services WP2 (RESAS).
for many applications, we predict that genotyping methods
that efficiently and relatively cheaply sample relevant diversity,
like GBS and SNP chips, will remain methods of choice for ACKNOWLEDGMENTS
routine genetic analyses. For the intermediate sized 5 Gbp barley
genome, we suggest that sequencing costs would need to drop BD, DF, RW, and PL acknowledge The University of Adelaide,
by around an order of magnitude before whole genome shotgun CH and RW the University of Dundee, NS and MMas the
sequencing at an appropriate depth could be routinely used Leibniz Association and JR, MMac, PS, LR, and RW the Scottish
as a genotyping platform that is capable of robustly revealing Government RESAS Strategic research program for supporting
homo- and hetero-zygous loci. While this is clearly on the their participation in this research. BD acknowledges the award of
horizon, such a transition will require a fundamental shift in a Rutherford Fellowship. CH is a Royal Society Wolfson Research
the skills and infrastructure available throughout the community Merit Award holder.
(both fundamental and applied) to efficiently deconvolute and
interpret whole genome sequence data. In a well-resourced
research context, we argue the shift to whole genome survey SUPPLEMENTARY MATERIAL
sequencing is almost certainly attainable now, especially for
populations that are used repeatedly to address a wide range The Supplementary Material for this article can be found online
of different scientific questions (e.g., GWAS, MAGIC, or NAM at: https://www.frontiersin.org/articles/10.3389/fpls.2019.00544/
populations used by the academic community). If correct, the full#supplementary-material
Frontiers in Plant Science | www.frontiersin.org 12 April 2019 | Volume 10 | Article 544Darrier et al. SNP-Array vs. GBS
REFERENCES Miller, M. R., Dunham, J. P., Amores, A., Cresko, W. A., and Johnson, E. A.
(2007). Rapid and cost-effective polymorphism identification and genotyping
Altschul, S. F., Gish, W., Miller, W., Myers, E. W., and Lipman, D. J. (1990). Basic using restriction site associated DNA (RAD) markers. Genome Res. 17, 240–248.
local alignment search tool. J. Mol. Biol. 215, 403–410. doi: 10.1006/jmbi.1990. doi: 10.1101/gr.5681207
9999 Milne, I., Shaw, P., Stephen, G., Bayer, M., Cardle, L., Thomas, W. T. B., et al.
Bayer, M. M., Rapazote-Flores, P., Ganal, M., Hedley, P. E., Macaulay, M., Plieske, (2010). Flapjack – graphical genotype visualization. Bioinformatics 26, 3133–
J., et al. (2017). Development and evaluation of a barley 50k iselect SNP-array. 3134. doi: 10.1093/bioinformatics/btq580
Front. Plant Sci. 8:1792. doi: 10.3389/fpls.2017.01792 Milner, S. G., Jost, M., Taketa, S., Mazon, E. R., Himmelbach, A., Oppermann,
Bull, H., Casao, M. C., Zwirek, M., Flavell, A. J., Thomas, W. T. B., Guo, M., et al. (2019). Genebank genomics reveals the diversity of a global barley
W., et al. (2017). Barley SIX ROWED SPIKE3 encodes a putative Jumonji collection. Nat. Genet. 51, 319–326. doi: 10.1038/s41588-018-0266-x
C-type H3K9me2/me3 demethylase that represses lateral spikelet fertility. Nat. Moragues, M., Comadran, J., Waugh, R., Milne, I., Flavell, A. J., Russell, J. R., et al.
Commun. 8:936. doi: 10.1038/s41467-017-00940-7 (2010). Effects of ascertainment bias and marker number on estimations of
Chang, C. C., Chow, C. C., Tellier, L. C. A. M., Vattikuti, S., Purcell, S. M., and barley diversity from high-throughput SNP genotype data. Theor. Appl. Genet.
Lee, J. J. (2015). Second-generation PLINK: rising to the challenge of larger and 120, 1525–1534. doi: 10.1007/s00122-010-1273-1
richer datasets. GigaScience 4:7. doi: 10.1186/s13742-015-0047-8 Nei, M., and Li, W. (1979). Mathematical model for studying genetic variation in
Clayton, D. (2017). snpstats: SnpMatrix and XSnpMatrix Classes and Methods. R terms of restriction endonucleases. Proc. Natl. Acad. Sci. U.S.A. 76, 5269–5273.
Package Version 1.30.0. doi: 10.1073/pnas.76.10.5269
Close, T. J., Bhat, P. R., Lonardi, S., Wu, Y., Rostoks, N., Ramsay, L., et al. Price, A. L., Patterson, N. J., Plenge, R. M., Weinblatt, M. E., Shadick, N. A., and
(2009). Development and implementation of high-throughput SNP genotyping Reich, D. (2006). Principal components analysis corrects for stratification in
in barley. BMC Genomics 10:582. doi: 10.1186/1471-2164-10-582 genome-wide association studies. Nat. Genet. 38, 904–909. doi: 10.1038/ng1847
Comadran, J., Kilian, B., Russell, J., Ramsay, L., Stein, N., Ganal, M., et al. Ramsay, L., Comadran, J., Druka, A., Marshall, D. F., Thomas, W. T. B., Macaulay,
(2012). Natural variation in a homolog of Antirrhinum CENTRORADIALIS M., et al. (2011). INTERMEDIUM-C, a modifier of lateral spikelet fertility in
contributed to spring growth habit and environmental adaptation in cultivated barley, is an ortholog of the maize domestication gene TEOSINTE BRANCHED
barley. Nat. Genet. 44, 1388–1392. doi: 10.1038/ng.2447 1. Nat. Genet. 43, 169–172. doi: 10.1038/ng.745
Danecek, A. A., Abecasis, G., Albers, C. A., Banks, E., DePristo, M. A., Handsaker, Russell, J., Mascher, M., Dawson, I. K., Kyriakidis, S., Calixto, C., Freund, F.,
R., et al. (2011). The variant call format and VCFtools. Bioinformatics 27, et al. (2016). Adaptation of barley to different environments revealed in the
2156–2158. doi: 10.1093/bioinformatics/btr330 exomes of a range-wide collection of landraces and wild relatives. Nat. Genet.
Elbasyoni, I. S., Lorenz, A. J., Guttieri, M., Frels, K., Baenziger, P. S., Poland, J., 48, 1024–1030.
et al. (2018). A comparison between genotyping-by-sequencing and array-based Russell, J. R., Fuller, J. D., Macaulay, M., Hatz, B. G., Jahoor, A., Powell, W., et al.
scoring of SNPs for genomic prediction accuracy in winter wheat. Plant Sci. 270, (1997). Direct comparison of levels of genetic variation among barley genotypes
123–130. doi: 10.1016/j.plantsci.2018.02.019 detected by RFLPs, AFLPs, SSRs and RAPDs. Theor. Appl. Genet. 95, 714–722.
Elshire, R. J., Glaubitz, J. C., Sun, Q., Poland, J. A., Kawamoto, K., Buckler, E. S., doi: 10.1007/s001220050617
et al. (2011). A robust, simple genotyping-by-sequencing (GBS) approach for Snape, J. W., Powell, W., and Waugh, R. (2013). Hordeum Species. In Brenner’s
high diversity species. PLoS One 6:e19379. doi: 10.1371/journal.pone.0019379 Encyclopedia of Genetics, 2 Edn. Amsterdam: Elsevier Inc., 527–529.
Gabur, I., Chawla, H. S., Liu, X. W., Kumar, V., Faure, S., von Tiedemann, A., Swarts, K., Li, H., Romero Navarro, J. A., An, D., Romay, M. C., Hearne, S., et al.
et al. (2018). Finding invisible quantitative trait loci with missing data. Plant (2014). Novel methods to optimize genotypic imputation for low-coverage,
Biotechnol. J. 16, 2102–2112. doi: 10.1111/pbi.12942 next-generation sequence data in crop plants. Plant Genome 7. doi: 10.3835/
Jombart, T., and Collins, C. (2015). A Tutorial for Discriminant Analysis of plantgenome2014.05.0023
Principal Components (dapc) Using Adegenet 2.0.0. Available at: http://adegenet. Taketa, S., Amano, S., Tsujino, Y., Sato, T., Saisho, D., Kakeda, K., et al. (2008).
r-forge.r-project.org/files/tutorial-dapc.pdf Barley grain with adhering hulls is controlled by an ERF family transcription
Jombart, T., Devillard, S., and Balloux, F. (2010). Discriminant analysis of factor gene regulating a lipid biosynthesis pathway. Proc. Natl. Acad. Sci. U.S.A.
principal components: a new method for the analysis of genetically structured 105, 4062–4067. doi: 10.1073/pnas.0711034105
populations. BMC Genet. 11:94. doi: 10.1186/1471-2156-11-94 Tang, Y., Liu, X., Wang, J., Li, M., Wang, Q., Tian, F., et al. (2018). GAPIT Version
Kilian, A., Wenzl, P., Huttner, E., Carling, J., Xia, L., Blois, H., et al. (2012). Diversity 2: An enhanced integrated tool for genomic association and prediction. Plant
arrays technology: a generic genome profiling technology on open platforms. Genome 9, 2–9. doi: 10.3835/plantgenome2015.11.0120
Methods Mol. Biol. 888, 67–89. doi: 10.1007/978-1-61779-870-2_5 The 1001 Genomes Consortium (2016). 1,135 Genomes reveal the global pattern
Komatsuda, T., Pourkheirandish, M., He, C., Azhaguvel, P., Kanamori, H., of polymorphism in Arabidopsis thaliana. Cell 166, 481–491. doi: 10.1016/j.cell.
Perovic, D., et al. (2007). Six rowed barley originated from a mutation in a 2016.05.063
homeodomain-leucine zipper I-class homeobox gene. Proc. Natl. Acad. Sci. Turner, A., Beales, J., Faure, S., Dunford, R. P., and Laurie, D. A. (2005). The
U.S.A. 104, 1424–1429. doi: 10.1073/pnas.0608580104 pseudo-response regulator Ppd-H1 provides adaptation to photoperiod in
Lipka, A. E., Tian, F., Wang, Q., Peiffer, J., Li, M., Bradbury, P. J., et al. (2012). barley. Science 310, 1031–1034. doi: 10.1126/science.1117619
GAPIT: Genome association and prediction integrated tool. Bioinformatics 28, Turner, S. D. (2014). qqman: an R package for visualizing GWAS results using Q-Q
2397–2399. doi: 10.1093/bioinformatics/bts444 and manhattan plots. bioRxiv [Preprint]. doi: 10.1101/005165
Liu, H., Bayer, M., Druka, A., Russell, J. R., Hackett, C. A., Poland, J., et al. (2014). Uptmoor, R., Wenzel, W., Friedt, W., Donaldson, G., Ayisi, K., and Ordon, F.
An evaluation of genotyping by sequencing (GBS) to map the breviaristatum- (2003). Comparative analysis on the genetic relatedness of Sorghum bicolor
e (ari-e) locus in cultivated barley. BMC Genomics 15:104. doi: 10.1186/1471- genotypes from Southern Africa by RAPDs, AFLPs and SSRs. Theor. Appl.
2164-15-104 Genet. 106:1316. doi: 10.1007/s00122-003-1202-7
Lu, F., Romay, M. C., Glaubitz, J. C., Bradbury, P. J., Elshire, R. J., Wang, T., van Esse, G. W., Walla, A., Finke, A., Koornneef, M., Pecinka, A., and von Korff, M.
et al. (2015). High-resolution genetic mapping of maize pan-genome sequence (2017). Six Rowed Spike3 (VRS3) is a histone demethylase that controls lateral
anchors. Nat. Commun. 6:6914. doi: 10.1038/ncomms7914 spikelet development in barley. Plant Physiol. 174, 2397–2408. doi: 10.1104/pp.
Lubberstedt, T., Melchinger, A. E., Dußle, C., Vuylsteke, M., and Kuiper, M. 17.00108
(2000). Relationships among early european maize inbreds: IV. genetic diversity von Zitzewitz, J., Szűcs, P., Dubcovsky, J., Yan, L., Pecchioni, N., Francia, E., et al.
revealed with AFLP markers and comparison with RFLP, RAPD, and pedigree (2005). Molecular and structural characterization of barley vernalization genes.
data. Crop Sci. 40, 783–791. doi: 10.2135/cropsci2000.403783x Plant Mol. Biol. 59, 449–467. doi: 10.1007/s11103-005-0351-2
Mascher, M., Gundlach, H., Himmelbach, A., Beier, S., Twardziok, S. O., Wicker, Wang, W., Mauleon, R., Hu, Z., Chebotarov, D., Tai, S., Wu, Z., et al. (2018).
T., et al. (2017). A chromosome conformation capture ordered sequence of the Genomic variation in 3,010 diverse genotypes of Asian cultivated rice. Nature
barley genome. Nature 544:427. doi: 10.1038/nature22043 557, 43–49. doi: 10.1038/s41586-018-0063-9
Frontiers in Plant Science | www.frontiersin.org 13 April 2019 | Volume 10 | Article 544Darrier et al. SNP-Array vs. GBS Weir, B., and Cockerham, C. (1984). Estimating F-Statistics for the Zheng, X., Levine, D., Shen, J., Gogarten, S., Laurie, C., and Weir, B. Analysis of Population Structure. Evolution 38, 1358–1370. doi: 10.2307/ (2012). A high-performance computing toolset for relatedness and principal 2408641 component analysis of SNP Data. Bioinformatics 28, 3326–3328. doi: 10.1093/ Wendler, N., Mascher, M., Noh, C., Himmelbach, A., Scholz, U., Ruge-Wehling, bioinformatics/bts606 B., et al. (2014). Unlocking the secondary gene-pool of barley with next- generation sequencing. Plant Biotechnol. J. 12, 1122–1131. doi: 10.1111/pbi. Conflict of Interest Statement: The authors declare that the research was 12219 conducted in the absence of any commercial or financial relationships that could Wickham, H. (2016). ggplot2: Elegant Graphics for Data Analysis. New York, NY: be construed as a potential conflict of interest. Springer. Yu, X., Li, X., Guo, T., Zhu, C., Wu, Y., Mitchell, S. E., et al. (2016). Copyright © 2019 Darrier, Russell, Milner, Hedley, Shaw, Macaulay, Ramsay, Genomic prediction contributing to a promising global strategy to Halpin, Mascher, Fleury, Langridge, Stein and Waugh. This is an open-access article turbocharge gene banks. Nat. Plants 2:16150. doi: 10.1038/nplants. distributed under the terms of the Creative Commons Attribution License (CC BY). 2016.150 The use, distribution or reproduction in other forums is permitted, provided the Zhang, Z., Ersoz, E., Lai, C.-Q., Todhunter, R. J., Tiwari, H. K., Gore, M. A., et al. original author(s) and the copyright owner(s) are credited and that the original (2010). Mixed linear model approach adapted for genome-wide association publication in this journal is cited, in accordance with accepted academic practice. No studies. Nat. Genet. 42, 355–360. doi: 10.1038/ng.546 use, distribution or reproduction is permitted which does not comply with these terms. Frontiers in Plant Science | www.frontiersin.org 14 April 2019 | Volume 10 | Article 544
You can also read