Neural Mechanisms Underlying Individual Differences in Control-Averse Behavior - KOPS
←
→
Page content transcription
If your browser does not render page correctly, please read the page content below
Erschienen in: The Journal of neuroscience : the official journal of the Society for Neuroscience ; 38 (2018), 22. - S. 5196-5208
                                            https://dx.doi.org/10.1523/JNEUROSCI.0047-18.2018
5196 • The Journal of Neuroscience, May 30, 2018 • 38(22):5196 –5208

Behavioral/Cognitive

Neural Mechanisms Underlying Individual Differences in
Control-Averse Behavior
X Sarah Rudorf,1,2 Katrin Schmelz,3,4 Thomas Baumgartner,1,2 Roland Wiest,5 XUrs Fischbacher,3,4 and Daria Knoch1,2
1Department of Social Psychology and Social Neuroscience, Institute of Psychology, 2Center for Cognition, Learning and Memory, University of Bern, 3012
Bern, Switzerland, 3Department of Economics, University of Konstanz, 78464 Konstanz, Germany, 4Thurgau Institute of Economics, 8280 Kreuzlingen,
Switzerland, and 5Department of Neuroradiology, Inselspital, 3010 Bern, Switzerland

When another person tries to control one’s decisions, some people might comply, but many will feel the urge to act against that control.
This control aversion can lead to suboptimal decisions and it affects social interactions in many societal domains. To date, however, it has
been unclear what drives individual differences in control-averse behavior. Here, we address this issue by measuring brain activity with
fMRI while healthy female and male human participants made choices that were either free or controlled by another person, with real
consequences to both interaction partners. In addition, we assessed the participants’ affects, social cognitions, and motivations via
self-reports. Our results indicate that the social cognitions perceived distrust and lack of understanding for the other person play a key
role in explaining control aversion at the behavioral level. At the neural level, we find that control-averse behavior can be explained by
functional connectivity between the inferior parietal lobule and the dorsolateral prefrontal cortex, brain regions commonly associated
with attention reorientation and cognitive control. Further analyses reveal that the individual strength of functional connectivity com-
plements and partially mediates the self-reported social cognitions in explaining individual differences in control-averse behavior. These
findings therefore provide valuable contributions to a more comprehensive model of control aversion.
Key words: control aversion; decision making; fMRI; freedom; social cognition

      Significance Statement
      Control aversion is a prevalent phenomenon in our society. When someone tries to control their decisions, many people tend to act
      against the control. This can lead to suboptimal decisions such as noncompliance to medical treatments or disobeying the law. The
      degree to which individuals engage in control-averse behavior, however, varies significantly. Understanding the proximal mech-
      anisms that underlie individual differences in control-averse behavior has potential policy implications, for example, when
      designing policies aimed at increasing compliance with vaccination recommendations, and is therefore a highly relevant research
      goal. Here, we identify a neural mechanism between parietal and prefrontal brain regions that can explain individual differences in
      control-averse behavior. This mechanism provides novel insights into control aversion beyond what is accessible through self-reports.

Introduction                                                                                                                  freedom of choice, or in short control aversion, puts a strain on
When others try to control our decisions, many of us will feel the                                                            many societal domains, for example, in the form of patient non-
urge to counteract and thereby reestablish our valued freedom of                                                              compliance to psychiatric therapy (De las Cuevas et al., 2014),
choice. This aversive reaction to the exogenous control of one’s                                                              adolescent defiance against parents (Van Petegem et al., 2015), or
                                                                                                                              employees’ reduced work performance when faced with a restric-
                                                                                                                              tive employer (Falk and Kosfeld, 2006). Critically, the degree to
Received Jan. 9, 2018; revised March 20, 2018; accepted April 25, 2018.
                                                                                                                              which individuals engage in control-averse behavior varies largely,
   Author contributions: S.R. wrote the first draft of the paper; S.R., K.S., T.B., U.F., and D.K. edited the paper; S.R.,
K.S., T.B., U.F., and D.K. designed research; S.R. and R.W. performed research; S.R. analyzed data; S.R., K.S., T.B., U.F.,   which has been documented in numerous studies (Falk and Kosfeld,
and D.K. wrote the paper.                                                                                                     2006; Ziegelmeyer et al., 2012; Schmelz and Ziegelmeyer, 2015).
   This work was supported by the Mens Sana Foundation (D.K.).                                                                What drives these individual differences in control-averse behavior,
   The authors declare no competing financial interests.                                                                      however, has remained an open question.
   Correspondence should be addressed to either Sarah Rudorf or Daria Knoch, Department of Social Psychology and
Social Neuroscience, Institute of Psychology, University of Bern, Fabrikstrasse 8, 3012 Bern, Switzerland, E-mail:
                                                                                                                                  Previous work has shown that individuals whose decisions are
sarah.rudorf@psy.unibe.ch or daria.knoch@psy.unibe.ch.                                                                        controlled by another person often report thoughts about the
   DOI:10.1523/JNEUROSCI.0047-18.2018                                                                                         other person’s motives such as distrust and lack of understanding
Copyright © 2018 Rudorf et al.                                                                                                for the other person’s decision to control (Falk and Kosfeld, 2006).
   This is an open-access article distributed under the terms of the Creative Commons Attribution License
Creative Commons Attribution 4.0 International, which permits unrestricted use, distribution and reproduction in              For example, when an employer requests a minimum effort from
any medium provided that the original work is properly attributed.                                                            her employee, the employee may perceive this as a signal of dis-
                                                                                    Konstanzer Online-Publikations-System (KOPS)
                                                                            URL: http://nbn-resolving.de/urn:nbn:de:bsz:352-2-bipyzjwfunz2
Rudorf et al. • Neural Mechanisms of Control-Averse Behavior                                                 J. Neurosci., May 30, 2018 • 38(22):5196 –5208 • 5197

trust in her intrinsic work motivation. A separate line of work has         received a compensation of CHF 50 (⬇50 USD) for participation in the
highlighted the motivation to restore one’s freedom of choice,              study in addition to the payoff from the control aversion task described in
termed reactance, as the key player in driving control-averse be-           the next section. The study was approved by the Bern Cantonal Ethics
havior (Brehm, 1966; Miron and Brehm, 2006). For example, the               Commission and all participants gave informed, written consent.
elimination of a choice option can lead to an increased desire for
that option, which is interpreted as an indirect strategy of free-          Experimental design
dom restoration (Miron and Brehm, 2006). Moreover, reactance                Control aversion task. The control aversion task (see Fig. 1) is designed to
is assumed to be accompanied by negative affects such as anger              confront subjects with real restrictions of their freedom of choice by
                                                                            another person and is based on previous work in behavioral economics
(Dillard and Shen, 2005). Therefore, negative affects and individ-
                                                                            (Falk and Kosfeld, 2006; Schmelz and Ziegelmeyer, 2015). The gist of the
ual tendencies to express one’s anger outward might contribute
                                                                            task is that the subject is asked to allocate money between herself and
to the display of control-averse behavior. The literature thus              another person, called player A. However, before the subject makes a
delivers several plausible variables that might drive individual            decision, player A can decide to let the subject choose freely (free condi-
control-averse behavior. Much of the support to date, however,              tion) or request a minimum amount of money (controlled condition).
comes from post hoc self-reports or measures of behavioral                      For the purpose of this study, subjects were presented with 16 anony-
intentions in hypothetical scenarios. Here, we use a neuro-                 mous other persons’ (players A’s) decisions from a pilot study in random
physiological measure of the decision processes during real                 order. The small number of trials was chosen to increase credibility and
restrictions of the subjects’ freedom of choice. By doing so, we            reduce possible habituation effects. To ensure equal estimation power of
aimed to identify the proximal mechanisms that give rise to                 the blood oxygen level-dependent (BOLD) signal across conditions, the
individual differences in control-averse behavior. Specifically,            players A’s decisions were preselected such that the subjects engaged in
we tested whether activation in and functional connectivity                 the same number of trials in the free and in the controlled condition; that
                                                                            is, eight trials per condition. All subjects were informed that the players
with the brain regions that are differentially activated during
                                                                            A’s decisions had been prerecorded for logistic reasons and they were
the restriction of the freedom of choice can explain individual             asked to decide as if the respective person was present. To remind sub-
differences in control-averse behavior. Moreover, we investi-               jects of this instruction, we presented the line “A new player A is decid-
gated to what degree this neurophysiological measure comple-                ing” for a jittered interval of 2.4 – 8.6 s at the beginning of each trial.
ments and mediates self-report data in predicting individual                Subjects were also informed that their choices had real consequences in
control-averse behavior.                                                    the sense that one trial would be randomly selected and paid out to them-
    We combined fMRI with a control aversion task (see Fig. 1) in           selves and the corresponding player A. None of the subjects voiced sus-
which subjects make decisions that are either free or controlled by         picions about the existence of the players A. After a jittered fixation
another person (Falk and Kosfeld, 2006; Schmelz and Ziegelmeyer,            display of 2– 6 s, subjects learned whether the player A let them choose
2015). For each decision, subjects allocate money between them-             freely (free condition) or whether the player A requested a minimum
selves and another person by choosing between options that                  amount of monetary units (MUs) (controlled condition). After a delay of
increase in fairness and generosity, called generosity levels. Cru-         3 s, subjects made a choice between sets of monetary allocations, called
                                                                            generosity levels, ranging from a selfish (subject: player A, 99:1 MUs) to
cially, the options were designed to establish an intrinsic motiva-
                                                                            a more generous, equal allocation (80:80 MUs) (all possible generosity
tion to choose a high level when subjects can decide freely. When           levels are depicted in Fig. 1). Subjects made their choice by moving a red
the other person requests a minimum level and thereby tries to              selection frame from a random position to their desired option and
control the subject’s choice, control-averse behavior is defined as         pressing an OK button. Response times were not constrained to motivate
choosing a lower level (Falk and Kosfeld, 2006; Schmelz and                 deliberate decisions; however, subjects were asked to respond as soon as
Ziegelmeyer, 2015). Therefore, the decrease of average chosen               they had come to a decision (response times, mean 5 ⫾ SD 4.3 s). Note
levels when the other person tries to control the subject’s deci-           that, for the fMRI analysis, we separated the times before and after sub-
sion as opposed to the free decisions serves as a measure of                jects started to move the selection frame to capture the decision window
individual control-averse behavior. Critically, the decisions in            and the motor responses separately. The durations as used in the fMRI
the task are not hypothetical, but rather have real conse-                  analysis are shown in Figure 1. In the free condition, subjects had the
quences for both interaction partners and thus share an im-                 choice between generosity levels one to five (from left to right). In the
portant quality with control-averse behavior outside the                    controlled condition, subjects’ choice was restricted to generosity levels
                                                                            two (97:30 MUs) to five. A central feature of the task is that the player A’s
laboratory. This setup allowed us to not only measure control-
                                                                            payoff increases as a concave function of the generosity levels with rela-
averse behavior in an ecologically valid fashion, but also to               tively small and convex costs for the subject. Moreover, the most gener-
investigate the neural responses during the actual decision-                ous level (level five) also represented the fairest and equal option and the
making process. We found that a neural mechanism involving                  highest sum of payoffs. These features were added to ensure that subjects
parietal and prefrontal brain regions complements and par-                  are intrinsically motivated to choose a high level, which is a prerequisite
tially mediates self-reported social cognition in explaining in-            for control aversion in this task (Schmelz and Ziegelmeyer, 2015). Last,
dividual differences in control-averse behavior.                            the subject’s payoff remains constant for levels two to three. This was
                                                                            done to motivate subjects to choose level three over level two in the free
Materials and Methods                                                       condition, and to provide space for the choice of a lower level in the
Participants                                                                controlled condition that is independent of economic self-interest. The
We recruited 61 students from the University of Bern for participation in   difference between a subject’s mean chosen level in the free condition
this study. Students of economics, psychology, and social sciences were     minus the subject’s mean chosen level in the controlled condition served
excluded from participation to reduce the possibility of prior knowledge    as the measure of the individual level of control-averse behavior.
of the concept of control aversion. All participants were right-handed,         After another jittered fixation display of 5– 8 s, subjects were asked to
nonsmokers, and reported no history of psychological disorders or neu-      indicate how they had felt during the decision by rating their unhappi-
rological or cardiovascular diseases. After data acquisition, 10 partici-   ness and anger on 5-point pictorial Self-Assessment Manikin (SAM)
pants were excluded due to excessive movements during fMRI scan (⬎5         scales (Bradley and Lang, 1994), each separated by a jittered fixation
mm in translation or ⬎5 degrees in rotation), noncompliance to instruc-     display of 1– 4 s. The unhappiness scale ranged from 1 ⫽ “happy” to 5 ⫽
tions, or technical problems. The remaining 51 participants (23 female;     “unhappy” and the anger scale ranged from 1 ⫽ “calm” to 5 ⫽ “angry.”
mean age 22 ⫾ 3 SD years) were included in the analysis. All participants   As a manipulation check, we implemented a third scale, the having con-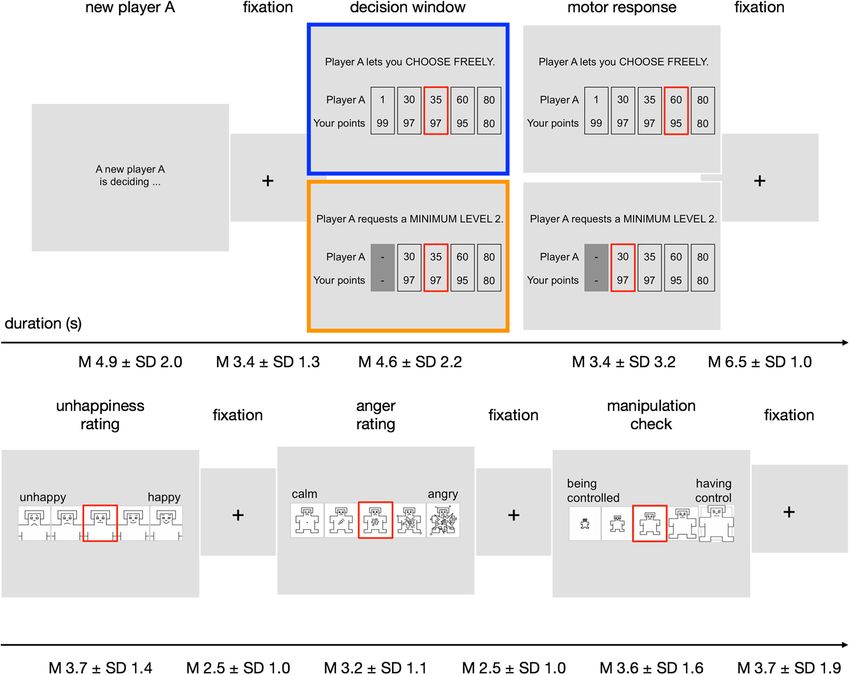
5198 • J. Neurosci., May 30, 2018 • 38(22):5196 –5208                                                                              Rudorf et al. • Neural Mechanisms of Control-Averse Behavior

Figure 1. Control aversion task. For every trial, the subject is presented with the decision from a new player A and the available generosity levels. Each generosity level represents an
allocation of monetary units between the player A (top value) and the subject (bottom value). In the free condition (blue frame), player A lets the subject choose freely between level one
to five (from left to right). In the controlled condition (orange frame), player A requests a minimum of level two and thereby restricts the subject’s choice to the levels two to five. The
decision window that is highlighted in the figure is defined as the time between the onset of the choice options and the initial movement of the red selection frame. Last, the subject is
presented with three pictorial assessment scales, which range from unhappy to happy (left to right), from calm to angry, and from being controlled to having control. The durations of
the fixation displays were jittered.

trol scale, which ranged from 1 ⫽ “being controlled” to 5 ⫽ “having                             assessed subject’s perceived distrust and understanding with the items
control.” Finally, a fixation cross was displayed for 1.2– 6.4 s before the                     “When player A requests a minimum of generosity, he distrusts me and
next trial began.                                                                               I dislike that” (“perceived distrust”) and “I understand when player A
   Before scanning, subjects read the instructions and were quizzed to                          requests a minimum of generosity” (“understanding”). Based on reac-
ensure that they had understood the task and its payoff scheme. Subjects                        tance theory (Brehm, 1966; Miron and Brehm, 2006), we assessed sub-
then practiced four simulated trials of the control aversion task outside                       jects’ motivation to restore their freedom of choice in the controlled
of the scanner to familiarize themselves with the task timing and the                           condition with the item “When player A restricts the generosity levels, I
response buttons. Then, subjects completed the scanning task in one                             want to use my remaining freedom of choice all the more” (“freedom
continuous session of ⬃12 min. At the end of the task, one trial was                            restoration”). In addition, we asked subjects whether fairness had played
randomly selected for payoff to the subject and the matched player A.                           a role in their own decisions with the item, “I think that my payoff and
Therefore, all trials were incentive compatible to motivate subjects to                         player A’s payoff should not be too far apart” (“fairness”).
decide according to their true preferences. The profits in the selected trial                      Assessment of outward directed anger expression. To assess subjects’
were converted into CHF (with 1 MU ⫽ CHF 0.20 ⬇ USD 0.20). Based                                general tendency to direct their anger outward, we asked subjects to fill in
on the task, the subjects received a mean CHF 18.30 ⫾ 1.40 SD and the                           the German version of the State-Trait Anger Expression Inventory (STAXI)
players A received a mean CHF 11.10 ⫾ 3.80 SD.                                                  (Spielberger, 1988; Schwenkmezger et al., 1992). The STAXI is composed
   Ratings of perceived distrust, understanding, freedom restoration, and                       of the five subscales state anger, trait anger, inward-directed anger ex-
fairness. Directly after scanning, we assessed subjects’ thoughts during                        pression, outward-directed anger expression, and controlling one’s an-
the control aversion task with a list of items. For each item, subjects were                    ger expression. Here, we focused on the subscale for outward-directed
asked to rate how strongly the described thought had influenced their                           anger expression (AO). The AO subscale consists of 8 items that describe
decisions on a 7-point Likert scale ranging from 1 ⫽ “not at all” to 7 ⫽                        ways of expressing one’s anger; for example, “I fly off the handle.” Sub-
“absolutely.” Based on the seminal study by Falk and Kosfeld (2006), we                         jects rated these items on a 4-point Likert scale ranging from 1 ⫽ “almost
Rudorf et al. • Neural Mechanisms of Control-Averse Behavior J. Neurosci., May 30, 2018 • 38(22):5196 –5208 • 5199
never” to 4 ⫽ “almost always.” Based on the subjects’ ratings, the sum component of the normalized ratings of the item “perceived distrust”
scores were computed. In our sample, the AO subscale had an acceptable (coefficient 0.88) and the reversed item “understanding” (coefficient 0.48).
internal consistency (Cronbach’s ␣ ⫽ 0.73). On average, subjects had an The second new variable, “negative affect,” is the first principal compo-
AO score of mean 12.24 ⫾ SD 3.02 (range 8 –22), which is similar to the nent of the normalized mean unhappiness rating (coefficient 0.80) and
norm student sample reported in Schwenkmezger et al. (1992). the normalized mean anger rating in the controlled minus the free con-
dition (coefficient 0.59). As predictors, we used combinations of main
MRI data acquisition and preprocessing effects and interactions of social cognition, negative affect, and the nor-
All MRI data were acquired on a Siemens Trio 3.0 tesla whole-body malized ratings of the item freedom restoration. The most relevant mod-
scanner using a 12-channel head coil. The functional session started off els are illustrated in Figure 4. We compared the models using the
with a localizer scan followed by the control aversion task implemented Bayesian information criterion (BIC) and R 2 to identify the best model
in E-Prime 3.0 (Psychology Software Tools). The task was projected onto fit. Lower values in BIC and greater values in R 2 indicate better model
a screen that the subjects viewed through an angled mirror mounted to fits.
the head coil. Subjects made their responses on a two-button response
box in each hand. While subjects were playing the task, we acquired
gradient echo T2*-weighted echoplanar images (EPIs) with BOLD con-
fMRI data analyses
The statistical analysis of the fMRI data was also performed in SPM12
trast (⬃400 volumes per subject, 32 slices per volume, ascending order,
(version r6685). We modeled each subject’s BOLD response with a gen-
field of view 192 ⫻ 192 ⫻ 110 mm, slice thickness 3 mm, gap 0.45 mm,
eral linear model (GLM) that was estimated using SPM12’s standard
repetition time 2190 ms, echo time 30 ms, flip angle 90°). Volumes were
hemodynamic response function and a high-pass filter of 128 Hz, as well
acquired in axial orientation at a ⫹15° tilt to the anterior commissure–
as correction for intrinsic autocorrelations. SPM12’s internal masking
posterior commissure line. After the functional session, T1-weighted
threshold for the estimation of the  parameters was set to 0.4 to ensure
3D-modified driven equilibrium Fourier transformation (MDEFT) im-
inclusion of subcortical brain regions. The GLM contained two regres-
ages were acquired from each subject (176 slices, field of view 256 ⫻
sors of interest as boxcar functions: (1) decisions in the controlled con-
224 ⫻ 176 mm, slice thickness 1 mm, no gap, repetition time 7.92 ms,
dition and (2) decisions in the free condition (each with a duration from
echo time 2.48 ms, flip angle 16°).
the respective onset of the choice options until the first button press,
Preprocessing of the functional images was implemented in the
illustrated as “decision window” in Fig. 1). Note that, due to a high
MATLAB-based software Statistical Parametric Mapping 12 (SPM12,
consistency in the subjects’ choices and therefore in the subjects’ and
version r6685; http://www.fil.ion.ucl.ac.uk/spm). Preprocessing included
player A’s payoff within each condition and subject (see Fig. 2B), it was
motion correction (realignment to the mean EPI), segmentation of the
not feasible to additionally control for the subjects’ or player A’s payoff in
T1 image into six tissue classifications (gray matter, white matter, CSF,
the GLM. As nuisance regressors, we also modeled the following: (3) the
bone, soft tissue, and air tissue), application of this segmentation to the
display of the text “A new player A is deciding . . .” (duration 2.4 – 8.6 s);
mean EPI, coregistration of all EPIs to the mean EPI using the pullback
(4) motor response (duration from the first button press until press of the
procedure in the SPM12 deformation tool and normalization of all EPIs
OK button); (5) unhappiness rating (duration ⫽ reaction times); (6)
to MNI standard space (Montreal Neurological Institute, http://www.
anger rating (duration ⫽ reaction times); (7) manipulation check, that is,
bic.mni.mcgill.ca) (Evans et al., 1993). Finally, we smoothed the EPIs
feeling of having control rating (duration ⫽ reaction times); and (8) six
with a 4 mm full width at half maximum Gaussian kernel.
motion parameters. For every subject, we created contrast images for the
Analysis aim and structure two regressors of interest.
The central aim of our analyses was to identify a neurophysiological At the group level, we used random effects analyses, in which we ap-
mechanism that can explain individual differences in control-averse be- plied whole-brain correction for multiple comparisons at the cluster
havior in addition to or beyond self-report data. To this end, our analyses level. We calculated the corrected cluster extent (kE) for each t test using
followed a hierarchical structure. First, we identified the best predictor of Gaussian random-field theory as implemented in SPM12 with a cluster-
individual control-averse behavior based on self-report data. Second, defining individual voxel threshold of t ⫽ 2.68 ( p ⬍ 0.005) to achieve an
we identified a neurophysiological mechanism that predicts individual FWE-corrected statistical threshold of pFWE ⬍ 0.05 (minimum kE ⬎ 40,
control-averse behavior. Third, we identified the best combination of range 40 – 44).
predictors based on both self-reported and neural data. Fourth, we tested The aim of the fMRI analysis was to identify a neurophysiological
whether the neural predictor mediates the self-report data in predicting mechanism that can predict individual differences in control-averse be-
individual control-averse behavior. havior. Specifically, we investigated whether activations in and interac-
tions with the brain regions that are differentially activated for decisions
Behavioral data analyses in the controlled and the free condition correlate with individual control-
All behavioral data were analyzed using the MATLAB Statistics and averse behavior. We did so in three fMRI analysis steps, which will be
Machine Learning Toolbox (R2015b; The MathWorks). Because the described in the following sections.
behavioral data did not follow normal distributions as assessed by Kol- Step 1: Localization of brain regions differentially activated for decisions
mogorov–Smirnov tests, nonparametric tests were applied. Paired sam- in the controlled and the free condition. To identify the brain regions that
ples were compared using the Wilcoxon signed-rank test. Correlations are differentially activated during decisions in the controlled and the free
were assessed using Spearman’s as well as bisquare robust regressions. condition, we tested the corresponding contrast images in a paired t test
For all behavioral analyses, two-tailed p-values are reported. at the group level. Because we had no strong anatomical hypotheses, we
Identifying the best predictor of individual control-averse behavior based applied whole-brain corrected analysis. Based on the paired t test, we
on self-report data. We first identified the best predictor of individual created two masks for all suprathreshold voxels within a 10 mm sphere
control-averse behavior based on self-report data. To this end, we ran a around the group peak voxel in the right and left inferior parietal lobule
series of generalized linear models using the function fitglm as imple- (IPL), respectively, at a threshold of p ⬍ 0.005, uncorrected (peak MNI
mented in the MATLAB Statistics and Machine Learning Toolbox coordinates for right IPL: 39 ⫺40 40; for left IPL: ⫺42 ⫺40 47, illustrated
(R2015b; The MathWorks). For each model, the dependent variable was in Fig. 5). The spheres were applied to isolate the activation in the IPL
the individual level of control-averse behavior, as measured by the mean from more posterior activation. The masks were used to extract and
chosen level in the free condition minus the mean chosen level in the illustrate the mean  estimates as implemented in the MarsBaR toolbox
controlled condition. The self-report variables served as predictors. For (Brett et al., 2002), as well as for search volumes in the functional con-
conciseness, we report only models with predictors that showed a signif- nectivity analyses and time course analyses (which are described in step 3
icant correlation with individual control-averse behavior. To reduce of the fMRI analysis below).
multicollinearity among the predictors, we computed two new variables Step 2: Covariate analysis of activation differences for decisions in the
using principal component analysis as implemented in the MATLAB controlled and the free condition and control-averse behavior. The second
function pca. The new variable “social cognition” is the first principal step of the fMRI analysis was to investigate whether individual control-5200 • J. Neurosci., May 30, 2018 • 38(22):5196 –5208 Rudorf et al. • Neural Mechanisms of Control-Averse Behavior
averse behavior could be predicted by activation differences for decisions characteristics of the BOLD signal in the target regions. Due to the use of
in the controlled and free condition. To test this, we included the indi- non-independent masks, however, it is important to note that the time
vidual level of control-averse behavior as a covariate in the paired t test course analyses were not used to infer the magnitude of the effect con-
(random effects analysis) using a whole-brain analysis. The individual trolled ⬎ free condition.
level of control-averse behavior was computed as the mean chosen level
in the free condition minus the mean chosen level in the controlled Identifying the best combination of predictors of individual
condition, with the result that increasing values reflect increasing levels control-averse behavior based on self-report and neural data
of control-averse behavior. Building upon the behavioral results and the result of the functional
Step 3: Covariate analysis of the functional connectivity seeded in the IPL connectivity analysis, we next investigated whether models based on self-
and control-averse behavior. The third step of the fMRI analysis was to report data could be improved by including neural data. To this end, we
investigate whether individual control-averse behavior could be explained ran a new series of generalized linear models using the function fitglm as
by neural interactions with the brain regions that are differentially active for implemented in the MATLAB Statistics and Machine Learning Toolbox
decisions in the controlled and free condition. For this purpose, we con- (R2015b; The MathWorks). For each model, the dependent variable
ducted functional connectivity analyses seeded in the right and left IPL as was the individual level of control-averse behavior, as measured by
identified in the paired t test for decisions in the controlled ⬎ free con- the mean chosen level in the free condition minus the mean chosen
dition. To assess the functional connectivity, we used psychophysiologi- level in the controlled condition.
cal interaction (PPI) analysis with two psychological factors of interest We compared the best model based on self-report data with models
that were derived from the GLM: (1) decisions in the controlled condi- based on the neural data and combinations of neural and self-report data.
tion and (2) decisions in the free condition. We extracted single-subject As a neural predictor, we used the difference between the subjectwise
time courses in the right and the left IPL, respectively, as follows: using estimate of the connectivity between right IPL and right dlPFC during
the search volumes derived from the paired t test for decisions in the decisions in the controlled and the free condition (controlled PPI ⫺ free
controlled ⬎ free condition at the group level (illustrated in Fig. 6), we PPI). This neural predictor was combined with main effects of and inter-
identified, for each subject, the peak Z-value for the contrast of decisions actions with the predictors social cognition, negative affect, and freedom
in the controlled ⬎ free condition and extracted the first BOLD signal restoration. The most relevant models are illustrated in Figure 7. Again,
eigenvariate from a 5 mm sphere around this individual peak. This we compared the models with regard to the BIC and R 2.
approach was chosen to account for between-subject variability in the Mediation analysis of self-report and neural predictors of
spatial location of the peak activation. The extracted BOLD signal eigen- individual control-averse behavior
variate was then deconvolved and multiplied with the two psychological Building upon the result of the model comparisons, we next investigated
factors of interest to create the PPI terms (controlled PPI, free PPI), the association among social cognition, right IPL– dlPFC connectivity, and
which were then convolved with the standard SPM12 hemodynamic control-averse behavior. To this end, we performed a mediation analysis
response function. Last, for each seed, the two PPI terms, the BOLD using the MATLAB-based mediation toolbox described by Wager et al.
signal eigenvariate, and all regressors described in the GLM were entered (2008) available at: https://github.com/canlab/MediationToolbox. We
into a new GLM (GLM-PPI). For all subjects, we created contrast images based the test on three criteria, which are illustrated in the three-variable
for the two PPI terms. To identify brain regions that show an increased path model in Figure 8. First, the predictor must be related to the medi-
functional connectivity with the right and left IPL, respectively, we tested ating variable ( path a). Second, the mediator must be related to the
the associated contrast images controlled PPI ⬎ free PPI in two separate outcome after controlling for the predictor ( path b). Third, the media-
paired t tests at the group level (random effects analyses). Finally, to test tion effect defined as product of the a and b path coefficients (a*b) must
whether the functional connectivity seeded in the IPL predicts control- be significant. A significant mediation effect indicates that the mediator
averse behavior, we included the individual level of control-averse be- significantly reduces and therefore explains the predictor-outcome rela-
havior as a covariate in the paired t tests of controlled PPI ⬎ free PPI tionship (difference between path c and c⬘). If the predictor still explains
(random effects analyses) using whole-brain analyses. significant variance in the outcome after controlling for the mediator
Based on the covariate analysis, we created two new masks for all ( path c⬘), we speak of a partial mediation.
suprathreshold voxels in the right and left dorsolateral prefrontal cortex A mediation analysis is conceptually different from a moderation anal-
(dlPFC)/middle frontal gyrus, respectively, at a threshold of p ⬍ 0.005, ysis (see model 10 in Fig. 7), which tests whether the level of the moder-
uncorrected (see Fig. 6, Table 1). These masks were used to extract and ating variable can predict the strength of the relationship between the
illustrate the mean  estimates as implemented in the MarsBaR toolbox predictor and the outcome (Baron and Kenny, 1986; Wager et al., 2008).
(Brett et al., 2002) (Fig. 5) and as search volumes for additional time In other words, a moderator indicates when a predictor-outcome asso-
course analyses (see Fig. 6) as follows. ciation occurs, whereas a mediator explains how or why such an effect
To further examine individual differences in the temporal character- occurs (Baron and Kenny, 1986). We therefore ran the mediation anal-
istics of the BOLD signal underlying the decisions in the controlled and ysis to test whether the right IPL– dlPFC connectivity represents the
free condition in the seed (bilateral IPL) and target regions (bilateral mechanism through which social cognition affects control-averse be-
dlPFC/middle frontal gyrus) of the functional connectivity analysis, we havior.
performed post hoc time course analyses using the search volumes de- As the predictor, we used the subject-specific variable social cognition.
scribed above. For each subject and each search volume, we identified the The mediator was the difference between the subjectwise estimate of the
peak Z-value for the contrast of decisions in the controlled ⬎ free con- connectivity between right IPL and right dlPFC during decisions in the
dition and extracted the raw event-related BOLD response from a 5 mm controlled and the free condition (controlled PPI ⫺ free PPI). The out-
sphere around this individual peak, which was identical to the procedure come was the individual level of control-averse behavior, as measured by
used in the PPI analysis. Event-related BOLD responses were estimated the mean chosen level in the free condition minus the mean chosen level
by two finite impulse response models for decisions in the controlled in the controlled condition. Statistical significance was assessed using a
condition and the free condition, respectively, adjusted for nuisance bootstrap test with 1000 samples.
effects of the motion regressors and resampled to time bins of 0.5 s as
implemented in the rfxplot toolbox (Gläscher, 2009). We then divided
the subjects into groups of not control-averse subjects (with levels of
Results
control-averse behavior ⱕ 0, n ⫽ 10) and control-averse subjects (with Behavioral results
levels of control-averse behavior ⬎ 0, n ⫽ 41) and plotted the averaged Control-averse behavior and its association with negative affect,
time courses across subjects in each group separately for decisions in the perceived distrust, understanding, and freedom restoration
controlled and the free condition (see Fig. 6). Note that the raw event- While lying in the fMRI scanner, subjects made choices under
related BOLD signal is independent of any model assumptions. The time two conditions (Fig. 1). In the free condition, subjects could
course analyses therefore provide additional insights into the temporal choose freely among five allocation options, called generosity levels,Rudorf et al. • Neural Mechanisms of Control-Averse Behavior J. Neurosci., May 30, 2018 • 38(22):5196 –5208 • 5201
corrected for a bottom effect following the
procedure by Falk and Kosfeld (2006).
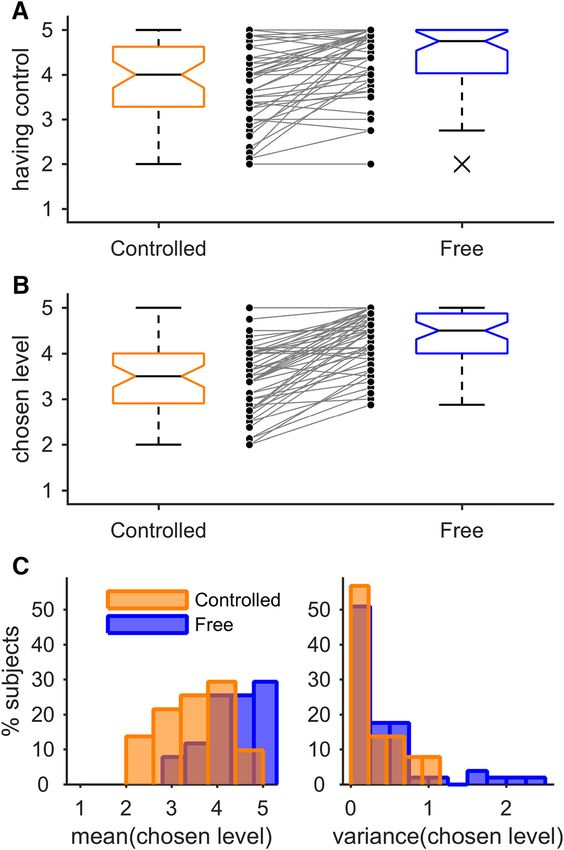
Subjects demonstrated high consistency
in their choice preferences: they showed a
variance of mean 0.31 ⫾ 0.33 SD, median
0.21, in the controlled condition and a
variance of mean 0.33 ⫾ 0.37 SD, median
0.21, in the free condition (Fig. 2C). We
therefore averaged each subjects’ choices
within each condition and used the differ-
ence between each subject’s mean chosen
level in the free condition minus the sub-
ject’s mean chosen level in the controlled
condition as the measure of the individual
level of control-averse behavior. The indi-
vidual levels of control-averse behavior var-
ied from ⫺0.25 to 2.13 (mean 0.82 ⫾ 0.64
SD, median 0.88), a variation that stems
mostly from the mean chosen levels in the
controlled condition rather than the free
condition as illustrated in Figure 2, B and
C. In other words, subjects chose similarly
high levels in the free condition, whereas
choices were more heterogeneous in the
controlled condition. For two subjects,
the level of control-averse behavior was
⫺0.25, which did not result from systematic
choices, but rather from a single outlier
choice of a lower level in the free condition.
Because these subjects otherwise demon-
strated zero difference in their choices
between the two conditions, they were
treated as not being control averse.
Second, we tested whether subjects’ in-
dividual control-averse behavior was as-
sociated with negative affects (Dillard and
Shen, 2005). To capture negative affects,
we used trial-by-trial ratings of unhappi-
ness and anger on pictorial 5-point SAM
Figure 2. Choice behavior. A, B, boxplots of the ratings of having control and chosen generosity levels, respectively, in the scales (Bradley and Lang, 1994). Indeed,
controlled and the free condition. The central mark of each box shows the median, the box edges show the 25th and 75th we found a significant association of
percentiles, and the whiskers represent the limit beyond which a data point is considered an outlier (denoted as cross). The control-averse behavior with both nega-
connected data points in the center show individual subject’s means. C, Histograms showing the distribution of subjects’ mean and
tive affect ratings: the unhappier (Spear-
variance of chosen levels in the controlled and the free condition. Data from n ⫽ 51 subjects are shown.
man’s ⫽ 0.49, p ⬍ 0.001; robust R 2 ⫽
0.26, p ⬍ 0.001) and the angrier (Spear-
ranging from selfish to more generous and equal monetary man’s ⫽ 0.46, p ⫽ 0.001; robust R 2 ⫽ 0.23, p ⬍ 0.001) subjects
allocations between themselves and another person. In the con- were in the controlled compared with the free condition, the
trolled condition, the other person requested a minimum of level greater was their individual level of control-averse behavior
two and thereby eliminated the most selfish and unequal option. (Fig. 3A). To additionally assess trait anger expression, we used a
A manipulation check showed that subjects indeed indicated hav- task-independent anger expression inventory (STAXI; Schwenk-
ing more control in the free condition (mean 4.42 ⫾ SD 0.73, me- mezger et al., 1992). Subjects’ general tendency to direct anger
dian 4.75) than in the controlled condition (mean 3.88 ⫾ SD expression outward, however, did not correlate significantly with
0.88, median 4.00; Wilcoxon signed-rank test, two-tailed, Z ⫽ the individual level of control-averse behavior (Spearman’s ⫽
4.69, p ⬍ 0.001, Hodges–Lehmann estimator of differences 0.63, ⫺0.01, robust R 2 ⬍ 0.01, both p ⬎ 0.9; Fig. 3A). Other subscales
95% confidence interval (CI): 0.38 to 0.94; Fig. 2A). of the STAXI also showed no significant association with control-
First, we tested whether the restriction of the freedom of choice averse behavior.
had an effect on subjects’ generosity as measured by the chosen gen- Third, we tested the association between subjects’ individual
erosity level. As expected, subjects chose, on average, lower gen- control-averse behavior and their self-reported thoughts as as-
erosity levels in the controlled condition (mean 3.50 ⫾ 0.78 SD, sessed by ratings after scanning. For each rating, subjects were
median 3.50) than in the free condition (mean 4.34 ⫾ 0.57 SD, asked to indicate how strongly the described thought had influ-
median 4.50; Wilcoxon signed-rank test, two-tailed, Z ⫽ ⫺5.64, enced their decision in the control aversion task. Consistent with
p ⬍ 0.001, Hodges–Lehmann estimator of differences ⫺1.00, previous work (Falk and Kosfeld, 2006), we found that subjects
95% CI: ⫺1.19 to ⫺0.81; Fig. 2B). Note that the statistical test was demonstrated more control-averse behavior the more they per-5202 • J. Neurosci., May 30, 2018 • 38(22):5196 –5208 Rudorf et al. • Neural Mechanisms of Control-Averse Behavior
Figure 3. Correlation of control-averse behavior with negative affects, perceived distrust, understanding, freedom restoration, and fairness. A, Mean unhappiness and anger ratings in the
controlled minus the free condition and individual tendencies for outward-directed anger expression, respectively, plotted against the individual control-averse behavior, computed as the difference
between the mean chosen level in the free minus the controlled condition. B, Individual ratings of perceived distrust, understanding, freedom restoration and fairness plotted against individual
control-averse behavior. Observations are jittered along the x-axis to reduce overlap for visualization. Regression lines were fitted with bisquare robust regressions. Data from n ⫽ 51 subjects are
shown.
ceived the choice restriction as a signal of distrust by the other where yi is the level of control-averse behavior for subject i and
person (Spearman’s ⫽ 0.60, robust R 2 ⫽ 0.32, both p ⬍ 0.001; SocialCognition is the first principal component of the normal-
Fig. 3B). In contrast, subjects demonstrated less control-averse ized ratings of the items perceived distrust and the reversed item
behavior the higher they rated understanding the other person’s understanding. This model performed better in predicting indi-
request in the controlled condition (Spearman’s ⫽ ⫺0.66, ro- vidual control-averse behavior than any model that included
bust R 2 ⫽ 0.37, both p ⬍ 0.001). We next tested whether the negative affect or the motivation for freedom restoration either as
motivation for freedom restoration had influenced the subjects’ main effects or interaction terms.
decisions. Consistent with reactance theory (Brehm, 1966; Miron
and Brehm, 2006), our subjects‘ self-reported motivation to use Neuroimaging results
their remaining freedom of choice correlated significantly and Control-averse behavior is predicted by neural interactions
positively with their level of control-averse behavior (Spearman’s between the right IPL and the dlPFC
The aim of the fMRI analysis was to identify a neurophysiological
⫽ 0.37, p ⫽ 0.008, robust R 2 ⫽ 0.17, p ⫽ 0.003; Fig. 3B). Last,
mechanism that can predict control-averse behavior. Specifically,
we asked subjects whether fairness had played a role in their
we aimed to test whether neural responses and their interactions
decisions; that is, the thought that their own payoff and the other
could explain individual differences in control-averse behavior. To
person’s payoff should not be too far apart. Interestingly, fairness
do this, we ran covariate analyses between the individual control-
correlated positively with the average chosen level within both the
averse behavior and neural activity in the brain regions that are
controlled condition (Spearman’s ⫽ 0.51, robust R 2 ⫽ 0.28,
differentially activated during decisions in the controlled and the
both p ⬍ 0.001) and the free condition (Spearman’s ⫽ 0.48,
free condition, as well as the functional connectivity seeded in
robust R 2 ⫽ 0.26, both p ⬍ 0.001), but was not significantly
these brain regions.
associated with control-averse behavior (Spearman’s ⫽ ⫺0.20,
In a first step, the brain regions that are more strongly acti-
p ⫽ 0.163, robust R 2 ⫽ 0.04, p ⫽ 0.144; Fig. 3B).
vated during decisions in the controlled than in the free condition
Social cognition is the best self-report predictor of individual were localized. We estimated a GLM that models the BOLD
control-averse behavior responses for decisions in the controlled and the free condition,
Next, we aimed to identify the best predictor of individual respectively. The respective single-subject contrast images were
control-averse behavior based on self-report data. To this end, we then compared in a paired t test. We found that the right IPL
computed and compared a series of generalized linear models. As (peak MNI coordinates 39 ⫺40 40, t ⫽ 3.99, pFWE ⬍ 0.001,
predictors, we focused on the self-reported variables that showed whole-brain FWE corrected at the cluster level), the left IPL (peak
a significant correlation with control-averse behavior (Fig. 3). To MNI coordinates ⫺42 ⫺40 47, t ⫽ 3.76, pFWE ⫽ 0.042), clusters
reduce multicollinearity among the predictors, we applied prin- in the bilateral superior parietal lobule extending into the occipital
cipal component analyses and computed the new variables social cortex (peak MNI coordinates right 15 ⫺73 57, t ⫽ 4.42, pFWE ⬍
cognition and negative affect. The normalized ratings of the item 0.001; left ⫺21 ⫺64 43, t ⫽ 4.43, pFWE ⬍ 0.001), and the right
freedom restoration served as a third predictor. Model compari- occipital cortex (peak MNI coordinates 39 ⫺79 33, t ⫽ 4.01, pFWE
sons revealed that, based on the self-report data, the following ⫽ 0.042) were more strongly activated during decisions in the con-
model had the best model fit (Fig. 4, Table 2): trolled than in the free condition.
In a second step, we tested whether these activation differ-
y i ⫽  0 ⫹  1 SocialCognition i ⫹ i ences between decisions in the controlled and in the freeRudorf et al. • Neural Mechanisms of Control-Averse Behavior J. Neurosci., May 30, 2018 • 38(22):5196 –5208 • 5203
controlled and the free condition (con-
trolled PPI, free PPI). We searched for
brain regions in which functional con-
nectivity with the IPL predicted con-
trol-averse behavior by including the
individual level of control-averse behav-
ior as a covariate in the paired t test of the
contrast images for controlled PPI ⬎ free
PPI. Whereas the covariate analysis
seeded in the left IPL revealed no signifi-
cant results, we found that, for controlled
PPI ⬎ free PPI, the right IPL showed in-
creased functional coupling with the right
dlPFC/middle frontal gyrus ( pFWE ⬍
0.001), the left angular gyrus ( pFWE ⬍
0.001), the right precuneus (pFWE ⫽ 0.047),
the left dlPFC (pFWE ⫽ 0.042), and the left
IPL ( pFWE ⫽ 0.033) as a function of
control-averse behavior (Fig. 5, Table 1).
No significant negative association was
observed. Complementary PPI analyses
seeded in the superior parietal lobule and
the occipital cortex revealed no significant
association with control-averse behavior.
To determine whether the positive corre-
lation was driven by either one of the con-
ditions, we extracted the mean  estimates
across the functional clusters of the bilat-
eral dlPFC for the controlled PPI and the
free PPI regressor separately and plotted
them against the individual level of
control-averse behavior (Fig. 5). This in-
spection revealed that right IPL– dlPFC
connectivity during the decisions in-
creased with control-averse behavior in
the controlled condition and decreased
with control-averse behavior in the free
condition. Therefore, the higher the indi-
vidual level of control-averse behavior,
Figure 4. Models based on self-report data. These diagrams show seven models predicting individual control-averse behavior the greater the change in right IPL– dlPFC
(y), based on self-reports of social cognition (S), freedom restoration (F), and negative affect (A). Arrows indicate main effects. The connectivity during decisions in the con-
bar graphs show the BIC and R 2 for each model, with the winning model highlighted in black. trolled compared with the free condition. In
addition, time course analyses showed that
condition could explain individual differences in control- activation in the bilateral IPL increases immediately after the onset of
averse behavior by including the individual level of control- the choice options, regardless of individual control-averse behavior
averse behavior as a covariate in the paired t test of the contrast (Fig. 6). In contrast, activation in the bilateral dlPFC synchronizes
images for decisions in the controlled and the free condition. This with activation in the IPL only for control-averse subjects and only
covariate analysis revealed no significant association between during decisions in the controlled condition.
control-averse behavior and the activation differences between
decisions in the controlled and the free condition, even at a more Connectivity between right IPL and dlPFC complements
liberal statistical threshold of p ⬍ 0.005, uncorrected. self-reported social cognition in predicting individual
In a third step, we investigated whether individual differences control-averse behavior
in control-averse behavior could instead be explained by func- Next, we aimed to identify the best combination of predictors of
tional connectivity patterns. As the seed region of the functional control-averse behavior based on both self-report and neural
connectivity, we focused on the bilateral IPL due to its suggested data. Specifically, we tested whether the functional connectivity
role in subjective choice restrictions (Filevich et al., 2013) and with the IPL complements or exceeds the self-reports in predict-
attention reorientation (Corbetta et al., 2008). Accordingly, the ing control-averse behavior. To this end, we computed a set of
above described peak activation clusters in the bilateral IPL were new generalized linear models that included the neural data. As
used as search volumes for individual subjects’ seeds for the func- the neural predictor, PPI, we used the subjectwise  estimate of
tional connectivity analyses (Figs. 5, 6). To assess the functional the controlled PPI minus the free PPI regressor between the right
connectivity, we performed two PPI analyses that included sepa- IPL and the right dlPFC. We focused on the connectivity of the
rate interaction terms between the right and left IPL BOLD time right IPL with the dlPFC because of their frequent coactivation
series, respectively, and regressors indicating decisions in the during attention reorientation (Corbetta et al., 2008) and5204 • J. Neurosci., May 30, 2018 • 38(22):5196 –5208 Rudorf et al. • Neural Mechanisms of Control-Averse Behavior
Table 1. Regions in which the connectivity for decisions in the controlled minus the context-dependent decision making (Daw et al., 2006; Boorman
free condition (controlled PPI ⴚ free PPI) seeded in the right IPL is positively et al., 2009; Rudorf and Hare, 2014). This neural predictor was
associated with individual control-averse behavior combined with main effects of and interactions with the predictors
MNI coordinates social cognition, negative affect, and freedom restoration. Model
Cluster Max
Region Side x y z size, kE stat, t pFWE comparisons revealed that a model that combined main effects of
dlPFC/middle frontal gyrus R 42 47 22 105 4.88 ⬍0.001
social cognition and PPI had the best overall model fit (model 9;
24 50 5 4.58 Fig. 7, Table 2):
48 35 29 4.16
Angular gyrus L ⫺33 ⫺55 36 411 4.80 ⬍0.001 y i ⫽  0 ⫹  1 SocialCognition i ⫹  2 PPI i ⫹ i
6 ⫺70 50 4.67
27 ⫺73 50 4.40
Precuneus R 18 ⫺67 29 40 4.80 0.047 This model performed better than any combination of the neural
3 ⫺67 29 3.10 predictor with any other predictors based on self-report data (Fig. 7).
21 ⫺58 26 3.01 Moreover, it performed slightly better than a model including the
dlPFC/middle frontal gyrus L ⫺45 29 29 41 4.54 0.042 interaction of social cognition and PPI (BIC ⫽ 65, R 2 ⫽ 0.60, model
⫺39 38 26 3.10
⫺45 35 19 2.95 10 in Fig. 7), which revealed no significant interaction and there-
IPL L ⫺39 ⫺52 57 43 4.22 0.033 fore no moderation effect ( ⫽ ⫺0.40, t(49) ⫽ ⫺0.38, p ⫽ 0.702,
⫺33 ⫺58 57 3.35 95% CI: ⫺2.52 to 1.71). When we added the other self-report
⫺24 ⫺64 60 2.95 predictors (model 13 in Fig. 7), the main effects of social cogni-
Results from the covariate analysis are shown (sample size, n ⫽ 51 subjects). Height threshold t(49) ⫽ 2.68, extent tion and PPI remained robust, whereas the other predictors
threshold kE ⬎ 40. All activations survived whole-brain correction for multiple comparisons based on FWE control at showed no significant effect. Accordingly, the increase of connec-
the cluster level.
tivity between the right IPL and right dlPFC in the controlled
compared with the free condition explains variance in individual
control-averse behavior that exceeds model predictions based on
self-report data.
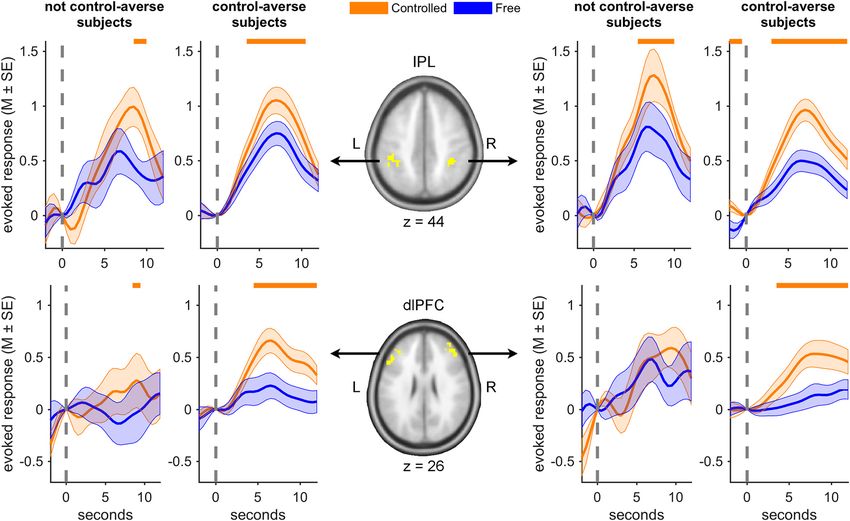
Figure 5. Connectivity between right IPL and dlPFC predicts individual differences in control-averse behavior. The figure illustrates that the functional connectivity during decisions in the
controlled as opposed to the free condition (controlled PPI ⫺ free PPI) between the right IPL (seed) and regions in the dlPFC/middle frontal gyrus and the posterior parietal cortex increases as a
function of individual control-averse behavior. Left, Statistical parametric maps of the covariate analysis color coded for the t values as indicated by the color bar, thresholded at pFWE ⬍ 0.05, and
projected on a template brain in MNI space. Right, Graphs showing the individual level of control-averse behavior (x-axes) plotted against the single-subject means of the  estimates extracted from
the functional clusters in the right and left dlPFC (circled on the left) for the controlled PPI ⫺ free PPI effect, the controlled PPI effect, and the free PPI effect seeded in the right IPL (y-axes).
Observations are jittered along the x-axis to reduce overlap for visualization. Regression lines were fitted with bisquare robust regressions. Data from n ⫽ 51 subjects are shown.Rudorf et al. • Neural Mechanisms of Control-Averse Behavior J. Neurosci., May 30, 2018 • 38(22):5196 –5208 • 5205
Figure 6. BOLD time courses of decisions in the controlled and free condition. The IPL shows a similar pattern for not control-averse subjects (with levels of control-averse behavior ⱕ 0, n ⫽ 10)
and control-averse subjects (with levels of control-averse behavior ⬎ 0, n ⫽ 41), whereas the dlPFC shows a distinct pattern for control-averse subjects. The graphs show averaged time courses of
BOLD activation in the bilateral IPL (top row) and the bilateral dlPFC/middle frontal gyrus (bottom row) for decisions in the controlled (orange) and the free condition (blue). The brain maps in the
center depict the search volumes used for the time course extractions. The horizontal lines at the top of the graphs indicate time points at which the conditions differ significantly (Wilcoxon
signed-rank test, two-tailed, p ⬍ 0.05). The dashed vertical lines mark the onset of the decision window at which the time courses were mean-corrected. The transparent areas show SEM. Note that
these plots were not used to infer the main effect of controlled ⬎ free condition.
Connectivity between right IPL and dlPFC partially mediates the be related to the mediator (path a), the mediator must be related
association of social cognition with control-averse behavior to the outcome after controlling for the predictor (path b), and
After having identified social cognition and the right IPL– dlPFC the mediation effect, that is, the product of the a and b path
connectivity as the best predictors of individual control-averse coefficients (a*b ⫽ c– c⬘), must be significant. The mediation
behavior, we investigated whether the connectivity might reflect
analysis revealed that the relationship between social cognition
the mechanism through which these social cognitions affect control-
and control-averse behavior is partially mediated by the connec-
averse behavior and therefore capture joint variance. To investi-
tivity between right IPL and right dlPFC; that is, the mediator
gate this, we ran a mediation analysis using a three-variable path
model (Fig. 8; Baron and Kenny, 1986; Wager et al., 2008) in significantly reduces the association between predictor and out-
which the predictor was social cognition, the mediator was the come (total effect, path c), but the predictor still explains signif-
subjectwise  estimate of the controlled PPI minus the free PPI icant variance of the outcome (direct effect, path c⬘; Fig. 8). In
regressor between the right IPL and the right dlPFC, and the out- other words, the right IPL– dlPFC connectivity explains a significant
come was the individual control-averse behavior. Following con- part of the relationship between social cognition and control-averse
vention (Baron and Kenny, 1986), we considered the mediation behavior, but the predictor and mediator each also explain indepen-
to be significant if three conditions were met: the predictor must dent variance.
Table 2. Model comparison
Model 1 Model 9
95% CI 95% CI
 SE t p Lower Upper  SE t p Lower Upper
Social cognition 1.36 0.19 7.19 ⬍0.001 0.98 1.74 1.06 0.20 5.39 ⬍0.001 0.66 1.45
IPL– dlPFC connectivity 0.92 0.28 3.28 0.002 0.36 1.49
(Intercept) 0.84 0.06 13.51 ⬍0.001 0.72 0.97 0.43 0.14 3.16 0.003 0.16 0.71
BIC 68.1 61.7
R2 0.51 0.60
Observations 51
The dependent variable was control-averse behavior. Individual differences in control-averse behavior were predicted by social cognition and right IPL– dlPFC connectivity in the controlled minus the free condition (models 1 and 9 in Fig. 7).You can also read