The Phosphoproteomic Response of Okra (Abelmoschus esculentus L.) Seedlings to Salt Stress
←
→
Page content transcription
If your browser does not render page correctly, please read the page content below
International Journal of
           Molecular Sciences

Article
The Phosphoproteomic Response of Okra
(Abelmoschus esculentus L.) Seedlings to Salt Stress
Chenliang Yu 1,2 , Qinqfei Wu 2 , Chendong Sun 3 , Mengling Tang 3 , Junwei Sun 4
and Yihua Zhan 2, *
 1    Institute of Agricultural Equipment, Zhejiang Academy of Agricultural Sciences, Hangzhou 310021, China;
      21007030@zju.edu.cn
 2    State Key Laboratory of Plant Physiology and Biochemistry, College of Life Sciences, Zhejiang University,
      Hangzhou 310058, China; feiqw1234@163.com
 3    The Key Laboratory for Quality Improvement of Agricultural Products of Zhejiang Province,
      School of Agriculture and Food Science, Zhejiang A&F University, Linan, Hangzhou 311300, China;
      SCD20180013@163.com (C.S.); tmling789@163.com (M.T.)
 4    College of modern science and technology, China Jiliang University, Hangzhou 310018, China;
      juville@cjlu.edu.cn
 *    Correspondence: 21107014@zju.edu.cn; Tel.: +86-188-0651-3995

 Received: 10 February 2019; Accepted: 9 March 2019; Published: 13 March 2019

 Abstract: Soil salinization is a major environmental stresses that seriously threatens land use efficiency
 and crop yields worldwide. Although the overall response of plants to NaCl has been well studied,
 the contribution of protein phosphorylation to the detoxification and tolerance of NaCl in okra
 (Abelmoschus esculentus L.) seedlings is unclear. The molecular bases of okra seedlings’ responses
 to 300 mM NaCl stress are discussed in this study. Using a combination of affinity enrichment,
 tandem mass tag (TMT) labeling and high-performance liquid chromatography–tandem mass
 spectrometry analysis, a large-scale phosphoproteome analysis was performed in okra. A total of 4341
 phosphorylation sites were identified on 2550 proteins, of which 3453 sites of 2268 proteins provided
 quantitative information. We found that 91 sites were upregulated and 307 sites were downregulated
 in the NaCl/control comparison group. Subsequently, we performed a systematic bioinformatics
 analysis including gene ontology annotation, domain annotation, subcellular localization, and Kyoto
 Encyclopedia of Genes and Genomes pathway annotation. The latter revealed that the differentially
 expressed proteins were most strongly associated with ‘photosynthesis antenna proteins’ and ‘RNA
 degradation’. These differentially expressed proteins probably play important roles in salt stress
 responses in okra. The results should help to increase our understanding of the molecular mechanisms
 of plant post-translational modifications in response to salt stress.

 Keywords: differentially phosphorylated protein; okra; phosphoproteome; salt stress; TMT labeling

1. Introduction
     Okra (Abelmoschus esculentus L.), an annual herb of Malvaceae family, is native to Africa and
India [1,2]. It is not only a nutrient-rich vegetable that is used in traditional Chinese medicines,
but also has a high culinary value. As a very important crop and vegetable, it is cultivated in many
temperate and subtropical parts of the world [3]. Owing its high oil production rate and great
ecological adaptability, okra is a potential bioenergy crop [4]. Most reports focus on its biological
characteristics and cultivation techniques [5–7], chemical composition and medicinal value [8–10], and
tissue culture [11,12]. However, there have been few studies on the salt tolerance of okra.
     Salt stress is an important environmental condition that limits plant growth and decreases crop
productivity. Irrigation water containing trace amounts of sodium chloride (NaCl) can increase soil

Int. J. Mol. Sci. 2019, 20, 1262; doi:10.3390/ijms20061262                          www.mdpi.com/journal/ijms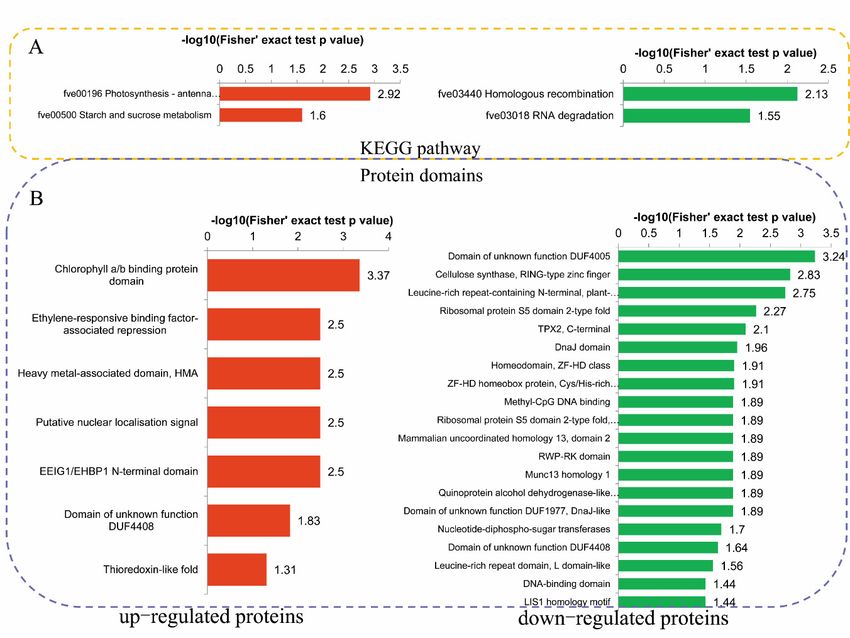
Int. J. Mol. Sci. 2019, 20, 1262                                                                    2 of 18

salinity [13,14]. Once NaCl is absorbed by plant roots, the increased accumulation of salt in plants
will cause ionic toxicity, hyperosmotic stress, and oxidative damage, damaging metabolic processes
and reducing photosynthetic efficiency [14,15]. Plants have evolved various internal and external
response strategies, resulting in the potential to adapt to salt stress by regulating ionic homeostasis,
as well as increasing salt tolerance [16]. In Arabidopsis thaliana, the Salt Overly Sensitive 1 (SOS1)—a
gene encoding a plasma membrane-localized Na+ /H+ antiporter—maintains the intracellular Na+ /K+
homeostasis [17]. The overexpression of AtSOS1 enhances salt tolerance in transgenic Arabidopsis [18].
Calcium (Ca2+ ) signal transduction is a common signaling pathway that responds to the adverse
environment encountered by eukaryotic cells [19]. Salt stress increases the Ca2+ concentration in
the cytoplasm. A myristoylated Ca2+ -binding protein—SOS3—has been proposed to sense this
signal and physically interact with and activate a Ser/Thr protein kinase, SOS2 [20]. SOS1 is one
of the downstream targets of SOS3–SOS2 complex. In addition, the phosphorylation of SOS1 by
the SOS2–SOS3 complex could improve the salt tolerance of yeast [21]. Reactive oxygen species
(ROS), as toxic by-product of normal cell metabolism, play a vital role in stress perception and
signal transduction [22,23]. The ROS, particularly hydrogen peroxide (H2 O2 ), accumulate under salt
stress [24]. Oxidative stress-activated mitogen-activated protein triple-kinase 1 (OMTK1), a novel
protein from alfalfa, is activated by H2 O2 and functions in the activation of H2 O2 -induced cell
death [25].
      The transduction of extracellular signals often relies on protein post-translational modifications
(PTMs) of proteins. Phosphorylation is the most researched and best understood PTM, and it can lead
to changes in conformation, protein–protein interactions and protein activity [26]. In eukaryotic
cells, protein phosphorylation occurs mainly at serine, threonine and tyrosine residues [27].
The technological development of phosphoproteomics provides a new opportunity for the wider
identification of phosphorylation sites. The first large-scale phosphorylation proteome research
method combines two-dimensional gel electrophoresis and mass spectrometry to identify spots [28].
Recently, isobaric tags for relative and absolute quantitation-based and tandem mass tags (TMTs)-based
quantitative proteomics approaches were developed for large-scale protein quantification [29–31].
Large-scale scans of induced phosphoproteins have been performed in order to characterize plant
responses to mechanical wounding [32], osmotic stress [33,34], drought [35], salinity [36], and high
temperature [37]. Large numbers of phosphorylation proteomic analyses have been carried out in
different plant species, such as Arabidopsis [38], rice (Oryza sativa) [39], maize (Zea mays) [15], bread
wheat (Triticum aestivum) [35], and common bean (Phaseolus vulgari) [34]. These studies mainly focused
on a few model plants, but our understanding of protein phosphorylation modifications underlying
salt stress in okra is far from comprehensive. In this study, we investigated phosphorylation-modified
proteins involved in the early stages of salt stress response in okra by employing TMT label-based
quantitative proteomics.

2. Results

2.1. Quantitative Phosphoproteomic Data Analysis
      Through affinity enrichment and then using the LC-MS/MS approach, the phosphoproteomic
changes in okra seedlings treated with salt stress were analyzed. The MS data validation is shown in
Figure 1. The mass error of all the identified peptides was confirmed. The distribution of the mass
error was near zero and most were less than 0.02 Da, indicating that the mass accuracy of the MS data
fitted the requirements (Figure 1A). The lengths of most peptides were between eight and 20 amino
acids (aa), which agreed with the tryptic peptides’ properties (Figure 1B).
      The pair-wise Pearson’s correlation coefficients among the six samples showed sufficient
reproducibility (Figure S1). The detailed information of identified peptides, including peptide sequences,
matching scores, precursor charges, modifications and delta masses, can be found in Table S1.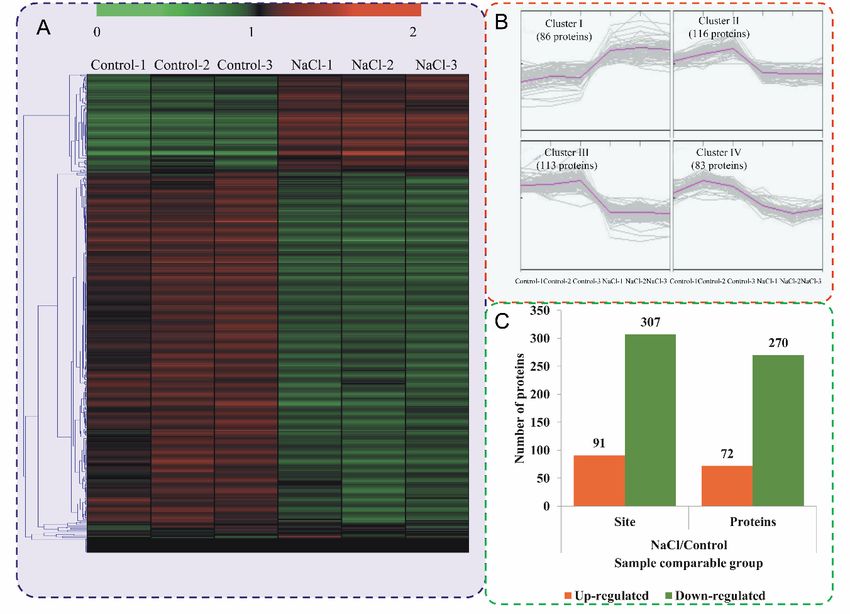
Int. J. Mol. Sci. 2019, 20, x 3 of 18
Int. J. Mol. Sci. 2019, 20, 1262 3 of 18
sequences, matching scores, precursor charges, modifications and delta masses, can be found in
Table S1.
Figure 1. Quality control (QC) validation of mass spectrometer (MS) data. (A) Mass error distribution
Figure 1. Quality
of all identified control (QC)peptides.
phosphorylated validation
(B)ofLength
mass distribution
spectrometer (MS)
of all data. (A)
identified Mass error
phosphorylated
distribution
peptides. (C) of Modification
all identifiedphosphorylated
phosphorylatedsitespeptides. (B) Length
distribution of all distribution of all identified
identified peptides. (D) The
phosphorylated peptides. (C)
distribution of phosphosites Modification
between serine (S),phosphorylated sites
threonine (T), and distribution
tyrosine of all identified
(Y) residues.
peptides. (D) The distribution of phosphosites between serine (S), threonine (T), and tyrosine (Y)
2.2. Annotation
residues. and Classification of all Identified Phosphorylated Proteins in Okra
A total of 4341 phosphorylation sites were identified on 2550 proteins, of which 3453 sites of
2.2.
2268 Annotation and Classification
proteins provided of all Identified
quantitative informationPhosphorylated
(Table S2). Proteins in Okra 63.05% of the peptides
Approximately
wereAmodified at a single
total of 4341 site, 20.42%sites
phosphorylation werewere
altered at two sites,
identified on 2550andproteins,
8.54% at of three
which sites3453
(Figure
sites1C).
of
To ensure
2268 thatprovided
proteins the resultsquantitative
were highlyinformation
reliable, we (Table
filteredS2).
the Approximately
identification data usingofa the
63.05% criterion of a
peptides
localization
were modified probability
at a single>0.75
site, and ultimately
20.42% identified
were altered at two3072 phosphorylation
sites, and 8.54% at three sitessites
on 2175 proteins,
(Figure 1C).
of which 2241 sites of 2027 proteins provided quantitative information. The filtered
To ensure that the results were highly reliable, we filtered the identification data using a criterion of data were used
aforlocalization
subsequentprobability
bioinformatics >0.75analyses. Among the
and ultimately phosphorylation
identified sites, 2607 (84.86%)
3072 phosphorylation sitesinvolved
on 2175a
serine residue,
proteins, of which 405 2241
(13.18%)sitesa of
threonine, and 60provided
2027 proteins (1.95%) aquantitative
tyrosine (Figure 1D).
information. The filtered data
were To understand
used their functions,
for subsequent all identified
bioinformatics phosphorylated
analyses. proteins were annotated
Among the phosphorylation sites, 2607 by GO terms
(84.86%)
based onathe
involved three
serine major 405
residue, categories,
(13.18%)namely biological
a threonine, and 60process,
(1.95%)cellular
a tyrosine component
(Figure 1D). and molecular
function (Figure 2A).their
To understand For the biological
functions, process category,
all identified ‘cellular process’
phosphorylated proteins(427 were proteins),
annotated ‘metabolic
by GO
process’
terms (425 proteins),
based on the three and major
‘single-organism
categories,process’
namely(173 proteins)
biological were thecellular
process, top dominantcomponent terms;and for
the molecular
molecular function
function category,
(Figure 2A). Forthethe
dominant terms
biological were category,
process ‘binding’ ‘cellular
(815 proteins),
process’ ‘catalytic activity’
(427 proteins),
(458 proteins),
‘metabolic and ‘transporter
process’ (425 proteins),activity’
and(60 proteins); and forprocess’
‘single-organism the cellular
(173component
proteins) were category,the most
top
proteins were
dominant related
terms; for tothe‘cell’ (195 proteins),
molecular function‘membrane’
category, (149the proteins),
dominantand ‘organelle’
terms (129 proteins).
were ‘binding’ (815
Most identified
proteins), proteins
‘catalytic were grouped
activity’ into 15 subcellular
(458 proteins), component
and ‘transporter categories
activity’ predicted and
(60 proteins); by Wolfpsort
for the
software,
cellular including category,
component nucleus (1007 mostproteins),
proteins chloroplast
were related (489
to proteins),
‘cell’ (195and cytoplasm
proteins), (358 proteins)
‘membrane’ (149
(Figure 2B).
proteins), and The detailed information,
‘organelle’ (129 proteins). including protein IDs,
Most identified GO, KEGG,
proteins and domain
were grouped into 15 categories,
subcellular 238
subcellular localizations and functional enrichments of all identified
component categories predicted by Wolfpsort software, including nucleus (1007 proteins), proteins, are listed in Table S3.
chloroplast (489 proteins), and cytoplasm (358 proteins) (Figure 2B). The detailed information,
including protein IDs, GO, KEGG, and domain categories, 238 subcellular localizations and
functional enrichments of all identified proteins, are listed in Table S3.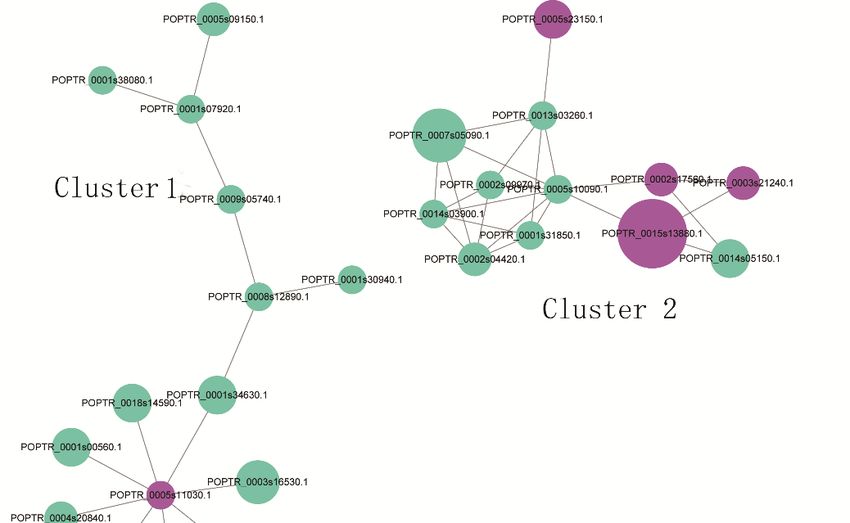
Int. J. Mol. Sci. 2019, 20, x                                                                            4 of 18
Int. J. Mol. Sci. 2019, 20, 1262                                                                          4 of 18

      Figure 2. Classification of all identified phosphorylated proteins and differentially phosphorylated
     proteins (DPPs). (A) Gene Ontology (GO) analysis of all identified phosphorylated proteins and DPPs.
     All proteins were classified by GO terms based on three categories: molecular function, biological
     process and cellular component. (B) Subcellular classify of phosphorylated proteins and DPPs.
       Figure 2. Classification of all identified phosphorylated proteins and differentially phosphorylated
2.3. Peptide Motifs
       proteins      Associated
                (DPPs).  (A) Genewith   Phosphorylation
                                     Ontology   (GO) analysis of all identified phosphorylated proteins and
       DPPs. All proteins were classified by GO terms based on three categories: molecular function,
      A total of 2514 sequences containing the 13 residues, with six upstream and six downstream
       biological process and cellular component. (B) Subcellular classify of phosphorylated proteins and
residues surrounding each of the phosphorylation sites, were obtained (Figure S2). Of these, 2255
       DPPs.
(89.70%) were centered on a serine residue, 237 (9.43%) on a threonine, and 22 (0.87%) on a tyrosine.
The serine phosphorylation category included 29 overpresented motifs: the most frequent motifs
 2.3. Peptide Motifs Associated with Phosphorylation
were ‘sP’ (355 occurrences) and ‘PxsP’ (182 occurrences), followed by ‘Rxxs’ (151 occurrences) and
       A total
‘RSxs’(116      of 2514 sequences
             occurrences). ‘tP’ was containing     the 13 motif
                                      the most frequent    residues,  with
                                                                 in the      six upstream
                                                                         threonine          and six downstream
                                                                                    phosphorylation    category.
 residues surrounding each of the phosphorylation sites, were obtained (Figure S2). Of these, 2255
2.4. Differentially
 (89.70%)           Phosphorylated
            were centered           Proteins
                            on a serine       in Response
                                          residue,         to NaCl
                                                    237 (9.43%)  onTreatment
                                                                     a threonine, and 22 (0.87%) on a tyrosine.
 The Toserine  phosphorylation
          compare                  category
                     the differentially       included 29 overpresented
                                           phosphorylated      proteins (DPPs) motifs:  the most
                                                                                   between        frequent
                                                                                              different    motifs
                                                                                                        samples,
 were   ‘sP’ (355  occurrences)   and  ‘PxsP’  (182  occurrences),  followed    by ‘Rxxs’  (151 occurrences)
expression profiles of the proteins are shown in a heatmap (Figure 3A). To reflect the changing trends        and
 ‘RSxs’(116   occurrences).  ‘tP’ was  the  most  frequent  motif  in the  threonine   phosphorylation
among the six samples, all of the DPPs were categorized into four clusters with MeV software using      category.
the K-means method. The proteins in cluster I showed high accumulations in the NaCl stress-treated
 2.4. Differentially Phosphorylated Proteins in Response to NaCl Treatment
samples, while the rest of the proteins were downregulated in the NaCl stress-treated samples
(FigureTo3B). Amongthe
           compare      thedifferentially
                            DPPs, 72 proteins    were upregulated
                                            phosphorylated    proteinsand(DPPs)
                                                                           270 proteins
                                                                                  betweenwere  downregulated
                                                                                            different   samples,
atexpression
    48 h afterprofiles
                NaCl treatment      compared
                         of the proteins         with the
                                           are shown   in acontrol
                                                             heatmap (Figure  3C).
                                                                        (Figure     AllTo
                                                                                 3A).   DPPs   were
                                                                                          reflect theclassified
                                                                                                       changing
into  11 among
 trends  subcellular   components
                  the six samples, allaccording
                                       of the DPPsto their
                                                     were subcellular
                                                           categorized localizations   (Figure
                                                                         into four clusters with2B),
                                                                                                  MeVincluding
                                                                                                        software
155  nuclear-localized
 using   the K-means DPPs,     86 chloroplast-localized
                          method.                        DPPs,Iand
                                    The proteins in cluster           47 cytoplasm-localized
                                                                  showed    high accumulationsDPPs.inThe
                                                                                                      thedetail
                                                                                                            NaCl
information   of samples,
 stress-treated  DPPs andwhile
                             differential
                                   the restphosphosites  are were
                                            of the proteins  listeddownregulated
                                                                    in Table S4.     in the NaCl stress-treated
 samples (Figure 3B). Among the DPPs, 72 proteins were upregulated and 270 proteins were
 downregulated at 48 h after NaCl treatment compared with the control (Figure 3C). All DPPs were
 classified into 11 subcellular components according to their subcellular localizations (Figure 2B),
 including 155 nuclear-localized DPPs, 86 chloroplast-localized DPPs, and 47 cytoplasm-localized
 DPPs. The detail information of DPPs and differential phosphosites are listed in Table S4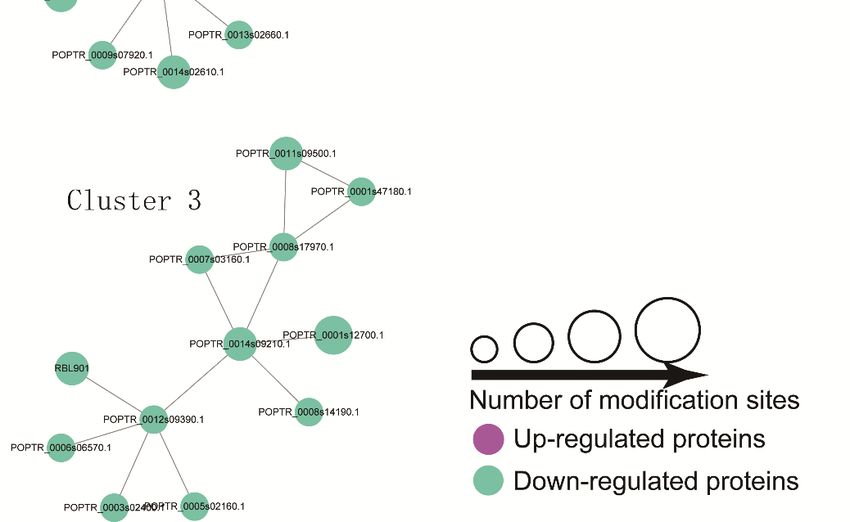
Int. J. Mol. Sci. 2019, 20, 1262                                                                                     5 of 18
Int. J. Mol. Sci. 2019, 20, x                                                                                       5 of 18

      Figure 3. Impacts of salt stress treatment on phosphorylation proteome levels in okra. (A) Expression
      Figure 3. Impacts of salt stress treatment on phosphorylation proteome levels in okra. (A)
      profiles of the DPPs in response to salt stress. (B) All DPPs were analyzed and clustered into four major
      Expression profiles of the DPPs in response to salt stress. (B) All DPPs were analyzed and clustered
      Clusters by K-means method. (C) The numbers of up- and downregulated phosphorylated proteins
      into four major Clusters by K-means method. (C) The numbers of up- and downregulated
      and phosphorylated sites in the salt treatment seedlings compared to the control seedlings.
      phosphorylated proteins and phosphorylated sites in the salt treatment seedlings compared to the
      control
      To       seedlings.
         predict   the biological functions, all DPPs were assigned to GO terms. For upregulated proteins,
the largest numbers of DPPs were found in ‘metabolic process’ (eight proteins) in the biological
     To GO
process   predict
               term,thein biological   functions, the
                          cellular component,        all DPPs     were assigned
                                                         most frequent               to GO terms.
                                                                            was ‘membrane’         (six For   upregulated
                                                                                                        proteins),    while,
proteins,  the   largest   numbers     of  DPPs    were   found    in ‘metabolic     process’
in molecular function, ‘binding’ (19 proteins) was the most highly represented group (Figure    (eight   proteins)    in4A).
                                                                                                                         the
biological
For         process GO
    downregulated           term, inthe
                         proteins,    cellular
                                          mostcomponent,       the mostprocess
                                                 enriched biological       frequentGO wasterm
                                                                                            ‘membrane’      (six proteins),
                                                                                                 was ‘cellular     process’;
while,  in molecular     function,   ‘binding’   (19 proteins)    was  the  most  highly    represented
within “cellular component”, the most enriched was related to ‘cell’ (36 proteins); and the most enriched   group   (Figure
4A).  For   downregulated        proteins,   the   most   enriched    biological    process    GO    term
term within molecular function was ‘binding’ (91 proteins) (Figure 4B). In total, 41 DPPs were involved      was   ‘cellular
process’;
in membranewithinand “cellular
                       transportcomponent”,      the mostto
                                    proteins according       enriched
                                                               the GOwas termsrelated   to ‘cell’
                                                                                 and their        (36 proteins);
                                                                                              subcellular           and the
                                                                                                             localizations
most   enriched    term   within   molecular    function    was   ‘binding’   (91  proteins)   (Figure
(Table 1). Eight of them were induced by the NaCl treatment. The GO enrichment analysis revealed that    4B).   In total, 41
DPPs
the     were involved
    molecular    function inGOmembrane        and transport
                                 term of upregulated      DPPsproteins      accordingenriched
                                                                  most significantly      to the GO was terms     and their
                                                                                                         ‘oxidoreductase
subcellular   localizations     (Table   1). Eight   of them    were   induced    by   the   NaCl
activity, acting on NAD(P)H’ and that the biological process’ GO term most significantly enriched   treatment.     The GO
enrichment     analysis    revealed    that  the   molecular     function    GO   term    of  upregulated
was ‘metal ion transport’ (Figure S3). For the downregulated DPPs, the molecular function GO terms             DPPs     most
significantly
most            enriched
      significantly          waswas
                      enriched     ‘oxidoreductase      activity,
                                       ‘transferase activity,      acting on glycosyl
                                                                transferring    NAD(P)H’       and while
                                                                                          groups’     that the
                                                                                                            the biological
                                                                                                                 biological
process’   GO     term   most    significantly    enriched    was    ‘metal   ion
process GO term most significantly enriched was ‘DNA metabolic process’ (Figure S3).transport’    (Figure    S3).   For the
downregulated DPPs, the molecular function GO terms most significantly enriched was ‘transferase
            1. Membrane
     Tabletransferring
activity,                      and transport-related
                            glycosyl   groups’ whileproteins       differentially
                                                           the biological          expressed
                                                                              process          undermost
                                                                                         GO term        salt stress  in
                                                                                                              significantly
     okra leaves.
enriched   was ‘DNA metabolic process’ (Figure S3).
    Protein Accession     Ratio              Protein Description                  Modified Sequence
      Table 1. Membrane and transport-related proteins differentially expressed under salt stress in okra
    Unigene80449_All      0.693             amino acid transporter                 TIGDIT(ph)PK
      leaves.
   CL5416.Contig1_All     0.692         ATP binding protein, putative              AS(ph)AFVLGK
       Protein Accession Ratio          Auxin-induced   protein 5NG4,
                                             Protein Description                   Modified Sequence
   CL7525.Contig9_All     0.745                                                  AKEENLGSS(ph)NQK
                                                   putative
        Unigene80449_All           0.693           amino acid transporter                        TIGDIT(ph)PK
Int. J. Mol. Sci. 2019, 20, 1262 6 of 18
Table 1. Cont.
Protein Accession Ratio Protein Description Modified Sequence
Bidirectional sugar transporter
Unigene36424_All 1.664 VVEDTKVPEETNNS(ph)IAGLSK
SWEET15
calcium-transporting ATPase 12,
CL5012.Contig7_All 1.375 FLSSS(ph)FAPK
plasma membrane-type-like
Unigene92546_All 0.75 cellulose synthase catalytic subunit LSMAS(ph)PGPVGGK
Unigene92535_All 0.727 CESA6 TVS(ph)GEIATPDNQFVR
Unigene92535_All 0.677 CESA6 HDS(ph)DS(ph)GPKPLK
Unigene92544_All 0.644 CESA6 TTS(ph)GPLGPSEK
gb|EEE94510.1| predicted: Sugar
Unigene66780_All 0.684 SLS(ph)LPTTR
phosphate transporter protein
gb|EEF37920.1| oligopeptide
Unigene78857_All 0.731 QAPETEIS(ph)IKK
transporter, putative
gb|EEF44433.1| transferase,
Unigene84207_All 0.726 TSS(ph)SLGLLFK
transferring glycosyl groups
golgi SNAP receptor complex
CL8578.Contig9_All 0.557 S(ph)LFGDVQGK
member 1
CL4324.Contig7_All 0.73 golgi snare 11 protein, putative S(ph)TFGGINSK
hypothetical protein
Unigene94022_All 1.308 LKT((ph))LELQNK
ARALYDRAFT_893642
mechanosensitive ion channel
CL18.Contig22_All 1.33 GVS(ph)FDNSPLR
protein 8-like
multidrug/pheromone exporter,
CL2667.Contig3_All 0.756 NLSYSYS(ph)TGADGR
MDR family, ABC transporter family
multidrug/pheromone exporter,
CL4242.Contig2_All 0.623 NSVSS(ph)PIITR
MDR family, ABC transporter family
multidrug/pheromone exporter,
CL2667.Contig3_All 0.72 LSHSLS(ph)TK
MDR family, ABC transporter family
CL2258.Contig6_All 0.638 Nucleoporin NUP53, putative DFS(ph)IPAK
CL23428.Contig3_All 0.675 Patellin-3, putative LKT(ph)MPTSD
Phosphate transporter PHO1
CL27908.Contig8_All 0.656 AFS(ph)GLTHR
homolog 3
PREDICTED: protein transport
Unigene2678_All 0.725 GSAAAAAS(ph)LR
protein Sec61 subunit β
protein binding protein, Zinc finger,
Unigene67918_All 1.344 RMDS(ph)FFR
putative
protein binding protein, Zinc finger,
Unigene67918_All 1.475 VIPST(ph)PR
putative
CL2662.Contig7_All 1.41 Protein kinase domain QPATSFMS(ph)AYK
CL2495.Contig20_All 0.639 sugar transporter, putative HGS(ph)LVSQR
transferase, transferring glycosyl
Unigene20607_All 0.753 RHSES(ph)GLEILNK
groups, putative
UDP-glucuronic
CL7033.Contig3_All 0.707 acid/UDP-N-acetylgalactosamine LS(ph)DGGGVPK
transporter, putative
Vacuolar cation/proton exchanger
CL27084.Contig3_All 0.541 S(ph)DSLLVSK
1a, putative
white-brown-complex ABC
CL530.Contig6_All 1.373 MMIGAS((ph))PK
transporter family
CL27656.Contig6_All 0.733 xylosyltransferase 1-like TYYS(ph)QFR
emb|CBI29277.3| PREDICTED:
Unigene52837_All 0.762 uncharacterized protein S(ph)SFPSSSSSR
LOC100259097
CL20053.Contig2_All 1.63 conserved hypothetical protein GKS(ph)LPKPYIDR
gb|EEF33488.1| transporter,
CL2142.Contig22_All 0.718 GFSHVES((ph))K
putative
PREDICTED: uncharacterized
CL23414.Contig54_All 0.727 TATHSTPVASHTDS((ph))FDSDSR
protein LOC100248394
CL24219.Contig9_All 0.674 conserved hypothetical protein KSS(ph)GPQSGGVTSSGR
hypothetical protein
CL2564.Contig3_All 0.734 ETVPQGEYS(ph)LSHTSAPFR
PRUPE_ppa000754mgInt. J. Mol. Sci. 2019, 20, 1262 7 of 18
Int. J. Mol. Sci. 2019, 20, x 7 of 18
CL2564.Contig3_All 0.734 hypothetical protein PRUPE_ppa000754mg
Table 1. Cont. ETVPQGEYS(ph)LSHTSAPFR
CL27706.Contig6_All 0.65 hypothetical protein PRUPE_ppa002944mg LAVS(ph)PGKVEGHR
Protein Accession Ratio Protein Description Modified Sequence
CL7523.Contig8_All 0.64 gb|EEE91340.1| predicted protein VSPEFSHPQSS(ph)SPMAK
CL7658.Contig6_All 0.676 hypothetical
gb|EEF00758.1| protein
predicted protein VASS(ph)PMKR
CL27706.Contig6_All 0.65 LAVS(ph)PGKVEGHR
PRUPE_ppa002944mg
CL8864.Contig7_All
CL7523.Contig8_All 0.749
0.64 unknown predicted
gb|EEE91340.1| protein protein INS(ph)SPIVSR
VSPEFSHPQSS(ph)SPMAK
CL7658.Contig6_All 0.676 gb|EEF00758.1| predicted
|gb|EEF48730.1|conserved protein
hypothetical VASS(ph)PMKR
Unigene68387_All
CL8864.Contig7_All 0.733
0.749 unknown KVS(ph)GPLESMGS(ph)MK
proteinprotein INS(ph)SPIVSR
|gb|EEF48730.1|conserved
Unigene68387_All 0.733 |gb|EEF48730.1| conserved hypothetical KVS(ph)GPLESMGS(ph)MK
Unigene68390_All 0.705 hypothetical protein KS((ph))GELGK
protein conserved
|gb|EEF48730.1|
Unigene68390_All 0.705 KS((ph))GELGK
hypothetical
gb|EEF48730.1| protein
conserved hypothetical
Unigene68390_All 0.728 KVS((ph))GPLDSMGS(ph)MK
gb|EEF48730.1|
protein conserved
Unigene68390_All 0.728 KVS((ph))GPLDSMGS(ph)MK
hypothetical protein
gb|EEF48730.1| conserved hypothetical
Unigene68390_All 0.638 gb|EEF48730.1| conserved KSNS(ph)GPLNR
Unigene68390_All 0.638 protein protein KSNS(ph)GPLNR
hypothetical
Figure 4. GO annotation analysis of DPPs. Distribution of the upregulated (A) and downregulated
Figure 4. GO annotation analysis of DPPs. Distribution of the upregulated (A) and downregulated
(B) proteins with GO annotation. Different color blocks represented different terms, including cellular
(B) proteins with GO annotation. Different color blocks represented different terms, including
component, molecular function, and biological process. Number of the upregulated proteins in each
cellular component, molecular function, and biological process. Number of the upregulated proteins
second level term was showed in a pie chart.
in each second level term was showed in a pie chart.
2.5. Enrichment Analysis of the DPPs under the NaCl Treatment
2.5. Enrichment Analysis of the DPPs under the NaCl Treatment
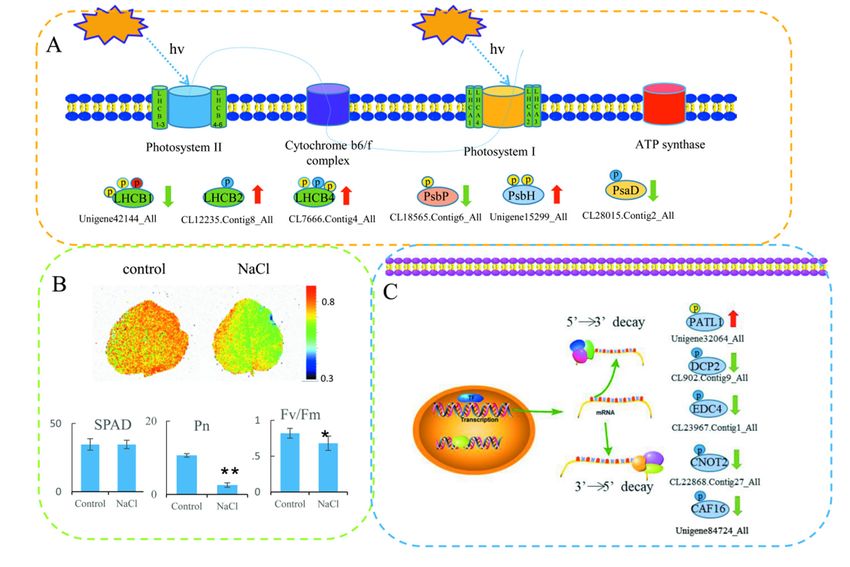
The KEGG enrichment analysis revealed that the upregulated DPPs were most strongly
The KEGG
associated enrichment analysis revealed
with ‘Photosynthesis—antenna thatand
proteins’ the‘Starch
upregulated DPPsmetabolism’
and sucrose were most pathways.
strongly
associated with ‘Photosynthesis—antenna proteins’ and ‘Starch and sucrose metabolism’
The downregulated DPPs were most strongly associated with ‘Homologous recombination’ and ‘RNA pathways.
The downregulated
degradation’ DPPs
pathways were 5A).
(Figure mostWestrongly
furtherassociated
summarized withthe‘Homologous
DPPs involved recombination’ and
in photosynthesis
‘RNA
and RNAdegradation’
degradationpathways (Figure
(Figure 6). 5A).sixWe
In total, further
proteins summarized
related the DPPs
to photosynthesis involved
were in
identified,
photosynthesis and RNA degradation (Figure 6). In total, six proteins related to photosynthesis
including light-harvesting complex II (LHCII) chlorophyll a/b-binding protein 1/2/4, photosystem II were
identified, including
oxygen-evolving light-harvesting
enhancer complex IIII(LHCII)
protein 2, photosystem protein Hchlorophyll
(PsbH), anda/b-binding
PSI reaction protein 1/2/4,
center subunit
photosystem II oxygen-evolving enhancer protein 2, photosystem II protein H (PsbH), and PSIInt.
Int.J.J.Mol.
Mol. Sci. 2019, 20,
Sci. 2019, 20, 1262
x 8 of1818
8 of
reaction center subunit II. In total, 11 phosphorylated sites were identified in these proteins (Figure
II. In total, 11 phosphorylated sites were identified in these proteins (Figure 6A). We also measured
6A). We also measured some physiological parameters owing to differences in some proteins in the
some physiological parameters owing to differences in some proteins in the photosynthetic pathways.
photosynthetic pathways. The Fv/Fm image is shown in Figure 6B. The maximum quantum
The Fv/Fm image is shown in Figure 6B. The maximum quantum efficiency of photosystem II (PSII)
efficiency of photosystem II (PSII) (Fv/Fm) and Pn values decreased significantly in NaCl treatments
(Fv/Fm) and Pn values decreased significantly in NaCl treatments compared with their respective
compared with their respective controls, but the SPAD values did not change significantly. Five
controls,
proteins but the SPAD
related values
to RNA did not change
degradation significantly.
were identified, Five proteins
including related to RNA2-associated
DNA topoisomerase degradation
were identified,
protein including DNA topoisomerase
PAT1, mRNA-decapping enzyme subunit2-associated protein PAT1,
2 (DCP), enhancer mRNA-decapping
of mRNA-decapping enzyme
protein 4,
subunit
CCR4-NOT transcription complex subunit 2, and CCR4-NOT complex subunit 16 (Figure 6C).subunit
2 (DCP), enhancer of mRNA-decapping protein 4, CCR4-NOT transcription complex
2, and CCR4-NOT complex subunit 16 (Figure 6C).
Figure 5. Kyoto Encyclopedia of Genes and Genomes (KEGG) and domain enrichment analysis of
Figure 5. Kyoto Encyclopedia of Genes and Genomes (KEGG) and domain enrichment analysis of
the DPPs in okra after salt stress treatment. (A) Significantly enriched KEGG pathways of the DPPs.
the DPPs in okra after salt stress treatment. (A) Significantly enriched KEGG pathways of the DPPs.
(B) Significantly enriched protein domains of the DPPs.
(B) Significantly enriched protein domains of the DPPs.
A protein domain enrichment analysis revealed that the domains ‘Chlorophyll a/b binding protein
A protein domain enrichment analysis revealed that the domains ‘Chlorophyll a/b binding
domain’, ‘Ethylene-responsive binding factor-associated repression’, and ‘Heavy metal-associated
protein domain’, ‘Ethylene-responsive binding factor-associated repression’, and ‘Heavy
domain (HMA)’, were enriched in the upregulated DPPs, while the downregulated DPPs were most
metal-associated domain (HMA)’, were enriched in the upregulated DPPs, while the downregulated
strongly associated with ‘Domain of unknown function DUF4005’, ‘Cellulose synthase, RING-type
DPPs were most strongly associated with ‘Domain of unknown function DUF4005’, ‘Cellulose
zinc finger’, and ‘Leucine-rich repeat-containing N-terminal, plant-type’ (Figure 5B).
synthase, RING-type zinc finger’, and ‘Leucine-rich repeat-containing N-terminal, plant-type’
(Figure 5B).Int. J. Mol. Sci. 2019, 20, 1262 9 of 18
Int. J. Mol. Sci. 2019, 20, x 9 of 18
Figure 6. DPPs involved in photosynthesis and RNA degradation. (A) DPPs involved in photosynthesis.
(B) The 6.
Figure valueDPPsof Fv/Fm,
involvedSPAD, Net photosynthetic
in photosynthesis and rate
RNA(Pn) compared to
degradation. (A)respective controls in
DPPs involved in
okra leaves after NaCl treatments. (C) DPPs involved in RNA degradation. The
photosynthesis. (B) The value of Fv/Fm, SPAD, Net photosynthetic rate (Pn) compared to respective phosphorylated
serine (S),inthreonine
controls (T), and
okra leaves aftertyrosine (Y) residues (C)
NaCl treatments. are shown in blue, yellow,
DPPs involved in RNA anddegradation.
red, respectively.
The
LHCB1/2/4: light harvesting complex II chlorophyll a/b binding protein 1/2/4;
phosphorylated serine (S), threonine (T), and tyrosine (Y) residues are shown in blue, PsbP: photosystem
yellow, and II
oxygen-evolving
red, respectively. enhancer
LHCB1/2/4:protein
light2;harvesting
PsbH: photosystem
complex IIIIchlorophyll
protein H; PsaD: PSI reaction
a/b binding center
protein subunit
1/2/4; PsbP:
photosystem II oxygen-evolving enhancer protein 2; PsbH: photosystem II protein H; PsaD: PSI2;
II; PATL1: DNA topoisomerase 2-associated protein PAT1; DCP2: mRNA-decapping enzyme subunit
EDC4; enhancer
reaction center ofsubunit
mRNA-decapping
II; PATL1:proteinDNA 4;topoisomerase
CNOT2: CCR4-NOT transcription
2-associated complex
protein PAT1; subunit
DCP2: 2;
CAF16: CCR4-NOT complex subunit 16.
mRNA-decapping enzyme subunit 2; EDC4; enhancer of mRNA-decapping protein 4; CNOT2:
CCR4-NOT transcription
2.6. Protein–Protein complex
Interactions (PPIs)subunit
of DPPs 2; CAF16: CCR4-NOT complex subunit 16.
A PPI network
2.6. Protein–Protein analysis can
Interactions reveal
(PPIs) the relationship between biological functions of different
of DPPs
phosphorylated proteins. The high quality PPI maps are shown in Figure 7, and the detailed node and
A PPI network analysis can reveal the relationship between biological functions of different
network information are listed in Tables S5 and S6. A total of 39 DPPs (76 modified sites), including
phosphorylated proteins. The high quality PPI maps are shown in Figure 7, and the detailed node
five up- and 34 downregulated peptides, was displayed in the PPI network (Figure 7). Three enriched
and network information are listed in Tables S5 and S6. A total of 39 DPPs (76 modified sites),
interaction clusters were identified from our analysis. For cluster 1, six ‘phosphorylation’-related
including five up- and 34 downregulated peptides, was displayed in the PPI network (Figure7).
proteins (downregulated), three ‘binding’-related proteins (downregulated), a small subunit ribosomal
Three enriched interaction clusters were identified from our analysis. For cluster 1, six
protein S6e (downregulated), a protein-tyrosine phosphatase-like protein, a WD40-repeat-containing
‘phosphorylation’-related proteins (downregulated), three ‘binding’-related proteins
domain protein (downregulated), and a PPM-type phosphatase domain (upregulated), have been
(downregulated), a small subunit ribosomal protein S6e (downregulated), a protein-tyrosine
included. Four ‘Ribosome’-related proteins (downregulated) and three ‘Spliceosome’-related proteins
phosphatase-like protein, a WD40-repeat-containing domain protein (downregulated), and a
(upregulated) were identified in cluster 2. For cluster 3, six nucleus-localized proteins, three
PPM-type phosphatase domain (upregulated), have been included. Four ‘Ribosome’-related
mitochondria-localized proteins, two chloroplast-localized proteins, and a chloroplast-localized protein
proteins (downregulated) and three ‘Spliceosome’-related proteins (upregulated) were identified in
cytoplasm have been identified. All DPPs in cluster three were downregulated.
cluster 2. For cluster 3, six nucleus-localized proteins, three mitochondria-localized proteins, two
chloroplast-localized proteins, and a chloroplast-localized protein cytoplasm have been identified.
All DPPs in cluster three were downregulated.Int. J. Mol. Sci. 2019, 20, 1262 10 of 18
Int. J. Mol. Sci. 2019, 20, x 10 of 18
Figure 7. Interaction
Figure network
7. Interaction of DPPs
network of analyzed by Cytoscape
DPPs analyzed sofware (version
by Cytoscape 3.0.1).
sofware The upregulated
(version 3.0.1). The
and downregulated proteins in the clusters are shown in cyan and green, respectively. Detailed
upregulated and downregulated proteins in the clusters are shown in cyan and green, respectively.
information on node and proteins can be found in Tables S5 and S6.
Detailed information on node and proteins can be found in Tables S5 and S6.
3. Discussion
3. Discussion
Plant responses to salt stress are mediated by complex molecular mechanisms, including signal
Plant responses to salt stress are mediated by complex molecular mechanisms, including signal
transduction, and the transcription and translation of salt stress-related genes. Reversible protein
transduction, and the transcription and translation of salt stress-related genes. Reversible protein
phosphorylation is a key regulatory mechanism operating in response to abiotic and biotic stresses in
phosphorylation is a key regulatory mechanism operating in response to abiotic and biotic stresses
plant [40,41]. In this study, a TMT-based quantitative phosphoproteomic approach was used to study
in plant [40,41]. In this study, a TMT-based quantitative phosphoproteomic approach was used to
the response of okra shoots to salt stress (Figure 1). Many phosphorylation sites were identified, and
study the response of okra shoots to salt stress (Figure 1). Many phosphorylation sites were
some phosphorylated proteins that might be involved in salt stress response were identified (Figure 3).
identified, and some phosphorylated proteins that might be involved in salt stress response were
These salt-responsive phosphoproteins may play important roles in salt stress signaling and response
identified (Figure 3). These salt-responsive phosphoproteins may play important roles in salt stress
in okra shoots.
signaling and response in okra shoots.
The first method for large-scale phosphorylation proteomics involved two-dimensional gel
The first method for large-scale phosphorylation proteomics involved two-dimensional gel
electrophoresis, with spots identified by mass spectrometry [28]. However, it is difficult to
electrophoresis, with spots identified by mass spectrometry [28]. However, it is difficult to identify
identify proteins of low abundance, low molecular weight (150 kDa); superacidic or basic proteins; or hydrophobic proteins by this method [42]. Recently,
superacidic or basic proteins; or hydrophobic proteins by this method [42]. Recently, an
an MS/MS-based analysis strategy using isobaric tag for relative and absolute quantitation or
MS/MS-based analysis strategy using isobaric tag for relative and absolute quantitation or
TMT-labeling was developed for large-scale phosphorylated protein quantification [43,44]. In our
study, 4341 phosphorylation sites, 2550 phosphorylated proteins, and 342 DPPs were identifiedInt. J. Mol. Sci. 2019, 20, 1262 11 of 18
TMT-labeling was developed for large-scale phosphorylated protein quantification [43,44]. In our
study, 4341 phosphorylation sites, 2550 phosphorylated proteins, and 342 DPPs were identified
(Table S2). The large number of identified phosphorylated proteins gave us the opportunity to conduct
a more in-depth and comprehensive analysis of salt-responsive proteins. ‘sP’ and ‘Rxxs’ are the
two most frequently occurring motifs for phosphoserine, and this was confirmed in okra. The ‘sP’
motif, which provides a target for cAMP- and cGMP-dependent protein kinase C, CDK protein kinase
2, Ca-dependent protein kinases, mitogen-activated protein kinase, receptor-like kinase, sucrose
nonfermenting 1-related protein kinase 2 and STE20-like kinase, has also been identified as being
overrepresented in other plants [45] (Figure S2). Meanwhile, the ‘Rxxs’ motif has been reported to be
associated with mitogen-activated protein kinase kinase, protein kinase A, and calmodulin-dependent
protein kinase [35,45].
In the face of various biotic and abiotic stresses, plants gradually regulate water and ion
transport mechanisms [46]. Maintaining cell osmotic potential under salt stress is a major
challenge for plant growth and development [47]. In this study, several membrane proteins and
ion transporters were shown to be differentially phosphorylated under salt stress, suggesting
their phosphorylation of these proteins may regulate osmotic balance in okra under salt stress
(Table 1). Under salt stress, several transporters of sugars, amino acids or ions were differentially
phosphorylated in okra, and some might be involved in osmotic regulation. Three phosphorylation
sites of two multidrug/pheromone exporter proteins in the ATP-binding cassette (ABC) transporter
subfamily B decreased, and a white-brown complex ABC transporter protein was induced after
the salt treatment in this study. ABC transporters are a class of transmembrane proteins that
are ubiquitous in prokaryotes and eukaryotes [48]. Most ABC transporters bind to adenosine
triphosphate (ATP) and release energy by hydrolyzing ATP to regulate the transmembrane transport
of substances [48]. Plant ABC transporters play key roles in plant secondary metabolite transport
and accumulation, phytohormone transport, lipid metabolism, exogenous toxin detoxification, and
plant disease resistance [49]. Some transporters and iron pumps, such as an amino acid transporter
(Unigene80449_All), a sugar phosphate transporter (Unigene66780_All), an oligopeptide transporter
(Unigene78857_All), mechanosensitive ion channel protein 8-like (CL18.Contig22_All), phosphate
transporter PHO1 homolog 3(CL27908.Contig8_All), a sugar transporter (CL2495.Contig20_All),
UDP-glucuronic acid/UDP-N-acetylgalactosamine transporter (CL7033.Contig3_All), and vacuolar
cation/proton exchanger 1a (CL27084.Contig3_All) were repressed by salt stress. Changes in
phosphorylation status of these transporters after salt stress treatment suggest that they may play
a role in regulating ion and small molecule concentrations to balance cell osmotic potential and
reduce cytoplasmic water loss. Four phosphorylation sites of three cellulose synthase proteins
decreased after salt treatment in this study. The cell wall plays an important role in maintaining
cell morphology, and the cellulose synthase family proteins is involved in cell wall formation was
regulated at phosphorylation level [50,51].
We detected changes in some phosphorylated proteins involved in photosynthesis after the salt
treatment (Figure 6A). Similar results were also reported found in A. thaliana [24]. Phosphorylation at
sites on three light-harvesting II complex (LHCII) proteins—LHB1B2, LHCb4.2, and LHCb1.2—were
induced following exposure to salt or H2 O2 stresses, as were sites on PsbH and PsaP [24].
The phosphorylation of LHCII proteins adapts to environmental changes [52]. The phosphorylation of
LHCII participates in the energy distribution between the two photosystem, and the signal transduction
between light reception and the phosphorylation of LHCII is correlated with the redox state of the
proton quinone pool. Thus, a reduction of proton quinone leads to the activation of the kinase [53].
Phosphorylation of PsbH proteins regulates the whole membrane network rearrangement of plant
thylakoids [24]. Therefore, the phosphorylation of chloroplast proteins affects the redox state [54].
Several DDPs involved in the mRNA degradation pathway (Figure 6C). Removing the 50 caps of
mRNA is an important step in post-transcriptional regulation, because it represents a movement
away from active translation and is a prerequisite for the rate-limiting degradation of exogenousInt. J. Mol. Sci. 2019, 20, 1262 12 of 18
ribonucleases [55]. The correlation between transcriptional level and protein abundance was poor after
the salt treatment [56]. The transcriptional level was mainly disconnected from the active polymer
during dehydration stress [57], indicating that the post-transcriptional regulation mechanism was
activated in the early dehydration reaction [58,59]. Our data identified that phosphorylation of DNA
topoisomerase 2-associated protein PAT1 increased at the threonine residue, while mRNA-decapping
enzyme subunit 2, enhancer of mRNA-decapping protein 4, CCR4-NOT transcription complex subunit
2, and CCR4-NOT complex subunit 16 decreased at serine residues following the NaCl treatment,
which suggests that mRNA decapping is altered in response to salt stress.
Ca2+ is involved in plant signal transduction under environmental stress, and CDPks play a key
role in Ca2+ mediated signal transduction pathway [51]. A calmodulin-like protein(CL9944.Contig4_All)
and CDPk protein (Unigene71267_Alll) were decreased at phosphorylation level under NaCl treatments,
indicating the Ca2+ -mediated pathway participates in salt stress signaling in okra shoots (Figure 7
and Table S5). Protein degradation in plants may be activated under salt stress. Previous proteomic
studies have identified a large number of salt stress-related proteins related to protein synthesis,
folding and degradation [47,60,61]. In the present study, we observed that five ribosomal protein
(40S ribosomal protein S6A, CL2686.Contig12_All; ribosomal protein S15e, CL9991.Contig2_All;
ribosomal protein S9, CL19354.Contig5_All; ribosomal protein S6e, Unigene79731_All; ribosomal
protein S6-like, Unigene55159_All) decreased at the phosphorylation level under NaCl treatment
(Figure 7 and Table S4). The reduction of these phosphoribosomal proteins supports the view that
salt stress usually inhibits protein synthesis [36]. Ribosomal protein S6 (rps6), a component of the
40S ribosomal subunit, whose phosphorylation status can be affected by osmotic stress via TOR
pathway [62,63].
4. Materials and Methods
4.1. Plant Materials and Treatment
Seeds of the okra cultivar ‘Wufu’ were used in this study. The seeds were disinfected with
1% sodium hypochlorite for 10 min and washed with distilled water three times. Seeds were
sown in plastic trays of turfy soil. One week after germination, half-strength Hoagland’s nutrient
solution was used for irrigation every 3 days. Seedlings were grown in an artificial illumination
incubator with a photoperiod of 12-h light/12-h dark, relative humidity of 60%, and light intensity
of 300 µmol m−2 s−1 . Three weeks after germination, 20 mL of 300 mmol L−1 NaCl was applied.
After 48 h treatment, the chlorophyll fluorescence images were captured using a FluorCam 800
imaging system (PhotonSystems Instruments, Brno, Czechia Republic) as previously described by
Feng et al. [64]. After acquiring the chlorophyll fluorescence imaging data, the aboveground parts
of the okra plants were harvested to measure the chlorophyll content using a SPAD meter (502DL
Plus, SPECTRUM, Illinois, IL, USA). Net photosynthesis (Pn) was measured by using a portable
photosynthesis system (LI 6400, LI-COR, Lincoln, NE, USA) with a red/blue LED light source at
1000 µmol m−2 s−1 Photosynthetic Photon Flux Density.
4.2. Protein Extraction and Digestion
At 48 h after salt treatment, the aboveground seedling samples were fully ground to a powder
in liquid nitrogen. Four-fold volume phenol extraction buffer (containing 10 mM dithiothreitol,
1% protease inhibitor, and 1% phosphatase inhibitor) was added to the samples of each group,
and ultrasonic pyrolysis was performed in high intensity ultrasonic processor (Scientz, Ningbo,
China). An equal volume of Tris-saturated phenol was added and centrifuged (4 ◦ C, 10 min, 5000 g).
The supernatant was removed and precipitated overnight with a 5× volume of 0.1 M ammonium
acetate/methanol solution. The precipitated protein was washed successively with methanol and
acetone. The protein was redissolved in 8 M urea, and the protein concentration was determinedInt. J. Mol. Sci. 2019, 20, 1262 13 of 18
using a bicinchoninic acid assay (BCA) kit (CW0014; CWBIO, Beijing, China), according to the
manufacturer’s instructions.
For trypsin digestion, dithiothreitol was added to the protein solution, resulting in a 5-mM final
concentration, and reduced for 30 min at 56 ◦ C. Then, iodoacetamide was added to an 11-mM final
concentration and the samples were incubated at room temperature for 15 min in the dark. Finally, the
urea concentration of the samples was diluted to below 2 M by adding 100 mM triethyl ammonium
bicarbonate. Trypsin was added at 1:50 mass ratio (trypsin: protein) for the first hydrolysis overnight
at 37 ◦ C and at 1:100 (trypsin: protein) mass ratio for a second 4-h digestion.
4.3. TMT Labeling and High-Performance Liquid Chromatography (HPLC) Fractionation
After trypsin digestion, peptides were desalted using Strata X C18 solid-phase extraction
(Phenomenex, Torrance, CA, USA) and vacuum freeze-dried. The peptides were dissolved in
0.5 M triethyl ammonium bicarbonate and labeled using a TMT kit (ThermoFisher, Shanghai, China)
according to the manufacturer’s instructions. Briefly, the labeled reagent was dissolved in acetonitrile
after thawing and incubated at room temperature for 2 h after mixing with the peptides. Then, the
peptide mixture was desalted and freeze-dried under vacuum.
The peptides were fractionated by high pH reversed HPLC with a Thermo Betasil C18 column
(5 µm diameter, 10 mm inner diameter, 250 mm length). The operation was as follows: peptides were
first separated into 60 fractions using a gradient of 8% to 32% acetonitrile (pH 9.0) over 60 min. Then,
the peptides were pooled into 18 fractions and dried by vacuum centrifugation.
4.4. Affinity Enrichment
The peptides were dissolved in a concentrated buffer solution (50% acetonitrile/6% trifluoroacetic
acid), and the supernatant was transferred to the immobilized metal ion/metal chelate material, which
had been washed in advance. The peptide–resin mixture were placed on a rotary table and gently
shaken. After this incubation period, the resin was washed three times successively with buffer
solutions of 50% acetonitrile/6% trifluoroacetic acid and 30% acetonitrile/0.1% trifluoroacetic acid.
The phosphopeptides were then eluted with 10% ammonia solution. The eluent was collected and
vacuum freeze-dried. After being drained, the eluent was de-salted using C18 ZipTips according
to the manufacturer’s instructions. After vacuum freeze-drying, the eluent was used for liquid
chromatography–tandem mass spectrometry (LC-MS/MS) analysis.
4.5. LC-MS/MS Analysis
The peptides were dissolved in an aqueous solution of 0.1% (v/v) formic acid and separated using
an EASY-nLC 1200 ultrahigh-performance liquid phase system (Thermo Fisher Scientific, Waltham,
MA, USA). The liquid gradient settings were as follows: 0–38 min, 4%–22% B; 38–52 min, 22%–32%
B; 52–56 min, 32%–80% B. Solvent B was an aqueous solution containing 0.1% formic acid and 90%
acetonitrile. The flow rate was maintained at 450 nL/min.
The peptides were ionized using an NSI ion source and then analyzed by Q ExactiveTM HF-X mass
spectrometry (ThermoFinnigan, Somerset, NJ, USA). The ion source voltage was set at 2.0 kV, and the
peptide parent ions and their secondary fragments were detected and analyzed using a high-resolution
Orbitrap. The scanning range of the first-order mass spectrometry was set to 350–1600 m/z, and the
scanning resolution was set to 60,000. The fixed starting point of the second-order mass spectrum
scanning range was 100 m/z, and the second-order scanning resolution was set at 30,000. In the data
acquisition mode, the data-dependent scanning program was used, in which, the parent ions of the
first 20 peptides with the highest signal intensity were selected to enter the higher-energy C-trap
dissociation collision pool successively after the first scan. The fragmentation energy was set at 28%,
and the second-order mass spectrometry analysis was performed successively. To improve the effective
utilization rate of mass spectrometry, the automatic gain control was set to 1E5, the signal thresholdInt. J. Mol. Sci. 2019, 20, 1262 14 of 18
was set to 5E3, the maximum injection time was set to 100 ms, and the dynamic exclusion time of the
tandem mass spectrometry scanning was set to 15 s to avoid the repeated scanning of parent ions.
4.6. Database Search
The resulting MS/MS data were queried against our previously published okra transcriptome
data (NCBI Sequence Read Archive database accession: SRP130180) using the Maxquant search engine
(v.1.5.2.8) concatenated with the reverse decoy database [65]. The enzyme digestion mode was set as
Trypsin/P. The number of missing cut points was set as 2. The minimum length of the peptide segment
was set to seven amino acid (aa) residues. The maximum modification number of modifications for a
peptide segment was set as five. First search and Main search were set as 20 PPM and 5 PPM, respectively,
and the mass error tolerance of secondary debris ions was 0.02 Da. Cysteine alkylation was set as the
fixed modification, and the alterable modification was methionine oxidation. The quantitative method
was set as tmt-6plex, and the FDR for protein identification and PSM identification were set at 1%.
4.7. Annotation Methods and Functional Enrichment
The gene ontology (GO) annotation of the proteome was derived from the UniProt-GOA database
(http://www.ebi.ac.uk/GOA/). First, the identified protein IDs were converted to UniProt IDs
and then mapped to GO IDs. The InterProScan software was used to annotate the protein’s GO
function based on the protein sequence alignment method if the proteins were not annotated by
the UniProt-GOA database. For each category, a two-tailed Fisher’s exact test was employed to test
the enrichment of the differentially expressed protein (DEP) against all identified proteins. A GO
annotation with a corrected p-value < 0.05 was considered significant. The Kyoto Encyclopedia of
Genes and Genomes (KEGG) database was used to annotate protein pathways. The InterPro domain
database (http://www.ebi.ac.uk/interpro/) was used to analyze identified the functional descriptions
of protein domains. A pathway with a corrected p-value < 0.05 was considered significant. Wolfpsort
(http://www.genscript.com/psort/wolf_psort.html), a subcellular localization predication software,
PSORT/PSORT II version, was used to predict subcellular localization. The InterPro database was
searched, and a two-tailed Fisher’s exact test was employed to test the enrichment of the DEP against
all identified proteins. Protein domains with a p-value < 0.05 were considered significant. The software
motif-x was used to analyze the models of sequences that contained the amino acids in specific positions
of modify-13-mers (six amino acids upstream and downstream of the site) in all protein sequences.
Additionally, all the database protein sequences were used as background database parameters, and
the other parameters were set at default.
4.8. Protein–Protein Interaction Network
All differentially phosphorylated proteins that were classified as identifiers were queried against
the STRING database version 10.5 (http://string-db.org/cgi/input.pl) for protein–protein interactions.
The differential protein interactions were extracted according to the confidence score of >0.7 (high
confidence). Then, the R package “network workd3” tool (https://cran.r-project.org/web/packages/
networkD3/) was used to visualize the differential protein interaction networks.
5. Conclusions
In summary, we presented a comprehensive large-scale phosphoproteome of okra using a
combination of affinity enrichment and TMT labeling high-resolution LC-MS/MS analysis. A total
of 4341 phosphorylation sites were identified on 2550 proteins. We also investigated the DPPs
that changed after the exposure of okra seedlings to salt or water for 48 h. In total, 342 DPPs
(399 phosphorylated sites) were identified, 72 (91 sites) of which were upregulated and 270 (307 sites)
were downregulated under salt stress conditions. A number of DPPs were involved in photosynthesis
and mRNA degradation pathway. Our data will provide a basic resource that will assist understanding
of the molecular mechanisms involved in the responses of okra plants to salt stress.You can also read