Attenuation of Oxidative Stress and Inflammatory Response by Chronic Cannabidiol Administration Is Associated with Improved n-6/n-3 PUFA Ratio in ...
←
→
Page content transcription
If your browser does not render page correctly, please read the page content below
nutrients
Article
Attenuation of Oxidative Stress and Inflammatory Response
by Chronic Cannabidiol Administration Is Associated with
Improved n-6/n-3 PUFA Ratio in the White and Red Skeletal
Muscle in a Rat Model of High-Fat Diet-Induced Obesity
Patrycja Bielawiec * , Ewa Harasim-Symbor                        , Klaudia Sztolsztener          , Karolina Konstantynowicz-Nowicka
and Adrian Chabowski

                                          Department of Physiology, Medical University of Bialystok, Mickiewicz Str. 2C, 15-222 Bialystok, Poland;
                                          eharasim@umb.edu.pl (E.H.-S.); klaudia.sztolsztener@umb.edu.pl (K.S.);
                                          karolina.konstantynowicz@umb.edu.pl (K.K.-N.); adrian@umb.edu.pl (A.C.)
                                          * Correspondence: patrycja.bielawiec@umb.edu.pl; Tel.: +48-85-7485585; Fax: +48-85-7485586

                                          Abstract: The consumption of fatty acids has increased drastically, exceeding the nutritional require-
                                          ments of an individual and leading to numerous metabolic disorders. Recent data indicate a growing
                                          interest in using cannabidiol (CBD) as an agent with beneficial effects in the treatment of obesity.
                                Therefore, our aim was to investigate the influence of chronic CBD administration on the n-6/n-3

                                          polyunsaturated fatty acids (PUFAs) ratio in different lipid fractions, inflammatory pathway and
Citation: Bielawiec, P.;                  oxidative stress parameters in the white and red gastrocnemius muscle. All the designed experiments
Harasim-Symbor, E.; Sztolsztener, K.;
                                          were performed on Wistar rats fed a high-fat diet (HFD) or a standard rodent diet for seven weeks
Konstantynowicz-Nowicka, K.;
                                          and subsequently injected with CBD (10 mg/kg once daily for two weeks) or its vehicle. Lipid
Chabowski, A. Attenuation of
                                          content and oxidative stress parameters were assessed using gas–liquid chromatography (GLC),
Oxidative Stress and Inflammatory
                                          colorimetric and/or immunoenzymatic methods, respectively. The total expression of proteins of
Response by Chronic Cannabidiol
Administration Is Associated with
                                          an inflammatory pathway was measured by Western blotting. Our results revealed that fatty acids
Improved n-6/n-3 PUFA Ratio in the        (FAs) oversupply is associated with an increasing oxidative stress and inflammatory response, which
White and Red Skeletal Muscle in a        results in an excessive accumulation of FAs, especially of n-6 PUFAs, in skeletal muscles. We showed
Rat Model of High-Fat Diet-Induced        that CBD significantly improved the n-6/n-3 PUFA ratio and shifted the equilibrium towards anti-
Obesity. Nutrients 2021, 13, 1603.        inflammatory n-3 PUFAs, particularly in the red gastrocnemius muscle. Additionally, CBD prevented
https://doi.org/10.3390/nu13051603        generation of lipid peroxidation products and attenuated inflammatory response in both types of
                                          skeletal muscle. In summary, the results mentioned above indicate that CBD presents potential
Academic Editor: R. Andrew Shanely        therapeutic properties with respect to the treatment of obesity and related disturbances.

Received: 25 March 2021
                                          Keywords: cannabidiol; cannabis; inflammation; insulin resistance; lipids; oxidative stress
Accepted: 7 May 2021
Published: 11 May 2021

Publisher’s Note: MDPI stays neutral
                                          1. Introduction
with regard to jurisdictional claims in
published maps and institutional affil-        Nowadays, according to the World Health Organization, obesity is one of the most
iations.                                  significant health problems of the 21st century [1]. An increased prevalence of obesity
                                          in the world is attributed to many factors, including overnutrition, sedentary lifestyle,
                                          as well as many environmental and genetic factors, which were confirmed by a num-
                                          ber of epidemiological and clinical studies [2]. During the progression of obesity, the
Copyright: © 2021 by the authors.
                                          excessive amounts of lipids are deposited in non-adipose tissues (e.g., liver, skeletal and
Licensee MDPI, Basel, Switzerland.
                                          cardiac muscle) leading to dyslipidemia, hyperglycemia and hyperinsulinemia [3–5]. These
This article is an open access article
                                          metabolic complications strongly correlate with the development of insulin resistance (IR),
distributed under the terms and           the occurrence of which plays a pivotal role in the pathogenesis of many chronic diseases
conditions of the Creative Commons        such as type 2 diabetes mellitus (T2D), metabolic syndrome (MetS) and cardiovascular
Attribution (CC BY) license (https://     diseases (CVDs) [6,7].
creativecommons.org/licenses/by/               During this past decade, several studies reported the relevant role of chronic inflam-
4.0/).                                    mation in the development of IR [8]. It was widely demonstrated that chronic overnutrition

Nutrients 2021, 13, 1603. https://doi.org/10.3390/nu13051603                                                https://www.mdpi.com/journal/nutrients
Nutrients 2021, 13, 1603 2 of 25
elicits an inflammatory response leading to systemic and tissue-specific low-grade inflam-
mation through the release of proinflammatory cytokines, including interleukin 6 (IL-6),
tumor necrosis factor alpha (TNF-α), as well as production of reactive oxygen species (ROS),
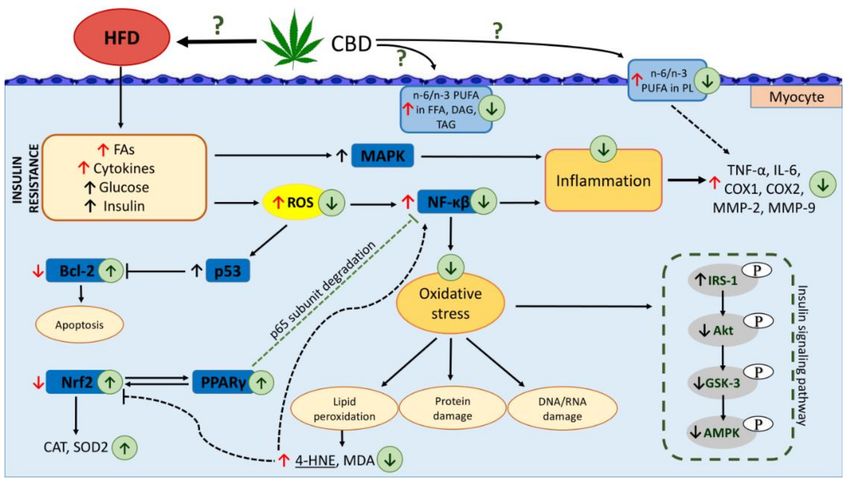
which directly attenuate insulin signaling in insulin-sensitive tissues (Scheme 1) [8–10].
What is more, a high-fat diet (HFD) provides large amounts of polyunsaturated fatty acids
(PUFAs), which are substrates for the synthesis of signaling molecules, eicosanoids (e.g.,
prostaglandins, prostacyclins, leukotrienes and thromboxanes) that affect functions of
many tissues and organs in physiological and pathological conditions [11].
Scheme 1. Effects of a high-fat diet (HFD) and two-week cannabidiol (CBD) administration on
the n-6/n-3 polyunsaturated fatty acids (PUFAs) ratio in different lipid fractions (free fatty acids
(FFAs), diacylglycerols (DAGs), triacylglycerols (TAGs) and phospholipids (PLs)), oxidative stress
and inflammatory pathway in rat myocytes; ↑, increase; ↓, decrease; red arrow indicates the effects of
seven weeks of high-fat diet feeding; black arrow indicates the effects of obesity; green arrow indicates
the effects of two weeks of CBD treatment in high-fat diet fed rats; fatty acids (FAs); mitogen-activated
protein kinase (MAPK); reactive oxygen species (ROS); p53 protein (p53); B cell lymphoma 2 (Bcl-2);
nuclear factor κB (NF-κB); tumor necrosis factor α (TNF-α); interleukin 6 (IL-6); cyclooxygenase 1
(COX1); cyclooxygenase 2 (COX2); matrix metalloproteinase-2 (MMP-2), matrix metallo-proteinase-9
(MMP-9), peroxisome proliferator-activated receptor gamma (PPARγ); nuclear factor erythroid 2-
related factor 2 (Nrf2); catalase (CAT), superoxide dismutase 2 (SOD2); 4-hydroxynonenal (4-HNE);
malonyldialdehyde (MDA); insulin receptor substrate 1 (IRS-1), protein kinase B (Akt); glycogen
synthase kinase 3 (GSK-3); 5’AMP-activated protein kinase (AMPK).
Moreover, data from numerous studies indicate that another mechanism which acti-
vates the proinflammatory cascade and appears to be of central importance is oxidative
stress, which is defined as the imbalance between the production of ROS and reactive
nitrogen species (RNS), and the effectiveness of enzymatic (e.g., catalase (CAT), superoxide
dismutase (SOD) and glutathione peroxidase (GPx)) and non-enzymatic (e.g., reduced
glutathione (GSH)) antioxidant protection [12]. Redox balance alterations in favor of
ROS/RNS overproduction cause peroxidation of proteins and lipids as well as oxidative
damage of nucleic acids, which may result in damage to cellular structures, including
membranes, mitochondria and DNA (Scheme 1) [13].
In recent years, numerous studies based on newly emerging data have confirmed that
the endocannabinoidome (eCBome) is a key player in the regulation of energy metabolism
and its alterations. This complex lipid signaling system is also involved in the control of ther-
mogenesis, neuromodulatory action and inflammatory processes [14,15]. By the turn of the
last century, it was established that eCBome consists of endogenous ligands derived fromNutrients 2021, 13, 1603 3 of 25
long-chain PUFAs known as endocannabinoids (ECs), mostly N-arachidonoylethanolamine
(anandamide (AEA)) and 2-arachidonoylglycerol (2-AG), with their own anabolic and
catabolic pathways [16]. The action of ECs is mediated via widespread cannabinoid re-
ceptors CB1 and CB2 , as well as many other molecular targets [17–19]. It is important
to remark that ECs themselves have many structural congeners, and these compounds
exist in dynamic balance with other lipid-derived mediators, including prostamides and
eicosanoids [15]. Additionally, ECs serve as an endogenous source of arachidonic acid
(AA) which is generated from AEA and 2-AG via the fatty acid amide hydrolase (FAAH)
and monoacylglycerol lipase (MAGL), respectively [20].
Over the past century, the Cannabis sativa plant has been extensively studied for its
medical properties. So far, more than 120 terpenophenolic compounds have been isolated
from this medicinal plant [21]. Among all phytocannabinoids, cannabidiol (CBD) has
been in the spotlight for several decades due to its excellent safety profile, lack of psy-
choactive effects and plenty of indicated therapeutic properties including neuroprotective,
analgesic, anti-epileptic, anti-oxidative, anti-inflammatory and potential anti-obesity prop-
erties [22–24]. Considering “classic” cannabinoid CB1 and CB2 receptors, CBD has a very
low affinity for these receptors, whereas it has been reported that this phytocannabinoid
can modulate diverse G protein-coupled receptors (GPCRs) (e.g., GPR55 and GPR18),
thermosensitive transient receptor potential (TRP) channels (vanilloid type-1 receptor,
TRPV1) as well as opioid and peroxisome proliferator-activated receptors (PPARs: PPARα
and PPARγ) [23,25,26]. Additionally, CBD has also been shown to alter the eCBome tone
by inhibiting FAAH and subsequent AEA hydrolysis [27]. All the above mechanisms of
CBD action demonstrate how complex the pharmacology it exhibits is, which must be
taken into consideration in order to understand its therapeutic potential under various
pathophysiological conditions. Taking this into consideration, the present study aimed
to investigate the impact of CBD on the n-6/n-3 PUFA ratio in different lipid fractions
(free fatty acids (FFAs), diacylglycerols (DAGs), triacylglycerols (TAGs) and phospholipids
(PLs)), oxidative stress parameters as well as the inflammatory pathway in the white and
red skeletal muscle (musculus gastrocnemius) of rats with obesity induced by a high-fat
diet. Moreover, our research reveals a comprehensive relationship between the endo-
cannabinoid system, the influence of n-6, n-3 PUFA contents and the oxidative stress along
with inflammation associated with obesity. Furthermore, the study compares the CBD’s
influence on two different metabolic types of skeletal muscle.
2. Materials and Methods
2.1. Animals and Experimental Protocol
The experiment was carried out on male Wistar rats weighing approximately 70–100 g
obtained from the Center for Experimental Medicine of the Medical University of Bialystok,
Poland. The animals were housed under standard holding conditions (22 ± 2 ◦ C with
a cycle of 12 h light/12 h dark) in plastic cages with unrestricted access to water and
commercial pellet chow (Labofeed B, animal feed manufacturer “Morawski,” Kcynia,
Poland). All the conducted procedures were evaluated and approved by the animal ethics
committee in Olsztyn (No. 71/2018). The rats, after a period of acclimatization (seven days),
were randomly divided into four groups: (1) control group fed a standard rodent diet
(containing 12.4 kcal% fat, 57.1 kcal% carbohydrates and 30.5 kcal% protein), (2) CBD
group fed a standard rodent diet and administered CBD, (3) HFD group fed a high-fat diet
(containing 60 kcal% fat, 20 kcal% carbohydrates and 20 kcal% protein) and (4) HFD + CBD
group fed a high-fat diet and administered CBD. Each experimental group consisted of
ten rats. For seven weeks of the study, the animals received a standard diet or an HFD,
and starting from the sixth week, rats were injected intraperitoneally (i.p.) with CBD or its
vehicle. Respective control and HFD fed rats were injected i.p. once a day for two weeks
with synthetic CBD (10 mg/kg, purity ≥ 99%; THC Pharm GmbH, Frankfurt, Germany)
or its solvent (3:1:16, ethanol, Tween-80 and 0.9% NaCl). At the end of the experiment,
twenty-four hours after the last dose of CBD or its vehicle, rats were anaesthetized i.p.Nutrients 2021, 13, 1603 4 of 25
with pentobarbital (80 mg/kg of body weight). Thereafter, whole blood was collected
into test tubes with heparin through an inferior vena cava puncture and centrifuged to
separate plasma. Muscle samples (red gastrocnemius muscle with predominant oxidative
metabolism and white gastrocnemius muscle with largely anaerobic metabolism) were
excised, and visible fatty tissue was mechanically removed. The obtained samples were
at once frozen with aluminum tongs precooled in liquid nitrogen and then stored at
−80 ◦ C until final examination. Throughout the whole experiment, body weight of each
rat was monitored (we observed significantly increased body weight in HFD fed rats;
however, chronic CBD administration did not substantially affect the body weight in rats
fed either a standard chow or a high-fat diet). Moreover, at the end of the experiment, we
evaluated glucose and insulin concentrations as well as the HOMA-IR value, which was
published previously [28].
2.2. Analysis of the Muscle and Plasma Lipid Contents
Intramuscular (FFA, DAG, TAG and PL) and plasma lipid (FFA and TAG) con-
tents were determined by means of gas–liquid chromatography (GLC) as previously
described [29]. In brief, the frozen muscle samples were pulverized with aluminum mortar
precooled in liquid nitrogen. Subsequently, the muscle tissue and plasma lipids were
extracted in a chloroform–methanol (2:1 vol/vol) solution using the Folch method [30].
Then, FFA, DAG, TAG and PL fractions were separated by thin-layer chromatography
(TLC) on silica gel plates (Silica Plate 60, 0.25 mm; Merck, Darmstadt, Germany). Thereafter,
the individual fatty acid methyl esters were quantified according to the standard retention
times using GLC (Hewlett-Packard 5890 Series II gas chromatograph, HP-INNOWax capil-
lary column). Total intramuscular FFA, DAG, TAG and PL as well as plasma FFA and TAG
concentrations were estimated as the sum of the particular fatty acid species content in the
selected fraction and expressed in nanomoles per gram of wet tissue and as nanomoles per
milliliter in blood plasma.
2.3. Determination of Oxidative and Antioxidative Parameters
In order to determine the oxidative stress parameters, samples of the white and red
skeletal muscles were homogenized in an ice-cold phosphate-buffered saline (PBS) with
the addition of protease and phosphatase inhibitors (Roche Diagnostics GmbH, Manheim,
Germany) at 20 mg of tissue/1 mL PBS for catalase (CAT), superoxide dismutase 2 (SOD2)
and total antioxidant capacity (TAC); at 10 mg of tissue/90 µL PBS for advanced glycation
end product (AGE) and 4-hydroxynonenal (4-HNE); in a radioimmunoprecipitation assay
(RIPA) buffer containing a cocktail of protease and phosphatase inhibitors (Roche Diag-
nostics GmbH, Manheim, Germany) at 25 mg of tissue/250 µL RIPA for malondialdehyde
(MDA) determination. Subsequently, the homogenates in the PBS were centrifuged for five
minutes at 12,000× g at 4 ◦ C to assess CAT, SOD2 and TAC, and for evaluation of AGE and
4-HNE, they were centrifuged at 5000× g for five minutes at 4 ◦ C. For MDA determination,
homogenates in the RIPA buffer were centrifuged for 10 min at 1600× g (4 ◦ C). Thereafter,
the supernatants were collected and stored in aliquots at −80 ◦ C for later use.
The concentrations of CAT and SOD2 in muscle homogenates were measured with
the use of a commercial ELISA kit from Cloud-Clone Corp. (Houston, TX, USA) following
the manufacturer’s instructions. The intensity of colored products was determined at the
450-nm wavelength in a hybrid multimode microplate reader (Synergy H1TM, BioTek
Instruments, Winooski, VT, USA) and, for each measurement, the calculated values were
based on the obtained standard curve. The CAT and SOD2 concentrations were expressed
in nanograms and picograms per milligram of tissue, respectively.
In order to evaluate the TAC parameter in muscle samples, we used a colorimetric
method (TAC assay kit, Abcam, Cambridge, UK). The absorbance was measured colori-
metrically at 570 nm (Synergy H1TM, BioTek Instruments, Winooski, VT, USA). The value
of the TAC parameter was calculated according to the manufacturer’s instructions and
expressed in nanomoles per milligram of tissue.Nutrients 2021, 13, 1603 5 of 25
To determine intramuscular MDA content, we used a commercial kit purchased from
Cayman Chemical Company (Ann Arbor, MI, USA) using the thiobarbituric acid reactive
substances (TBARS) method. The intensity of reaction products (MDA–TBA adducts) was
measured colorimetrically at the 530-nm wavelength in a hybrid multimode microplate
reader (Synergy H1TM, BioTek Instruments, Winooski, VT, USA). MDA concentration
was calculated based on the standard curve and expressed as nanomoles per milligram
of tissue.
Intramuscular AGE and 4-HNE concentrations were assessed using ELISA kits from
Biorbyt (Cambridge, UK) according to the manufacturer’s protocol. The absorbance was
measured spectrophotometrically at the 450-nm wavelength in a hybrid multimode mi-
croplate reader (Synergy H1TM, BioTek Instruments, Winooski, VT, USA). The values of
AGE and 4-HNE were calculated from standard curves and expressed in nanograms and
picograms per milligram of tissue, respectively.
2.4. Western Blotting
Routine Western blotting procedure was used to determine total protein expression as
it was reported in detail previously [31,32]. Briefly, red and white muscle samples were
homogenized in an ice-cold RIPA buffer with the addition of protease and phosphatase
inhibitors (Roche Diagnostics GmbH, Manheim, Germany). The determination of the total
protein concentration in muscle homogenates was performed using the bicinchoninic acid
(BCA) protein assay method with bovine serum albumin (BSA) as a standard. Subsequently,
homogenates (30 µg of proteins) were reconstituted in the Laemmli buffer and separated on
CriterionTM TGX Stain-Free precast gels (Bio-Rad, Hercules, CA, USA). Then, the proteins
were transferred to nitrocellulose or polyvinylidene fluoride (PVDF) membranes in wet and
semi-dry conditions, respectively. Next, the membranes were blocked in the Tris-buffered
saline with Tween-20 (TBST) and 5% non-fat dry milk or 5% BSA and then incubated
overnight at 4 ◦ C with primary antibodies, i.e., cyclooxygenase-1 (COX-1, 1:500; Abcam,
Cambridge, UK), cyclooxygenase-2 (COX-2, 1:500; Santa Cruz Biotechnology, Inc., Dallas,
TX, USA), 5-lipoxygenase (5-LO, 1:1500; Abcam, Cambridge, UK), 15-lipoxygenase (15-LO,
1:500; Santa Cruz Biotechnology, Inc., Dallas, TX, USA), peroxisome proliferator-activated
receptor alpha (PPARγ, 1:500; Santa Cruz Biotechnology, Inc., Dallas, TX, USA), nuclear
factor-kB (NF-kB, 1:500; Cell Signaling Technology Inc., Danvers, MA, USA), tumor necrosis
factor α (TNF-α, 1:500; Santa Cruz Biotechnology, Inc., Dallas, TX, USA), interleukin 6 (IL-6,
1:3000; Abcam, Cambridge, UK), nuclear factor erythroid 2-related factor 2 (Nrf-2, 1:500;
Abcam, Cambridge, UK), B cell lymphoma 2 (Bcl-2, 1:500; Cell Signaling Technology Inc.,
Danvers, MA, USA), matrix metalloproteinase-2 (MMP-2, 1:2500; Abcam, Cambridge, UK)
and matrix metalloproteinase-9 (MMP-9, 1:5000; Abcam, Cambridge, UK). Thereafter, the
membranes were incubated with horseradish peroxidase (HRP) and conjugated secondary
antibodies (1:3000, Santa Cruz Inc., Dallas, TX, USA). In order to visualize protein bands,
the chemiluminescence substrate (Clarity Western ECL Substrate; Bio-Rad, Hercules, CA,
USA) was used, and then the obtained signals were quantified densitometrically with
the use of the ChemiDoc visualization system (Image Laboratory Software Version 6.0.1;
Bio-Rad, Warsaw, Poland). The expression of selected proteins was quantified with stain-
free gels and the total protein normalization method (Bio-Rad, Hercules, CA, USA) (see
Supplementary File S1). All the data are demonstrated as the percentage of the control
group based on six independent determinations.
2.5. Statistical Analysis
The experimental data are expressed as mean values ± SD or percentage of the control
group based on six independent determinations. The obtained results were subjected
to the Shapiro–Wilk test and the Bartlett’s test to assess the distribution of values and
homogeneity of the variance. Statistical differences between groups were assessed by
one-way test ANOVA followed by the appropriate post-hoc test with the use of GraphPadNutrients 2021, 13, 1603 6 of 25
Prism version 7.0 for Windows (GraphPad Software, La Jolla, CA, USA). The results were
considered to be statistically significant at p < 0.05.
3. Results
3.1. Effect of Two-Week CBD Treatment on the n-6 and n-3 PUFA Ratio in the White and Red
Skeletal Muscles As Well As Plasma of Rats Subjected to Standard and High-Fat Diets
Induction of obesity by feeding rats a HFD resulted in a significant reduction in
the pool of the n-6 PUFAs, i.e., of linoleic acid (LA) (−16.9%, p < 0.05), arachidonic acid
(AA) (−10.1%, p < 0.05), and also of n-3 PUFAs, i.e., of α-linolenic acid (ALA) (−16.0%,
p < 0.05) and eicosapentaenoic acid (EPA) (−17.5%, p < 0.05) in the FFA fraction (Table 1),
in the white gastrocnemius muscle compared with the controls. We only observed an
increase in the content of docosahexaenoic acid (DHA) (+32.9%, p < 0.05; Table 1) under
the same conditions. Concomitantly, the rats fed both the standard and the HFD after the
introduction of CBD exhibited a substantially elevated content of LA (+42.6% and +62.5%,
p < 0.05, vs. control group, respectively; +95.6%, p < 0.05, vs. the HFD group; Table 1), AA
(+52.8% and +173.7%, p < 0.05, vs. the control group, respectively; +204.5%, p < 0.05, vs.
the HFD group; Table 1), ALA (+29.9%, p < 0.05, vs. the control group; +30.7%, p < 0.05,
vs. the HFD group; Table 1) and DHA (+52.8% and +161.1%, p < 0.05, vs. the control
group, respectively; +96.5%, p < 0.05, vs. the HFD group; Table 1) in the white skeletal
muscle. However, compared to the control conditions, rats from the HFD group exhibited a
considerably decreased EPA content after two-week CBD administration (−29.0%, p < 0.05;
Table 1) in the same muscle type. In contrast, in the red gastrocnemius muscle, we noticed
a significant increment in the fatty acid content of the FFA fraction, i.e., of LA (+76.0%),
AA (+41.7%), ALA (+27.7%) and DHA (+75.1%) (p < 0.05; Table 2), in the rats subjected
to a high-fat diet in comparison with the control rats, with the exception of EPA (p > 0.05;
Table 2). Interestingly, the total intramuscular content of FFA fraction fatty acids in the
rats fed either the standard or the high-fat diet was considerably greater in the chronic
presence of CBD: LA (+39.2% and +63.5%, p < 0.05, vs. the control group, respectively;
Table 1), AA (+41.7% and +99.3%, p < 0.05, vs. the control group, respectively; +40.6%,
p < 0.05, vs. the HFD group; Table 2), ALA (33.7% and 22.0%, p < 0.05, vs. the control group,
respectively; Table 2), EPA (+33.6% and +20.1%, p < 0.05, vs. the control group, respectively;
+22.0%, p < 0.05, vs. the HFD group; Table 2) and DHA (+31.3% and +102.8%, p < 0.05,
vs. the control group, respectively; +15.8%, p < 0.05, vs. the HFD group; Table 2) in the
oxidative muscle.
Table 1. Polyunsaturated fatty acids (PUFA) content in the FFA fraction (nmol/g of wet tissue) in
the white gastrocnemius muscle in the control (standard diet) and high-fat diet (HFD) groups after
two-week cannabidiol (CBD) treatment.
Fatty Acid Control CBD HFD HFD + CBD
(18:2n6c) 57.59 ± 8.04 82.1 ± 14.10 a 49.51 ± 10.53 a 93.61 ± 7.54 a,b
(20:4n6) 17.47 ± 1.77 26.69 ± 6.90 a 15.70 ± 1.50 a 47.80 ± 5.31 a,b
(18:3n3) 6.63 ± 0.83 9.19 ± 2.02 a 5.57 ± 0.89 a 7.28 ± 0.84 b
(20:5n3) 2.15 ± 0.36 1.89 ± 0.40 1.85 ± 0.43 a 1.53 ± 0.28 a
(22:6n3) 4.81 ± 0.93 7.36 ± 1.73 a 6.40 ± 1.01 a 12.57 ± 1.29 a,b
n-6 PUFAs 75.06 ± 9.31 106.76 ± 15.28 a 65.21 ± 10.78 a 142.87 ± 13.07 a,b
n-3 PUFAs 13.67 ± 1.68 18.43 ± 3.83 a 13.57 ± 1.63 21.32 ± 1.81 a,b
The data are expressed as mean values ± SD, n = 10 in each group. a p < 0.05 indicates a significant difference:
the control group vs. the examined group in the white gastrocnemius muscle; b p < 0.05 indicates a significant
difference: HFD vs. HFD + CBD in the white gastrocnemius muscle; 18:2n6c (linoleic acid, LA); 20:4n6 (arachi-
donic acid, AA); 18:3n3 (α-linolenic acid, ALA); 20:5n3 (eicosapentaenoic acid, EPA); 22:6n3 (docosahexaenoic
acid, DHA).Nutrients 2021, 13, 1603 7 of 25
Table 2. Polyunsaturated fatty acids (PUFA) content in the FFA fraction (nmol/g of wet tissue) in
the red gastrocnemius muscle in the control (standard diet) and high-fat diet (HFD) groups after
two-week cannabidiol (CBD) treatment.
Fatty Acid Control CBD HFD HFD + CBD
(18:2n6c) 356.30 ± 78.40 495.83 ± 44.51 * 626.91 ± 53.59 * 582.61 ± 59.54 *
(20:4n6) 77.08 ± 9.82 109.19 ± 5.69 * 109.23 ± 5.12 * 153.63 ± 7.87 *,#
(18:3n3) 26.26 ± 5.10 35.10 ± 3.11 * 33.54 ± 4.00 * 31.08 ± 3.65 *
(20:5n3) 3.56 ± 0.82 4.71 ± 0.52 * 3.59 ± 0.62 4.12 ± 0.66 *,#
(22:6n3) 35.16 ± 8.30 46.17 ± 7.06 * 61.57 ± 8.15 * 71.30 ± 8.90 *,#
n-6 PUFAs 433.38 ± 87.32 606.71 ± 48.96 * 736.14 ± 57.79 * 739.06 ± 64.82 *
n-3 PUFAs 64.85 ± 13.92 85.98 ± 8.19 * 99.32 ± 11.71 * 109.76 ± 6.85 *
The data are expressed as mean values ± SD, n = 10 in each group. * p < 0.05 indicates a significant difference: the
control group vs. the examined group in the red gastrocnemius muscle; # p < 0.05 indicates a significant difference:
HFD vs. HFD + CBD in the red gastrocnemius muscle; 18:2n6c (linoleic acid, LA); 20:4n6 (arachidonic acid, AA);
18:3n3 (α-linolenic acid, ALA); 20:5n3 (eicosapentaenoic acid, EPA); 22:6n3 (docosahexaenoic acid, DHA).
Concomitantly, in the DAG fraction, we observed that high-fat diet feeding caused
a significant decrease of n-6 PUFAs (LA (−22.2%) and AA (−19.9%)) and n-3 PUFAs
(ALA (−22.0%)), whereas the DHA content was markedly elevated (+42.0%) in the white
gastrocnemius muscle in comparison with the control group (p < 0.05; Table 3). Interestingly,
CBD treatment in the rats fed a standard chow resulted in a substantially reduced content
of LA (−14.6%, p < 0.05, vs. the control group; Table 2) and increased AA (+32.5%, p < 0.05,
vs. the control group; Table 3) in the white skeletal muscle. However, in the same muscle
type, the HFD group after CBD administration was characterized by a significant increment
in the pool of LA (+26.8%, p < 0.05, vs. the HFD group; Table 3), AA (+130.4%, p < 0.05,
vs. the control group; +187.5%, p < 0.05, vs. the HFD group; Table 3) and DHA (+107.9%,
p < 0.05, vs. the control group; +46.4%, p < 0.05, vs. the HFD group; Table 3), whereas the
content of ALA and EPA was considerably reduced (−24.5% and −23.0%, respectively)
in comparison with the controls (p < 0.05; Table 3). Conversely, in the red gastrocnemius
muscle, changes in the total fatty acid content of the DAG fraction in the rats subjected to a
high-fat diet were accompanied by a significant increase in the content of n-6 PUFAs (LA
(+82.9%) and AA (+18.5%)) as well as all of n-3 PUFAs (ALA (+31.3%), EPA (+23.1%) and
DHA (+93.6%)) in comparison with the rats fed a standard diet (p < 0.05; Table 4). CBD
treatment in the rats fed the standard chow markedly enhanced the AA and EPA content
(+29.9% and +39.7%, p < 0.05, vs. the control group, respectively; Table 4) with no change
in LA, ALA and DHA levels (p > 0.05; Table 4) in the oxidative muscle. Similarly, we
observed that the HFD-fed group after CBD administration showed a significantly greater
accumulation of LA (+70%, p < 0.05, vs. the control group; Table 4), AA (+78.8%, p < 0.05,
vs. the control group; +50.9%, p < 0.05, vs. the HFD group; Table 4), ALA (+44.8%, p < 0.05,
vs. the control group; +10.2%, p < 0.05, vs. the HFD group; Table 4), EPA (+80.4%, p < 0.05,
vs. the control group; +46.5%, p < 0.05, vs. the HFD group; Table 4) and DHA (+131.3%,
p < 0.05, vs. the control group; +19.4%, p < 0.05, vs. the HFD group; Table 4) in the pool of
the DAG fraction in the red gastrocnemius muscle.
As shown in Table 5, the rats from the HFD group had an increased content of LA
(+337.1%), AA (+64.8%), ALA (+138.1%) and DHA (+88.1%) compared to the control group
in the white skeletal muscle’s TAG fraction (p < 0.05; Table 5) with no alterations in the EPA
levels (p > 0.05; Table 5). Moreover, we noticed that two-week CBD treatment in the rats
fed the standard chow considerably elevated only DHA levels (+50.0%, p < 0.05, vs. the
control group; Table 5) of the TAG fraction in the white skeletal muscle. Concomitantly, in
the same muscle type, we observed that CBD administration to rats after the HFD course
substantially enhanced the levels of n-6 PUFAs, i.e., of LA and AA (+187.0% and +72.5%,
p < 0.05, vs. the control group, respectively; Table 5) in the TAG fraction, whereas the LA
content in the same experimental group compared to the corresponding untreated HFDNutrients 2021, 13, 1603 8 of 25
group was decreased (−34.4%, p < 0.05; Table 5). Furthermore, we noticed a similar effect
of two-week CBD treatment in the case of n-3 PUFAs such as ALA (+95.4%, p < 0.05, vs.
the control group; Table 5) and DHA (+171.9%, p < 0.05, vs. the control group; +43.9%,
p < 0.05, vs. the HFD group; Table 5), although only the EPA content was significantly
reduced (−37.5%, p < 0.05, vs. the control group; Table 5) in the white gastrocnemius
muscle. With respect to the red skeletal muscle, high-fat feeding considerably intensified
the accumulation of LA and DHA (+116.9% and +161.6%, respectively; p < 0.05; Table 6) in
the TAG fraction in comparison with the rats fed the standard diet. Interestingly, compared
to the control conditions, we did not observe any significant alterations in the PUFA
composition of the TAG fraction in the CBD group in the same muscle type (p > 0.05;
Table 6). However, the HFD group after CBD administration exhibited a substantially
reduced level of LA (−37.7%, p < 0.05, vs. the HFD group; Table 6) along with a substantial
rise in n-3 PUFAs EPA (+56.2%, p < 0.05, vs. the HFD group; Table 6) and DHA (+249.9%,
p < 0.05, vs. the control group; +33.7%, p < 0.05, vs. the HFD group; Table 6).
Table 3. Polyunsaturated fatty acids (PUFA) content in the DAG fraction (nmol/g of wet tissue) in
the white gastrocnemius muscle in the control (standard diet) and high-fat diet (HFD) groups after
two-week cannabidiol (CBD) treatment.
Fatty Acid Control CBD HFD HFD + CBD
a a
(18:2n6c) 41.10 ± 6.95 35.10 ± 3.93 31.99 ± 7.50 40.55 ± 7.49 b
(20:4n6) 20.73 ± 2.65 27.46 ± 4.72 a 16.61 ± 1.94 a 47.76 ± 6.92 a,b
(18:3n3) 4.06 ± 0.62 3.73 ± 0.48 3.36 ± 0.86 a 3.07 ± 0.31 a
(20:5n3) 1.37 ± 0.38 1.06 ± 0.30 1.29 ± 0.31 1.05 ± 0.19 a
(22:6n3) 3.68 ± 0.53 3.77 ± 0.71 5.23 ± 0.97 a 7.66 ± 0.92 a,b
n-6 PUFAs 61.83 ± 9.13 62.56 ± 7.47 48.59 ± 7.61 a 90.40 ± 13.61 a,b
n-3 PUFAs 9.12 ± 1.23 8.56 ± 1.07 10.05 ± 2.22 12.07 ± 1.58 a,b
The data are expressed as mean values ± SD, n = 10 in each group. a p < 0.05 indicates a significant difference:
the control group vs. the examined group in the white gastrocnemius muscle; b p < 0.05 indicates a significant
difference: HFD vs. HFD + CBD in the white gastrocnemius muscle; 18:2n6c (linoleic acid, LA); 20:4n6 (arachi-
donic acid, AA); 18:3n3 (α-linolenic acid, ALA); 20:5n3 (eicosapentaenoic acid, EPA); 22:6n3 (docosahexaenoic
acid, DHA).
Table 4. Polyunsaturated fatty acids (PUFA) content in the DAG fraction (nmol/g of wet tissue) in
the red gastrocnemius muscle in the control (standard diet) and high-fat diet (HFD) groups after
two-week cannabidiol (CBD) treatment.
Fatty Acid Control CBD HFD HFD+CBD
(18:2n6c) 79.55 ± 22.95 74.12 ± 5.14 145.53 ± 26.29 * 135.21 ± 18.06 *
(20:4n6) 34.20 ± 5.68 44.42 ± 4.89 * 40.54 ± 2.42 * 61.16 ± 5.46 *,#
(18:3n3) 5.83 ± 1.61 5.82 ± 0.43 7.66 ± 0.51 * 8.45 ± 1.03 *,#
(20:5n3) 0.97 ± 0.18 1.36 ± 0.27 * 1.20 ± 0.61 1.75 ± 0.50 *,#
(22:6n3) 9.09 ± 2.84 9.91 ± 2.02 17.60 ± 2.67 * 21.02 ± 2.85 *,#
n-6 PUFAs 118.71 ± 32.16 118.54 ± 9.37 186.07 ± 26.82 * 202.15 ± 20.80 *
n-3 PUFAs 15.91 ± 4.80 16.81 ± 2.33 26.59 ± 2.56 * 31.22 ± 3.82 *,#
The data are expressed as mean values ± SD, n = 10 in each group. * p < 0.05 indicates a significant difference: the
control group vs. the examined group in the red gastrocnemius muscle; # p < 0.05 indicates a significant difference:
HFD vs. HFD + CBD in the red gastrocnemius muscle; 18:2n6c (linoleic acid, LA); 20:4n6 (arachidonic acid, AA);
18:3n3 (α-linolenic acid, ALA); 20:5n3 (eicosapentaenoic acid, EPA); 22:6n3 (docosahexaenoic acid, DHA).Nutrients 2021, 13, 1603 9 of 25
Table 5. Polyunsaturated fatty acids (PUFA) content in the TAG fraction (nmol/g of wet tissue)
in white gastrocnemius muscle in the control (standard diet) and high-fat diet (HFD) groups after
two-week cannabidiol (CBD) treatment.
Fatty Acid Control CBD HFD HFD + CBD
(18:2n6c) 306.57 ± 97.30 295.80 ± 47.57 1340.05 ± 383.66 a 879.74 ± 181.45 a,b
(20:4n6) 17.51 ± 3.63 16.74 ± 2.51 28.85 ± 6.46 a 30.21 ± 5.40 a
(18:3n3) 31.39 ± 8.98 30.24 ± 5.17 74.72 ± 21.80 a 61.33 ± 10.99 a
(20:5n3) 4.63 ± 1.58 3.73 ± 1.12 3.95 ± 1.20 2.89 ± 1.48 a
(22:6n3) 6.12 ± 2.12 9.18 ± 3.66 a 11.56 ± 3.72 a 16.64 ± 3.28 a,b
n-6 PUFAs 324.08 ± 99.30 313.26 ± 49.97 1290.09 ± 434.82 a 909.95 ± 183.75 a,b
n-3 PUFAs 42.86 ± 11.48 42.64 ± 8.12 90.98 ± 28.53 a 80.19 ± 11.43 a
a
The data are expressed as mean values ± SD, n = 10 in each group. p < 0.05 indicates a significant difference:
the control group vs. the examined group in the white gastrocnemius muscle; b p < 0.05 indicates a significant
difference: HFD vs. HFD + CBD in the white gastrocnemius muscle; 18:2n6c (linoleic acid, LA); 20:4n6 (arachi-
donic acid, AA); 18:3n3 (α-linolenic acid, ALA); 20:5n3 (eicosapentaenoic acid, EPA); 22:6n3 (docosahexaenoic
acid, DHA).
Table 6. Polyunsaturated fatty acids (PUFA) content in the TAG fraction (nmol/g of wet tissue) in
the red gastrocnemius muscle in the control (standard diet) and high-fat diet (HFD) groups after
two-week cannabidiol (CBD) treatment.
Fatty Acid Control CBD HFD HFD + CBD
(18:2n6c) 775.65 ± 666.51 689.35 ± 226.72 1682.96 ± 820.25 * 1113.21 ± 353.52 #
(20:4n6) 38.74 ± 26.02 36.78 ± 9.81 39.97 ± 17.23 39.70 ± 7.85
(18:3n3) 69.66 ± 55.34 66.62 ± 22.17 88.41 ± 37.28 79.79 ± 19.00
(20:5n3) 4.35 ± 1.60 4.15 ± 1.42 3.34 ± 1.02 4.91 ± 1.68 #
(22:6n3) 12.72 ± 5.21 13.39 ± 3.49 33.26 ± 6.73 * 44.49 ± 4.76 *,#
n-6 PUFAs 965.12 ± 806.91 726.13 ± 236.31 1724.88 ± 837.21 * 1086.75 ± 311.93 #
n-3 PUFAs 75.11 ± 49.38 83.67 ± 21.26 136.52 ± 53.96 129.19 ± 19.33
The data are expressed as mean values ± SD, n = 10 in each group. * p < 0.05 indicates a significant difference: the
control group vs. the examined group in the red gastrocnemius muscle; # p < 0.05 indicates a significant difference:
HFD vs. HFD + CBD in the red gastrocnemius muscle; 18:2n6c (linoleic acid, LA); 20:4n6 (arachidonic acid, AA);
18:3n3 (α-linolenic acid, ALA); 20:5n3 (eicosapentaenoic acid, EPA); 22:6n3 (docosahexaenoic acid, DHA).
Our study demonstrated that the total fatty acid composition of PL was altered by
the high-fat diet in both white and red gastrocnemius muscles. Regarding the glycolytic
muscle, we noticed a pronounced decrease in the content of LA, ALA and EPA in the
rats subjected to the HFD (−39.5%, −43.9% and −46.8%, respectively; p < 0.05; Table 7)
compared to the control rats, whereas only the DHA content was increased (+12.7%,
p < 0.05; Table 7) in the same conditions. CBD given to the rats fed a standard chow
did not affect in a statistically significant manner the PUFA content in the white skeletal
muscle in the PL fraction. However, when CBD was administered to rats after the HFD
course, it considerably reduced the content of LA, ALA and EPA (−27.2%, −37.0% and
−37.3%, respectively; p < 0.05; Table 7) and simultaneously increased the AA and DHA
levels (+21.6% and +69.2%, respectively; p < 0.05; Table 7) in comparison with the control
conditions. In the same experimental rats, compared to the HFD group alone, we observed
a substantially increased accumulation of all PUFAs: LA, AA, ALA, EPA and DHA in the
PL fraction (+20.3%, +19.9%, +12.3%, +17.7% and +50.1%, respectively; p < 0.05; Table 7).
Concomitantly, in the PL fraction of the red gastrocnemius muscle, the HFD-fed rats
were characterized by considerably elevated AA and DHA content (+21.5% and +25.6%,
respectively; p < 0.05; Table 8) with a parallel decline in the levels of ALA and EPA (−42.4%
and −30.1%, respectively; p < 0.05; Table 8) along with no changes in the LA contentNutrients 2021, 13, 1603 10 of 25
(p > 0.05; Table 8) compared to the controls. CBD administration while feeding rats with the
standard chow resulted in a pronounced increase in n-6 PUFAs, that is, LA (+21.0%) and
AA (+19.4%) as well as in n-3 PUFAs, that is, ALA (+11.1%) and DHA (+53.3%) (p < 0.05;
Table 8) in comparison with the control group. Additionally, we observed a significant
increase in the PUFA content of the PL fraction after prolonged CBD administration in the
high-fat diet rats: LA (+27.2%, p < 0.05, vs. the control group; +23.1%, p < 0.05, vs. the HFD
group), AA (+53.4%, p < 0.05, vs. the control group; +26.3%, p < 0.05, vs. the HFD group)
and DHA (+78.7%, p < 0.05, vs. the control group; +42.2%, p < 0.05, vs. the HFD group) in
the red skeletal muscle (Table 8). These CBD effects were accompanied by a reduction in
the ALA and EPA content (−32.7% and −25.9%, respectively; p < 0.05; Table 8) compared
to the control rats in the red skeletal muscle.
Table 7. Polyunsaturated fatty acids (PUFA) content in the PL fraction (nmol/g of wet tissue) in
the white gastrocnemius muscle in the control (standard diet) and high-fat diet (HFD) groups after
two-week cannabidiol (CBD) treatment.
Fatty Acid Control CBD HFD HFD + CBD
(18:2n6c) 3804.57 ± 232.32 3562.35 ± 603.79 2302.71 ± 204.26a 2770.34 ± 572.05 a,b
(20:4n6) 4249.78 ± 200.32 4074.72 ± 448.51 4168.76 ± 294.02 5146.26 ± 568.67 a,b
a
(18:3n3) 45.76 ± 6.35 47.49 ± 3.80 25.67 ± 2.46 28.83 ± 2.45 a,b
a
(20:5n3) 49.26 ± 5.52 46.56 ± 5.41 26.23 ± 3.09 30.88 ± 5.25 a,b
(22:6n3) 1563.04 ± 119.25 1698.80 ± 44.15 1761.42 ± 265.15 a 2644.32 ± 420.35 a,b
n-6 PUFAs 8054.35 ± 342.47 7925.37 ± 456.35 6471.47 ± 344.45 a 7622.72 ± 647.02 b
n-3 PUFAs 1658.06 ± 122.19 1877.10 ± 694.05 1813.33 ± 266.27 2801.95 ± 712.31 a,b
a
The data are expressed as mean values ± SD, n = 10 in each group. p < 0.05 indicates a significant difference:
the control group vs. the examined group in the white gastrocnemius muscle; b p < 0.05 indicates a significant
difference: HFD vs. HFD + CBD in the white gastrocnemius muscle; 18:2n6c (linoleic acid, LA); 20:4n6 (arachi-
donic acid, AA); 18:3n3 (α-linolenic acid, ALA); 20:5n3 (eicosapentaenoic acid, EPA); 22:6n3 (docosahexaenoic
acid, DHA).
Table 8. Polyunsaturated fatty acids (PUFA) content in the PL fraction (nmol/g of wet tissue) in
the red gastrocnemius muscle in the control (standard diet) and high-fat diet (HFD) groups after
two-week cannabidiol (CBD) treatment.
Fatty Acid Control CBD HFD HFD + CBD
(18:2n6c) 6016.99 ± 705.69 7281.82 ±495.03 * 6140.77 ± 331.08 7653.15 ± 440.06 *,#
(20:4n6) 3922.92 ± 371.42 4684.31 ±184.04 * 4765.12 ± 384.66 * 6019.30 ± 184.80 *,#
(18:3n3) 71.94 ± 7.37 79.89 ± 2.95 * 41.45 ± 4.01 * 48.43 ± 6.68 *,#
(20:5n3) 58.99 ± 5.93 54.48 ± 4.28 41.21 ± 3.97 * 43.74 ± 2.36 *
(22:6n3) 2283.89 ± 382.17 3793.13 ± 419.76 * 3052.58 ± 291.44 * 4341.88 ± 260.71 *,#
n-6 PUFAs 9939.90 ± 907.86 11,884.97 ± 503.74 * 11,008.32 ± 512.03 * 13,672.45 ± 592.99 *,#
n-3 PUFAs 2419.60 ± 397.65 3857.01 ± 450.31 * 3140.37 ± 286.37 * 4471.28 ± 250.34 *,#
The data are expressed as mean values ± SD, n = 10 in each group. * p < 0.05 indicates a significant difference: the
control group vs. the examined group in the red gastrocnemius muscle; # p < 0.05 indicates a significant difference:
HFD vs. HFD + CBD in the red gastrocnemius muscle; 18:2n6c (linoleic acid, LA); 20:4n6 (arachidonic acid, AA);
18:3n3 (α-linolenic acid, ALA); 20:5n3 (eicosapentaenoic acid, EPA); 22:6n3 (docosahexaenoic acid, DHA).
In the plasma FFA fraction of the rats fed an HFD, we noticed significantly increased
levels of n-6 PUFAs, i.e., of LA (+68.5%) and AA (+107.3%) and of n-3 PUFA DHA (+31.8%)
(p < 0.05; Table 9). Interestingly, CBD administration to the animals fed a standard diet
caused a pronounced elevation of all the PUFAs: LA, AA, ALA, EPA and DHA (+52.3%,
+88.2%, +43.6%, +35.0% and +108.1%, respectively; p < 0.05; Table 9) in comparison with the
corresponding control rats. Similarly, the high fat diet-fed rats after CBD administration
presented a significantly elevated level of LA (+167.9%, p < 0.05, vs. the control group;
+59.0%, p < 0.05, vs. the HFD group), AA (+90.5%, p < 0.05, vs. the control group), ALANutrients 2021, 13, 1603 11 of 25
(+95.5%, p < 0.05, vs. the control group; +67.2%, p < 0.05, vs. the HFD group) and DHA
(81.2%, p < 0.05, vs. the control group; +37.5%, p < 0.05, vs. the HFD group). The only
fatty acid of plasma FFA PUFAs with the content reduced in the rats fed an HFD after
two-week CBD treatment was EPA (−23.6%, p < 0.05, vs. the control group; Table 9).
However, in comparison with the corresponding untreated HFD group, the EPA content
was substantially enhanced (+33.5%, p < 0.05; Table 9). On the other hand, in the plasma
TAG fraction, the high-fat diet resulted in a considerable decrease in fatty acids belonging
to n-3 PUFAs: ALA (−46.6%), EPA (−65.8%) and DHA (−56.1%) (p < 0.05, vs. the control
group; Table 10). Moreover, we observed a marked elevation of the DHA content in the
plasma TAG fraction of animals fed a standard diet after prolonged CBD administration
(+22.9%, p < 0.05; Table 10) compared to the controls. Consistently, CBD given to the rats
after the HFD course significantly reduced the EPA and DHA content (−61.5% and −47.4%,
p < 0.05, vs. the control group; Table 10). However, in comparison with the HFD group
alone, we reported in the same experimental group a substantially declined content of AA
in the chronic presence of CBD (−18.4%, p < 0.05; Table 10) and, conversely, a significantly
greater content of ALA (+60.0%, p < 0.05; Table 10).
Table 9. Polyunsaturated fatty acids (PUFA) content in the plasma FFA fraction (nmol/mL of plasma) in
the control (standard diet) and high-fat diet (HFD) groups after two-week cannabidiol (CBD) treatment.
Fatty Acid Control CBD HFD HFD + CBD
a a
18:2n6c 55.06 ± 12.31 83.88 ± 23.49 92.76 ± 25.91 147.53 ± 40.28 a,b
20:4n6 8.16 ± 1.68 15.36 ± 2.17 a 16.37 ± 4.24 a 17.34 ± 4.88 a
18:3n3 6.39 ± 1.75 9.18 ± 2.54 a 7.48 ± 1.73 12.50 ± 3.72 a,b
20:5n3 0.40 ± 0.08 0.49 ± 0.13 a 0.23 ± 0.05 a 0.29 ± 0.08 a,b
22:6n3 2.14 ± 0.58 4.30 ± 1.16 a 2.82 ± 0.67 a 3.53 ± 1.28 a,b
n-6 PUFAs 63.22 ± 13.49 100.93 ± 26.71 a 109.13 ± 28.51 a 157.30 ± 40.34 a,b
n-3 PUFAs 8.93 ± 2.35 14.49 ± 3.78 a 10.14 ± 2.58 16.32 ± 4.81 a,b
a
The data are expressed as mean values ± SD, n = 10 in each group. p < 0.05 indicates a significant difference: the
control group vs. the examined group; b p < 0.05 indicates a significant difference: HFD vs. HFD + CBD; 18:2n6c
(linoleic acid, LA); 20:4n6 (arachidonic acid, AA); 18:3n3 (α-linolenic acid, ALA); 20:5n3 (eicosapentaenoic acid,
EPA); 22:6n3 (docosahexaenoic acid, DHA).
Table 10. Polyunsaturated fatty acids (PUFA) content in the plasma TAG fraction (nmol/mL of
plasma) in the control (standard diet) and high-fat diet (HFD) groups after two-week cannabidiol
(CBD) treatment.
Fatty Acid Control CBD HFD HFD + CBD
18:2n6c 1746.27 ± 258.44 1633.25 ± 445.53 1660.73 ± 964.61 1764.09 ± 408.46
20:4n6 126.75 ± 19.27 136.13 ± 19.36 132.11 ± 24.99 107.80 ± 18.37 b
18:3n3 183.83 ± 40.07 176.14 ± 66.09 133.72 ± 95.65 a 151.86 ± 53.02 b
20:5n3 32.35 ± 6.81 32.34 ± 7.05 11.10 ± 2.69 a 12.49 ± 3.11 a
22:6n3 105.50 ± 21.13 129.68 ± 18.44 a 46.35 ± 8.78 a 55.49 ± 16.04 a
n-6 PUFAs 1880.31 ± 264.08 1689.88 ± 377.78 2130.27 ± 992.20 1882.45 ± 426.13
a
n-3 PUFAs 327.95 ± 56.27 340.65 ± 71.39 151.91 ± 40.00 221.56 ± 70.30 a,b
The data are expressed as mean values ± SD, n = 10 in each group. a p < 0.05 indicates a significant difference: the
control group vs. the examined group; b p < 0.05 indicates a significant difference: HFD vs. HFD + CBD; 18:2n6c
(linoleic acid, LA); 20:4n6 (arachidonic acid, AA); 18:3n3 (α-linolenic acid, ALA); 20:5n3 (eicosapentaenoic acid,
EPA); 22:6n3 (docosahexaenoic acid, DHA).Nutrients 2021, 13, 1603 12 of 25
Our study demonstrated that the high-fat diet substantially reduced the n-6/n-3
PUFA ratio in the FFA and DAG fractions (−14.2% and −27.6%, p < 0.05; Figure 1A,B,
respectively) in the white gastrocnemius muscle compared to the controls, whereas CBD
administration considerably enhanced it (+41.7% and +49%.0%, p < 0.05; Figure 1A,B,
respectively) in comparison with the HFD group alone. Regarding the FFA fraction, we
also found that two-week CBD treatment significantly increased the n-6/n-3 PUFA ratio
in the rats fed either the standard chow or the high-fat diet in the white gastrocnemius
muscle (+11.6% and +21.6%, p < 0.05; Figure 1A) in comparison with the control group.
On the other hand, in the red gastrocnemius muscle, we observed elevated n-6/n-3 PUFA
ratio in the rats fed HFD in the FFA fraction (+12.9%, p < 0.05, vs. the control group;
Figure 1A), whereas chronic CBD treatment resulted in a significant decrease in the same
experimental group (−9.3%, p < 0.05, vs. the HFD group; Figure 1A). Interestingly, in the
red gastrocnemius muscle, we observed a substantial reduction in the n-6/n-3 PUFA ratio
in the rats subjected to standard chow or high-fat diet feeding after CBD administration
in the DAG (−6.6% and −13.7%, p < 0.05, vs. the control group, respectively; −11.6%,
p < 0.05, vs. the HFD group; Figure 1B) and PL fractions (−21.0% and −21.2%, p < 0.05,
vs. the control group, respectively; −13.1%, p < 0.05, vs. the HFD group; Figure 1D). With
respect to the TAG fraction (Figure 1C) in the white and red gastrocnemius muscles, we
observed that the HFD-fed groups exhibited a significantly increased n-6/n-3 PUFA ratio
(+66.8% and +28.1%, respectively; p < 0.05; Figure 1C) in comparison with the control
group. Concomitantly, two-week CBD treatment caused a substantial reduction in the
n-6/n-3 PUFA ratio (−14.9% and −30.1%, respectively; p < 0.05; Figure 1C) compared
to the HFD group alone. Moreover, the n-6/n-3 PUFA ratio in the TAG fraction only in
the white gastrocnemius muscle was considerably reduced by CBD administration in the
rats fed a standard chow (−9.5%, p < 0.05; Figure 1C) and, conversely, in the rats fed the
HFD, it was significantly elevated (+42.0%, p < 0.05; Figure 1C) in comparison with the
control group. Simultaneously, in the PL fraction, we observed that the HFD-fed groups
exhibited a markedly decreased n-6/n-3 PUFA ratio in both the white (−23.8%, p < 0.05;
Figure 1D) and the red (−9.3%, p < 0.05; Figure 1D) gastrocnemius muscle compared to
the control conditions. Moreover, CBD administration to animals being on an HFD in the
white gastrocnemius muscle resulted in a pronounced reduction of the n-6/n-3 PUFA ratio
in the PL fraction (−13.9%, p < 0.05, vs. the HFD group; Figure 1D).
Figure 1. Cont.Nutrients 2021, 13, 1603 13 of 25
Figure 1. Intramuscular n-6/n-3 PUFA ratio in the (A) free fatty acid (FFA), (B) diacylglycerol (DAG),
(C) triacylglycerol (TAG) and (D) phospholipid (PL) fractions in the white and red gastrocnemius
muscles in the control (standard diet) and high-fat diet (HFD) groups after two-week cannabidiol
(CBD) treatment. The data are expressed as mean values ± SD, n = 10 in each group. a p < 0.05 indi-
cates a significant difference: the control group vs. the examined group in the white gastrocnemius
muscle; b p < 0.05 indicates a significant difference: HFD vs. HFD + CBD in the white gastrocnemius
muscle. * p < 0.05 indicates a significant difference: the control group vs. the examined group in the
red gastrocnemius muscle; # p < 0.05 indicates a significant difference: HFD vs. HFD + CBD in the
red gastrocnemius muscle.
Induction of obesity by high-fat diet feeding resulted in a significantly increased
n-6/n-3 PUFA ratio in both HFD-fed groups (untreated and treated with CBD) in the
plasma FFA (+47.3% and +37.3%, respectively; p < 0.05; Figure 2A) and TAG fractions
(+57.1% and +49.1%, respectively, p < 0.05; Figure 2B) compared to the control rats. Further-
more, in the plasma of the rats fed a standard diet and injected with CBD, we observed a
markedly decreased n-6/n-3 PUFA ratio in the FFA (−7.4%, p < 0.05; Figure 2A) and TAG
(−6.9%, p < 0.05; Figure 2B) fractions in comparison with the control group. Importantly,
the n-6/n-3 PUFA ratio was substantially decreased in the chronic presence of CBD during
the high-fat diet feeding course in the plasma FFA fraction (−6.8%, p < 0.05, vs. the HFD
group; Figure 2A).
3.2. Effect of Two-Week CBD Treatment on the Oxidative and Antioxidative Parameters in the
White and Red Skeletal Muscles of Rats Subjected to Standard and High-Fat Diets
In the experimental model of HFD-induced obesity, we noticed significantly decreased
CAT values after two-week CBD administration in the rats fed the high-fat diet (−12.8%,
p < 0.05, vs. the HFD group; Figure 3A) only in the red gastrocnemius muscle. Concomi-
tantly, we did not observe any changes in catalase concentrations in the white gastroc-
nemius muscle (p > 0.05; Figure 3A). Additionally, two-week CBD treatment of the rats
fed a standard or high-fat diet resulted in a pronounced increase in SOD2 concentrations
(+9.9% and +8.8%, respectively; p < 0.05; Figure 3B) in the white gastrocnemius muscle
in comparison with the controls. Similar effects of CBD administration we reported in
the red gastrocnemius muscle in the rats fed a standard chow (+7.4%, p < 0.05, vs. the
control group; Figure 3B). Importantly, in both white and red skeletal muscles, chronic
CBD administration caused a considerable increment in SOD2 levels in the rats subjected
to the high-fat diet (+7.1% and +3.9%, p < 0.05; Figure 3B) compared to the HFD group
alone. With respect to the total antioxidant capacity, we observed a substantial increase in
the HFD-fed group in the chronic presence of CBD (+9.1%, p < 0.05, vs. the control group;
Figure 3C) only in the white skeletal muscle. Moreover, in the same muscle, in the standard
chow-fed group, after CBD treatment, we observed a trend towards an increase in the TAC
(p = 0.0661; Figure 3C). Simultaneously, we did not notice any significant alterations inNutrients 2021, 13, 1603 14 of 25
TAC levels in the red gastrocnemius muscle (p > 0.05; Figure 3C). Furthermore, as expected,
the high-fat diet feeding induced a greater intramuscular AGE concentration in both white
and red skeletal muscles (+13.3% and +32.1%, respectively; p < 0.05, vs. the control group;
Figure 3D), which was subsequently decreased by chronic CBD administration (−38.8%
and −28.0%, respectively; p < 0.05, vs. the HFD group; Figure 3D). A similar effect of CBD
treatment was also observed in the rats fed a standard diet (−64.5%, p < 0.05; Figure 3D) in
the white gastrocnemius muscle compared to the control group. Consequently, the MDA
content was significantly increased in the animals fed an HFD in the red gastrocnemius
muscle (+45.6%, p < 0.05, vs. the control group; Figure 3E), which was further reduced
after CBD administration (−26.9% p < 0.05, vs. the HFD group; Figure 3E). Regarding
the white skeletal muscle, the MDA concentration was considerably decreased in the
presence of CBD during high-fat diet administration (−16.7%, p < 0.05, vs. the control
group; −22.9%, p < 0.05, vs. the HFD group; Figure 3E). Similarly, high-fat diet feeding
resulted in a substantial increase in the 4-HNE levels in both white and red gastrocnemius
muscles (+43.7% and +115.7%, respectively; p < 0.05; Figure 3F) in comparison with the
control conditions. In addition, we noticed a significantly decreased content of 4-HNE
after prolonged CBD treatment in the rats fed a standard chow (−39.8%, p < 0.05, vs. the
control group; Figure 3F) in the white gastrocnemius muscle, whereas, on the contrary,
we observed a pronounced increase in the 4-HNE concentration in the same experimental
group in the red skeletal muscle (+124.6%, p < 0.05; Figure 3F) compared to the control rats.
3.3. Effect of Two-Week CBD Treatment on the Total Intramuscular Expression of Proteins
Involved in the Inflammatory Pathway in the White and Red Skeletal Muscles of Rats Subjected to
Standard and High-Fat Diets
Compared to the control group, the rats fed a high-fat diet were characterized by a
substantial increase in the total expression of COX2 and 5-LO in the red gastrocnemius
muscle (+22.3% and +8.9%, respectively; p < 0.05; Figure 4B,C). Moreover, during HFD
administration, we observed a trend towards an increase in the COX1 expression (p = 0.0590,
vs. the control group; Figure 4A) in the white gastrocnemius muscle. Most importantly,
two-week CBD injections in the high-fat diet group resulted in a considerable reduction of
the total intramuscular expression of the proteins involved in the inflammatory pathway in
both white and red gastrocnemius muscles, i.e., of COX1 (−49.5% and −39.0%, respectively;
p < 0.05; Figure 4A) and COX2 (−39.5% and −28.4%, respectively; p < 0.05; Figure 4B)
compared to the HFD alone. Similar effects of CBD treatment in the HFD-fed rats we
reported in the case of the total intramuscular 5-LO expression in the white gastrocnemius
muscle (−19.1%, p < 0.05, vs. the control group; −26.9%, p < 0.05, vs. the HFD group;
Figure 4C). Simultaneously, we noticed a markedly declined total expression of COX1 and
5-LO in the rats fed a standard chow with the chronic presence of CBD in the red skeletal
muscle (−32.8% and −17.5%, p < 0.05, vs. the control group; Figure 4A,C). Concomitantly,
in the white skeletal muscle, we observed that CBD treatment of the rats subjected to
an HFD substantially increased the total expression of anti-inflammatory 15-LO (+43.2%,
p < 0.05; Figure 4D) in comparison with the HFD group alone. As presented in Figure 4,
intramuscular PPARγ expression decreased considerably during the course of a high-fat
diet in the white (−28.5%, p < 0.05; Figure 4E) and red (−28.8%, p < 0.05; Figure 4E) skeletal
muscles in comparison with the control rats. However, prolonged CBD administration in
the high-fat diet rats resulted in pronounced restoration of the total expression of PPARγ in
both muscle types (+44.2% and +25.0%, respectively; p < 0.05; Figure 4E) compared to the
HFD group. Furthermore, the group receiving a high-fat diet demonstrated a significant
elevation in the total muscular expression of NF-κB in the red gastrocnemius muscle
(+81.5%, p < 0.05, vs. the control group; Figure 4F). We also found that in the same muscle
type, chronic CBD treatment in the HFD-fed rats substantially reduced the expression of
NF-κB (−39.4%, p < 0.05; Figure 4F) and IL-6 (−17.2%, p < 0.05; Figure 5B) in comparison
with the HFD group. Similarly, in the white gastrocnemius muscle of the rats subjected
to the standard or high-fat chow administration, we observed a significant decrease in
the total expression of NF-κB after CBD injections (−27.8% and −35.8%, respectively,You can also read