Tidal Currents Detected in Kraken Mare Straits from Cassini VIMS - arXiv
←
→
Page content transcription
If your browser does not render page correctly, please read the page content below
DRAFT VERSION JULY 1, 2020

Typeset using LATEX preprint style in AASTeX62

        Tidal Currents Detected in Kraken Mare Straits from Cassini VIMS
                                          Sun Glitter Observations
        MICHAEL F. HESLAR,1 JASON W. BARNES,1 JASON M. SODERBLOM,2 BENOIT SEIGNOVERT,3 RAJANI D.
                                          DHINGRA,3 AND CHRISTOPHE SOTIN3
                                      1
                                       Department of Physics, University of Idaho
                                               Moscow, ID 83843-0903
           2
            Department of Earth, Atmospheric, and Planetary Sciences, Massachusetts Institute of Technology
                                                 Cambridge, MA 02139
                             3
                              Jet Propulsion Laboratory, California Institute of Technology
                                                 Pasadena, CA 91109

                   (Received March 31, 2020; Revised June 24, 2020; Accepted June 29, 2020)

                                     Submitted to Planetary Science Journal

                                                       Abstract
         We present Cassini VIMS observations of sun glitter – wave-induced reflections from a
       liquid surface offset from a specular point – on Kraken Mare. Sun glitter reveals rough sea
       surfaces around Kraken Mare, namely the coasts and narrow straits. The sun glitter
       observations indicate wave activity driven by the winds and tidal currents in Kraken Mare
       during northern summer. T104 Cassini VIMS observations show three sun glitter features in
       Bayta Fretum indicative of variegated wave fields. We cannot uniquely determine one source
       for the coastal Bayta waves, but we lean toward the interpretation of surface winds, because
       tidal currents should be too weak to generate capillary-gravity waves in Bayta Fretum. T105
       and T110 observations reveal wave fields in the straits of Seldon Fretum, Lulworth Sinus,
       and Tunu Sinus that likely originate from the constriction of tidal currents. Coastlines of
       Bermoothes and Hufaidh Insulae adjoin rough sea surfaces, suggesting a complex interplay
       of wind-roughened seas and localized tidal currents. Bermoothes and Hufaidh Insulae may
       share characteristics of either the Torres Strait off Australia or the Aland region of Finland,
       summarized as an island-dense strait with shallow bathymetry that hosts complex surface
       circulation patterns. Hufaidh Insulae could host seafloor bedforms formed by tidal currents
       with an abundant sediment supply, similar to the Torres Strait. The coastlines of Hufaidh and
       Bermoothes Insulae likely host ria or flooded coastal inlets, suggesting the Insulae may be
       local peaks of primordial crust isolated by an episode of sea-level rise or tectonic uplift.

       Keywords: sun glitter, Kraken Mare, tidal currents, exo-oceanography, coastal morphology

                                               1. INTRODUCTION
  The Cassini mission peered through Titan’s hazy veil, discovering isolated liquid bodies on its surface
(Stofan et al. 2007). The majority of surface liquids reside in the hydrocarbon seas (maria) of the north polar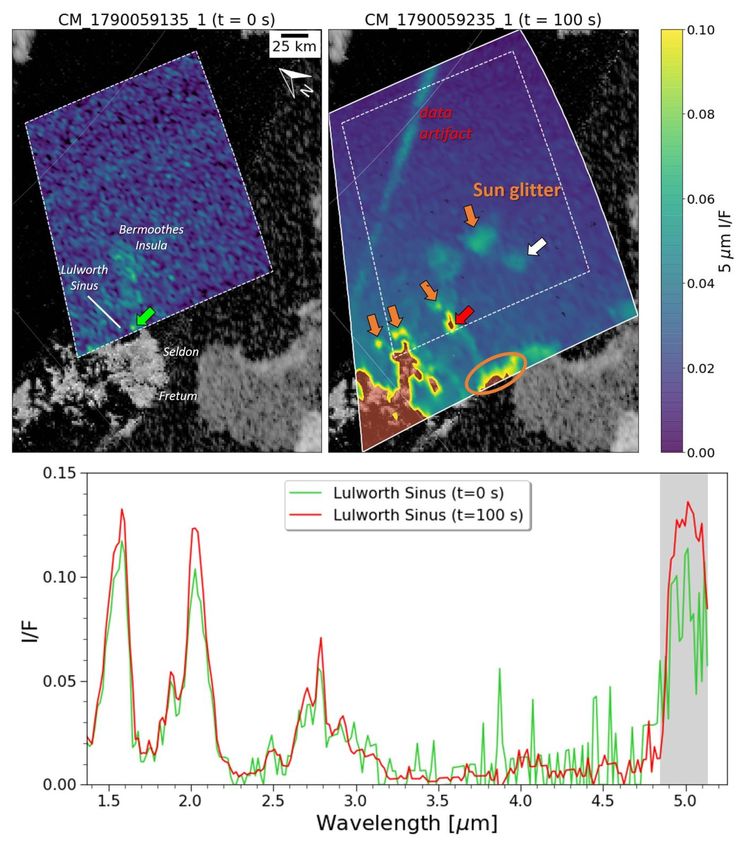
2                                                  HESLAR ET AL.
latitudes (Mitri et al. 2007, Stofan et al. 2007). The hydrological cycle of liquid methane is particularly
active in the presence of these vast hydrocarbon seas, including the seasonal evolution of wind and

Figure 1. This cartoon illustrates the observation geometry of a specular reflection (sunlight directly reflected off a
planetary surface) and sun glitter (waves tilting the liquid surface toward an observer, like Cassini VIMS) off a dark
Titan sea surface in the left and right diagrams respectively. The dashed lines indicate the local surface normals for
flat and rough liquid surfaces (red and orange respectively). The incidence and emission angles are i and e, which are
in the same plane and equal to each other for both cases. Sun glitter retains a specular geometry but instead tilts the
surface normal by θ, known as the specular deviation angle. Red and orange colors represent strongly-enhanced
radiance from a flat sea surface compared to weakly-enhanced radiance from a rough sea surface. I/F is the ratio of
observed to incident flux measured by the Cassini Visual and Infrared Mapping Spectrometer (VIMS).

precipitation patterns (Tokano et al. 2009). In addition, Titan’s orbital eccentricity imposes tidal effects on
the atmospheric winds (Tokano & Neubauer 2002) and sea circulation (Dermott & Sagan 1995). We can
observe the meteorological conditions and tidal effects as surface waves on the largest hydrocarbon seas.
  On Earth, oceanographers often observe surface waves over the seas and oceans from remote sensing
(Breon & Henriot 2006). Surface waves represent macroscopic sea surface roughness that cause a broad,
specular surface reflectance phase function known as sun glitter. Sun glitter imagery can reveal important
details about the local environmental conditions on the surface, such as wind speeds (Breon & Henriot2006)
and ocean currents (Kudryavtsev et al. 2017b). Oceanographers can also infer information about
oceanographic processes beneath the sea, such as the stratification of water masses (Jackson 2007). Similar
sun glitter observations could yield useful insights in the oceanographic processes on Titan, which may rival
the complexity in Earth’s oceans (Lorenz 2013).
  One major consequence from the summertime meteorological activity over the lakes and seas is the
potential development of waves. Titan wind-wave models suggested that winds would reach sufficient
speeds for capillary wave action during the late spring (Hayes et al. 2013, Lorenz & Hayes 2012).
  Liquid bodies act like mirrors when liquids have sea surface heights smaller than the observing wavelength
of the spectrometer (Barnes et al. 2011a). Satellites see blinding specular reflections of the Sun when in the
appropriate observational geometry. As Figure 1 illustrates, a satellite observes sun glitter as bright spots
with enhanced reflectivity in the vicinity of the specular point.
  Sun glitter often occurs in isolated regions, separate from the specular reflection, where the sea surface is
rougher (i.e. larger sea surface height anomalies) and some facets tilt toward the observer (Cassini). We
quantify the sea surface roughness by the specular deviation angle (θ in Figure 1), which describes the angle
at which the liquid surface needs to be tilted toward an observer to achieve a specular reflection.
WAVES IN TITAN’S KRAKEN MARE                                                    3
  For Titan, the Visual and Infrared Mapping Spectrometer (VIMS) (Brown et al. 2004) observes solar
specular reflections as bright or possibly saturated pixels in the atmospheric windows used for the color
image

Figure 2. The left image shows a modeled specular deviation angle (θ) map for the first-documented VIMS cube with
sun glitter, CM_1721848119 1, modified from Barnes et al. (2014). The right image shows the corresponding cube
with a wet-sidewalk color scheme (RGB: 5.0, 2.03, 2.79 µm) (Dhingra et al. 2019). The red and orange ellipses
represent the theoretical specular and sun glitter zones (θ = 2 and 9° respectively). The orange arrows identify the
brightened pixels appearing in the sun glitter zone, where VIMS is most sensitive to sun glitter. In the left image, a
filled red ellipse indicates the theoretical specular point, which is observed as saturation in the two black pixels of the
right image.

of Figure 2. In particular, the 5 µm window shows a preferential enhancement in brightness (Sotin et al.
2012, Stephan et al. 2010), indicating the reflector is at the surface. The specular reflection is accompanied
by an aureole in the surrounding annulus of pixels (Barnes et al. 2013, Barnes et al. 2014, Stephan et al.
2010). We denote this region of intense reflectance and forward-scattering (Tomasko et al. 2008) with
specular deviation angles less than two degrees as the “specular zone” in this paper. We also define a “sun
glitter zone” as an annulus around the specular zone where sun glitter can be easily detected as regions of
weakly enhanced reflectance relative to the darker liquid surface, shown in Figure 2. The sun glitter zone is
likely confined to a specular deviation angle of ∼9-10° due to the similar steepness ratio (wave height to
wavelength) for breaking waves in liquid methane and water (Craik 2004, Hayes et al. 2013).
  Initial surveys of specular reflections on Ontario Lacus, Jingpo Lacus, and Ligeia Mare turned out to be
very smooth and lacked any signature of waves (Barnes et al. 2011a, Wye et al. 2009, Zebker et al. 2014).
A T59 specular reflection observed over Kraken Mare produced an inconclusive light curve, but wind or
wave activity was postulated (Barnes et al. 2011a). In the late northern spring, Barnes et al. (2014) found
several isolated bright pixels on Punga Mare during the T85 flyby (northern spring), providing the first
definitive evidence of extraterrestrial waves. Soon after, the detection of RADAR-bright “magic islands” in
Ligeia Mare were also theorized to be surface waves (Hofgartner et al. 2014, Hofgartner et al. 2016). Recent
findings suggest Kraken Mare sea surface roughness constraints at 6-10 mm from RADAR altimeter
measurements (Grima et al. 2017) and
4                                               HESLAR ET AL.
  This paper investigates the occurrence of waves in constricted straits of the maria to probe oceanic
processes, including tides and wind activity. Section 2 describes moderate-sampling (∼17-21 km) sun glitter
observations in large areas of Kraken Mare as observed by specific near-infrared (NIR) atmospheric
windows of Titan’s atmosphere during the T104, T105, and T110 Titan flybys. Section 3 describes our
examination of VIMS IR spectra that provide evidence to distinguish sun glitter from other surface and
atmospheric features. Section 4 includes an analysis of fine-sampling sun glitter in select straits (Freta) of
Kraken Mare. Section 5 considers the possible scenarios for consistent wave action and their implications
on oceanographic phenomena in Kraken Mare, before we conclude in Section 6.
                    2. MODERATE-SAMPLING SUN GLITTER OBSERVATIONS
  We focus our search for sun glitter in the later Titan flybys (after T100) that cover the northern spring and
summer seasons with anticipated increases in capillary-gravity wave activity (Hayes et al. 2013, Lorenz &
Hayes 2012). The northern spring and summer also offered the best chances to observe sun glitter with the
constant daytime over the maria. We include some VIMS observation at coarse sampling (≥10 km/pixel)
with bright specular reflections from the T104 and T105 flybys in Table 1. The T104 and T105 flybys were
accompanied with fine-sampling sun glitter observations (90%), which allows for the most detailed
surface studies of Titan (Sotin et al. 2012). We use Delaunay triangulation to interpolate the VIMS
observation into a polar projection and retain the details of the raw data (Le Mouelic et al. 2019). We isolate
the sun glitter zone with specular deviation angles between 2 and 9 degrees. Observational conditions of
sun glitter, including spacecraft altitude (Soderblom et al. 2012), airmass (Le Mouelic et al. 2019), and the
specular deviation angle (Cox & Munk 1954), vary for each Titan flyby and are corrected for an accurate
comparison in Figure 4. We remove false positives (i.e. cosmic ray pixels) with a 3×3 low-pass filter if the
pixels are only bright in a few neighboring spectral channels.
  In the moderate-sampling 5 µm observations of Figure 4, the specular zone is confined to a small region
of bright pixels that contains the specular point. In the sun glitter zone, we find several instances of sun
glitter up to 350 km away during both T104 and T105 flybys. In particular, the sun glitter overlays the same
locations in Kraken Mare, Bayta and Seldon Freta (narrow straits). Note that the large red feature in the
T105 observation in Figure 4 is likely sun glitter, located to the east of Penglai Insula. The detection of sun
glitter on two separate flybys may be indicative of consistently rough sea surfaces in the Freta of Kraken
Mare. The presence of sun glitter is not surprising for coastal areas that are favorable for wave generation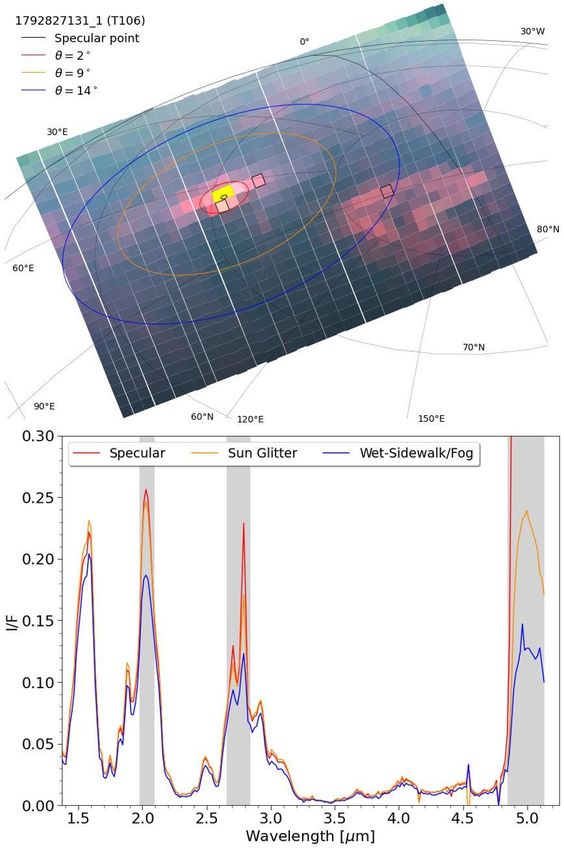
WAVES IN TITAN’S KRAKEN MARE 5
Table 1. Details on select VIMS observations with sun glitter for the T104, T105, T106, and T110 flybys. Each cube
name starts with “CM_”. SC Alt. is shorthand for spacecraft altitude. We denote the relative quality of the VIMS
observation as “Fine” if its mean spatial sampling is less than 10 km/pixel. f represents true anomaly in degrees.
Flyby Cube Image mid-time Sampling Phase Incidence Emission SC Alt. f Sampling
CM_ Date, Time [UTC] [km/pixel] [°] [°] [°] [km] [°] Quality
T104 1787311929 1 2014-08-21, 10:50:46 24 103 24-85 17-89 44,667 249 Coarse
T104 1787310233 1 2014-08-21, 10:04:53 17 102 43-58 44-60 35,502 248 Coarse
T104 1787307197 1 2014-08-21, 09:20:28 10 99 58-77 24-51 19,114 247 Coarse
T104 1787306033 1 2014-08-21, 08:54:53 7 97 57-62 35-40 12,879 247 Fine
T105 1790066425 1 2014-09-22, 07:45:01 21 109-111 23-77 37-89 42,680 248 Coarse
T105 1790059135 1 2014-09-22, 05:39:57 2 86-90 50-55 31-41 4,055 246 Fine
T105 1790059235 1 2014-09-22, 05:43:45 3 89-97 48-56 34-49 4,506 246 Fine
T106 1792827131 1 2014-10-24, 06:38:12 36 120 34-79 40-88 77,873 250 Coarse
T110 1805210863 1 2015-03-16, 14:30:21 2 75-108 49-53 58-66 2,408 246 Fine
T110 1805212073 1 2015-03-16, 14:49:48 3 133-135 58-73 62-75 8,219 246 Fine
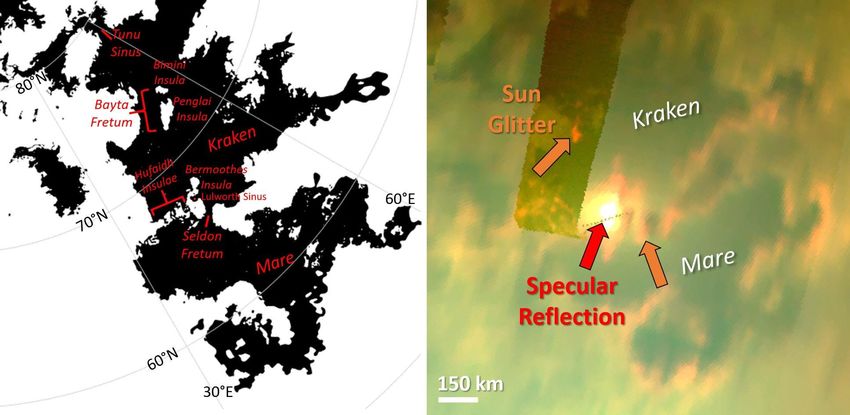
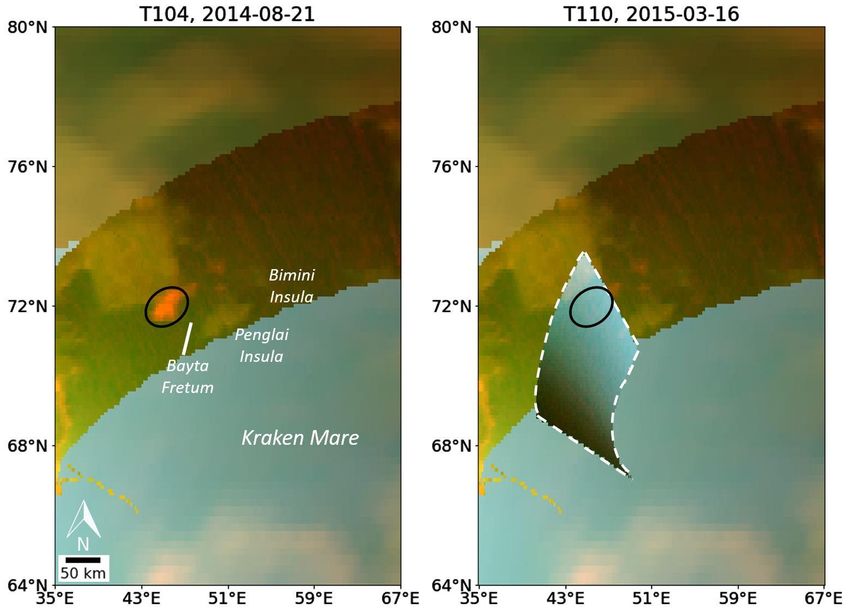
Figure 3. The left image shows a binary map of the Titan maria, derived from Cassini Imaging Science Subsystem
(ISS) and RADAR data, and named features relevant for this publication. The right image shows the Cassini VIMS
north polar map from the T104 flyby cropped onto Kraken Mare in the wet-sidewalk color scheme of Figure 2. Liquid
surface features, specifically the specular reflection and sun glitter (red and orange arrows), appear as anomalously
bright, uniform spots in the narrow straits or Freta of Kraken Mare.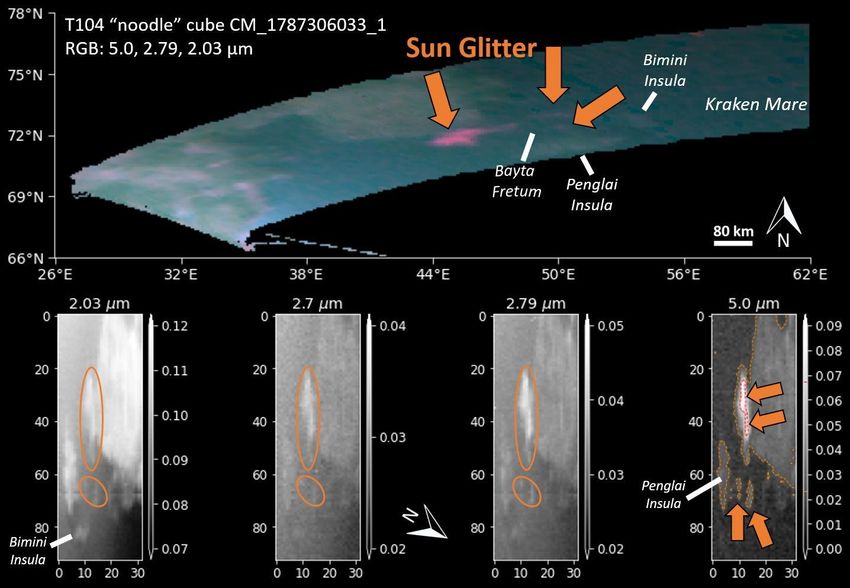
6 HESLAR ET AL.
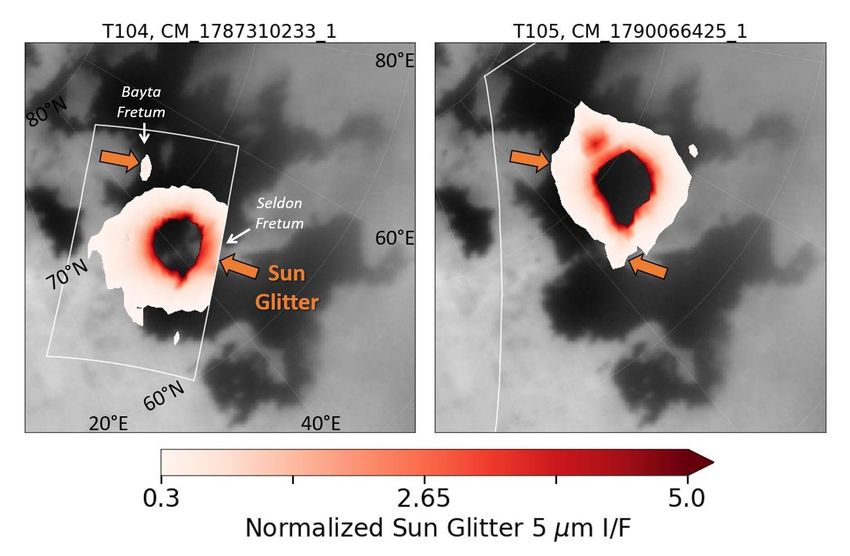
Figure 4. Probable regions of sun glitter are shown in the coarse-sampling VIMS cubes of Kraken Mare (∼17 and 21
km/pixel respectively) for the T104 and T105 flybys, CM_1787310233_1 and CM_1790066425 1, in a normalized 5
µm polar projection. The 5 µm I/F is normalized by three factors: 1) the airmass used in Le Mouelic et al.(2019), 2)
a quadratic dependence of the specular deviation angle at the edge of the sun glitter zone (θ = 9°), and 3) a quadratic
dependence of the spacecraft altitude at 44,000 km. The cubes are overlaid on an ISS basemap of Kraken Mare
(Karkoschka et al. 2017). The translucent grid lines represent lines of latitude and longitude. Sun glitter overlays
Bayta and Seldon Freta (orange arrows) during both flybys, indicating persistent roughness in these regions.
from turbulent surface currents (Job 2005, Lorenz 2014), yet prior NIR and RADAR specular observations
indicated smooth sea surfaces (Barnes et al. 2011a, Hayes 2016).
We note that the morphology of the observed sun glitter zone can provide insights to the overall sea state
of Kraken Mare. Mainly, the T105 zone shows a larger areal extent and more elliptical profile. The Seldon
sun glitter is brighter during the T104 flyby, while Bayta sun glitter shows similar I/F on both flybys.
Overall, the sun glitter observations between the T104 and T105 flybys are suggestive of a variable, rough
sea state in the north Kraken Mare region on two summer Titan days.
3. SPECTRAL ANALYSIS
We derive the spectral information of various features using individual VIMS spectra in this section. In
Figure 5, we compare the spectra of the notable surface features, namely the hydrocarbon sea, evaporite
deposits, sun glitter, and a specular reflection, from T104 VIMS cube CM_1787311929_1 due to its large
spatial coverage at moderate sampling (24 km/pixel). The main atmospheric feature, tropospheric clouds,
was observed in the T104 VIMS cube CM_1787307197_1 with a notable arrowhead shape. The cloud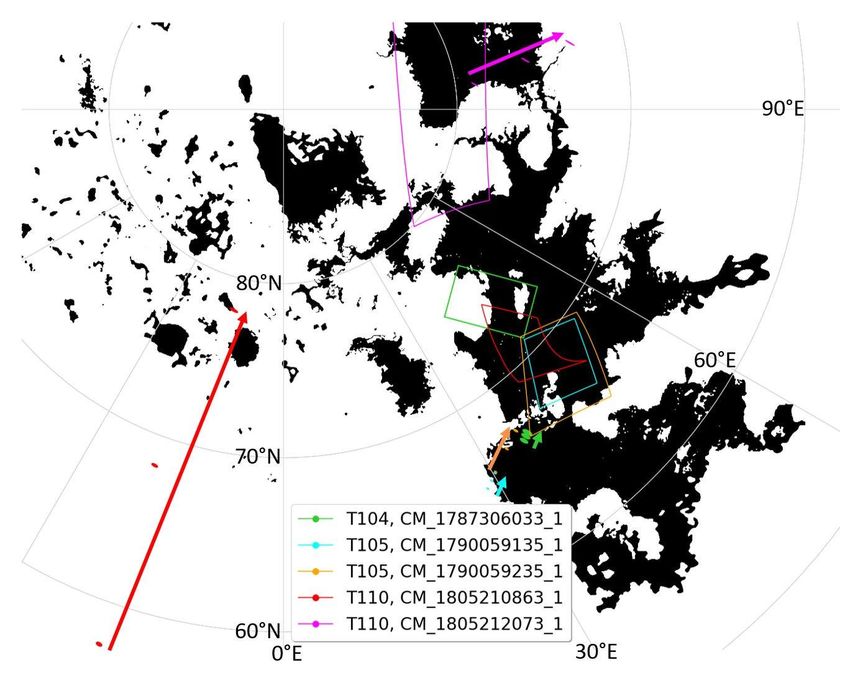
WAVES IN TITAN’S KRAKEN MARE                                                 7

Figure 5. Near-IR spectra of surface and atmospheric features observed around Kraken Mare during the T104 flyby.
Grey boxes indicate the transmission windows of Titan at 2.03, 2.75, and 5 µm. The inset plots show Kraken Mare
from VIMS cube CM_1787311929_1 and the arrow cloud located north of Kraken Mare from cube
CM_1787307197_1 with the same RGB color scheme as Figure 2. Spectral units are identified in the inset plot by
boxes of the corresponding color. The spectra for evaporites and clouds show similar brightened I/F values for the 5
µm transmission window, while the hydrocarbon sea is the darkest surface feature. Evaporites are bright 5 µm deposits
nestled along certain Kraken Mare coastlines. The brightest features are the non-saturated specular reflection and sun
glitter observed in western Kraken Mare. The specular reflection pixel reaches a peak I/F of ∼2.

spectrum in Figure 5 shows enhanced brightness in all methane transmission windows down to 2 µm with
the characteristic bumps in the 2.12 µm wing and 2.9 µm window, which are common properties of high
Titan clouds (Brown et al. 2009, Griffith et al. 2000, Rodriguez et al. 2011, Turtle et al. 2018). The sea
spectrum shows that the hydrocarbon seas have the strongest near-IR absorption and appear rather uniform
across Titan’s surface as seen in the inset image in Figure 5.
  The evaporite deposits are known to be bright at mainly 5 µm and have been documented along this coastal
region of southeast Kraken Mare during many flybys (MacKenzie et al. 2014, MacKenzie & Barnes 2016).
We note an increased 2 µm brightness of the evaporite spectrum in Figure 5. To our best knowledge, the
surface phase function and composition of Titan evaporites remain unknown (MacKenzie & Barnes 2016).
Nonetheless, we identify evaporites as a fixed coastal feature of Kraken Mare.
  The 5 µm saturated pixels covering known areas of Kraken Mare are a clear sign of a specular reflection
at a close spacecraft altitude (Soderblom et al. 2012). The brightest non-saturated pixel leaves no doubt of
its specular nature as it goes off the chart in Figure 5. Also, there are reports of “bright ephemeral features”
(BEFs) during north polar summer, possibly caused by wetted surfaces or fog (Dhingra et al. 2019, Dhingra
et al. 2020). We show a T106 VIMS observation of a BEF in Figure 6 where there is potential sun glitter in
Kraken Mare for direct comparison. We observe set of pink pixels near the specular reflection in Figure 6
but inside the sun glitter zone, which we attribute to the possible sun glitter. Conversely, we observe the
large, documented wet-sidewalk feature (Dhingra et al. 2020) at a larger specular deviation angle of 14° in
Figure 6. A comparison of their spectra in Figure 6 shows the BEF is dimmer than the sun glitter in the
8                                              HESLAR ET AL.
transmission windows. Thus, we are reasonably confident that the BEF is distinct from sun glitter from the
T106 observation. The distinguishing features of the BEF include a large areal coverage over land and
Ligeia Mare and a location outside of the sun glitter zone that is not consistent with rough sea surfaces.
  This just leaves the sun glitter spectrum seen as the second brightest feature at 5 µm in Figure 5. Previous
sun glitter observations from the T85 flyby (Barnes et al. 2014) likely only observed sun glitter at 5 µm due
to strong forward-scattering at a high incidence angle of ∼73° (Soderblom et al. 2012). Hence, the
atmospheric scattering exceeds the surface reflectance for the sun glitter pixels, making the sun glitter
indiscernible at wavelengths shorter than 5 µm. However, there is no physical reason why Cassini VIMS
cannot view sun glitter at shorter wavelengths. Figure 5 confirms that the T104 sun glitter spectrum is
brighter than the sea spectrum in the 2.03 and 2.75 µm windows at an incidence angle of ∼55°.

                        4. FINE-SAMPLING SUN GLITTER OBSERVATIONS
  We turn our attention to an analysis of fine-sampling (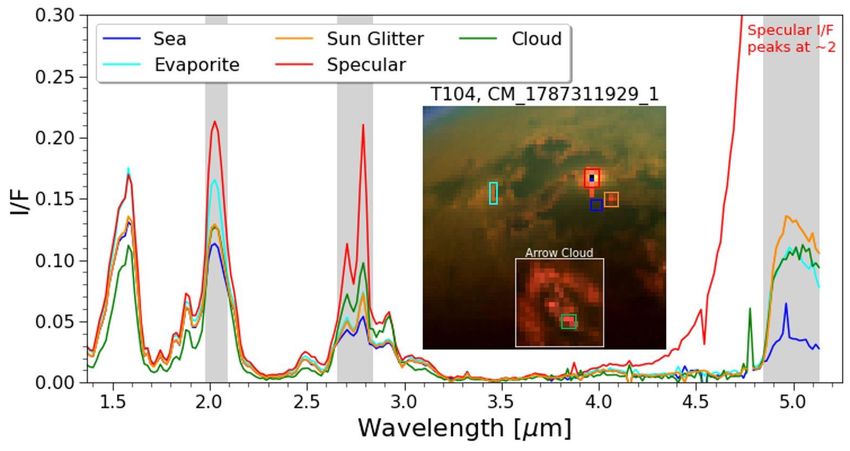
WAVES IN TITAN’S KRAKEN MARE                                                  9

Figure 6. Top panel: The ortho-projected, saturated T106 VIMS observation with the wet-sidewalk RGB color scheme
of Figure 2 contains both sun glitter and a wet-sidewalk feature (BEF). The ortho-projection did not use raster
interpolation in order to preserve the features. The specular, sun glitter, and BEF zones are noted by red, orange, and
blue ovals with their respective specular deviation angle. Yellow pixels indicate saturation. The black theoretical
10                                                 HESLAR ET AL.
specular point lies within the saturated zone. Bottom panel: VIMS near-infrared pixel spectra of the corresponding
features. The pixel for each zone is outlined in the top panel. Grey regions indicate the methane transmission windows.

Figure 7. This figure showcases the fine-sampling VIMS cubes and their solid footprints from the T104, T105, and
T110 flybys atop the binary map from Figure 3 in a polar projection. The colored ellipses show the relative dimensions
and locations of the theoretical specular points over the observation time of the fine-sampling cubes. We plot the
specular points at the start, middle, and end of the cube’s observation time. The arrows indicate the direction and
displacement of the specular point motion across the surface of Titan. Note that the specular point dimensions are 50
times larger for visibility, while red ellipses are 150 times larger.

the 5 µm window as seen by the red, dashed contours in Figure 8, which likely means that the wave field is
variegated with some range of wave heights. The two brighter wave fields inside the largest sun glitter also
appear at different distances between ∼10-25 km from the coastline. We determine the approximate
coastline at 1.58 µm where no sun glitter is present. We also observe the sun glitter with a similar
morphology in the shorter atmospheric windows at 2.03, 2.7, and 2.79 µm. Note that the sun glitter I/F
intensity varies with the atmospheric transparency of each window, where shorter wavelengths are less
transparent. The sun glitter I/F is independent of the sea composition since the refractive indices of liquid
methane and ethane show little change over VIMS wavelengths (Martonchik & Orton 1994), consistent
with multi-wavelength sun glitter imagery of Earth’s ocean (Kay et al. 2009).
WAVES IN TITAN’S KRAKEN MARE                                                   11

Figure 8. Top panel: A fine-sampling cylindrical map of the T104 “noodle” cube CM_1787306033_1 for northwest
Kraken Mare with the same wet-sidewalk RGB color scheme as Figure 2. The observation reveals three separate sun
glitter observations (orange arrows) in Bayta Fretum and along the northern coastline of Penglai Insula. Bottom
panels: The unprojected “noodle” cube (green footprint in Figure 7) in the 4 transmission windows (left to right: 2.03,
2.7, 2.79, 5.0 µm) shows where the sun glitter pops out near the Bayta coastline. The 5 µm image includes red and
orange dashed I/F contours of 0.023 and 0.057 respectively. The 5 µm image shows the far left orange contour as the
Penglai Insula, while the smaller contours identify the three distinct sun glitter feature. The red contours identify
notable wave fields in the largest sun glitter feature. At shorter wavelengths, orange ovals show the sun glitter features.
The colorbar range highlights the relative transparencies of the transmission windows. Note that Bimini Insula is not
visible in the 5 µm window due to its low signal-to-noise ratio (see Figure 3b of Sotin et al. 2012), but clearly appears
at 2.03 µm.

  During the T110 flyby, there was a fine-sampling (2 km/pixel) VIMS cube CM_1805210863_1 of Bayta
Fretum that overlapped the largest T104 sun glitter in Figure 9. We note that the brightened surface on
Kraken Mare is not caused by a specular reflection but rather skylight being reflected off the sea surface
due to emission angles exceeding 60° (Vixie et al. 2015; refer to Figure 5 of Barnes et al. (2014) for a visual
example). The right image of Figure 9 seemingly shows no evidence of surface roughness amongst the
brightened sea surface in the T110 observation. On a brightened sea surface, we expect surface roughness
to manifest as dark patches since they limit the number of surface facets able to reflect skylight. However,
we are unable to fully rule out the possibility of surface roughness since VIMS does not have the sensitivity
to
12                                                  HESLAR ET AL.

Figure 9. The left image shows the same fine-sampling “noodle” T104 cube Figure 8 overlaid on a cylindrical basemap
of northwest Kraken Mare with the same contrast-enhanced wet-sidewalk color scheme as Figure 2. The right image
shows the VIMS cube CM_1805210863_1 (white, dashed lines) from the T110 flyby that overlies the T104 Bayta
sun glitter region from the left image. The diffuse reflection on the sea is due to emission angles exceeding 60° (Vixie
et al. 2015). This observation shows no sun glitter during the T110 flyby in Bayta Fretum; however, the observation
geometry for this cube limits our ability to rule out surface roughness.

distinguish darker regions on a sea surface with very low reflectance (∼1%) (Sotin et al. 2012). In addition,
the T110 specular point is located several hundred kilometers from Bayta Fretum (Figure 7), preventing the
detection of any possible sun glitter.

                                                4.2. Seldon Fretum
  The 40×17 km Seldon Fretum and nearby archipelago have been suggested to play a significant role in
the tidal interactions and liquid exchanges between the north and south Kraken Mare basins (Lorenz et al.
2014, Tokano 2010, Tokano et al. 2014, Vincent et al. 2018). Fine-sampling sun glitter imagery can
therefore shed light on the sea surface dynamics of the Seldon Fretum region. As such, we present the first
observational evidence of sun glitter in 2 separate fine-sampling (2-3 km/pixel) cubes, CM_1790059135_1
and CM_1790059235 1, of the immediate region of Seldon Fretum during the T105 flyby. The T105
specular point travels 115 km northeastward over the observation time of VIMS cube CM_1790059235_1
(orange
WAVES IN TITAN’S KRAKEN MARE 13 Figure 10. Two fine-sampling (∼2 km) VIMS observations of sun glitter near Seldon Fretum from the T105 flyby in a polar stereographic projection overlying a Cassini HiSAR RADAR basemap (Lopes et al. 2019). The white outlines indicate the spatial extent of each cube. The red color indicates a 5 µm I/F greater than 0.1 that corresponds to the specular “zone” with a maximum I/F of ∼0.76. These observations were taken 100 seconds apart. The second observation (t=100 s) has an 80 ms exposure time. We observe numerous instances of sun glitter (orange arrows) with the brightest ones occurring in Lulworth Sinus and Seldon Fretum (orange oval). Weaker sun glitter was detected near the north tip of Bermoothes Insula. The white arrow points to offshore sun glitter. The first cube was taken at a 20 ms exposure time, resulting in a poor signal-to-ratio for the 5 µm window. Thus, there was only one repeat
14                                                HESLAR ET AL.
detection of sun glitter between the two observations in Lulworth Sinus, based on its overall I/F enhancement at 5 µm
(grey region) shown in the bottom spectral plot.
ellipses in Figure 7). So, we do not include pixels with an I/F greater than 0.1 from the specular zone,
denoted by the red region in Figure 10, from this cube in our analysis.
  Overall, we identify six isolated instances of sun glitter in CM_1790059235 1, denoted by arrows or ovals
in Figure 10. We overlay a Cassini RADAR basemap (Lopes et al. 2019) to put these instances of sun glitter
into geographic context. We note that the red region likely contains sun glitter in the narrow channels
between the islands.
  First, we observe a notable extent of sun glitter that nearly overlays the northern terminus of Seldon Fretum
(orange oval in Figure 10). The striking part of the Seldon sun glitter is how it terminates at the northern
edge of the strait, showing how the sea surface roughness is confined to Seldon Fretum.
  Second, the entrance of a previously unnamed cove has notable sun glitter that exceeds a 5 µm I/F of 0.1
(red arrow in Figure 10). This cove, Lulworth Sinus, has a narrow 10 km mouth from RADAR data (Lorenz
et al. 2014), so the Lulworth sun glitter indicates notable sea surface roughness at the mouth. In addition,
the Lulworth sun glitter was the only one likely observed in a second fine-sampling VIMS cube,
CM_1790059135 1, taken only 100 seconds earlier (green arrow in Figure 10). The specular point distance
for the Lulworth sun glitter pixel in cube CM_1790059135_1 is ∼300 km, so we can reasonably compare
the Lulworth sun glitter pixels between the two T105 cubes. Unfortunately, the 20 ms exposure time of cube
CM_1790059135_1 created a rather noisy observation at 5 µm (top left plot of Figure 10). Nonetheless, we
observe an overall I/F increase in the 5 µm window for both Lulworth sun glitter pixels in their spectra in
Figure 10. Overall, we cannot be certain of a time-resolved observation of sea surface roughness at the
mouth of Lulworth Sinus without ruling out the different viewing geometry between the two cubes.
  Third, we note four isolated instances of sun glitter near tiny RADAR-bright islands off the coasts of
Hufaidh Insulae and Bermoothes Insula (orange arrows in Figure 10). The locations of this sun glitter near
the coastlines of tiny islands may suggest a build-up of sea surface waves (i.e. a wave field). If this
interpretation of the sun glitter is true, then the wave fields may originate from multiple sources, given their
relative locations on different sides of their respective island. The rightmost sun glitter (white arrow in
Figure 10) is not located near any visible coastline, suggesting local sea surface roughness may be caused
by unseen factors, such as a submarine landmass (e.g. a seamount) disrupting a surface current.
  Finally, we address the presence of a ∼100 km linear feature that appears in cube CM_1790059235_1
(denoted as “data artifact” in Figure 10). The specular point trajectory for the observation time of this cube
is directly behind the cube’s orange footprint in Figure 7. We also do not see this alignment or similar
artifacts in any other fine-sampling VIMS observation. Thus, we attribute the feature to a sunbeam (Lynch
& Livingston 2001) radiating from the specular point. This artifact is similar to previous specular reflection
anomalies (Barnes et al. 2013) caused by an instrumental artifact due to internal reflections in VIMS.

                                                 4.3. Tunu Sinus
  The ∼20 km wide strait Tunu Sinus has also been a place of interest in regards to the fast tidal flows
predicted for this portion of the north Kraken Mare basin (Tokano 2010, Vincent et al. 2018). We observe
evidence of sun glitter present in Tunu Sinus in a fine-sampling (3 km/pixel) cube, CM_1805212073 1,
during the T110 flyby, shown in Figure 11. The T110 specular point only moves 25 km southward over the
observation time of the Tunu Sinus region (purple ellipses in Figure 7), allowing us to compare the
individual sun glitter features.
  Four or five unique instances of 5 µm sun glitter appear confined to the narrow straits or concave coastlines
of Tunu Sinus. Specifically, we note the brightest sun glitter coincides with the narrowest (∼15 km) portions
of Tunu Sinus, which may correspond to the most turbulent wave fields in this observation.
WAVES IN TITAN’S KRAKEN MARE 15
Figure 11. The left image show the 2.8 km2 Cassini ISS basemap (Karkoschka et al. 2017) in a polar projection with
labeled features of the maria. The right plot shows an inset image (red box) of the fine-sampling (∼3 km) T110 VIMS
observation CM_1805212073_1 with isolated sun glitter in Tunu Sinus at 5 µm, indicated by orange arrows. The
white outline indicates the spatial extent of the VIMS image cube. The I/F range isolates the sun glitter in Tunu Sinus
since the 5 µm I/F is ∼0.1 for the dark sea pixels.
5. DISCUSSION
We postulate as to the possible origins of the wave fields associated with the sun glitter observations.
5.1. Origin of T104 Bayta Fretum sun glitter
Large swaths of sun glitter are common features for various coastlines of Earth from airplanes and
finesampling remote sensing (Kay et al. 2009). Deep-sea surface waves approaching a coastline experience
wave-shoaling or increases in wave height from turbulent actions with the seafloor (Craik 2004). The wave
base is the maximum depth at which a propagating surface wave can turbulently interact with the seafloor.
On Earth, the wave base is considered one-half of the wavelength of a surface wave. Thus, the variegated
sun glitter may indicate a shallow bathymetry for Bayta Fretum. However, this explanation does not pin
down the origin of the wave fields observed in Bayta Fretum. Nonetheless, we postulate two possible origins
for deep-sea waves reaching Bayta Fretum with inference from applicable physical models of Titan’s sea
processes: 1) tidal currents and 2) wind swells.
First, tidal models of Titan have attempted to estimate the general trends of tidal surface currents in the
northern maria over a Titan day (Tokano et al. 2014, Vincent et al. 2018). The most recent model predicts
that the wider margins of Bayta Fretum might only allow for a maximum southward tidal current of 1 cm/s
at perikron, Titan’s closest approach to Saturn (Vincent et al. 2018). This observation generally holds for
several assumed bathymetric profiles (Vincent et al. 2018), considering the bathymetry of Kraken Mare is
mostly unknown (Hayes et al. 2018). Tidal currents of 1 cm/s do not reach the 11 cm/s threshold predicted
for capillary-gravity wave generation (Hayes et al. 2013). Furthermore, we note that the T104 and T110
Bayta observations from Figure 9 were recorded at the same true anomaly, indicating diurnal tides may not
be responsible for the sun glitter. As a result, a coastal tidal current likely does not explain the Bayta wave
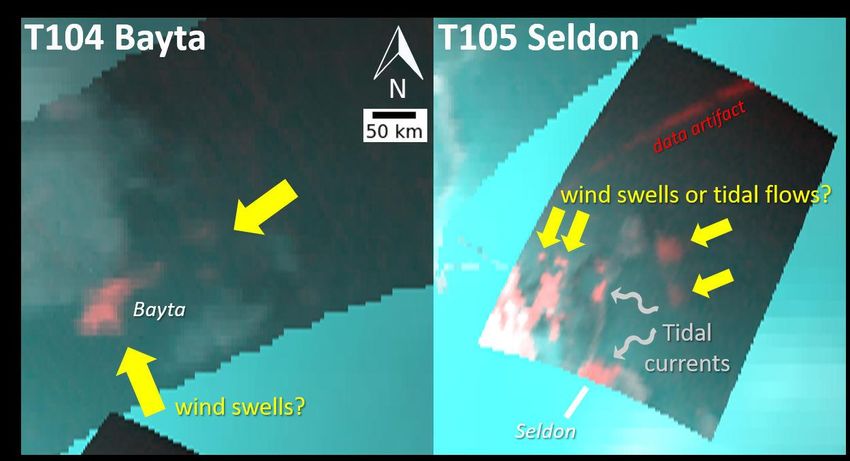
fields without an additional unknown factor, such as a local area of shallow bathymetry.16 HESLAR ET AL. Figure 12. Summary of the possible origins of the fine sampling sun glitter and associated wave fields in the T104 noodle cube and T105 cube CM_1790059235 1. We use the same wet-sidewalk RGB color scheme of Figure 2. We note the linear sunbeam as the “data artifact” in the T105 cube. The arrows are not an indicator of flow direction, which remains unknown. The largest Bayta wave fields likely originate from winds given the weak tidal currents predicted in Bayta Fretum. For Seldon Fretum and Lulworth Sinus, the wave fields seem to originate from the constriction of tidal currents in their mouths. The other weaker sun glitter may originate from the winds or tides with enhancement from local areas of shallow bathymetry near the coastlines (i.e. wave-shoaling). Secondly, wind-induced wave activity has been long-speculated on Titan’s maria (Ghafoor et al. 2000, Ori et al. 1998) considering the ubiquitous occurrence of surface waves on Earth, which ranges from capillary ripples to 30 m high waves in the open ocean (Toffoli et al. 2017). Initial laboratory experiments and several wind-wave models of Titan have found that the maximum predicted 1 m/s winds can generate capillary wind waves with meter-scale wavelengths and wave heights of ∼20 cm (Ghafoor et al. 2000, Hayes et al. 2013, Lorenz et al. 2005, Lorenz & Hayes 2012, Lorenz et al. 2012a). Furthermore, coupled sea-GCM_models indicate relatively ethane-rich seas, like Kraken Mare, might enhance moist convection and subsequent wind activity directly over the seas (i.e. a sea breeze) (Tokano et al. 2009). Our moderate- sampling T104 and T105 sun glitter observations show evidence of consistently rough sea surfaces in Bayta Fretum, suggesting the possible wind source has a regional origin within the north Kraken basin. The T104 observations of the arrow cloud located north of Ligeia Mare (Figure 5) and a northern Ligeia “magic island” interpreted as waves (Hofgartner et al. 2016) may indicate the arrow cloud is associated with deep convective processes and stormy weather over Ligeia Mare. However, the Bayta waves are ∼700 km away from the arrow cloud. Gust fronts formed by storm downdrafts may generate surface winds of 10 m/s (Charnay et al. 2015), but likely only have a radius of influence of a few hundred kilometers based on numerical storm simulations in Titan’s lower troposphere (Rafkin & Barth 2015) and terrestrial observations (Lothon et al. 2011). Thus, we cannot ascertain that the arrow cloud system could have wind fields strong
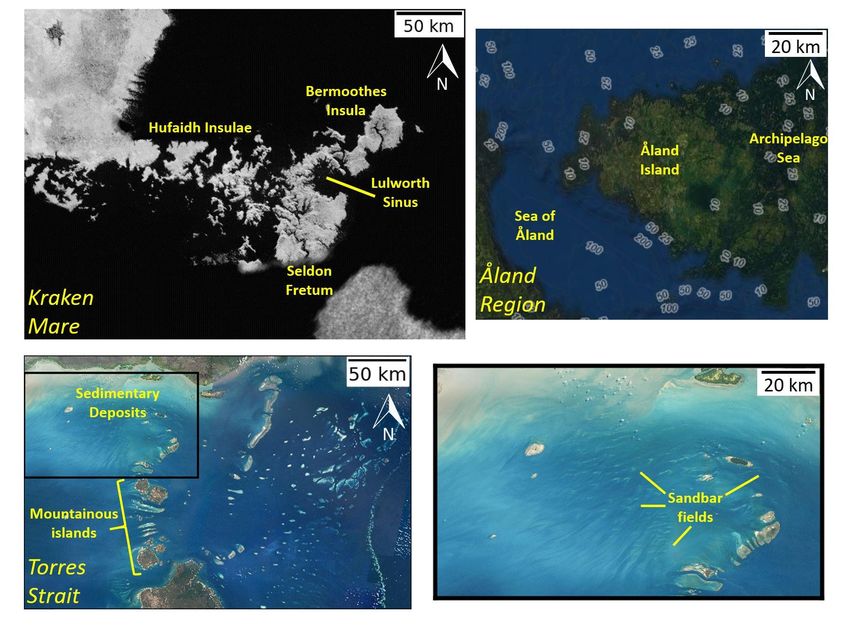
WAVES IN TITAN’S KRAKEN MARE                                                  17

Figure 13. Two possible scenarios for the marine environment of Bermoothes and Hufaidh Insulae with terrestrial
analogues. Top left panel: A cleaned Cassini RADAR map of Hufaidh and Bermoothes Insulae in a cylindrical
projection (Credit: NASA/JPL-Caltech/Space Science Institute/Ian Regan). Top right panel: An ESRI World Imagery
basemap of the Aland Region situated between Sweden and Finland with local NOAA bathymetry depths in meters.
Bottom left and right panels: A compiled NASA MODIS mosaic of the Torres Strait in a cylindrical projection
(Lawrey 2013) and a subwindow of the north region (black ox) respectively. This Kraken Mare archipelago displays
a similar island density and coastal morphology to the Aland Region and Torres Strait. Both terrestrial analogues host
shallow bathymetry. This may imply a similar bathymetry for Bermoothes and Hufaidh Insulae if there was a recent
geological period of sea-level rise or tectonic uplift. If a large sediment supply is available in Bermoothes and Hufaidh
Insulae, then tidal currents may form submarine features similar to the intricate sandbars seen in the northern Torres
strait (bottom right panel).

enough to generate wind swells out at Bayta Fretum. In addition, Bimini and Penglai Insulae may act as
large breakwaters that protect Bayta Fretum from large wind swells.
  Overall, the differentiation between surface waves induced by tides or wind is quite difficult with limited
fine-sampling observations and observation geometries. Sea-wind circulation models show that the coastal
regions of Kraken Mare may experience similar sea level changes from the tides and summer winds (Tokano
& Lorenz 2015). Specifically, the maximum wind setup (i.e. increase in sea level near the coast due to wind-
wave action) is nearly equivalent to the tidal range of ∼8-10 cm on the Bayta shoreline. Thus, the
combination of our sun glitter observations and model predictions suggest a complex dynamic for wave
activity initiated by the winds or tides that depends on unknown coastline characteristics, such as bathymetry
(Hayes et al. 2018).
18                                               HESLAR ET AL.
                                5.2. Origin of T105 Seldon Fretum sun glitter
  Seldon Fretum is a narrow strait connecting the two large basins of Kraken Mare expected to host choppy
seas (Lorenz et al. 2014).

                             5.2.1. Tidal Currents: Seldon Fretum and Lulworth Sinus
  The most noteworthy sun glitter detection in the fine-sampling T105 cube CM_1790059235_1 were in
Seldon Fretum and the entrance of Lulworth Sinus. Seldon Fretum is the location where fast northward tidal
currents are predicted in tidal models at ∼0.2 Titan days after apokron (Tokano et al. 2014, Vincent et al.
2018). The tidal models assumed shallow bathymetric profiles ( 2300). Also, energy balance (gh =
0.5u2) shows that 0.3 m/s tidal current velocities (u) in Seldon Fretum can cause a sea surface roughness (h)
of ∼3 cm, reaching the capillary-gravity wave threshold (Hayes et al. 2013). The surface liquid exchanges
between the Kraken basins would be driven by tidal flows with only minor influences from surface winds
in Seldon Fretum (Lorenz et al. 2014, Ori et al. 1998). We anticipate a spectrum of centimeter-scale wave
heights in Seldon Fretum, but constraining wave heights remains beyond the scope of this work without
bathymetric profiles.
  The occurrence of internal waves, the surface manifestations of turbulence at the boundary of two stratified
layers in the sea, has been suggested for Seldon Fretum due to the possibility of stratified seas (Lorenz et
al. 2014). Recent theoretical and experimental evidence shows one possible scenario for a two-liquid layer
stratification with a methane-rich top layer and an ethane-rich bottom layer in Kraken Mare (Cordier et al.
2017, Hanley et al. 2018). If this binary liquid were present in Seldon Fretum, then tidal currents in the top
methane-rich layer could cause roughness on the bottom ethane-rich layer and subsequently generate
internal waves that propagate to the surface at some distance from Seldon Fretum. However, if Seldon
Fretum has shallow bathymetry, we note that any stratification may be broken due to significant mixing
from the bottom friction of the seafloor. On Earth, there is a lack of internal waves in certain straits, such as
the English channel (Jackson 2007). Alternatively, a shallow Seldon Fretum may only allow for the
exchange of the surface methane layer, also preventing internal wave formation.

                             5.2.2. Surface waves: Bermoothes and Hufaidh Insulae
  The coarse-sampling T105 cube in Figure 4 shows a large swath of the surface of north Kraken Mare
being roughened, which we interpret as windy surface conditions over Kraken Mare on this Titan day. The
4 separate detections of sun glitter along the northern shores of Bermoothes and Hufaidh Insulae (orange
arrows in Figure 10) have two possible origins: winds or tidal currents. In practice, distinguishing between
the two is quite hard from a single sun glitter observation. We are likely only observing a small part of the
actual wave angle spectrum that is limited by our viewing geometry bias. We note that one sun glitter feature
WAVES IN TITAN’S KRAKEN MARE 19
is located ∼30 km offshore of Bermoothes Insula (white arrow in Figure 10), which may indicate wind-
roughened seas in Kraken Mare. The red regions over Hufaidh Insulae in Figure 10 are likely indicative of
surface waves generated from constricted tidal currents. Overall, we cannot determine a single origin for
these Insula wave fields but rather likely originate from a combination of the tides and summer winds.
5.2.3. Coastal Morphology of Hufaidh and Bermoothes Insulae
We can interpret the coastal morphology and geology of Hufaidh and Bermoothes Insulae using the
observations of various wave fields in the Seldon Fretum region. We identify two potential terrestrial
analogues to this region: the Aland Region in the Baltic Sea (Lorenz et al. 2014) and the Torres Strait
between Australia and Papua New Guinea. These terrestrial analogues are both island-dense straits with
shallow bathymetry (20 HESLAR ET AL.
One final geological feature is the semi-circular Lulworth Sinus. The observation of bright sun glitter at
the entrance to Lulworth Sinus in two separate T105 cubes indicates tidal currents and considerable wave
activity in Lulworth Sinus. The interior coastlines appear to host several rias in Figure 13, suggesting that
Lulworth Sinus was likely infilled during a period of sea-level rise or isostatic subsidence. Thus, wave action
likely has not played a role in the formation or semi-circular shape of Lulworth Sinus.
5.3. Origin of T110 Tunu Sinus sun glitter
Stereo topography of the nearby Mayda Insula from Cassini RADAR suggests significant fluvial erosion
of the terrain (Lucas et al. 2014). Tidal models of Titan predict decimeter-scale tidal flow velocities in the
Tunu Sinus region (Tokano et al. 2014, Vincent et al. 2018). We suggest that the sun glitter likely originates
from the constriction of tidal currents flowing into the narrow straits and concave coastlines of Tunu Sinus.
We are unable to rule out the influence of winds without an observation of local weather conditions during
the T110 flyby due to the high phase angle. Fluvial erosion may be an ongoing geological process driven
by tidal flows in the coastal areas of Tunu Sinus (Ori et al. 1998). The observation of active tidal currents
in Tunu Sinus, combined with evidence for the Maria sharing an equipotential surface (Hayes et al. 2017),
may also indicate active hydrological connections between Kraken and Punga Maria via surface channels
currently unresolved by RADAR.
6. CONCLUSION
The T104 and T105 VIMS observations show evidence of isolated sun glitter across the surface of Kraken
Mare at moderate sampling (17-21 km/pixel) that indicate surface waves. Fine-sampling observations (WAVES IN TITAN’S KRAKEN MARE 21 bedforms (e.g. sandbars) formed by tidal action. Hufaidh and Bermoothes Insulae could have submarine sedimentary features, such as “icy” sandbars. Alternatively, Hufaidh and Bermoothes Insulae may simply host a mix of cliffed and ria coastlines with no major sedimentary deposits, just like the Aland region. Also, the islands of Hufaidh and Bermoothes Insulae are likely isolated peaks of the primordial Titan crust due to either the drowning of local peaks from a period of sea level rise or local tectonic uplift. These scenarios match the geological origins of the Torres Strait and the Aland region respectively. Finally, the shorelines of Bermoothes Insula and Lulworth Sinus may show evidence of a submergent coastline with flooded river valleys or rias and imply a recent episode of sea-level rise for Kraken Mare. Tunu Sinus tidal flows and the common equipotential surface of Titan’s Maria may lean evidence toward a surface hydrological connection via unresolved rivers between Kraken and Punga Maria. Future Titan missions could constrain the optical properties of Kraken Mare in order to pin down the true surface reflectance of sun glitter and its source. In particular, a Titan orbiter needs to take careful preparation for sun glitter imagery to eliminate artifacts. Also, a Titan orbiter with a wide-field camera could remove ambiguities of the viewing geometry in future observations by observing the same area of sun glitter over an orbit and many incidence and emergence angles. Acquiring constraints on the environmental conditions of the maria would prove beneficial for determining the mission operations and physical limitations of a Titan submarine (Hartwig et al. 2016). The recently-announced Dragonfly mission could use aerial images of potential local pockets of surface liquids from rainstorms to deduce surface winds, as has been demonstrated by airplanes and drones on Earth (Yurovskaya et al. 2018a, Yurovskaya et al. 2018b). MFH, JWB, and JMS acknowledge funding from NASA Cassini Data Analysis and Participating Scientists (CDAPS) grant NNX15AI77G. We thank Rose Palermo and Andrew Ashton for their useful discussion on coastal geomorphology. We acknowledge useful manuscript recommendations from Vincent Chevrier and an anonymous reviewer. The authors acknowledge support from the NASA/ESA Cassini Project in providing data from the VIMS instrument.
22                                                 HESLAR ET AL.
                                                  REFERENCES
Allen, J., Golson, J., & Jones, R. (1977). Sunda and         (2015). Methane storms as a driver of Titan’s dune
  Sahul: prehistoric studies in southeast Asia,              orientation. Nature Geoscience, 8(5), 362-366.
  Melanesia and Australia. Academic Press.                 Cordier, D., Garc´ıa-Sanchez, F., Justo-Garc´       ´ıa,
Barnes, J. W., Brown, R. H., Soderblom, L., Sotin, C.,       D. N., & Liger-Belair, G. (2017). Bubble streams in
  Le Mouelic, S., Rodriguez, S., ... & Baines, K. H.         Titan’s seas as a product of liquid N2+CH4+C2H6
  (2008). Spectroscopy, morphometry, and                     cryogenic mixture. Nature Astronomy, 1(5), 0102.
  photoclinometry of Titan’s dunefields from               Cox, C., & Munk, W. (1954). Measurement of the
  Cassini/VIMS. Icarus, 195(1), 400-414.                     roughness of the sea surface from photographs of
Barnes, J. W., Soderblom, J. M., Brown, R. H.,               the sun’s glitter. Josa, 44(11), 838-850.
  Soderblom, L. A., Stephan, K., Jaumann, R., ... &        Craik, A. D. (2004). The origins of water wave theory.
  Baines, K. H. (2011). Wave constraints for Titan’s         Annual review of fluid mechanics, 36.
  Jingpo Lacus and Kraken Mare from VIMS                   Daniell, J. J. (2015). Bedform facies in western Torres
  specular reflection lightcurves. Icarus, 211(1), 722-      Strait and the influence of hydrodynamics, coastal
  731.                                                       geometry, and sediment supply on their
Barnes, J. W., Clark, R. N., Sotin, C., Adamkovics,          distribution. Geomorphology, 235, 118-129.
  M., Appere, T., Rodriguez, S., ... & Le Mouelic, S.      Dermott, S. F., & Sagan, C. (1995). Tidal effects of
  (2013). A transmission spectrum of Titan’s north           disconnected hydrocarbon seas on Titan. Nature,
  polar atmosphere from a specular reflection of the         374(6519), 238.
  Sun. The Astrophysical Journal, 777(2), 161.             Dhingra, R. D., Barnes, J. W., Brown, R. H., Burrati,
Barnes, J. W., Sotin, C., Soderblom, J. M., Brown, R.        B. J., Sotin, C., Nicholson, P. D., ... & Rodriguez,
  H., Hayes, A. G., Donelan, M., ... & McCord, T. B.         S. (2019). Observational evidence for summer
  (2014). Cassini/VIMS observes rough surfaces on            rainfall at Titan’s north pole. Geophysical Research
  Titan’s Punga Mare in specular reflection.                 Letters, 46(3), 1205-1212.
  Planetary science, 3(1), 3.                              Dhingra, R. D., Barnes, J. W., Heslar, M. F., Brown,
Birch, S. P. D., Hayes, A. G., Dietrich, W. E.,              R.H., Burrati, B. J., Sotin, C., Soderblom, J. M., ...
  Howard, A. D., Bristow, C. S., Malaska, M. J., ... &       & Jaumann, R. (2020). Spatio-Temporal variation
  White, O. L. (2017). Geomorphologic mapping of             of Bright Ephemeral Features on Titan’s north pole.
  titan’s polar terrains: Constraining surface               Planetary Science Journal, in press.
  processes and landscape evolution. Icarus, 282,          Edelman, N., & Jaanus, M. (1980). Stratigraphy and
  214-236.                                                   plate tectonics in the archipelago of southwestern
Bird, E. C. (2011). Coastal geomorphology: an                Finland. Geol. Foren. Stockholm Forh, 102, 187.
  introduction. John Wiley & Sons.                         Erkkila, A., & Kalliola, R. (2004). Patterns and
Breon, F. M., & Henriot, N. (2006). Spaceborne               dynamics of coastal waters in multi-temporal
  observations of ocean glint reflectance and modeling       satellite images: support to water quality
  of wave slope distributions. Journal of Geophysical        monitoring in the Archipelago Sea, Finland.
  Research: Oceans, 111(C6).                                 Estuarine, Coastal and Shelf Science, 60(2), 165-
Brown, R. H., Baines, K. H., Bellucci, G., Bibring, J.       177.
  P., Buratti, B. J., Capaccioni, F., ... & Drossart, P.   Ghafoor, N. A. L., Zarnecki, J. C., Challenor, P., &
  (2004). The Cassini visual and infrared mapping            Srokosz, M. A. (2000). Wind-driven surface waves
  spectrometer (VIMS) investigation. Space Science           on Titan. Journal of Geophysical Research: Planets,
  Reviews, 115(1-4), 111-168.                                105(E5), 12077-12091.
Brown, M. E., Smith, A. L., Chen, C., & Adamkovics,        Griffith, C. A., Hall, J. L., & Geballe, T. R. (2000).
  M. (2009). Discovery of fog at the south pole of           Detection of daily clouds on Titan. Science,
  Titan. The Astrophysical Journal Letters, 706(1),          290(5491), 509-513.
  L110.                                                    Grima, C., Mastrogiuseppe, M., Hayes, A. G., Wall, S.
Burr, D. M., Emery, J. P., Lorenz, R. D., Collins, G.        D., Lorenz, R. D., Hofgartner, J. D., ... & Cassini
  C., & Carling, P. A. (2006). Sediment transport by         RADAR Team. (2017). Surface roughness of
  liquid surficial flow: Application to Titan. Icarus,       Titan’s hydrocarbon seas. Earth and Planetary
  181(1), 235-242.                                           Science Letters, 474, 20-24.
Charnay, B., Barth, E., Rafkin, S., Narteau, C.,           Hartwig, J. W., Colozza, A., Lorenz, R. D., Oleson,
  Lebonnois, S., Rodriguez, S., ... & Lucas, A.              S., Landis, G., Schmitz, P., ... & Walsh, J. (2016).
                                                             Exploring the depths of Kraken Mare–Power,
WAVES IN TITAN’S KRAKEN MARE 23
thermal analysis, and ballast control for the Saturn Kahma, K., Pettersson, H., & Tuomi, L. (2003).
Titan submarine. Cryogenics, 74, 31-46. Scatter diagram wave statistics from the northern
Hanley, J., Groven, J. J., Grundy, W., Pearce, L. A., Baltic Sea. MERI–Report Series of the Finnish
Dustrud, S., Lindberg, G. E., & Tegler, S. C. (2018, Institute of Marine Research, 49, 15-32.
October). Characterization of Possible Two Liquid Karkoschka, E., McEwen, A., & Perry, J. (2017,
Layers in Titan Seas. In AAS/Division for October). Creating the best Global Mosaic of
Planetary Sciences Meeting Abstracts (Vol. 50). Titan’s Surface Albedo using Cassini Images. In
Harris, P. T. (1988). Sediments, bedforms and bedload AAS/Division for Planetary Sciences Meeting
transport pathways on the continental shelf adjacent Abstracts 49 (Vol. 49).
to Torres Strait, Australia—Papua New Guinea. Kay, S., Hedley, J., & Lavender, S. (2009). Sun glint
Continental Shelf Research, 8(8), 979-1003. Hayes, correction of high and low spatial resolution images
A. G., Lorenz, R. D., Donelan, M. A., Manga, M., of aquatic scenes: a review of methods for visible
Lunine, J. I., Schneider, T., ... & Tolman, H. L. and near-infrared wavelengths. Remote sensing,
(2013). Wind driven capillary-gravity waves on 1(4), 697-730.
Titan’s lakes: Hard to detect or non-existent?. Kudryavtsev, V., Yurovskaya, M., Chapron, B.,
Icarus, 225(1), 403-412. Collard, F., & Donlon, C. (2017). Sun glitter
Hayes, A. G. (2016). The lakes and seas of Titan. imagery of surface waves. Part 2: Waves
Annual Review of Earth and Planetary Sciences, transformation on ocean currents. Journal of
44, 57-83. Geophysical Research: Oceans, 122(2), 1384-1399.
Hayes, A. G., Birch, S. P. D., Dietrich, W. E., Lawrey, E (2013). Torres Strait clear sky, clear water
Howard, A. D., Kirk, R. L., Poggiali, V., ... & Landsat composite (NERP TE 13.1 eAtlas, AIMS,
Malaska, M. J. (2017). Topographic constraints on source: NASA), [datafile]. eAtlas, AIMS
the evolution and connectivity of Titan’s lacustrine [producer]. CC BY 3.0 AU [license].
basins. Geophysical Research Letters, 44(23), 11- https://eatlas.org.au/data/uuid/71c8380e-4cdc-4544-
745. 98b6-8a5c328930ad
Hayes, A. G., Lorenz, R. D., & Lunine, J. I. (2018). A Le Mouelic, S., Cornet, T., Rodriguez, S., Sotin,
post-Cassini view of Titan’s methane-based C.,Seignovert, B., Barnes, J. W., ... & Nicholson, P.
hydrologic cycle. Nature Geoscience, 11(5), 306. D. (2019). The Cassini VIMS archive of Titan:
Hemer, M. A., Harris, P. T., Coleman, R., & Hunter, From browse products to global infrared color
J. (2004). Sediment mobility due to currents and maps. Icarus, 319, 121-132.
waves in the Torres Strait–Gulf of Papua region. Lemckert, C. J., Zier, J., & Gustafson, J. (2009). Tides
Continental Shelf Research, 24(19), 2297-2316. in Torres Strait. Journal of Coastal Research, 524-
Hofgartner, J. D., Hayes, A. G., Lunine, J. I., Zebker, 528.
H., Stiles, B. W., Sotin, C., ... & Buratti, B. J. Lopes, R. M. C., Wall, S. D., Elachi, C., Birch, S. P.,
(2014). Transient features in a Titan sea. Nature Corlies, P., Coustenis, A., ... & LeGall, A. (2019).
geoscience, 7(7), 493. Titan as revealed by the Cassini radar. Space
Hofgartner, J. D., Hayes, A. G., Lunine, J. I., Zebker, Science Reviews, 215(4), 33.
H., Lorenz, R. D., Malaska, M. J., ... & Soderblom, Lorenz, R. D., Kraal, E., Asphaug, E., & Thomson, R.
J. M. (2016). Titan’s “Magic Islands”: transient E. (2003). The seas of Titan. Eos, Transactions
features in a hydrocarbon sea. Icarus, 271, 338-349. American Geophysical Union, 84(14), 125-132.
Jackson, C. (2007). Internal wave detection using the Lorenz, R. D., Kraal, E. R., Eddlemon, E. E., Cheney,
moderate resolution imaging spectroradiometer J., & Greeley, R. (2005). Sea-surface wave growth
(MODIS). Journal of Geophysical Research: under extraterrestrial atmospheres: Preliminary
Oceans, 112(C11). wind tunnel experiments with application to Mars
Job, D. (2005). Dynamics of coastal systems (Vol. and Titan. Icarus, 175(2), 556-560.
25). World Scientific. Lorenz, R. D., Tokano, T., & Newman, C. E. (2012).
Winds and tides of Ligeia Mare, with application to24 HESLAR ET AL.
the drift of the proposed time TiME (Titan Mare Martonchik, J. V., & Orton, G. S. (1994). Optical
Explorer) capsule. Planetary and Space Science, constants of liquid and solid methane. Applied
60(1), 72-85. optics, 33(36), 8306-8317.
Lorenz, R. D., & Hayes, A. G. (2012). The growth of Mitri, G., Showman, A. P., Lunine, J. I., & Lorenz, R.
wind-waves in Titan’s hydrocarbon seas. Icarus, D. (2007). Hydrocarbon lakes on Titan. Icarus,
219(1), 468-475. 186(2), 385-394.
Lorenz, R. D. (2013, September). Oceanography on Ori, G. G., Marinangeli, L., Baliva, A., Bressan, M., &
Saturn’s moon, Titan. In 2013 OCEANS-San Diego Strom, R. G. (1998). Fluid dynamics of liquids on
(pp. 1-7). IEEE. Titans surface. Planetary and space science, 46(9-
Lorenz, R. D. (2014). The flushing of Ligeia: 10), 1417-1421.
Composition variations across Titan’s seas in a Pilkey, O. H., Neal, W. J., Cooper, J. A. G., & Kelley,
simple hydrological model. Geophysical Research J. T. (2011). The world’s beaches: a global guide to
Letters, 41(16), 5764-5770. the science of the shoreline. Univ of California
Lorenz, R. D., Kirk, R. L., Hayes, A. G., Anderson, Y. Press.
Rafkin, S. C., & Barth, E. L. (2015). Environmental
Z., Lunine, J. I., Tokano, T., ... & Karatekin, O.¨
control of deep convective clouds on Titan: The
(2014). A radar map of Titan Seas: Tidal
combined effect of CAPE and wind shear on storm
dissipation and ocean mixing through the throat of
dynamics, morphology, and lifetime. Journal of
Kraken. Icarus, 237, 9-15.
Geophysical Research: Planets, 120(4), 739-759.
Lothon, M., Campistron, B., Chong, M., Couvreux, F.,
Rodriguez, S., Le Mouelic, S., Rannou, P., Sotin, C.,
Guichard, F., Rio, C., & Williams, E. (2011). Life
Brown, R. H., Barnes, J. W., ... & Clark, R. N.
cycle of a mesoscale circular gust front observed by
(2011). Titan’s cloud seasonal activity from winter
a C-band Doppler radar in West Africa. Monthly
to spring with Cassini/VIMS. Icarus, 216(1), 89-
weather review, 139(5), 1370-1388.
110.1
Lucas, A., Aharonson, O., Deledalle, C., Hayes, A. G.,
Seignovert, B., Sotin, C., Lawrence, K. J., Heslar, M.
Kirk, R., & Howington-Kraus, E. (2014). Insights
F. (2020). Mapping VIMS Specular Reflections on
into Titan’s geology and hydrology based on
Titan’s Surface During the Cassini Mission. Icarus,
enhanced image processing of Cassini RADAR
(in prep).
data. Journal of Geophysical Research: Planets,
Soderblom, J. M., Barnes, J. W., Soderblom, L. A.,
119(10), 2149-2166.
Brown, R. H., Griffith, C. A., Nicholson, P. D., ...
Lynch, D. K., & Livingston, W. C., (2001). Color and & Buratti, B. J. (2012). Modeling specular
light in nature. Cambridge University Press. reflections from hydrocarbon lakes on Titan. Icarus,
MacKenzie, S. M., Barnes, J. W., Sotin, C., 220(2), 744-751.
Soderblom, J. M., Le Mouelic, S., Rodriguez, S., ... Sotin, C., Lawrence, K. J., Reinhardt, B., Barnes, J.
& McCord, T. B. (2014). Evidence of Titan’s W., Brown, R. H., Hayes, A. G., ... & Baines, K. H.
climate history from evaporite distribution. Icarus, (2012). Observations of Titan’s Northern lakes at 5
243, 191-207. µm: Implications for the organic cycle and geology.
MacKenzie, S. M., & Barnes, J. W. (2016). Icarus, 221(2), 768-786.
Compositional similarities and distinctions between Stephan, K., Jaumann, R., Brown, R. H., Soderblom,J.
Titan’s evaporitic terrains. The Astrophysical M., Soderblom, L. A., Barnes, J. W., ... & Buratti,
Journal, 821(1), 17. B.J. (2010). Specular reflection on Titan: liquids in
Marouf, E. A., French, R. G., Wong, K., Anabtawi, Kraken Mare. Geophysical Research Letters, 37(7).
A., & Schinder, P. J. (2016, October). The Calm Stofan, E. R., Elachi, C., Lunine, J. I., Lorenz, R. D.,
Methane Northern Seas of Titan from Cassini Stiles, B., Mitchell, K. L., ... & Wall, S. (2007). The
Radio Science Observations. In AAS/Division for lakes of Titan. Nature, 445(7123), 61.
Planetary Sciences Meeting Abstracts (Vol. 48). Toffoli, A., & Bitner-Gregersen, E. M. (2017). Types
of Ocean Surface Waves, Wave Classification.You can also read